

Rapid qualitative and quantitative vital nutrient contents in high-altitude cultivated folklore herbal medicinal Costus roots using calibration-free LIBS
⁎Corresponding author at: Physics Department & IRC-Hydrogen Technologies and Carbon Management, King Fahd University of Petroleum & Minerals, Dhahran 31261, Saudi Arabia. magondal@kfupm.edu.sa (M.A. Gondal),
⁎⁎Corresponding author at: Department of Physics, Imam Abdulrahman Bin Faisal University, P.O. Box 1982, Dammam, Saudi Arabia. malmessiere@iau.edu.sa (M.A. Almessiere)
-
Received: ,
Accepted: ,
This article was originally published by Elsevier and was migrated to Scientific Scholar after the change of Publisher.
Abstract
Costus Roots (CRs) (Saussurea lappa C.B. Clark- Asteraceae family) is a medicinal herb, very frequently utilized in developing countries for treating worm (nematode) infections, asthma, cholera, digestive problems and in cosmetics products. Due to its widespread consumption in developing countries to determine the health-related essential nutrients and toxic elements is of great significance. This study is highly noteworthy for prominence of therapeutic benefits of the CR roots and public awareness about their harmful effects even for producing herbal drugs derived from its roots. In this study, a very efficient, precise and rapid laser-induced breakdown spectroscopy (LIBS) method was developed to measure the content of the dried and pelletized CRs powder samples. To the best of our knowledge, this is first time that Costus roots have been studied using calibration-free LIBS (CF-LIBS) technique. Initially, the LIBS spectrometer parameters were optimized at 608.3 nm gated-time delay, 35 mJ incident laser pulse energy, and 29 mm laser-to-sample distance (LTSD)) for precise element detection before its application to the CRs analysis. The primary focus of this study is the identification and quantification of various nutrients, such as Ca, K, Mg, Si, S, P, Fe, and Na, as well as relatively toxic elements, such as Al, Ba, Mn, Zn, Sr, B, Cu, Rb, Cr, Ni, Pb, V, and Mo, in addition to Li, Ti in this native CRs herbal medicine. The concentrations of these detected elements (Ca, K, Mg, Si, S, P, Al, Fe, Na, Ti, Ba, Mn, Zn, Sr, B, Cu, Rb, Cr, Ni, Pb, V, Mo, and Li) were successfully determined as 14424, 9511, 2031, 1559, 1450, 1465, 678, 458, 59, 48, 47, 37, 37, 27, 19, 19.6, 15, 2.6, 1.5, 1.5, 1.2, 1.0 and 0.9 mg.kg−1 respectively which was in a excellent agreement with the concentrations measured using the standard ICP-OES technique.
Keywords
CF-LIBS
Costus roots (CRs)
ICP:OES
LIBS
Nutrient
Toxic
Trace elements

1 Introduction
Saussurea lappa C.B. Clarke (syn: Saussurea costus (Falc.) Lipschitz) as a member of the Asteraceae family is a perennial and erect plant with a stem height of 1 to 2 m. Saussurea lappa (S. Lappa) indigenously belongs to the Himalayan regions in India, Pakistan, and China and grows at elevations from 2500 to 3500 m. S. Lappa known as Quist, Costus, and Kuth in Arabian countries, England, and India, respectively [Kaur et al., 2019, Nadda et al., 2020]. The elongated and rough-reticulated Costus roots (CRs) are the most medicinally used plant part and are characterized by up to 60 cm long, a long grayish-brown color, and a strong lingered scent [Kaur et al., 2019]. Other than the commercial applications (e.g., high-grade perfume and hair oils, insect-repellent agents (keeping textile fabrics protected), and incense sticks) of CRs, it is a well-known and −used folklore medicinal herb due to its therapeutic potentials, which are well attested by the indigenously holistic medical systems [Nadda et al., 2020; Rathore et al., 2021]. As a ground powder, paste, decoction, or oil, CRs are intended to treat generalized weakness, different gastrointestinal disorders (e.g., chronic gastritis and gastric ulcers), chronic skin diseases (e.g., blisters, pustular skin, wounds, and edema), kidney and liver diseases, chronic rheumatic disorders, …etc [Nadda et al., 2020; Rathore et al., 2021].
The ethnomedicinal uses of CRs can be highlighted by their content of different isolated active phytochemical constituents of CRs, including the main components sesquiterpenes and sesquiterpene lactones, which were documented to have pharmaceutical activities like anti-inflammatory [Lim et al., 2013; Jo et al., 2020], antioxidant [Abd El-Rahman et al., 2020], gastro-productive [Sutar et al., 2011; Matsuda et al., 2000], and anti-hepatotoxic [Yaeesh et al, 2010].
Laser-induced breakdown spectroscopy (LIBS) is an innovative spectroscopic technique that uses the signals emitted from the excited ionic and neutral atomic species that constitute laser-induced plasma (LIP) to disclose the elements present in test samples. The extensive adoption of the fast-response and multi-element LIBS technique can be attributed to several benefits, including simultaneous analysis, cost-effective instrument configuration, minimal sample preparation requirements, remote and in-situ detection capabilities, minimal sample destruction, and a user-friendly and straightforward setup in comparison to alternative sensitive standard techniques (e.g., inductively coupled plasma optical emission spectroscopy (ICP OES), inductively coupled plasma mass spectroscopy (ICP MS), atomic absorption spectroscopy (AAS), and x-ray fluorescence spectroscopy (XRF)) for the chemical elemental analysis that are underlined by several inherent drawbacks [Gaudiuso et al., 2010; Harmon et al., 2019; Shah et al., 2020]. LIBS has been implemented in botany-related applications for interrogating elemental composition in various plant matrices (e.g., roots, seedlings, leaves, flowers, seeds, and fruit/vegetables) from agricultural cropping [Aldakheel et al., 2023; Yu et al., 2020; Senesi et al., 2019] and medicinal scripts [Kabir et al., 2022].
In medical geochemistry, there are three categories of chemical elements: macro elements (MEs), trace elements (TEs), and ultra-trace elements (UTEs). The first category comprises all “essential and structural (due to their vital role in the development of tissues and organs)” elements (such as O, C, H, N, Ca, P, K, Na, S, Cl, and Mg) present in human bodies with high concentrations exceeding 100 ppm. The concentrations of the chemical elements belonging to the second category (such as Fe, Zn, F, Sr, Mo, Cu, Br, Si, Cs, I, Mn, Al, Pb, Cd, B, and Rb) are low and vary from 100 × 10−3 to 100 ppm. Conversely, the chemical elements of the third group, which includes Se, Co, V, Cr, As, Ni, Li, Ba, Ti, Ag, Sn, Be, Ga, Ge, Hg, Sc, Zr, Bi, Sb, U, Th, and Rh, have concentrations below 100 × 10−4 ppm in human bodies. Various TEs or UTEs like Fe, Zn, Cu, Se, Cr, Co, I, Mn, and Mo are considered “essential” as they constitute the enzymes, catalysts, or other trace bioactive compounds, while others are deemed “provisionally essential” like As, B, Br, F, Li, Ni, Si, and V. Toxic or potentially toxic TEs or UTEs (e.g., Al, Cd, Pb, Hg, Be, Ba, Bi, Tl, Ag, Au, Ge, Rb, Ti, U, Sn, Zr, … etc.), which have no biological functions, can cause various intoxicant pathological conditions (toxicopathies). If the concentrations of all TEs/UTEs exceed a certain limit, they can impose serious health-related problems [Awadh et al., 2023].
Heavy metals (HMs) are sort of essential and non-essential TEs/UTEs that have a large atomic number (≥20) and a higher density (≥5 g/cm3) than water like Ti, V, Cr, Mn, Fe, Co, Ni, Cu, Zn, As, Mo, Ag, Cd, Pb, Sn, Pt, Au, Hg, and Al. some of the Metalloid (e.g., As and Se) and light (Li) elements are considered HMs as they are toxic [Briffa et al., 2020]. HMs can cause potentially adverse effects on human health (e.g., immune system disorders, nervous system disorders, gastrointestinal distress or diseases, heart and vascular diseases, kidney and liver injuries, … etc.) due to the generation of free radicals that induce oxidative stress, disorders in the metabolic cycles/pathways, and changes in the genetic molecule function (Briffa et al., 2020; Abd Elnabi et al., 2023; Ceramella et al., 2024). These effects are contingent upon long-term or elevated levels of exposure through inhalation, ingestion mechanism, and dermal contact. Various geological and anthropogenic activities are sources of HMs in soil and water [Briffa et al., 2020; Alengebawy et al., 2021; Abd Elnabi et al., 2023; Ceramella et al., 2024]. Thus, the accumulation of heavy metals in agricultural soils is perhaps the reason for the contamination by heavy metals of various consumed food crops (such as vegetables, fruits, tubers, grains, and legumes) or medicinal herbs. V, Cr, Co, Ni, and Cu heavy elements were detected using the elemental analytical ICP MS technique in the agricultural soils of Kafr El-Zayat city, which is one of the major agricultural and industrial cities, in Egypt, in higher concentrations with values of 162.8, 113.3, 42.2, 88.1, and 70.6 μg/g, respectively, compared to the average worldwide background concentrations and exceeded the Canadian soil quality guidelines [Shaheen et al., 2021]. The same group [Shaheen et al., 2022] used another analytical technique ICP OES for the detection of heavy metals in Kafr El-Zayat agricultural soils. V, Cr, Co, Cu, Zn, and Sr were found in higher concentrations 117, 111, 19.8, 47.2, 215, and 449, respectively, than the reference values. Due to irrigation water contamination, only root samples of two crops (lettuce and clover) in one site (out of five) in Banha and Giza Governorates in Egypt had high Zn and Mn concentrations by using elemental analytic FAAS technique, 139.8 and 118.1 mg.kg−1, respectively, compared to the permissible levels in plants. Also, only sites three and five had high Ni in lettuce 307 mg.kg−1 and clover 494 mg.kg−1 roots, respectively. Cu measurement is high in all sites for the two crops. However, the measurements for the other elements Pb, Cd, and Cr were not high in all sites. Nevertheless, the measurements for lettuce and clover-associated soils reflected similar results, except for Ni and Cd which were high in all sites for the two crops [Fayek et al., 2023]. It was reported that the bioaccumulation of the heavy metal constituents in the above-ground plant parts was highly constrained by the absorptive capacity of roots [Soriano-Disla et al., 2014]. Therefore, the determination of the heavy metals in roots is indicative of these inorganic chemical analytes (elements) being bioavailable in soil and transferred to the above-ground plant parts, thereby enabling the limitation and/or at least expectation of their flora concentrations. In this regard, it is of great interest to qualify and quantify the elemental composition of the roots part of plants with medicinal value by exploring their nutritional and toxicological status. The consolidated standard addition and internal standard method–laser-induced breakdown spectroscopy (SAIS-LIBS) technology was utilized to determine the trace elements Cu and Mn concentrations in licorice root powder [Zhu et al., 2021]. The content ratio was determined by the calibration-free laser-induced breakdown spectroscopy (CF-LIBS) quantitative method of most abundant elements (Mg/Ca) in Codonopsis pilosul roots from 9 Chinese habitats [Wang et al., 2018]. The concentrations of Mg, K, Ca, B, Zn, and Fe elements were estimated using univariate- and −multivariate analyses using LIBS spectra of Panax notoginseng (PN) roots from 8 regions in a Chinese province [Shen et al., 2019]. LIBS analysis of Rhatany roots (RRs) [Aldakheel et al., 2021] disclosed the content of different essential/conditionally-essential (Mg, K Ca, S, Si, Fe, Na, P, B, Cu, Zn, and Se), and toxic (Al, Ba, Mn, Pb, and Cd) elemental analytes. The concentrations of Al, Ba, Mn, Pb, and Cd elements in RRs were 621, 97, 23, 6.5, and 7.2 mg.kg−1, and they were found to exceed the daily tolerable intake for humans. LIBS had been used to identify the turmeric powder that is free from toxic elements/compounds [Kumar et al, 2022]. Six turmeric powder samples (S1, S2, S3, S4, and S5) were quantitively analyzed using CF-LIBS method. The results showed that S6 sample is more natural and safer to human health than other commercial samples as it does not contain Pb and Cr and least amounts of Ba and Sr compared to other samples, whereas S2 and S5 samples contain the highest amounts of toxic elements Pb, Cr, Ba, and Sr.
In addition, CRs are in high global demand, but they grow in restricted landholdings, have a long cultivating cycle, and harvest with complete uprooting [Nadda et al., 2020]. Thereupon, CRs become endangered species, so unrestrictedly overexploited, commercially cultivated in regions that differ from where they naturally grow at high scale and economically adulterated [Zahara et al., 2014; Rathore et al., 2021]. From this point of view, the toxicity and safety status of the CRs ethnomedicine needs to be evidenced on a scientific basis to verify their therapeutic purposes for the indigenous population's use and pharmaceuticals industry [Nadda et al., 2020]. Therefore, it is very important to determine the nutritional or toxicological grade of CRs in terms of their analytic elemental content from the perspective of ensuring the therapeutic potential and the safety from artifact contamination (e.g., trace metal(s)/element(s)). In this respect, LIBS, as a fast, facile, and reliable analytical technique, was herein used to detect the dried CRs’ content of the analytic elements and determine their concentrations with the CF-LIBS quantitative analysis method. Then, the obtained results were contrasted for confirmation to reference values provided by a standard analytical ICP OES technique. Before the qualitative and quantitative analyses, the beam-scanning LIBS system was optimized for various experimental setup parameters and the occurrence of Local Thermodynamic Equilibrium (LTE) was confirmed by monitoring plasma parameters such as electron density and plasma temperature. CF-LIBS technique offers numerous benefits, including real-time, in-situ, on-site, single-point, and multi-element analysis with nearly no sample loss and little sample preparation.
2 Materials and methods
2.1 The self-assembled LIBS instrumental set-up
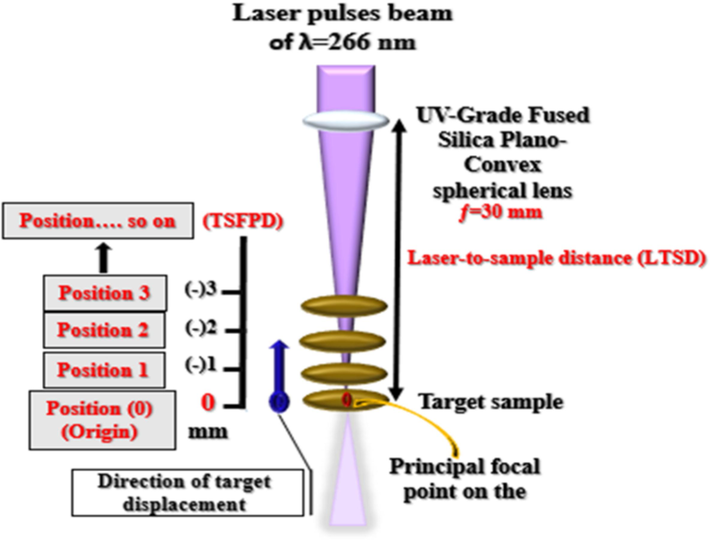
LIBS explores the elemental composition of dried and pelletized CRs samples. The elemental analytical interrogation by our self-assembled LIBS set-up, as presented in Fig. 1, is carried out in the air-atmosphere using laser pulses with a constant 20.00 Hz (Hz) repetition frequency (each with maximum energy of 50.00 milliJoule (mJ) and 8.00 ns (ns) duration) created at 266.00 nm by Q-switched Nd: YAG laser (model: QUV-266-5, Big Sky Laser/Ultra Quantel laser manufactures). Some operational variables were adjusted for the LIBS system, like 20 accumulations of laser pulses and 2.20 microseconds (µs) gate width during LIBS spectro-chemical measurements to get a better signal-to-noise ratio, i.e., the maximum line intensity yield versus a low background around the spectral lines, which emit at a specific lifetime with a transition probability. A background correction was performed for all the recorded LIBS spectra, so the net spectra were utilized for the prospective parameter optimization studies and qualitative and quantitative analyses.
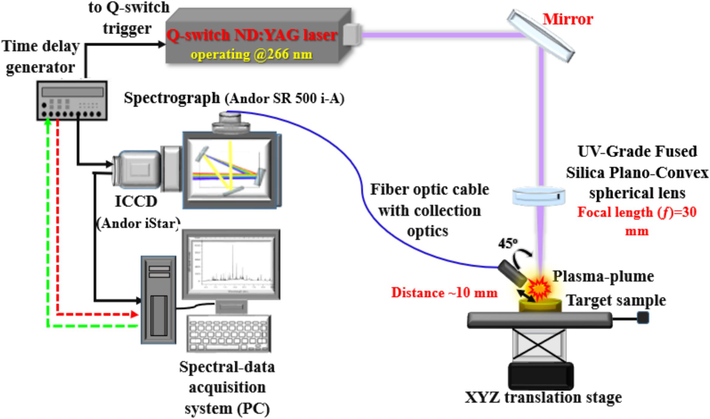
- Schematic design of the single-shot configuration optical system for LIBS spectrum acquisition.
This system incorporated a 0.50 m Czerny-Turner spectrograph (Andor Shamrock SR 500i-A) of a motorized triple grating turret of high-resolution grating 0.06 nm at the blaze wavelength 500 nm with a grating groove density of 1200 lines/mm that is sufficiently enough to provide well-resolved atomic and ionic spectral lines over a response wavelength range from 240.00 to 870.00 nm. The spectrograph is equipped with a time-gated intensified charge-coupled device (ICCD) camera (Andor’s iStar DH320T series). The effective active area of the CCD camera unit is 18.00 × 6.70 mm, with active 690 × 255 pixels and 26.00 µm pixel size. SOLIS 64-bit software is specified for Andor's time-resolved CCD camera and spectrograph control and LIBS spectra acquisition. A detailed overview of the utilized self-made LIBS system with a schematic diagram was provided in the published manuscripts by our group [Gondal, et al., 2014; Alhasmi et al., 2015; Gondal et al., 2015; Mehder et al., 2016].
2.2 Sampling procedure for LIBS analysis
Dried CRs samples (of Indian origin) were obtained from a well-known local herbal shop. As proposed in literature, all herb samples were sun-dried at a maximum of 40 degrees Celsius (°C) at the atmospheric pressure for 6–7 days to get rid of the moisture that deteriorates the final results. CRs were directly and thoroughly cleansed by soft cotton wool from any adhered dirt particles. That was to avoid any spectral interference with the spectral fingerprints of elemental constituents in CRs. For improving analyte micro-homogeneity and obtaining a uniform sample surface, in turn, enhancing LIBS emission signals and their reproducibility/stability [da Silva Gomes et al., 2011], ground and powdered dry CRs, as shown in Fig. 2, by Knife mill (RetschTM @ Knife Mill GRINDOMIX GM 300) under some selected settings (final fineness < 300 µm (µm),; grinding speed: 3000 inverse minutes (min−1); grinding time: 2 min) were sieved with 250 µm stainless-steel mesh screen (Fisherbrand™ @ 200 µm (mm) diameter (Dia). x 25 mm height (H), pore sizes 250 µm, ISO 3310/1) for further ascertaining the sample's particle size being ≤ 250 µm. A weighted 1 g of the powdered samples was then properly pressed for about 2 min under 10 Ton pressure into a thin cylindrical pellet (13 mm Dia. ×4 mm H) with an evenness surface by the 15 Ton hydraulic KBr pellet press (Zhengzhou TCH Instrument Co., Ltd. @ PC-15). No binder substances were added to the powdered-form samples throughout the pelletizing process as the pellets were hard enough to endure the thrust induced by the pulsed laser irradiation. Fig. 2 describes all the stated preparation of the CR samples for the LIBS elemental analysis. The same procedure was repeated for the fabrication of several herb pellets to perform different LIBS measurements. Finally, pellets were kept in a desiccator to avoid dust contamination and air moisture before conducting the spectrochemical analyses.
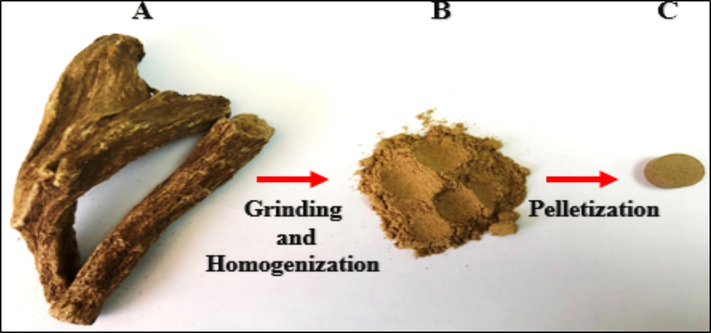
- Preparing of dried CRs samples for LIBS analysis, a) dried bulk-roots, b) root powder, and c) root pellet.
2.3 Microwave-assisted digestion of CRs for inductively coupled plasma investigation
About 200 mg of dried CRs were digested using a microwave oven (Milestone Inc., Italy) for the quantitative analysis by the ICP OES (Agilent's 5110 Vertical Dual View (VDV) ICP OES) using the US EPA method 6010C (SW-846) of the elemental analytes Ca, K, Mg, Si, S, P, Al, Fe, Na, Ti, Ba, Mn, Zn, Sr, B, Cu, Rb, Cr, Ni, Pb, V, Mo, and Li. The optimal operational parameters were determined for the Agilent 5110 ICP-OES instrument (such as 1200 Watts (RF generator power), 27.00 MHz (MHz) (RF generator frequency), 15.00 L/min (plasma argon gas flow rate), 0.9/1.03 L/min (auxiliary/nebulizer argon gas flow rates), 0.4 ml (mL)/min sample flow rate, and 45.00 s (sample uptake delay)). The spectral lines used were Ca (317.93 nm), K (766.49 nm), Mg (279.80 nm), S (180.66 nm), P (213.61 nm), Na (588.99 nm), Al (396.15 nm), Si (251.61 nm), Fe (238.20 nm), Sr (216.59 nm), B (249.77 nm), Ba (455.40 nm), Mn (257.61 nm), Ti (337.28 nm), Zn (206.20 nm), Cr (267.71 nm), Rb (780.02 nm), Cu (324.75 nm, Ni (231.60 nm), Pb (182.14 nm), V (292.40 nm), Mo (202.03 nm), and Li (460.28 or 670.78 nm). This step was preceded by special preparation of the sample following the microwave (MW)-assisted acid digestion method (EPA3052B) and using the closed UltraWave Single Reaction Chamber (SRC) of the Microwave Acid Digestion System (Milestone Inc., Italy). In duplicate, the acid digestion of the weighted ground CRs done by the addition of 5 mL of nitric acid (AR, 69–72 %, Sigma Aldrich Co., St.Louis, Mo, USA) and 1 mL of hydrogen peroxide (30 % w/v stabilized ACS, VWR Chemicals BDH®., San Francisco, CA), respectively, and the mixture was directly heated according to specified programs described in our earlier publications [Aldakheel et al., 2021; Aldakheel et al., 2022]. The resultant cooling to 15 min followed by the dilution to a final volume of 20 mL with 1.00 % HNO3 deionized (DI) ultrapure water, so then the aqueous solution in properly labeled polypropylene (PP) sterile volumetric tubes be ready for the elemental analysis using the ICP OES technique. This dilution was carried out to analyze Na, Ca, Mg, K, Si, S, P, and Al elements, while further dilution was done by taking 1 ml from the 20 mL solution and adding 19.50 mL 1 % HNO3 DI water for analyzing Li, Ba, Sr, B, Pb, Zn, Cu, Mn, Ti, Ni, V, Cr, Mo, Rb, and Fe elements. Blank digest samples were prepared in the same way. The calibration curves for the quantitative analysis of the aqueous (aq.) solution of the dried CRs powder were built via ICP Expert v7 software. For that purpose, the calibration standards were prepared by serial dilution of 1 mL from 1000 ppm primary standards containing the element of interest, to 100 ppm, 10 ppm, 1 ppm, and 0.10 ppm by pure distilled, de-ionized water with 1.00 % analytical reagent grade HNO3. The 1000 ppm multielement standard (Ref. Name: IV-STOCK-4-125ML, 5 % v/v HNO3 matrix, inorganic venturesTM of Christiansburg, Virginia, USA) of 23 elements (Ca, K, Ba, B, Cr, Cu, In, Pb, Mn, Ag, Sr, Zn, Mg, Al, Bi, Cd, Co, Ga, Fe, Li, Ni, Na, and Tl) was used altogether with a set of 1000 ppm single element standards (125 mL, < 5 % v/v HNO3 matrix, inorganic venturesTM of Christiansburg, Virginia, USA) for other elements like S, P, and Si (major elements in plants) or Ti. For analyzing elements with lower concentrations in the studied herbs of <50.00 ppm, the 100 ppm multielement standard solution (Ref. Num. M8A96.K1.5 N.L1, 5 % v/v HNO3 matrix, CPAChem Ltd., Bogomilovo, Bulgaria) of 33 elements (Al, Ag, As, B, Ba, Be, Bi, Ca, Cd, Cs, Co, Cr, Cu, Fe, In, K, Li, Mg, Mn, Mo, Na, Ni, Nb, Pb, Rb, Sb, Se, Sr, Ti, Tl, V, U, Zn) was used.
3 Results and discussion
3.1 Optimization of some operational parameters pulsed LIBS system
The micro-analytical performance of the LIBS technique, which is utilized to determine the elemental composition of a test sample is significantly impacted by the operational parameters of the laboratory nanosecond (ns)-LIBS system (e.g., the gated time delay, lens-to-sample distance (LTSD), and incident laser pulse energy), which in turn affect the LIP characteristics [Sirven et al., 2008]. The time window optimization, i.e., the appropriate selection of the gated time delay between the triggering of the flashlamp and laser Q-switch and the opening of ICCD camera-shutter becomes an ordinary procedure before conducting the LIBS analyses wherein the LIP is of transient behavior. It was carried out to reduce the high probability of non-fulfilling the LTE criteria by avoiding the strong continuum emissions at the early stage of LIBS plasma evolution and self-absorption at the late cooling stages where weak atomic emission signals appear [Stavropoulos et al., 2004]. Optimization of the laser pulse energy is introduced to approach the LTE regime for the generated LIP that could not be reached with the inability to detect emission signals and the appearance of self-absorption and plasma shielding effects when the laser fluences/irradiances are below and much higher than the plasma threshold, respectively [Gondal et al., 2006; Santos et al., 2009; Rehan et al., 2019]. The focusing lens-to-sample distance (LTSD) (or the distance between the target surface and focusing point (DTSFP)) is also optimized to avoid several factors unpropitiously influencing the laser energy transport in plasma, most evidently at the focal point of the lens [de Carvalho et al., 2010; Wang et al., 2017; Wang et al., 2018; Guo et al., 2020].
The gated time delay, i.e., at which time acquiring of spectral data starts after the laser irradiance terminates has to be optimized as a part of the parametric studies before the quantitative and qualitative analysis of the CRs. That optimization is for achieving higher SBR (i.e., the lesser contribution of the background (or continuum) emissions that is mainly produced from the bremsstrahlung process) and lesser probability of line interfering [Santos et al., 2009] at the pre-determined optimum pulse energy of 35 mJ and LTSD of 29 mm. It was optimized by maintaining a fixed time delay width of 50 ns while adjusting it, as illustrated in Fig. 3 (a and b), in the range 470–770 ns. It was observed that the curve representing the emission intensities of Ca I and Mg I lines elevated with a continuous decrease in the continuum emissions. Then, it decayed after the gate time delay of 625.5 ns and 591.1 ns, respectively, resulting from the expansive plasma cooling accompanying a rapid decrease of the continuum. Therefore, to resolve a maximum in the temporal evolution of the emission signal intensities of the spectral lines belonging to atomic species Ca and Mg peaked at 422.60 and 285.20 nm, the optimum gated time delays of 625.50 ns and 591.10 ns, respectively, were then practically used. For the following analytic LIBS experimentations on the CRs to get the requisite LIBS power, the gated time delay was adjusted at the average value of 608.30 ns.
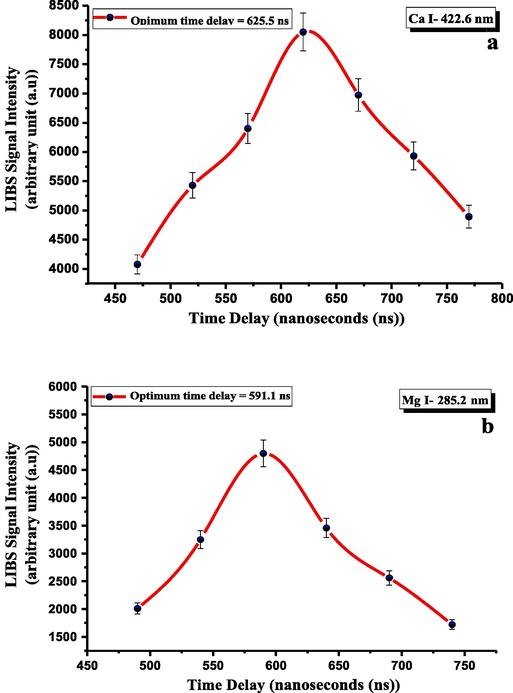
- LIBS signal dependence on time delay for the CRs for (a) Ca and (b) Mg lines at fingerprint wavelengths 422.6 and 285.2 nm, respectively.
It was crucial to adjust the best optimal laser energy for detecting the elements of interest in CRs using the LIBS technique. The efficient tool for optimizing this parameter is by monitoring the laser energies from 15.00 to 43.00 mJ/ pulse, as shown in Fig. 4, and adjusting the gated time delay at 608.3 ns and the LTSD at 29.00 mm, utilizing the ablation spot size (in diameter) of 412 µm, the laser irradiance on the pelletized CRs pellet was also calculated and presented. The influence of laser energy was studied for the spectral lines Ca I (422.60 nm) and Mg I (285.20 nm) and shown in Fig. 4 (a and b). Up to a specific point, the higher the laser pulse energy, the higher in a linear manner the ablation rate and mass of the sample material, and the higher the number of the vaporized atomic species and then charged electrons species (i.e., larger plasma volume) [Sirven et al., 2008]. The more generation of electrons, the more absorption by irradiating photons, and hence temperature increase [Peng et al., 2018]. Thence, a synchronic linear increase in the emission intensity of these two transition lines with the pulse energy was observed, presenting the correlation coefficient (R2) values of ≥0.97 of the linear data fitting. It pointed out a monotonous increase in the emission intensities of the spectral lines Ca I (422.60 nm) and Mg I (285.20 nm) till up to 35.00 mJ/pulse, which was followed by a saturation non-linearity trend. That manifested level-up in signal intensity is attributed to the plasma shielding and self-absorption effects [de Carvalho et al., 2012; Mehder et al., 2016; Singh and Thakur, 2020]. It reflects no notable increase in the ablation mass or rate; however, probably a continued rise in the emission intensities of some transition lines indicates occurrences of the re-excitation events in the plasma by the intensifying energy of the tailing pulse edge. Therefore, a laser pulse energy chosen under optimum operational conditions was 35 mJ for the LIBS experimental setup proposed to assess the elemental composition of the CRs samples.
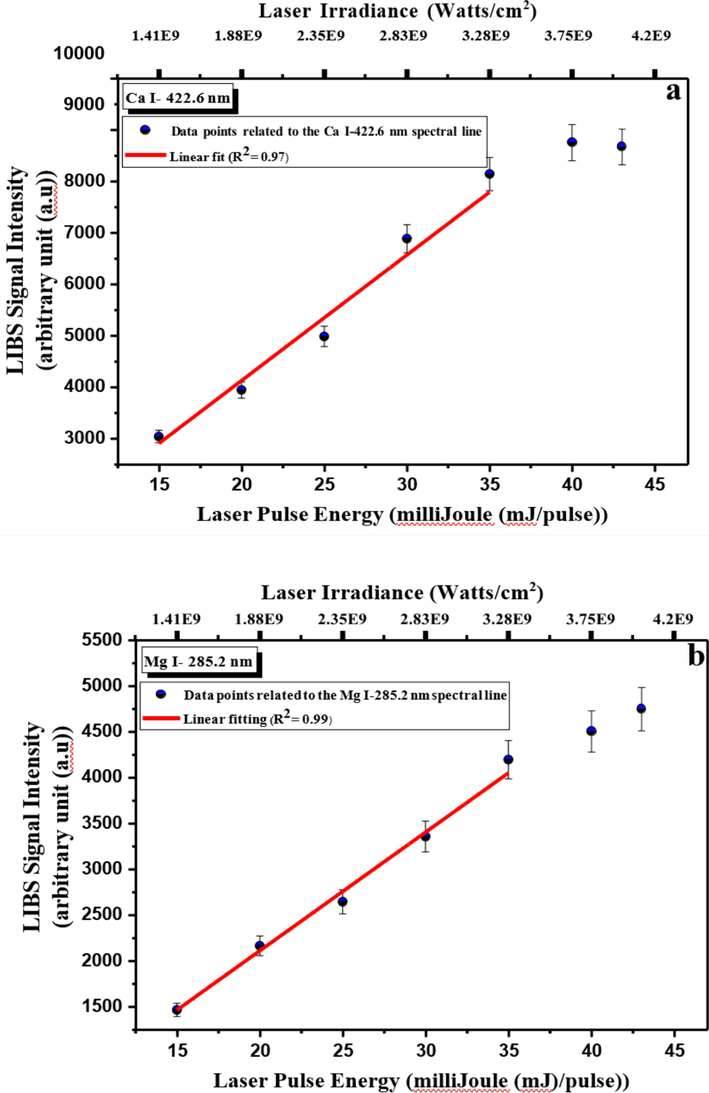
- LIBS signal intensity dependence on laser pulse energy optimization for the CRs using (a) Ca I and (b) Mg I emission lines at fingerprint wavelengths 422.6 and 285.2 nm. R2 is the correlation coefficient.
The influence of varying the LTSD (or DTSFP) in the range of 35–22 mm (or 0 − (−) 13 mm) on the emission intensity of the neutral Ca line (peaked at 422.60 nm) was investigated for the CRs, as can be seen in Fig. 5. That influence was evaluated with different output energies of the pulsed laser 20, 25, 30, and 35 mJ/pulse, but the time delay kept at the preceded optimized value (608.30 ns). Fig. 6 illustrates the operative procedure for the optimization of the LTSD (or DTSFP) for better analytical purposes of the LIP generated on the pelletized powdered medicinal herbs surface. According to Fig. 5, the studied DTSFPs had chosen to be between 0 (i.e., the position of the lens focal point) and −13 mm (equal to LTSD of 22 mm) by translating the targeted pellet backward to the lens in 1 mm steps. If the targeted pellet was situated in the lens focal point (i.e., the DTSFP=0), represented by position 0 and wherein the high laser irradiances were produced, the emission intensity of the Ca 422.60 nm line decreased due to several factors like the plasma-plume over-heating, losses in the plasma output energy by the lateral plume expansion, opacity impacts… etc. Therefore, it was not considered an optimum position for obtaining the maximal intensity [de Carvalho et al., 2010; Guo et al., 2020; Wang et al., 2017; Wang et al., 2018]. The correlation between the intensity of the LIBS emission signals and the TSFPD, as shown in Fig. 5, was the same for the laser energies under investigation. As LTSD increased (but considering being < 35 mm), i.e., the beam spot size decreased; but, the ablative laser irradiance increased, and the signal intensity of the Ca I line increased due to better laser-driven-material coupling, reaching a maximal intensity value. Nevertheless, by the continual increase of the LTSD, an intensity decline was observed due to the plasma shielding effect [Guo et al., 2020; Wang et al., 2017; Wang et al., 2018; Wang et al, 2020].
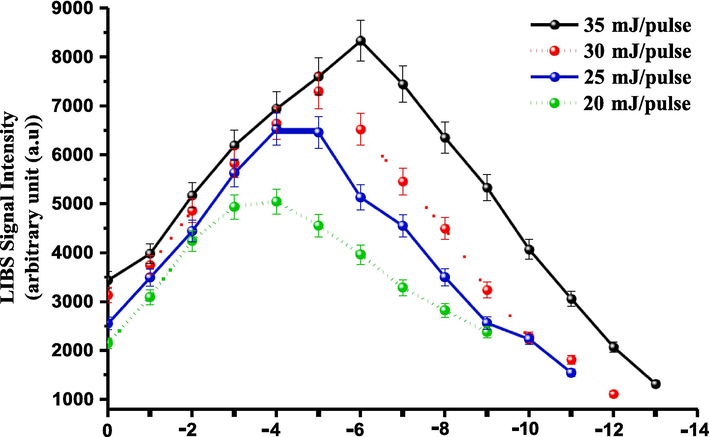
- The LIBS signal intensity dependence on the distance between the target surface and focal point (TSFPD) for analyzing CRs samples using the Ca I emission line peaked at wavelength 422.6 nm.
- A schematic diagram for optimizing the distance between the target surface and focal point (TSFPD) for elemental analysis of ns, UV-266 nm laser-induced plasma of the studied medicinal herbs in this work.
The depictions of the spectral trend of the optical emission Ca I peak with the TSFPD were illustrated in Fig. 5 when the 266 nm-UV Q-switched Nd:YAG laser applied different pulse energies. With a higher irradiated laser energy of 35 mJ, as shown in Fig. 5, a stronger emission of the Ca line obtained at a larger DTSFP (or smaller LTSD) of −6 mm, followed by the emission obtained at TSFPD of −5.00 mm at the laser energy 30 mJ. Nonetheless, the weaker emission of the Ca line was discernible at TSFPD of −4 mm (close to the lens focal point) when irradiating the pelletized CRs with a lower laser energy of 20 mJ [Guo et al., 2020; Wang et al., 2017; Wang et al., 2018]. The emission peak position of 29 mm, when irradiating pellets with the laser of 35 mJ/pulse, was denoted as an optimum LTSD value for our spectrochemical study on the studied CRs sample. The differing positions of the maximal emission Ca I peak are portrayed by changing the laser output energy can be explained by the different plasma-plume morphologies and their related plasma absorption of the tailing edge of the ns-laser pulse [Li et al., 2013; Wang et al., 2017; Wang et al., 2018].
3.2 Evaluation of T and Ne plasma parameters characterizing the laser induced plasma for LTE regime verification for accurate analysis
By determining the electron number density (Ne) and the excitation temperature (T), the thermodynamic parameters were assessed to verify the local thermodynamic equilibrium (LTE) for the LIP that had formed on the target surface. This enabled the most accurate qualitative and quantitative elemental analysis of the target material through the utilization of LIBS technology [El Sherbini and Al Aamer, 2012]. Indeed, the LIP must be optically thin (i.e., freed from self-absorption) in the local thermodynamic equilibrium (LTE) regime. Otherwise, the spectral line profile is disfigured, i.e., its peak intensity and width are increased and decreased, respectively, leading to inaccurate analyses of the samples' materials [Aragón and Aguilera, 2008; Cristoforetti et al., 2010; Jiajia et al., 2019]. The collisional (via charged particles (mainly electrons)) processes in the LIP must prevail over the radiative processes to approach the LTE state; thereby, higher Ne becomes a prerequisite [Cristoforetti et al., 2010]. Indeed, the McWhirter criterion [Aragón and Aguilera, 2008; Cristoforetti et al., 2010; Hanif et al., 2011; Zhang et al., 2014] was needed to determine the minimum electron number density (threshold value) for the validity of the LTE assumption for the plasma of CRs.
The estimation of one of the characteristic and physical parameters of the LIP, the excitation temperature (T), is required via the spectroscopic Boltzmann linear plot method [Aragón and Aguilera, 2008; Gondal et al., 2012; Hanif et al., 2011; Zhang et al., 2014] to acquire the McWhirter criterion. Different neutral atomic or ionic emission lines of an element analyte, which follows well-defined criteria [Cremers and Radziemski, 2013; Zhang et al., 2014], are needed to draw the Boltzmann linear plot to obtain precise results for the T estimation. For instance, the chosen transition should be non-resonant, i.e., having the highest possible low-energy levels to ascertain as low as possible to be absorbed and non-saturated even at the highest applied laser fluence/irradiance. In addition, the transition lines should be strong/sharp, and their excited state energies should be separated as large as possible. Therefore, it is presumable to describe the plasma is optically thin for such transitions. CRs were rich in the essential Ca element and various spectral lines were identified in a broad spectral range. Therefore, neutral atomic Ca spectral lines (Ca I) that are intense, non-resonant, well-resolved, and isolated (i.e., interference-free) with wavelengths 335.0, 445.5, 452.6, 518.8, 526.5, 558.1, 559.0, 559.8, 610.2, and 616.9 nm utilized for the T estimation. The spectroscopic data of these Ca I lines, the λki (nm), transition configuration, gk, Aik x108 inverse second (s−1), and Ek electron-volt (eV), were extracted from the National Institute of Standards and Technology (NIST) database [Kramida et al., 2023] and Lide book [Lide, 2004], and represented in Table 1. The listed uncertainty of the transition probability Aik for most utilized lines in Table 1 was between 10 to 50 % [Lide, 2004]. From the slope of a linear fitted line of data points relating to these spectral lines (see Fig. 7), the excitation temperature, T, can be deduced for the CRs, giving 7615 ± 570 K (K). Accounting for the uncertainty in determining the signal intensities and the Aiks were through the calculation of ± T-uncertainty by a mathematical expression [Dong et al., 2012] using the two transitions with wavelengths 335.0 nm (correspondent to the highest employed Ek value) and 610.2 nm (correspondent to the lowest employed Ek values) in Table 1. The high R2, i.e., the statistical inference appraisal of how well, the fitted regression line approximates the experimental data point, of 0.98 conducted an excellent linear fitting of the points used in the representation. This indicates a validation of the LTE state to the plasma formed on the surface of the pelletized for the CRs when several operational parameters already optimized. The Boltzmann plot was also drawn (see Fig. 7) for the non-resonant and well-isolated neutral atomic Fe transition lines (Fe I) detected in the LIBS spectra of the CRs and peaked at 258.4, 273.3, 278.8, 344.3,374.5, 374.8, 406.3, and 432.5 nm for further confirmation of the derived T from the Ca I spectral lines. Table 1 represents the spectroscopic details retrieved from the NIST database [Kramida et al., 2023] of the λki, gk, Aik, and Ek of the Fe I spectral lines characterizing with Aik uncertainty of 10 or 25 % [Lide, 2004].
| Wavelength (nm) | Signal Intensity | Configurations | Statistical weight |
Transition probability Aik ×10 8 (s−1) |
Uncertainty (ΔA (%)) of Aik | Energy of the upper level | ||
|---|---|---|---|---|---|---|---|---|
| gi | gk | Ei (eV) | Ek (eV) | |||||
| 335.0 | 1563 |
3p6 4s4p 3Po1
|
3 | 5 | 0.178 | 10 | 1.885 | 5.585 |
| 445.5 | 5034 |
3p6 4s4p 3Po2
|
5 | 5 | 0.2 | 50 | 1.898 | 4.681 |
| 452.6 | 2176 |
3p63d4s 1D2
|
5 | 3 | 0.41 | 25 | 2.709 | 5.447 |
| 518.8 | 4374 |
3p64s4p 1Po1
|
3 | 5 | 0.4 | 50 | 2.932 | 5.321 |
| 526.5 | 4636 |
3p63d4s 3D2
|
5 | 3 | 0.44 | 25 | 2.532 | 4.877 |
| 558.1 | 1826 |
3p6 3d4s 3D2
|
5 | 7 | 0.06 | 25 | 2.523 | 4.743 |
| 559.0 | 1977 |
3p6 3d4s 3D1
|
3 | 5 | 0.083 | 10 | 2.521 | 4.739 |
| 559.8 | 4511 |
3p6 3d4s 3D1
|
3 | 3 | 0.43 | 25 | 2.521 | 4.735 |
| 610.2 | 4261 |
3p6 4s4p 3Po0
|
1 | 3 | 0.096 | 10 | 1.879 | 3.91 |
| 616.9 | 4841 |
3p6 3d4s 3D3
|
7 | 5 | 0.19 | 25 | 2.525 | 4.535 |
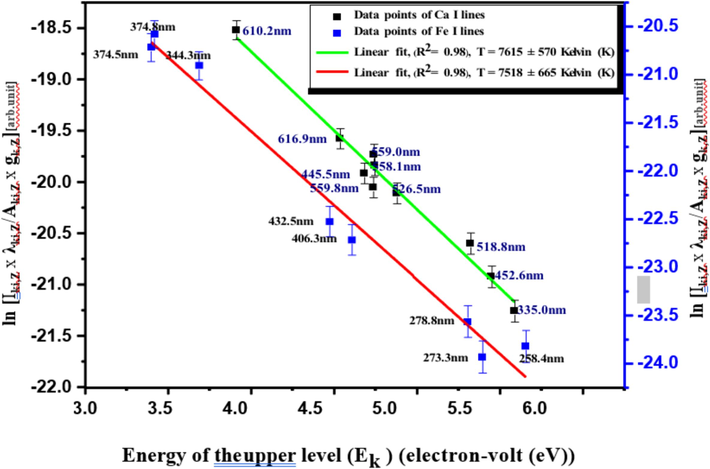
- Boltzmann plot for plasma temperature (T) estimation using multiple LIBS spectral lines neutral lines of Fe and Ca present in the CRs samples. R2 is the correlation coefficient.
Stark effects contribute among the large-scale turbulences to the spectral linewidths (e.g., Doppler or even other pressure effects) in low T and high Ne (ca. 1014 ––1018 cm−3) LIP [Harilal et al., 1997; Palomares et al., 2012]. Thus, the Stark-broadening scheme [Griem, 1974; Gondal et al., 2012; Hanif et al., 201; Palomares et al., 2012; Zhang et al., 2014] was used to identify the electron-number density (Ne) of the investigated LIP generated on the surface of the pelletized CRs. It utilizes the full-width at half maximum (FWHM) of a Lorentzian-fitted, non-hydrogenic spectral line of a neutral atom considering only the excited energy-level perturbations assignable to the fast free electrons (not by the slow-moving singly-ionized (I) [single electron removed] atoms) [Cremers and Radziemski, 2013]. The experimental Ne value should be higher than the threshold value to verify the LTE conditions for analyzing spectral data from the LIP of CRs [Aragon et al., 2001].
By fitting the experimental data points of the Stark-broadened line profile of the Ca I peak centered at 610.2 nm wavelength of 3p6 4s4p 3Po0
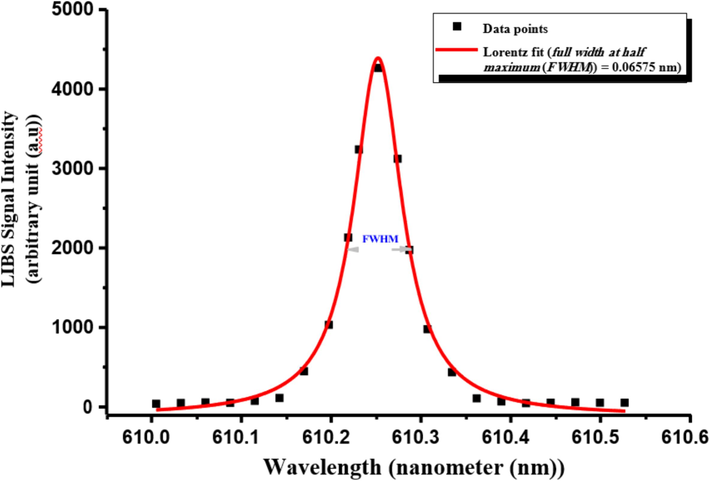
- Stark-broadened Lorentzian-fitted profile of Ca I spectral line at 610.2 nm corresponding to the transition configuration of (3p6 4s4p 3Po0 → 3p6 4s5s 3S1) for CRs.
3.3 Qualitative LIBS analysis of CRs
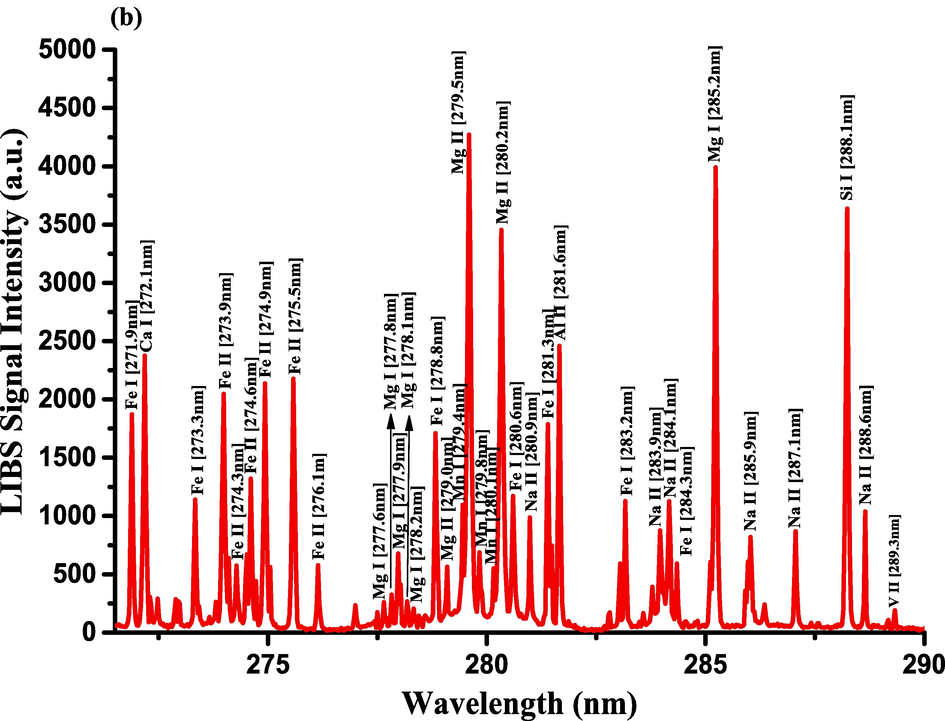
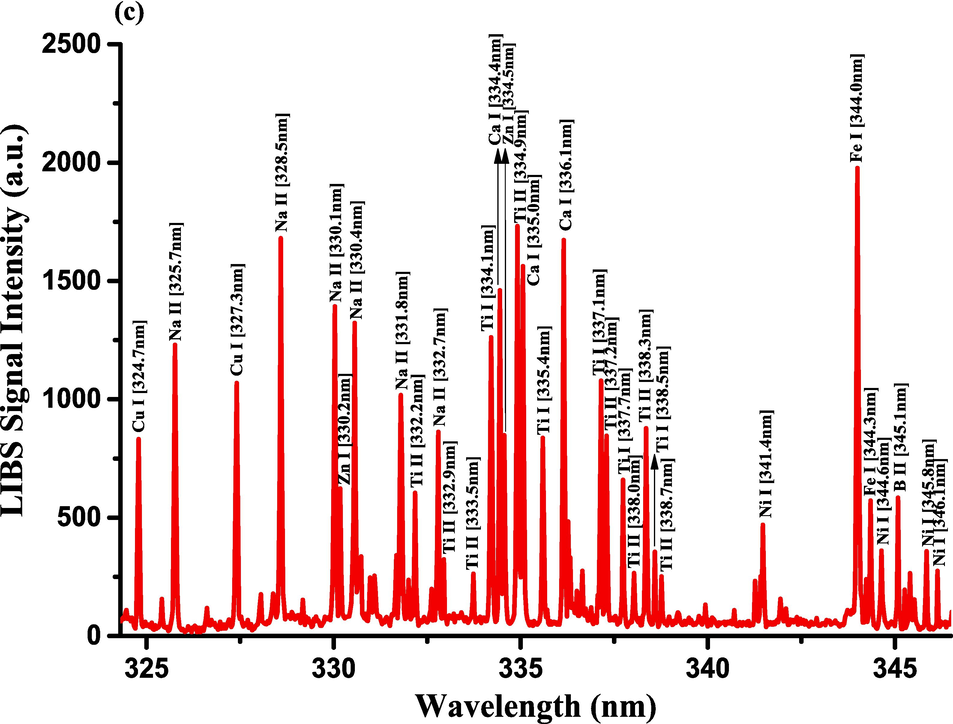
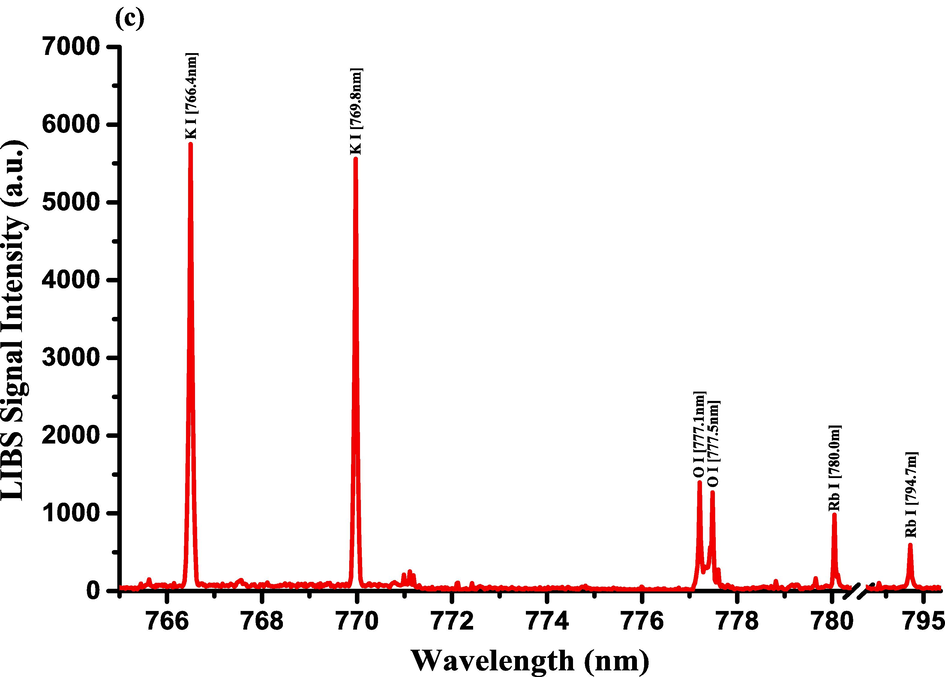
The optimization of the set-up experimental parameters, as already shown in section 3.1 was performed, and the LTE condition, as evidenced in sections 3.2, for the LIP generated on the pellet surface of CRs was fulfilled before recording LIBS spectra with discrete emission lines and minimized continuum background and proceeding into the qualitative and quantitative analyses. For the LIBS spectra construction, accumulating 20 single laser shots every randomly chosen 3 sites on the CRs pellet surface, constructed an individual spectrum, and the average was then accounted for to ensure reproducible LIBS signals by reducing shot-to-shot fluctuations [Wang et al., 2018]. The typical LIBS spectra of CRs for data analysis were recorded in several wavelength ranges 245.00–346.20, 390.00 – 549.00, and 579.50 – 795.10 nm, as can be seen in Figs. 9, 10, and 11, respectively. The elemental signatures in LIBS spectra were represented in specific wavelengths recognized using the NIST atomic spectra database [Kramida et al., 2023] and Striganov's book [Striganov and Sventitskii, 1968]. Therefore, different element analytes like Ca, K, Mg, Si, S, P, Al, Fe, Na, Ti, Ba, Mn, Zn, Sr, B, Cu, Rb, Cr, Ni, Pb, V, Mo, and Li were disclosed to be present in CRs samples by qualitatively analyzing their LIBS spectra. The detection of at least two to three persistent transition lines for each element was necessary to confirm element presence in CRs. Besides the existence of the inorganic element analytes, LIBS spectra also revealed emission lines corresponding to organic elements like 247.80 and 391.80 & 392.00 (lower intensity twin peaks) nm for C, and 777.10 and 777.50 nm for O. The detection of spectral lines in the range of wavelengths below 240 nm was not feasible by our UV-sensitive ICCD camera; thus, it was unable to identify intense and persistent lines for some elements in this spectral range were reliable. Table 2 outlines some of the atomic and/or ionic spectral lines of the elements detected in CRs and represented by certain spectral qualities belonging to these inorganic chemical signatures like the characteristic wavelengths, transition configurations, and LIBS signal intensities. The CRs found to contain a lot of element analytes. Nonetheless, they predominated in view of the ICP OES concentrations, which were in with LIBS intensities, by the macro-nutrients Ca (14458 mg.kg−1) and K (9531 mg.kg−1). In the following paragraphs, shed light on the role of the elements in dried CRs with either nutritional (e.g., Ca, Mg, and Fe) or toxicological (e.g., Al, Ba, Mn, Zn, Sr, B, Cu, Rb, Cr, Ni, Pb, Mo, and Li) relevance.
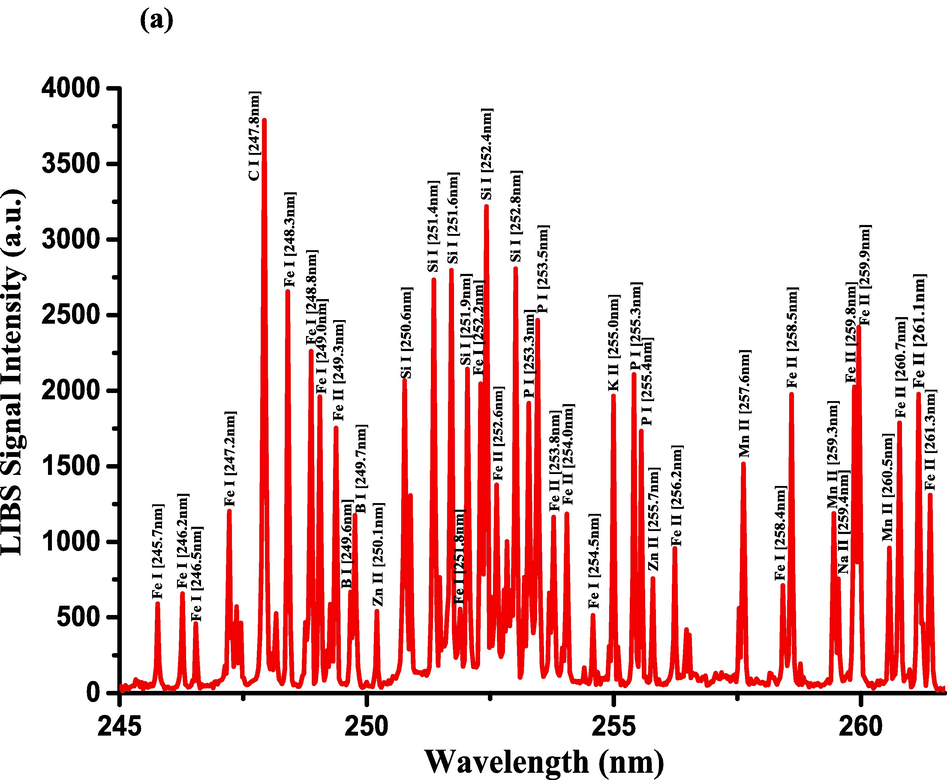
- LIBS emission spectra of the Costus roots (CRs) recorded in the wavelength region (a) 245–261.5 nm, (b) 271.6–290 nm, and (c) 324.4–346.3 nm.
- LIBS emission spectra of the Costus roots (CRs) recorded in the wavelength region (a) 245–261.5 nm, (b) 271.6–290 nm, and (c) 324.4–346.3 nm.
- LIBS emission spectra of the Costus roots (CRs) recorded in the wavelength region (a) 245–261.5 nm, (b) 271.6–290 nm, and (c) 324.4–346.3 nm.
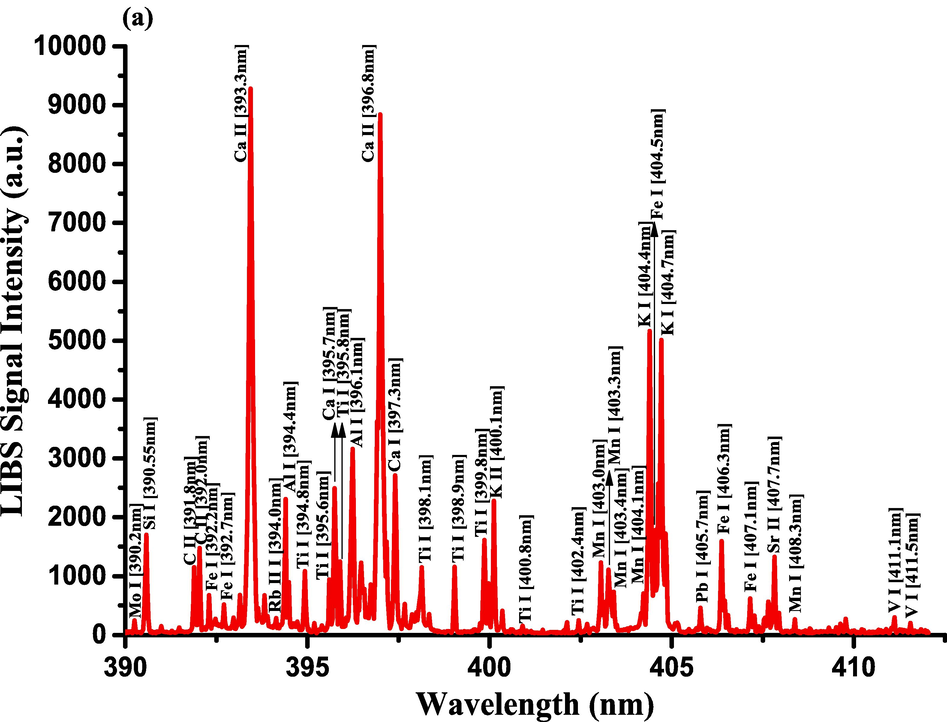
- LIBS emission spectra of Costus roots (CRs) recorded in the wavelength region (a) 390–412.5 nm, (b) 417–433 nm, and (c) 542–549 nm.
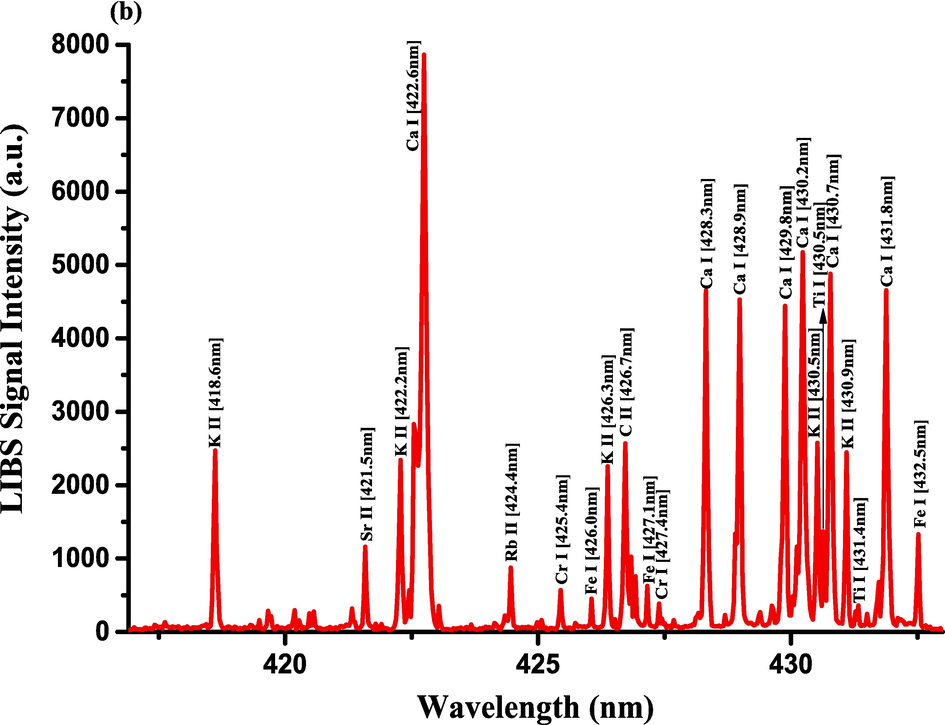
- LIBS emission spectra of Costus roots (CRs) recorded in the wavelength region (a) 390–412.5 nm, (b) 417–433 nm, and (c) 542–549 nm.
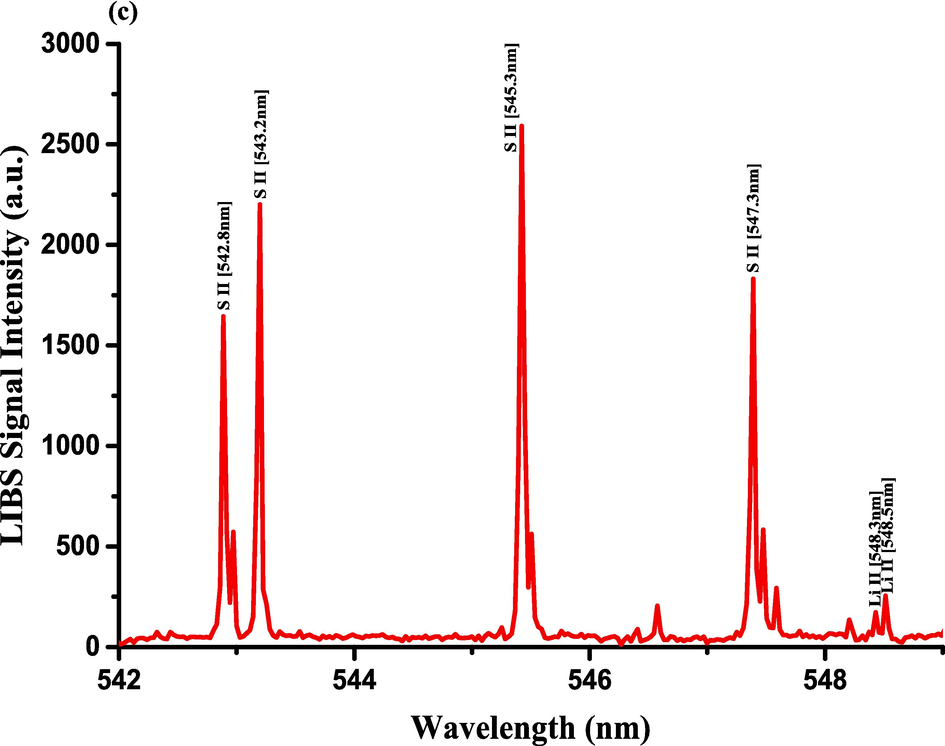
- LIBS emission spectra of Costus roots (CRs) recorded in the wavelength region (a) 390–412.5 nm, (b) 417–433 nm, and (c) 542–549 nm.
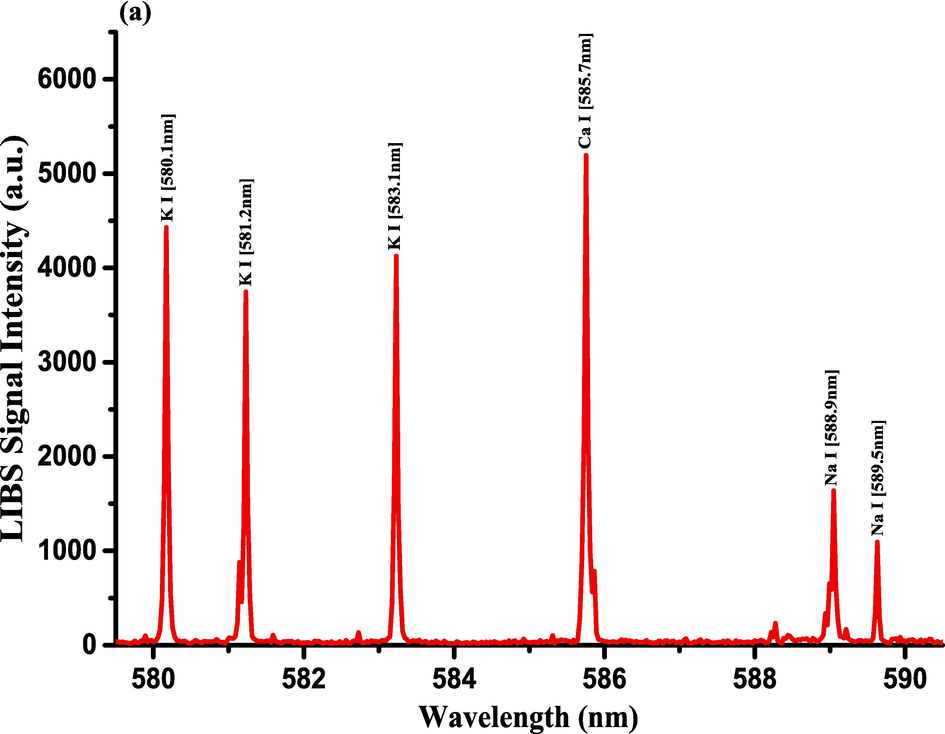
- LIBS Emission spectra of the Costus roots (CRs) measured in the wavelength ranges (a) 579.4–590.5 nm, (b) 602.1–617.5 nm, and (c) 765–795.4 nm.
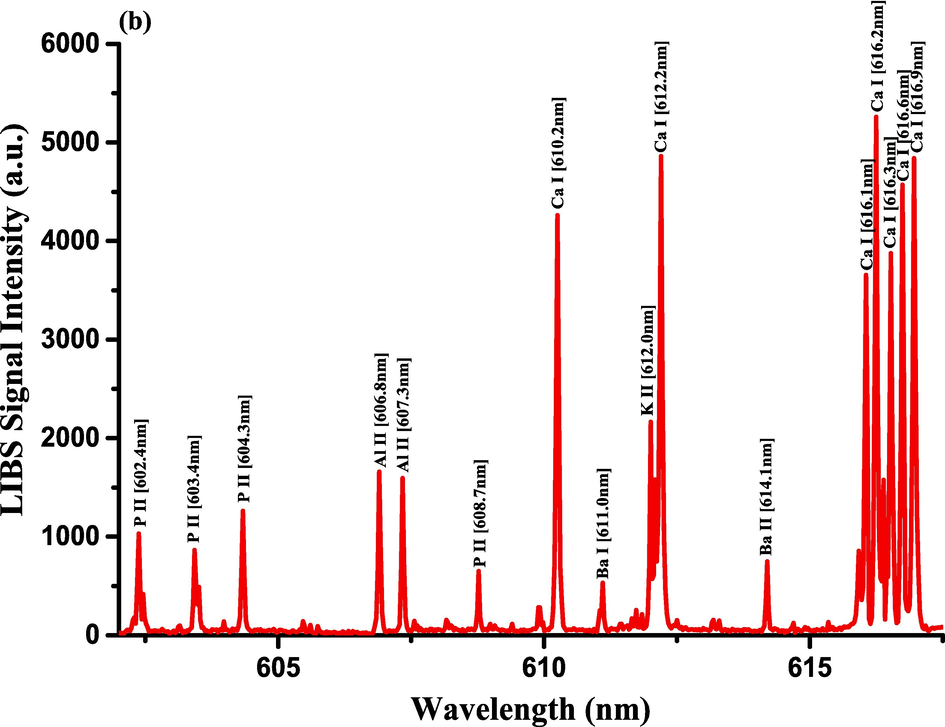
- LIBS Emission spectra of the Costus roots (CRs) measured in the wavelength ranges (a) 579.4–590.5 nm, (b) 602.1–617.5 nm, and (c) 765–795.4 nm.
- LIBS Emission spectra of the Costus roots (CRs) measured in the wavelength ranges (a) 579.4–590.5 nm, (b) 602.1–617.5 nm, and (c) 765–795.4 nm.
| Elements | Wavelength (nm) | Transition Configuration | LIBS Signal Intensity (a.u.) | ICP OES concentration (mg.kg−1) |
|---|---|---|---|---|
| Ca | 373.6 |
3p64p 2Po3/2
|
3443.7 | 14458.00 |
| 396.8 |
3p64s 2S1/2
|
8884.8 | ||
| 422.6 | 3p64s2 1S0
|
7920.6 | ||
| 445.4 | 3p6 4s4p 3Po2
|
5494.6 | ||
| 527.0 | 3p6 3d4s 3D3
|
4756.1 | ||
| 558.8 | 3p6 33d4s 3D3
|
4880.0 | ||
| 585.7 |
3p6 4s4p 1P°1
|
5209.4 | ||
| 610.2 |
3p6 4s4p 3Po0
|
4261.0 | ||
| 646.2 |
3p63d4s 3D2
|
5609.9 | ||
| K | 404.7 | 3p6 4s 2S1/2
|
5034.1 | 9531.00 |
| 580.1 | 3p6 4p 2P°1/2
|
4451.7 | ||
| 766.4 | 3p6 4s 2S1/2
|
5771.1 | ||
| 769.8 | 3p6 4s 2S1/2
|
5588.2 | ||
| Mg | 279.5 | 2p6 3s 2S1/2
|
4287.7 | 2024.00 |
| 280.2 | 2p6 3s 2S1/2
|
3473.7 | ||
| 285.2 | 2p6 3s2 1S0
|
4016.8 | ||
| 448.1 | 2p6 3d 2D5/2
|
557.6 | ||
| 518.3 | 3s3p 3P2
|
1252.9 | ||
| Si | 251.6 | 3s23p2 3P2
|
2797 | 1576.00 |
| 252.4 | 3s23p2 3P1
|
3219 | ||
| 288.1 | 3s23p2 1D2
|
3650.3 | ||
| S | 543.2 | 3s23p2(3P) 4s 4P3/2
|
2215.0 | 1461.00 |
| 545.3 | 3s23p2(3P) 4s 4P5/2
|
2609.2 | ||
| 563.9 | 3s23p2(3P) 4s 2P3/2
|
1849.1 | ||
| P | 253.5 | 3s23p3 2Po3/2
|
2466.4 | 1450.00 |
| 255.3 | 3s23p3 2Po1/2
|
2108.2 | ||
| 604.3 | 3s23p4s 3Po2
|
1269.7 | ||
| Al | 281.6 | 3s3p 1Po1
|
2470.7 | 684.00 |
| 308.2 | 3s23p 2Po1/2
|
2164.8 | ||
| 309.2 | 3s23p 2Po3/2
|
2948.3 | ||
| 394.4 | 3s23p 2Po1/2
|
2329.0 | ||
| 396.1 | 3s23p 2Po3/2
|
3179.6 | ||
| Fe | 248.3 | 3d6 4s2 5D4
|
2667.9 | 461.00 |
| 259.9 | 3d6 (5D) 4s 6D9/2
|
2433.4 | ||
| 275.5 | 3d6 (5D) 4s 4D7/2
|
2188.3 | ||
| 278.8 | 3d7 (4F) 4s 5F5
|
1710.5 | ||
| 358.1 | 3d7 (4F) 4s 5F5
|
2283.3 | ||
| 374.9 | 3d7 (4F) 4s 5F4
|
2050.4 | ||
| Na | 328.5 | 2s2 2p5 3s 1Po1
|
1690.9 | 61.00 |
| 330.1 | 2s2 2p5 3p 3P1
|
1399.2 | ||
| 588.9 | 2p6 3s 2S1/2
|
1657.2 | ||
| 589.5 | 2p6 3s 2S1/2
|
1125.1 | ||
| Ti | 334.9 | 3d2 (3F) 4s 4F9/2
|
1739.3 | 50.00 |
| 337.2 | 3d2 (3F) 4s 4F5/2
|
855.6 | ||
| 365.3 | 3d24s2 3F4
|
1554.4 | ||
| 375.2 | 3d24s2 3F4
|
1230.1 | ||
| 399.8 | 3d24s2 3F4
|
1623.6 | ||
| Ba | 455.4 |
6s 2S1/2
|
1655.5 | 45.00 |
| 614.1 |
5d 2D5/2
|
754.8 | ||
| 649.6 |
5d 2D3/2
|
500.8 | ||
| Mn | 257.6 | 3d5(6S)4s 7S3
|
1531.7 | 38.00 |
| 259.3 | 3d5(6S)4s 7S3
|
1193.1 | ||
| 279.8 | 3d54s2 6S5/2
|
689.0 | ||
| 403.0 | 3d54s2 6S5/2
|
1241.6 | ||
| Zn | 255.7 | 3d104p 2Po3/2
|
760.9 | 38.00 |
| 330.2 | 3d10 4s4p 3Po1
|
627.4 | ||
| 334.5 | 3d10 4s4p 3Po2
|
851.7 | ||
| Sr | 407.7 | 4p6 5s 2S1/2
|
1332.9 | 28 |
| 421.5 | 4p6 5s 2S1/2
|
1167.5 | ||
| B | 249.6 | 2s2 2p 2Po1/2
|
673.2 | 20.00 |
| 249.7 | 2s2 2p 2Po3/2
|
1184.3 | ||
| 345.1 | 1s2 2s2p 1Po1
|
588.0 | ||
| Cu | 324.7 | 3d10 4s 2S1/2
|
839.3 | 19.00 |
| 327.3 | 3d10 4s 2S1/2
|
1075.4 | ||
| 521.8 | 3d10 4p 2P03/2
|
267.1 | ||
| Rb | 424.4 | 4p5(2P03/2) 5s 2[3/2]02
|
876.6 | 16.00 |
| 780.0 | 4p65s 2S1/2
|
988.1 | ||
| 794.7 | 4p65s 2S1/2
|
598.7 | ||
| Cr | 425.4 | 3d5 (6S) 4s 7S3
|
574.4 | 2.70 |
| 357.8 | 3d5 (6S) 4s 7S3
|
664.4 | ||
| 360.5 | 3d5 (6S) 4s 7S3
|
347.3 | ||
| 520.8 | 3d5 (6S) 4s 5S2
|
356.3 | ||
| Ni | 341.4 | 3d9(2D) 4s 3D3
|
473.2 | 1.90 |
| 351.5 | 3d9(2D) 4s 3D2
|
395.9 | ||
| 356.6 | 3d9(2D) 4s 1D2
|
331.9 | ||
| Pb | 368.3 | 6s2 6p2
|
350.6 | 1.60 |
| 405.7 | 6s2 6p2
|
466.6 | ||
| V | 289.3 | 3d3(4F) 4s 5F4
|
193.7 | 1.10 |
| 310.2 | 3d3(4F) 4s 5F4
|
317.4 | ||
| 437.9 | 3d4(5D) 4s 6D9/2
|
383.3 | ||
| 438.4 | 3d4(5D) 4s 6D7/2
|
267.2 | ||
| Mo | 313.2 | 4d5 (6S) 5s 7S3
|
196.3 | 0.90 |
| 390.2 | 4d5 (6S) 5s 7S3
|
248.1 | ||
| Li | 548.5 |
1s 2s 3S1
|
257.0 | 0.76 |
| 670.7 |
1s22s 2S1/2
|
314.1 |
The ethylacetate (EtOAc) [Sutar et al., 2011] or methanolic (MeOH)and its isolated bioactive compounds [Matsuda et al., 2000] extractions from CRs showed an anti-ulceration action against different ulceration models in rats [Sutar et al., 2011]. In this study, the CR samples were found to contain excessive amounts of Ca, Mg, and Fe and could serve as gastroprotective agents. This assumption is appertaining to the positive correlation between the reduced gastric acidity associated with Helicobacter pylori-induced chronic superficial corpus gastritis and Fe deficiency anemia [Carabotti et al., 2021] and betwixt the decreased acidity due to the prolonged use of proton pump inhibitors (IPPs) (anti-secretory drugs to heal, e.g., drug-related gastric ulcers) and Ca [Carabotti et al., 2021] and Mg [Carabotti et al., 2021, Gröber, 2019] deficiencies. Ca deficiency is linked to an increased risk of bone fractures [Carabotti et al., 2021]. Mg deficiency is related to the eventual onset of clinical indications like muscle cramps, paraesthesia, and cardiac arrhythmias [Carabotti et al., 2021, Gröber, 2019].
The hepatoprotective property of the aq.-methanolic extraction of CRs in vivo demonstrated against an acute hepatic failure (resembles hepatitis) by reducing hepatic function serum-biomarkers and pro-inflammatory cytokine levels [Yaeesh et al, 2010]. Mg supplementation is proposed as a recovery from the metabolic comorbidities associated with non-alcoholic steatohepatitis (NASH) like type 2 diabetes mellitus (T2DM), hypertension, and cardiovascular diseases. Also, Mg supplementation as an anti-cirrhotic and −alcoholic steatohepatitis therapy [Simón et al., 2021], and as a preventive practice of liver-related mortality in subjects with metabolic syndrome, the non-alcoholic fatty liver (NAFL) or hepatic steatosis, or drinking alcohol [Wu et al., 2017], a positive impact is predicted for using Mg supplementation or Mg-rich diet intake to prevent NASH occurrence and its pathological aggravation [Simón et al., 2021].
The feasible remedial potentiality of CRs extract for the age-dependent joint disease, osteoarthritis (OA) was in vivo and in vitro demonstrated by reducing serum levels of a pro-inflammatory cytokine and the concordant recovery of the knee cartilage and its adjacent bone damages [Jo et al., 2020]. Interestingly, Mg supplementation or Mg-rich diet consumption with probiotics/probiotic supplements may prevent the gut microbiota upset that causes systemic inflammation contributed to the OA onset [Kuang et al., 2021]. Dietary Mg deficiency in osteoarthritic men with knee OA, rather than women, was linked to worsened OA pain [Shmagel et al., 2018].
Different trace or ultra-trace elements like Al, Ti, Ba, Sr, Rb, Ni, Pb, and Li are present in dried CRs and have no known role in any of the vital biochemical mechanisms in the human body. Much higher concentrations of Al (684 mg.kg−1) and Ba (45 mg.kg−1) element analytes were found in CRs samples compared to the recommended daily oral intake of 0.3 [Willhite et al., 2014] and 0.2 [Kravchenko et al., 2014] mg.kg−1.b.w−1 for adults, respectively. Long-term exposure to the Al complexes resulted in encephalopathy/dementia during hemodialysis therapy for adults [Willhite et al., 2014, Tietz et al., 2019] and low bone mineral density and neurological manifestations in infants who receive peripheral parenteral nutrition (PPN) [Willhite et al., 2014]. Endemic diseases of weakened muscles result from chronic barium chloride (BaCl2)-exposures exacerbated into cardiac arrhythmia, hypertension, and hepatic and renal failures with acute/single exposure (3–4 g for a person weighing 70 kg) [Kravchenko et al., 2014]. Naturally occurring titanium dioxide TiO2) particles in µm size do not manifest adverse health effects following oral uptake [Aldakheel et al., 2021; Jovanović, 2015; Philippe et al., 2018].
Comparing the predicted concentration of Sr in CRs (28 mg.kg−1) with the established minimal risk level (MRL) for the stable Sr-isotopes, which is 2 mg.kg−1.b.w.day−1, it could be a toxin in CRs with a possible association with severe osteoporosis [Coelho et al., 2017]. CRs found to contain the nonessential and rare Rb elements in an amount of 16 mg.kg−1, indicating plausible toxicity when compared to the estimated subchronic provisional reference dose (p-RfD) p-RfD of 4 × 10⁻³ mg.kg−1.b.w.day−1. The depressed women patients who received daily oral doses of 5.1 mg.kg−1 of rubidium chloride (RbCl) over three weeks noticed gaining weight, excessively urinating, being agitated, and having gastrointestinal manifestations [U.S. EPA, 2016]. Essential Cr in CRs considered toxic with its estimated amount, of 2.70 mg.kg−1, exceeding the adequate daily intake of soluble-trivalent chromium (Cr(III)) ion salts of 25 μg for women and 35 μg for men [Trumbo et al., 2001]. Ni and Pb elements were present in CRs with 1.90 and 1.60 mg.kg−1, implying being toxic elements since their concentrations exceeded the tolerable upper intake of 5 µg.kg−1.b.w.day−1 [WHO, 1993] and 3 µg.kg−1.b.w.day−1 [WHO, 2016], respectively. Pb toxicity typically induces atherothrombosis, hypertension, renal dysfunction, neurological disorders in adults and children, and reproductive complications (Nordberg et al., 2014; Okereafor et al., 2020). Overload Ni exposure can cause allergic dermatitis and various gastrointestinal manifestations [Genchi et al., 2020]. The 0.76 mg.kg−1 of nonessential Li found in CRs, but acts as an anti-aging and mood-stabilizing agent and is used as standard long-term therapy for bipolar disorder (BD) patients [Aral and Vecchio-Sadus, 2008; Nordberg et al., 2014], exceeded the minimum requirement for adults which is 0.014 mg.kg−1.b.w.day−1 [Schrauzer, 2002] and considered toxic as the prolonged use of Li psychiatric drugs leads to the toxicity of the kidney, the gastrointestinal tract, and the central nervous and endocrine systems [Aral and Vecchio-Sadus, 2008; Nordberg et al., 2014].
Although Mn is an essential element required to perform different biological functions, its estimated concentration in CRs of 38 mg.kg−1 was higher than the safe dietary intake set by the National Research Council (NRC) of U. S. for adult subjects of 0.03–0.07 mg.kg−1.b.w.day−1. Excessive exposure to Mn may be a neurotoxicant, inducing “manganism” condition, especially in patients with cholestasis and Fe deficiency [Horning et al., 2015; Nordberg et al., 2014; Sigel et al., 2013]. Methanolic (MeOH) extract of CRs showed anti-inflammatory activity in a mite Antigen/Biostar-induced atopic dermatitis (AD) murine model as it alleviates its related clinical signs (e.g., dryness/scaling, dermal edema, mild-to-severe erythema/hemorrhage, scarring, and erosion) [Lim et al., 2014]. Although the relationship between nutritional Zn deficiency and AD has not been inconclusive, the extent and severity of AD improved with Zn supplementation in one of two randomized controlled trials (RCTs) [Gray et al., 2019]. However, there was 38 mg.kg−1 of Zn in CRs, which was higher than the maximum allowable daily intake of 40 mg for a 70-kg adult [Trumbo et al., 2001]. Excessive intake of dietary Zn leads to immunosuppression, low copper levels, gastrointestinal (GI) irritation and corrosion, and renal tubulointerstitial nephritis or tubular necrosis [Okereafor et al., 2020; Trumbo et al., 2001]. It was reported that B, a possible essential element, could boost the antioxidant defense system [Khaliq et al., 2018] and reduce the inflammation risk by abolishing the activity of certain enzymes [Uluisik et al., 2018]. However, CRs contain 20 mg.kg−1 of B, which is higher than the tolerable upper intake level set for adults at 0.4 mg.kg−1.b.w.day−1 by the World Health Organization (WHO) [Nielsen, 2014]; thus, several negative impacts on vital organs could occur, even death eventuated after oral exposure to more than 84 mg.kg−1 of boron [Uluisik et al., 2018]. The measured Cu amount in CRs was considered toxic, 19 mg.kg−1, since it was higher than the set optimal intake of 2.7 mg.day−1 from food and water (not Cu supplements). This value precludes the possible occurrences of any gastrointestinal (e.g., hematemesis, vomiting with erosive gastropathy, jaundice, stomachache, melena, and headache) and neurological (e.g., depression, anxiety, irritability, and agitation) symptoms, intravascular hemolysis, hepatic necrosis, and renal failure (Alengebawy et al., 2021; Taylor et al., 2020). The daily safe upper level of the essential Mo intake was established at 0.028 mg.kg−1.b.w.day−1, which is much lower than the appraised amount in the CRs of 0.9 mg.kg−1 [Nordberg et al., 2014]. Dietary Mo toxicity was causative of reproductive toxicity and gout-like disease with clinical symptoms like joint pain, enlarged liver, and high serum urate levels [Nordberg et al., 2014; WHO, 2011].
In the end, the LIBS qualitative analysis of the CRs proves their enrichment of CRs by six nutrient elements (Ca and K, followed by Mg, Si, S, and P) and their toxicity, i.e., element amounts/concentrations outstripping the allowable limits, by thirteen toxic trace and ultra-trace elements (Al, Ba, Mn, Zn, Sr, B, Cu, Rb, Cr, Ni, Pb, Mo, and Li).
3.4 Quantitative ICP OES analysis of CRs for counter-verification of LIBS results
ICP OES is one of the most utilized techniques for multi-element quantitative analysis of a variety of plants cultivated for different purposes. The determination of the microelement composition of ten samples of unconventional edible plants (UEP) (Indian Borage; Java ginseng; Jaboti herb; Purslane; Chanana; Basil; Coriander; Slender amaranth; Cocoyam, and Spearmint), which are known for their therapeutic and medicinal properties, was done by using the ICP OES technique. (ICP OES) after acid digestion. The concentrations (measured in mg.kg−1) of the detected macro- and trace-elements were in the ranges: Al (122–657), Ca (145–14,229), Cu (8.3–18.81), Fe (177–586), K (12.46–34.50 %), Mg (157–1,552), Mn (16.85–84.96), Na (1,107–23,775), P (2,535–6,127), Si (189–1,695), Sr (25.56–104.63) and Zn (0.3–72.31) [Moura et al., 2021]. Moreover, Three medicinal plants and herbal medicines (globe artichoke, devil’s claw, and espinheira Santa) were quantitatively analyzed by the ICP OES technique after acid digestion, assisted by microwave radiation. The results showed their content (measured in mg.kg−1) of different macro- and microelements like Al (20.24–1261.64), Ba (18.90–63.18), Ca (2877.6–19,957.40), Cr (0.28–1.38), Cu (4.16–21.99), Fe (8.54–627.49), K (1786.12–32,297.19), Mg (505.82–6174.52), Mn (0.40–205.64), Na (1717.23–18,596.45), P (35.12–2899.91), Se (1.52–3.71), Sn (1.53–12.43), Sr (52.33–84.31), and Zn (2.60–30.56). Ni, Various other elements, such as V, As, Cd, Co, Mo, Pb, and Sb, were undetected, were undetected [de Aragão Tannus et al., 2021].
ICP OES was used to determine the presence and concentration of 23 elements in dried CRs, including Ca, K, Mg, Si, S, P, Al, Fe, Na, Ti, Ba, Mn, Zn, Sr, B, Cu, Rb, Cr, Ni, Pb, V, Mo, and Li. The ICP OES approach revealed the overall content pattern of the components in RCs, which is depicted in Table 2. The validation ICP OES method validated the existence of these elements predicted by the LIBS approach, as shown in Table 2. Table 2 shows that the concentrations of macro elements in mg.kg−1 in dried RCs dropped in the order of Ca > K>Mg > Si (nearly equivalent to S and P). The trace or ultra-trace element concentrations (Al, Fe, Ti, Ba, Mn, Zn, Sr, B, Cu, Rb, Cr, Ni, Pb, V, Mo, and Li) ranged from 684 mg.kg−1 for Al to 0.76 mg.kg−1 for Li. The concentration of Al in RCs was highest among these trace or ultra-trace elements. Quantitative spectral analysis of RCs by using ICP OES conferred in the total elemental concentrations determination for Ca, K, Mg, Si, S, P, Al, Fe, Na, Ti, Ba, Mn, Zn, Sr, B, Cu, Rb, Cr, Ni, Pb, V, Mo, and Li analytic elements as follows 14458.00, 9531.00, 2024.00, 1576.00, 1461.00, 1450.00, 684.00, 461.00, 61.00, 50.00, 45.00, 38.00, 38.00, 28.00, 20.00, 19.00, 16.00, 2.70, 1.90, 1.60, 1.10, 0.90, and 0.76 mg.kg−1, respectively. The quantitative analysis performance of the CF-LIBS method that indexed for the elemental composition in RCs, in the next section, will be validated by these ICP OES outcomes.
The ICP OES results of the present work are in line with other available findings from another recent study by Khan et al. (2021); however, the level of consistency is not fully satisfied for some detected elements. Some elements like Si, Ti, Mn, B, and Mo were detected only in our samples; contrary, Co and Ga of a quantifiable amount just seemed to be evident in CRs of Pakistani origin [Khan et al., 2021]. Moreover, the amounts of some analytic elements provided by Khan et al. (2021) and our ICP OES analyses were different. Nevertheless, the concentrations were doubled or even more for elements like Al, Na, Ba, Zn, Sr, Cu, and Rb in our samples. These disparities, herewith studying the same plant species, are relied on differences in the geo-climatic conditions (origin), soil characteristics, harvest season, post-harvest handling (storing, processing…, etc.), and agricultural practices [Sezer et al., 2019; Wang et al., 2018].
3.5 Quantitative LIBS analysis of CRs using calibration LIBS free method
The CF-LIBS method was used to quantify the concentration of the element in our CRs samples. For applying this technique plasma must be optically thin, free from self-absorption, and in LTE during the acquisition LIBS spectrum. That LTE regime was verified by the calculations for the excitation temperature and electron density in section 3.2. The actual integral intensity of the spectral line corresponding to a detected element is given by:
In this context, the symbols k and i represent the upper and lower transition levels, λ denotes the wavelength pertinent to the transition from level Ek to level Ei, F signifies an experimental parameter that incorporates the total plasma density and optical efficiency of the collection system, and Cs signifies the concentration of the emitting species s. The variables Aki, gk, KB, T, and Us (T) represent the transition probability for spontaneous emission from state k to i, the degeneracy of the k level, the Boltzmann constant, the plasma temperature (K), the partition function of the emitting species s (as a function of the sample's elements) a plasma temperature T, respectively. The Us (T) can be calculated using the following equation:
The NIST [50] was used to gain the atomic parameters (Ek, gk, and Aki) of the spectral lines. After that, the F parameter can be derived by the normalization of the total concentrations of the constituent species (i.e., the neutral (I) and singly-ionized (II) atoms):
where
The concentration summation of the emitting neutral and singly-ionized species, as depicted by Eq. (5), gives the total relative concentration of an element in CRs:
Tables 3a and 3b present the comparison between CF-LIBS and ICP OES results for CRs. The CF-LIBS results are in high concurrent with the standard method of ICP OES. Thereby, the relative accuracy (RA) was calculated using the expression:
| Elements detected in Indian Costus samples | Comparison of LIBS and ICP OES in CRs, and RA | Standard deviations CF-LIBS | RSD (%) | ||
|---|---|---|---|---|---|
|
CF-LIBS mg.kg−1 |
ICP OES mg.kg−1 |
RA | |||
| Ca | 14424.00 | 14458.00 | 0.12 | 0.13 | 1.64 |
| K | 9511.00 | 9531.00 | 0.18 | 0.11 | 1.67 |
| Mg | 2031.00 | 2024.00 | 0.09 | 0.07 | 1.38 |
| Si | 1559.00 | 1576.00 | 0.12 | 0.12 | 1.43 |
| S | 1450.00 | 1461.00 | 0.12 | 0.11 | 1.69 |
| P | 1465.00 | 1450.00 | 0.13 | 0.10 | 1.46 |
| Al | 678.00 | 684.00 | 0.33 | 0.11 | 2.64 |
| Fe | 458.00 | 461.00 | 0.28 | 0.08 | 2.97 |
| Na | 59.00 | 61.00 | 0.22 | 0.07 | 3.76 |
| Ti | 48.00 | 50.00 | 0.23 | 0.10 | 3.86 |
| Ba | 47.00 | 45.00 | 0.24 | 0.09 | 4.65 |
| Elements detected in Indian Costus samples | Comparison of LIBS and ICP OES in CRs, and RA | Standard deviations CF-LIBS | RSD (%) | ||
|---|---|---|---|---|---|
|
CF-LIBS mg.kg−1 |
ICP OES mg.kg−1 |
RA | |||
| Mn | 37.00 | 38.00 | 0.34 | 0.12 | 4.43 |
| Zn | 37.00 | 38.00 | 0.34 | 0.12 | 3.09 |
| Sr | 27.00 | 28.00 | 0.39 | 0.20 | 3.10 |
| B | 19.00 | 20.00 | 0.43 | 0.22 | 3.12 |
| Cu | 19.60 | 19.00 | 0.21 | 0.13 | 3.82 |
| Rb | 15.00 | 16.00 | 0.25 | 0.24 | 2.68 |
| Cr | 2.60 | 2.70 | 0.46 | 0.26 | 3.82 |
| Ni | 1.50 | 1.90 | 0.48 | 0.27 | 3.88 |
| Pb | 1.50 | 1.60 | 0.49 | 0.24 | 3.91 |
| V | 1.16 | 1.10 | 0.41 | 0.19 | 3.65 |
| Mo | 1.00 | 0.90 | 0.44 | 0.13 | 3.79 |
| Li | 0.90 | 0.76 | 0.49 | 0.10 | 3.94 |
Where
For CRs samples, the precision of LIBS measurements depends on the complexity and homogeneity of the sample and the reproducibility of the laser shots. Typical values for LIBS are in the range of 1–7 %.
In conclusion, this research study presents important results regarding the elemental analysis of the extensively and domestically used CRs herbal medicine due to their various therapeutic uses and the the trace elements to the above-mentioned ground plant parts controlled by the root uptake. The qualitative analysis of the CRs that relied upon the optimized LIBS spectra demonstrated their content of a set of nutrient and toxic elements. Indeed, the quantitative analysis of CRs (via CF-LIBS algorithm), which was validated by the standard analytical ICP OES method, revealed their high content of elements (Al, Ba, Mn, Zn, Sr, B, Cu, Rb, Cr, Ni, Pb, Mo, and Li) with a toxicological relevance, which seemed predictive of the possible adverse health impacts of the CRs overdose or prolonged use. Moreover,our finding notifies the requirement of developing new plant-based tablet preparations or encapsulated powders with high efficacy and minimal health side effects from this herbal medicine.
4 Conclusion
In summary, this study demonstrated that calibration free LIBS is a reliable, rapid, facile, and safe analytical technique for qualitative and quantitative technique for determination of vital nutrient contents in high-altitude cultivated folklore herbal medicinal Costus Roots(CR) which is a medicinal herb, very frequently applied in developing nations for treatment of various diseases. A systematic study was conducted for the optimization of LIBS parameters prior to its application for elemental analysis of CR roots. The LIBS elemental analysis of CRs demonstrated the presence of several elements such as Ca, K, Mg, Si, S, P, Al, Fe, Na, Ti, Ba, Mn, Zn, Sr, B, Cu, Rb, Cr, Ni, Pb, V, Mo, and Li with the estimated concentrations by the CF-LIBS procedure of 14424.00, 9511.00, 2031.00, 1559.00, 1450.00, 1465.00, 678.00, 458.00, 59.00, 48.00, 47.00, 37.00, 37.00, 27.00, 19.00, 19.60, 15.00, 2.60, 1.50, 1.50, 1.16, 1.00, and 0.90 mg.kg−1, respectively. Most of the trace and ultra-trace elements like Al, Ba, Mn, Zn, Sr, B, Cu, Rb, Cr, Ni, Pb, Mo, and Li were observed with abundances that exceeded the human health-based recommended guidelines and present serious biological toxicity with long-term consumption which should be avoided and monitored using regular blood analysis of such people who are exposed to such herbal medicine. The concentrations of above- mentioned elements estimated by using CF-LIBS were in an excellent agreement with the results obtained by the standard ICP OES technique.
CRediT authorship contribution statement
R.K. Aldakheel: Investigation, Data curation, Analysis, Writing original draft. M.A. Gondal: Conceptualization, Supervision, Resources, Project administration, Writing, Reveiweing and Editing. M.A. Almessiere: Conceptualization, Data curation, Analysis, Writing, Reveiweing and Editing. M.M. Nasr: Theoretical, Writing, Reveiweing and Editing. I. Rehan: Theoretical, Writing, Reveiweing and Editing. F.F. Adel: Writing, Reveiweing and Editing.
Acknowledgments
The authors are thankful to KFUPM for the hospitality and acknowledge DSR for supporting this work. Prof Gondal is grateful to KACARE for profound support under the senior fellowship scheme.
Declaration of competing interest
The authors declare that they have no known competing financial interests or personal relationships that could have appeared to influence the work reported in this paper.
References
- Toxicity of heavy metals and recent advances in their removal: a review. Toxics. 2023;11(7):580.
- [Google Scholar]
- Saussurea lappa ethanolic extract attenuates triamcinolone acetonide-induced pulmonary and splenic tissue damage in rats via modulation of oxidative stress, inflammation, and apoptosis. Antioxidants. 2020;9(5):396.
- [Google Scholar]
- Spectrochemical analysis using LIBS and ICP-OES techniques of herbal medicine (Tinnevelly Senna leaves) and its anti-cancerous/antibacterial applications. Arab. J. Chem.. 2021;14(12):103451
- [Google Scholar]
- Quantitative elemental analysis of nutritional, hazardous, and pharmacologically active elements in medicinal Rhatany root using laser-induced breakdown spectroscopy. Arab. J. Chem.. 2021;14(2):102919
- [Google Scholar]
- Rapid determination and quantification of nutritional and poisonous metals in vastly consumed ayurvedic herbal medicine (Rejuvenator Shilajit) by humans using three advanced analytical techniques. Biol. Trace Elem. Res. 2022:1-18.
- [Google Scholar]
- Capabilities and Limitations of Laser-Induced Breakdown Spectroscopy for Analyzing Food Products. In: Singh V.K., Tripathi D.K., Deguchi Y., Wang Z., eds. Laser-Induced Breakdown Spectroscopy (LIBS) Concepts, Instrumentation, Data Analysis, and Applications. New York: John Wiley & Sons; 2023. p. :807-822.
- [Google Scholar]
- Heavy metals and pesticide toxicity in agricultural soil and plants: Ecological risks and human health implications. Toxics. 2021;9(3):42.
- [Google Scholar]
- Detection of toxic elements using laser-induced breakdown spectroscopy in smokers’ and nonsmokers’ teeth and investigation of periodontal parameters. Appl. Opt.. 2015;54(24):7342-7349.
- [Google Scholar]
- Characterization of laser-induced plasmas by optical emission spectroscopy: A review of experiments and methods. Spectrochim. Acta B. 2008;63(9):893-916.
- [Google Scholar]
- Influence of the optical depth on spectral line emission from laser-induced plasmas. Spectrochim. Acta B. 2001;56(6):619-628.
- [Google Scholar]
- Toxicity of lithium to humans and the environment—a literature review. Ecotoxicol. Environ. Saf.. 2008;70(3):349-356.
- [Google Scholar]
- The role of environmental trace element toxicants on autism: A medical biogeochemistry perspective. Ecotoxicol. Environ. Saf.. 2023;251:11456.
- [Google Scholar]
- Heavy metal pollution in the environment and their toxicological effects on humans. Heliyon. 2020;6(9):e04691.
- [Google Scholar]
- Common pitfalls in the management of patients with micronutrient deficiency: keep in mind the stomach. Nutrients. 2021;13(1):208.
- [Google Scholar]
- Phytochemicals involved in mitigating silent toxicity induced by heavy metals. Foods. 2024;13(7):978.
- [Google Scholar]
- Recent developments and trends in the application of strontium and its isotopes in biological-related fields. TrAC-Trends Analyt. Chem.. 2017;90:45-61.
- [Google Scholar]
- Handbook of laser-induced breakdown spectroscopy (Second ed.). New York: John Wiley & Sons; 2013.
- Local thermodynamic equilibrium in laser-induced breakdown spectroscopy: beyond the McWhirter criterion. Spectrochim. Acta B. 2010;65(1):86-95.
- [Google Scholar]
- Evaluation of grinding methods for pellet preparation aiming at the analysis of plant materials by laser-induced breakdown spectrometry. Talanta. 2011;85(4):1744-1750.
- [Google Scholar]
- Multielement determination in medicinal plants and herbal medicines containing Cynara scolymus L., Harpagophytum procumbens DC, and Maytenus ilifolia (Mart.) ex Reiss from Brazil using ICP OES. Biol. Trace Elem. Res.. 2021;199(6):2330-2341.
- [Google Scholar]
- Evaluation of laser-induced breakdown spectrometry for the determination of macro and micronutrients in pharmaceutical tablets. J. Anal. at. Spectrom.. 2010;25(6):803-809.
- [Google Scholar]
- Effects of laser focusing and fluence on the analysis of pellets of plant materials by laser-induced breakdown spectroscopy. Spectrochim. Acta B. 2012;74:162-168.
- [Google Scholar]
- Stark broadening parameter tables for neutral calcium spectral lines. II. Serb. Astron. J.. 2000;161:39-88.
- [Google Scholar]
- Time-resolved LIBS of atomic and molecular carbon from coal in air, argon, and helium. At. Spectrom.. 2012;27(12):2066-2075.
- [Google Scholar]
- Measurement of plasma parameters in laser-induced breakdown spectroscopy using Si-lines. World J. Nano Sci. Eng.. 2012;2(04):206.
- [Google Scholar]
- Evaluation of heavy metal presence in agricultural samples of lactuca sativa and trifolium alexandrinum using picosecond laser-induced breakdown spectroscopy and flame atomic absorption spectroscopy in Banha and Giza Governorates. Egypt. Minerals. 2023;13(10):1300.
- [Google Scholar]
- Laser-induced breakdown spectroscopy for elemental analysis in environmental, cultural heritage and space applications: a review of methods and results. Sensors. 2010;10(8):7434-7468.
- [Google Scholar]
- Nickel: Human health and environmental toxicology. Int. J. Environ. Res. Public Health. 2020;17(3):679.
- [Google Scholar]
- Detection of heavy metals in Arabian crude oil residue using laser-induced breakdown spectroscopy. Talanta. 2006;69(5):1072-1078.
- [Google Scholar]
- Detection of sulfur in the reinforced concrete structures using a dual pulsed LIBS system. Opt. Laser Techn.. 2012;44(3):566-571.
- [Google Scholar]
- Detection of the level of fluoride in the commercially available toothpaste using laser-induced breakdown spectroscopy with the marker atomic transition line of neutral fluorine at 731.1 nm. Opt. Laser Technol.. 2014;57:32-38.
- [Google Scholar]
- Determination of carcinogenic fluorine in cigarettes using pulsed UV laser-induced breakdown spectroscopy. Appl. Opt.. 2015;54(17):5560-5567.
- [Google Scholar]
- Zinc and atopic dermatitis: a systematic review and meta-analysis. J. Eur. Acad. Dermatol. Venereol.. 2019;33(6):1042-1050.
- [Google Scholar]
- Spectral line broadening by plasmas (First ed.). New York: Academic Press; 1974.
- Influence of distance between the target surface and focal point on CN emission of nanosecond laser-induced PMMA plasma in air. Optik. 2020;208:164067
- [Google Scholar]
- Quantitative studies of copper plasma using laser-induced breakdown spectroscopy. Opt. Laser Eng.. 2011;49(12):1456-1461.
- [Google Scholar]
- Electron density and temperature measurements in a laser-produced carbon plasma. J. Appl. Phys.. 1997;82(5):2140-2146.
- [Google Scholar]
- Laser-induced breakdown spectroscopy—An emerging analytical tool for mineral exploration. Minerals. 2019;9(12):718.
- [Google Scholar]
- Mechanisms and efficient elimination approaches of self-absorption in LIBS. Plasma Sci. Technol.. 2019;21(3):034016
- [Google Scholar]
- Analgesic and anti-inflammatory effects of aucklandia lappa root extracts on acetic acid-induced writhing in mice and monosodium iodoacetate-induced osteoarthritis in rats. Plants. 2020;10(1):42.
- [Google Scholar]
- Critical review of public health regulations of titanium dioxide, a human food additive. Integr. Environ. Assess. Manag.. 2015;11(1):10-20.
- [Google Scholar]
- Application of laser-induced breakdown spectroscopy and chemometrics for the quality evaluation of foods with medicinal properties: A review. Foods. 2022;11(14):2051.
- [Google Scholar]
- A brief review of remedial uses of Saussurea lappa. J. Pharmacogn. Phytochem.. 2019;8(3):4423-4430.
- [Google Scholar]
- Quantification of macro, micro, and trace elements, and antimicrobial activity of medicinal herbs and their products. Arab. J. Chem.. 2021;14(4):103055
- [Google Scholar]
- [dataset] Kramida, A., Ralchenko, Y., Reader, J., NIST ASD Team, 2023. NIST Atomic Spectra Database. National Institute of Standards and Technology, v 5.11. https://physics.nist.gov/asd.
- A review of the health impacts of barium from natural and anthropogenic exposure. Environ. Geochem. Health. 2014;36(4):797-814.
- [Google Scholar]
- Chemical characterization for the detection of impurities in tainted and natural Curcuma longa from India using LIBS coupled with PCA. Atoms. 2022;10(3):91.
- [Google Scholar]
- The influence of spot size on the expansion dynamics of nanosecond-laser-produced copper plasmas in the atmosphere. J. Appl. Phys.. 2013;113(24):243304
- [Google Scholar]
- Spectroscopic characterization of aluminum plasma using laser-induced breakdown spectroscopy. Optik. 2014;125(12):2851-2855.
- [Google Scholar]
- CRC Handbook of Chemistry and Physics (Eighty-five ed.). Boca Raton, FL: CRC Press; 2004.
- Saussurea lappa alleviates inflammatory chemokine production in HaCaT cells and house dust mite-induced atopic-like dermatitis in Nc/Nga mice. Food Chem. Toxicol.. 2014;63:212-220.
- [Google Scholar]
- Absolute stereostructures and syntheses of saussureamines A, B, C, D, and E, amino acid–sesquiterpene conjugates with gastroprotective effect, from the roots of Saussurea lappa. Tetrahedron. 2000;56(39):7763-7777.
- [Google Scholar]
- Direct spectral analysis and determination of high content of carcinogenic bromine in bread using UV pulsed laser-induced breakdown spectroscopy. J. Environ. Sci. Health B. 2016;51(6):358-365.
- [Google Scholar]
- Evaluation of multielement/proximate composition and bioactive phenolics contents of unconventional edible plants from Brazil using multivariate analysis techniques. Food Chem.. 2021;363:129995
- [Google Scholar]
- Aucklandia costus (syn. Saussurea costus): Ethnopharmacology of an endangered medicinal plant of the Himalayan region. J. Ethnopharmacol.. 2020;263:113199
- [Google Scholar]
- Update on human health effects of boron. J. Trace Elem. Med. Biol.. 2014;28(4):383-387.
- [Google Scholar]
- Handbook on the Toxicology of Metals (forth ed.). Amsterdam, NL: Elsevier/Academic Press; 2014.
- Toxic metal implications on agricultural soils, plants, animals, aquatic life, and human health. Int. J. Environ. Res. Public Health. 2020;17(7):2204.
- [Google Scholar]
- Hβ Stark broadening in cold plasmas with low electron densities calibrated with Thomson scattering. Spectrochim. Acta B. 2012;73:39-47.
- [Google Scholar]
- Comparative study of the detection of chromium content in rice leaves by 532 nm and 1064 nm laser-induced breakdown spectroscopy. Sensors. 2018;18(2):621.
- [Google Scholar]
- Characterization of the natural colloidal TiO2 background in soil. Separations. 2018;5(4):50.
- [Google Scholar]
- Kuth Saussurea costus (Falc.) Lipsch.: A critically endangered medicinal plant from Himalayas. J. Appl. Res. Med. Aroma.. 2021;20:100277
- [Google Scholar]
- LIBS for the detection of lead in ready-to-use henna paste and nutrients in fresh henna leaves and cultivated soils. Talanta. 2019;199:203-211.
- [Google Scholar]
- Evaluation of laser-induced breakdown spectroscopy for cadmium determination in soils. Spectrochim. Acta B. 2009;64(10):1073-1078.
- [Google Scholar]
- Lithium: occurrence, dietary intakes, nutritional essentiality. J. Am. Coll. Nutr.. 2002;21(1):14-21.
- [Google Scholar]
- Recent advances and future trends in LIBS applications to agricultural materials and their food derivatives: An overview of developments in the last decade (2010–2019). Part II. Crop plants and their food derivatives. TrAC-Trends Anal. Chem.. 2019;118:453-469.
- [Google Scholar]
- Detection of Pistacia vera adulteration by using laser-induced breakdown spectroscopy. J. Sci. Food Agric.. 2019;99(5):2236-2242.
- [Google Scholar]
- Laser-induced breakdown spectroscopy methods and applications: A comprehensive review. Radiat. Phys. Chem.. 2020;170:108666
- [Google Scholar]
- Determination of heavy metal content and pollution indices in agricultural soils using laser ablation inductively coupled plasma mass spectrometry. Environ. Sci. Pollut. Res. Int.. 2021;28:36039-36052.
- [Google Scholar]
- Assessment of contamination levels of heavy metals in agricultural soils using ICP-OES. Soil Sediment. Contam.. 2022;32(6):665-691.
- [Google Scholar]
- Spectroscopic studies of laser-induced aluminum plasma using fundamental, second, and third harmonics of a Nd: YAG laser. Eur. Phys. J. D. 2007;44(2):371-379.
- [Google Scholar]
- High-sensitivity determination of nutrient elements in Panax notoginseng by laser-induced breakdown spectroscopy and chemometric methods. Molecules. 2019;24(8):1525.
- [Google Scholar]
- Low magnesium intake is associated with increased knee pain in subjects with radiographic knee osteoarthritis: data from the Osteoarthritis Initiative. Osteoarthr. Cartil.. 2018;26(5):651-658.
- [Google Scholar]
- Interrelations between essential metal ions and human diseases (13th ed.). Netherlands: Springer; 2013.
- Magnesium, little known but possibly relevant: A link between NASH and related comorbidities. Biomedicines. 2021;9(2):125.
- [Google Scholar]
- Laser-induced breakdown spectroscopy (second ed.). Netherland: Elsevier B. V; 2020.
- Analytical optimization of some parameters of a laser-induced breakdown spectroscopy experiment. Spectrochim. Acta B. 2008;63(10):1077-1084.
- [Google Scholar]
- The transfer of heavy metals to barley plants from soils amended with sewage sludge with different heavy metal burdens. J. Soil Sediment. 2014;14:687-696.
- [Google Scholar]
- Calibration measurements in laser-induced breakdown spectroscopy using nanosecond and picosecond lasers. Spectrochim. Acta B. 2004;59(12):1885-1892.
- [Google Scholar]
- Tables of spectral lines of neutral and ionized atoms (first ed.). New York-Washington: IFI/Plenum Data Corporation; 1968.
- Antiulcerogenic activity of Saussurea lappa root. Int. J. Pharm. Life Sci.. 2011;2(1):516-520.
- [Google Scholar]
- Critical review of exposure and effects: implications for setting regulatory health criteria for ingested copper. Environ. Manag.. 2020;65:131-159.
- [Google Scholar]
- Aggregated aluminum exposure: risk assessment for the general population. Arch. Toxicol.. 2019;93(12):3503-3521.
- [Google Scholar]
- U.S. EPA, 2016. Provisional Peer-Reviewed Toxicity Values for Rubidium Compounds (No. EPA/690/R- 16/012F, Final, 9-02-2016). https://cfpub.epa.gov/si/si_public_record_report.cfm?Lab=NCEA&dirEntryId=339495.
- The importance of boron in biological systems. J. Trace Elem. Med. Biol.. 2018;45:156-162.
- [Google Scholar]
- Influence of distance between the sample surface and focal point on the spectral intensity of nanosecond laser-induced silicon plasma in air. AIP Advances. 2017;7(9):095204
- [Google Scholar]
- Influence of distance between focusing lens and target surface on laser-induced Cu plasma temperature. Phys. Plasmas. 2018;25(3):033302
- [Google Scholar]
- Classification of Chinese herbal medicine by laser-induced breakdown spectroscopy with principal component analysis and artificial neural network. Anal. Lett.. 2018;51(4):575.
- [Google Scholar]
- Lens-to-sample distance effect on the quantitative analysis of steel by laser-induced breakdown spectroscopy. J. Phys. D Appl. Phys.. 2020;53(25):255203
- [Google Scholar]
- Comparative study of magnesium and calcium in Codonopsis pilosula samples detected by CF-LIBS and LCGD-AES. Microchem. J. 2018;137:318-323.
- [Google Scholar]
- WHO, 1993.Guidelines for drinking-water quality, Second ed., Volume 1: Recommendations. https://www.who.int/publications/i/item/924154460O.
- WHO, 2011. Evaluation of certain food additives and contaminants: seventy-third report of the Joint FAO/WHO Expert Committee on Food Additives (WHO technical report series; no. 960). https://www.who.int/publications/i/item/9789241209601.
- WHO, 2011. Molybdenum in drinking water: background document for development of WHO guidelines for drinking-water quality (WHO/SDE/WSH/03.04/11/Rev/1). https://www.who.int/docs/default-source/wash-documents/wash-chemicals/molybdenum-background document.pdf?sfvrsn=d01920eb_4.
- Systematic review of potential health risks posed by pharmaceutical, occupational, and consumer exposures to metallic and nanoscale aluminum, aluminum oxides, aluminum hydroxide, and its soluble salts. Crit. Rev. Toxicol.. 2014;44(sup4):1-80.
- [Google Scholar]
- Magnesium intake and mortality due to liver diseases: Results from the Third National Health and Nutrition Examination Survey Cohort. Sci. Rep.. 2017;7(1):17913.
- [Google Scholar]
- Antihepatotoxic activity of Saussurea lappa extract on D-galactosamine and lipopolysaccharide-induced hepatitis in mice. Phytother. Res.. 2010;24(S2):S229-S232.
- [Google Scholar]
- Principles, developments and applications of laser-induced breakdown spectroscopy in agriculture: A review. Artif. Intell. Agric.. 2020;4:127-139.
- [Google Scholar]
- A review of the therapeutic potential of Saussurea an endangered plant from Himalaya. Asian Pac. J. Trop. Med.. 2014;7:S60-S69.
- [Google Scholar]
- Fast detection of harmful trace elements in glycyrrhiza using standard addition and internal standard method–Laser-induced breakdown spectroscopy (SAIS-LIBS) Microchem. J.. 2021;168:106408
- [Google Scholar]


