

Translate this page into:
Rapid removal of anionic organic dye from contaminated water using a poly(3-aminobenzoic acid/graphene oxide/cobalt ferrite) nanocomposite low-cost adsorbent via adsorption techniques
⁎Corresponding authors. layth.imad@koyauniversity.org (Layth I. Abd Ali), hani.khalil@koyauniversity.org (Hani K. Ismail)
-
Received: ,
Accepted: ,
This article was originally published by Elsevier and was migrated to Scientific Scholar after the change of Publisher.
Peer review under responsibility of King Saud University.
Abstract
Abstract
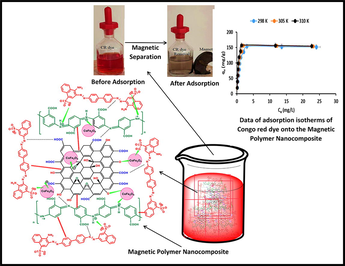
This research study aims to remove hazardous anionic azo dyes (Congo red (CR)) from aqueous solutions via a simple adsorption method using a poly(3-aminobenzoic acid/graphene oxide/cobalt ferrite) nanocomposite (P3ABA/GO/CoFe2O4) as a novel and low-cost nanoadsorbent, as synthesized by a simple and straightforward polymerization method. Typically, 3-aminobenzoic acid (3ABA), as monomer, was chemically polymerized with graphene oxide (GO) and cobalt ferrite (CoFe2O4) in an aqueous acidic medium containing an ammonium persulfate initiator. The adsorbent P3ABA/GO/CoFe2O4 nanocomposite was characterized using various techniques such as Fourier transform infrared spectroscopy, X-ray diffraction, thermogravimetric analysis, transmission electron microscopy, scanning electron microscopy, energy-dispersive analysis by X-ray and Brunauer–Emmett–Teller, vibrating sample magnetometer, and zeta potential techniques. These techniques confirmed the interaction between the poly(3-aminobenzoic acid) with GO and CoFe2O4 due to the presence of π-π interactions, hydrogen bonding, and electrostatic forces. Herein, the removal efficiency of dye from aqueous solution by the adsorbent was studied according to several parameters such as the pH of the solution, dye concentration, dosage of adsorbent, contact time, and temperature. The adsorption of the dye was fitted using a Langmuir model (R2 between 0.9980 and 0.9995) at different temperatures, and a kinetic model that was pseudo-second order (R2 = between 0.9993 and 0.9929) at various initial concentrations of CR dye. In addition, the data revealed that the P3ABA/GO/CoFe2O4 nanocomposite exhibited a high adsorption capacity (153.92 mg/g) and removal for CR dye (98 %) at pH 5. Thermodynamic results showed the adsorption process was an endothermic and spontaneous reaction. It was found that, in terms of reusability, the P3ABA/GO/CoFe2O4 adsorbent can be used for up to six cycles. In this study, P3ABA/GO/CoFe2O4 nanocomposites were found to be low cost, and have an excellent removal capability and fast adsorption rate for CR from wastewater via a simple adsorption method. Moreover, this adsorbent nanocomposite could be simply separated from the resultant solution and recycled.
Keywords
Polymer nanocomposite
Adsorbents
Wastewater treatment
Dye removal
Adsorption

1 Introduction
In recent decades, water pollution has been increasing globally due to the rapid development of industrial activities, which ultimately affects human beings, animals, and the ecosystems (Yasin et al., 2021, Alshawi et al., 2022). Among the many water pollutants, dyes and pigments in the form of aromatic organic materials are widely used as color products in several industries, for instance, textiles, plastics, paper production, leather, food industry, cosmetics, and hair colorings. According to the literature, >700,000 metric tons of dyes are produced globally per annum from various sources (Yang et al., 2018, Abd Ali et al., 2021). The discharge of unreacted dye residues directly into water sources can cause environmental pollution as well as serious harm to aquatic organisms due to their toxicity and non-biodegradability, the latter allowing their accumulation within bodies of water which can lead to a reduction in the amount of dissolved oxygen (Elsayed et al., 2022, Nasiri et al., 2022).
Azo dyes contain one or more azo linkages and include a diazotized amine coupled to an amine or a phenol. The harmfulness criterion of the benzidine relied on in dyes is the possibility of cleavage into carcinogenic amines. Among the azo-based dyes, Congo red (CR) is one of various direct dyes from a type of benzidine azo-dye, which are commonly used for dying of papers, textiles, yarns, and in laboratories as pH indicators. It is, however, toxic to human, aquatic, and animal life even in small amounts of less than 1 ppm, causing various issues such as carcinogenic, mutagenic, and dermatitis-like diseases. In addition, benzidine, which is produced from metabolizing CR, poses other hazards to health such as breathing problems, blood clotting, and somnolence (Said et al., 2020, Karim et al., 2022). In addition, CR can exist in various molecular forms in aqueous solution according to pH. Therefore, the removal of CR dye pollutants from wastewater is a significant method by which to decrease water pollution in general. Accordingly, a large number of techniques are employed by researchers for the removal of pollutants of organic dyes and pigments from bodies of water and thus industrial wastewater. The current technologies utilized in water treatment with regard to the removal of dyestuffs and pigments involve coagulation, precipitation, mass reduction, biodegradation, ion exchange, advanced oxidation, reverse osmosis, filtration, photocatalyst, and adsorption (Hussain et al., 2020, Ahmed et al., 2021, Zeebaree et al., 2021). Whilst each of these techniques has its particular advantages and limitations, the major disadvantage of these techniques in general are high cost, and low absorption rates and efficiency, as well as the need for high energy consumption. Amongst the various methods used, adsorption is found to be better and more economical than other dye removal techniques. The main advantage of this method is its ease of employment and that it has a high efficiency in the generation of the output. In addition, it is possible to use it with various adsorbents (Cheng et al., 2020, Ismail et al., 2022a, 2022b).
Several adsorbents such as clay materials (Choi et al., 2023), chitosan (Saeed et al., 2022), metal oxide nanocomposites (Koohi et al., 2021, Reghioua et al., 2021), zeolites (Tony 2020), and carbonaceous substances (Shabaan et al., 2020) have been used to adsorb organic dyes from wastewater. Determining the performance of an absorbent depends on the desired properties of the absorbent material, including its non-toxicity, ease of preparation, high capacity, and ability to absorb contaminants, in addition to the ability to be recycled (Dutta et al., 2021). Graphene oxide (GO)-based carbonaceous materials, which are produced from graphite, have been commonly employed as an adsorbent for dye removal owing to its unique 2-D structure in terms of its interplanar distance, large surface area, good mechanical and thermal properties, as well as having several potentially useful functional groups such as the epoxy (- C — O — C), carboxyl (- COOH), hydroxyl (- OH), and hydrophilic groups. These functional groups facilitate GO reacts with different inorganic and organic compounds via covalent or non-covalent interactions, which leads to good adsorption of cationic/anionic dyes and heavy metal ions (Adetayo and Runsewe 2019, Liu et al., 2019). Despite these features, GO’s ability to remove pollutants may reduce due to the reassembly of graphene nanosheets because of strong π–π stacking reactions, and thus its separation from wastewater after pollutant adsorption is difficult and costly due to the presence of nanomaterials (Thakur and Kandasubramanian 2019). Recently, conducting polymers such as polyaniline (PANI), polythiophene (PTh), polypyrrole (PPy), poly(p-aminophenol), and their derivatives have attracted considerable attention amongst researchers for use in the removal of various pollutants from contaminated water. This is due to its unique properties such as availability of monomers, ease of fabrication and low fabrication costs, as well as applications across a wide range of fields, including electromagnetic shielding instruments, extraction, environmental remediation, and electrochemical aspects (Vellaichamy et al., 2017, Ismail et al., 2019, Alesary et al., 2021). However, conducting polymers suffer from particular limitations such as poor mechanical features and low porosity, surface area, and cycle life stabilities; additionally, they swell/shrink during ion exchange processes, all of which can restrict their potential applications (Senguttuvan et al., 2020, Jain and Garg 2021). Inorganic nanoparticle materials like iron oxides are extensively employed to address such disadvantages. Recently, several magnetic adsorbents have been synthesized by mixing metallic compounds of iron with other compounds containing cobalt, nickel, and zinc to produce new inorganic magnetic ferrite nanoparticle (cobalt–nickel-zinc ferrite) (Fatimah et al., 2021). These magnetic nanoparticles offer several benefits, including ease of separation using an external magnetic field, inexpensive manufacturing costs, ability to regenerate, and a high adsorption capacity (Bektar et al., 2020).
The modification of polymeric materials via inorganic or carbonaceous substances helps improve the multifunctional adsorbent to give excellent characteristics due to increased surface areas, enhanced stability, improved porosities (free volumes), and effective binding sites (Zare et al., 2018a, 2018b). Many multifunctional adsorbents have been fabricated for the removal of dyestuffs from wastewater; for example, Gabal et al. (Gabal et al., 2019) prepared a polyaniline–cobalt ferrite composite using chemical polymerization for adsorption of acid red dye (AR) from wastewater, while Zhao et al. (Zhao et al., 2015) synthesized multi-wall carbon nanotubes/iron oxide/polyaniline magnetic composites to eliminate Methyl Orange and Congo Red dyes from wastewater. Similarly, Xiong et al. (Xiong et al., 2013) fabricated ternary titania − cobalt ferrite − polyaniline nanocomposites for the removal of anionic dyes from contaminated water. Furthermore, starch-g-polymethyl methacrylate (Haroon et al., 2021), starch/multi-walled carbon nanotube (MWCNT)-valine (SMV) nanocomposites (Mallakpour and Ezhieh 2017), polyacrylic acid-functionalized magnetic iron oxide nanoparticle-graphene oxide nanocomposites (Zhang et al., 2015), Fe3O4-based starch-poly(acrylic acid) (Saberi et al., 2019), and polypyrrole-cellulose-graphene oxide nanocomposites (Ali et al., 2018) have been used as adsorbents for environmental treatment. However, these adsorbents show complexities in porosity control, poor recyclability, and low surface area. Adsorption effectiveness is based on the nature of the sorbent. Therefore, the selection of an adsorbent is vital in terms of enhancing the adsorption process and its efficiency, taking into consideration other factors such as low-cost, stability, and environmentally friendliness.
Accordingly, in this study, poly(3-aminobenzoic acid) (structure shown in Fig. 1a), and cobalt ferrite (CoFe2O4) were successfully fabricated with graphene oxide sheets as a novel nanoadsorbent using a chemical polymerization process in the presence of an ammonium persulfate (APS) initiator to produce a new multifunctional adsorbent, the P3ABA/GO/CoFe2O4 nanocomposite, for the removal of Congo Red (CR, structure shown in Fig. 1b) anionic organic dye from aqueous solution. The advantage of the use this particular nanoadsorbent is due to its monomer, 3-aminobenzoic acid, have various functional groups – amine, imine and carboxyl groups – in its chemical structure, which provide a large number of reactive groups in the adsorbent compared to others that might only have single functional groups, such as in polyaniline and polypyrrole. These functional groups can easily attach to those present in the structures of various contaminants. The functionalization of poly(3-aminobenzoic acid) and CoFe2O4 with GO can increase the adsorption capacity and efficiency of the new adsorbent for dye removal from aqueous solution due to the presence of different functional groups on its surface such as amino, hydroxyl, and carboxyl groups, as well as electrostatic forces. Currently, there are no data on this modification of P3ABA/GO/CoFe2O4 nanocomposites, and indeed it has never previously been utilized for dye removal. In this study, P3ABA/GO/CoFe2O4 nanocomposites showed excellent removal capability and fast adsorption rates for CR. In addition, this adsorbent nanocomposite could be easily separated from solution and recycled. Moreover, the adsorbance of P3ABA/GO/CoFe2O4 nanocomposites has been characterized via various techniques such as Fourier transform infrared spectroscopy (FTIR), X-ray diffraction (XRD), thermogravimetric analysis (TGA), transmission electron microscopy (TEM), scanning electron microscopy (SEM), energy-dispersive analysis by X-ray (EDAX) and Brunauer–Emmett–Teller (BET), vibrating sample magnetometer (VSM), and zeta potentials. Thus, the effects of different physical aspects such as the pH of the solution, concentration of dye, adsorbent dosage, contact time, and temperature on adsorption efficiency were also examined. Moreover, the results of adsorption were analyzed using thermodynamic and kinetic models as well as isotherm mechanisms.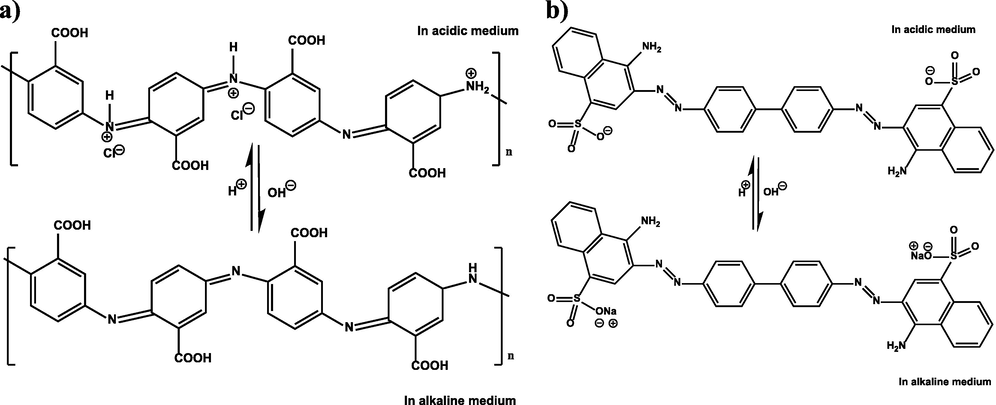
a) Chemical structure of P3ABA, b) dissociation of CR salt in aqueous solution.
2 Experiments
2.1 Chemicals and materials
The 3-aminobenzoic acid monomer (3-ABA) (Oxford Lab Fine Chemicals LLP, 98 %), graphite nanopowder (mK NANO, 99.5 %), ammonium persulfate (APS, Merck, ≥ 99 %), iron (III) chloride hexahydrate, and cobalt (II) chloride hexahydrate were used as received from Biochem Chemopharma. Potassium permanganate, sodium nitrate (NaNO3), sodium hydroxide (NaOH), sulfuric acid (H2SO4, 98 %), and hydrochloric acid (HCl, 37 %) were used as received from Sigma Aldrich. Congo Red powder was purchased from HiMedia.
2.2 Synthesis of magnetic cobalt ferrite CoFe2O4 nanoparticles
CoFe2O4 nanoparticles were prepared via the hydrothermal process according to the literature (Zhang et al., 2020, Nasiri et al., 2022). An aqueous solution of 5.4 g of FeCl3·6H2O (in 50 mL) and 2.38 g of CoCl2·6H2O (in 50 mL) were mixed in a molar ratio of 2:1, respectively, under ultrasonic irradiation for 30 min. Following this, a 3 M solution of NaOH was added dropwise to the salt mixture under constant stirring using a magnetic stirrer to increase the pH of the solution to 11–12. After that, the solution was heated at 80 °C for 1 h. The mixture was then cooled at 25 °C and the resultant black precipitate of CoFe2O4 was magnetically separated, washed with deionized water several times, and dried in a vacuum oven at 100 °C overnight.
2.3 Synthesis of graphene oxide from graphite
Graphene oxide (GO) was synthesized from graphite nanopowder according to the modified Hummers method. The detailed process for preparing the GO was presented in our previous work (Ismail et al., 2022a, 2022b).
2.4 Synthesis of the poly(3-aminobenzoic acid) composite (P3ABA/GO/CoFe2O4)
(3-aminobenzoic acid) composite was synthesized by chemical polymerization from the 3-amino benzoic acid (3ABA) monomer and various ratios of an equal amount of GO powder and CoFe2O4 nanoparticles (the weight ratio of GO:CoFe2O4 was 1:1). Firstly, a fresh oxidant solution of APS was prepared in a molar ratio of 1.25:1 (oxidant to monomer) containing 1 M HCl solution. Secondly, 3 g of the 3-aminobenzoic acid monomer was mixed with different weight ratios of GO:CoFe2O4 nanoparticles (see Table 1) in a solution of 20 mL HCl/100 mL deionized water in a 250 mL conical flask. The mixture was sonicated for 2 h and then placed on a magnetic hotplate with stirring at 50 °C. 2 g of FeCl3 was then added to the solution (i.e., monomer + GO + CoFe2O4) as support agent and to enhance the polymerization process. Following by the addition dropwise of oxidant solution (solution 1) of APS into the mixture (solution 2) to start the polymerization of the monomer. The polymerization process was carried out for 20 h at 50 °C. The product was filtered using a Buchner funnel then washed with 500 mL of 0.3 M HCl, followed by pure deionized water until a clean solution of wastewater was obtained. Finally, the yield of wet polymer composite was placed into a vacuum oven overnight at 65 °C to obtain dried polymer composite powder. The proposed reaction mechanism and structure for the synthesis of P3ABA/GO/CoFe2O4 is shown in Fig. 2. In case of preparation of pure poly(3-aminobenzoic acid), sample 1 in Table 1, the polymer was prepared using a similar method to the above but in the absence of GO and CoFe2O4 nanoparticles.
Samples
3ABA monomer (g)
GO (g)
CoFe2O4 (g)
CR removal %
Sample 1
3
0
0
51
Sample 2
3
0.075
0.075
58
Sample 3
3
0.15
0.15
66
Sample 4
3
0.3
0.3
74
Sample 5
3
0.45
0.45
81
Sample 6
3
0.6
0.6
92
Sample 7
3
0.75
0.75
95
Sample 8
3
0.9
0.9
92
Sample 9
3
1.05
1.05
91
Sample 10
3
1.2
1.2
92
Sample 11
3
1.5
1.5
90
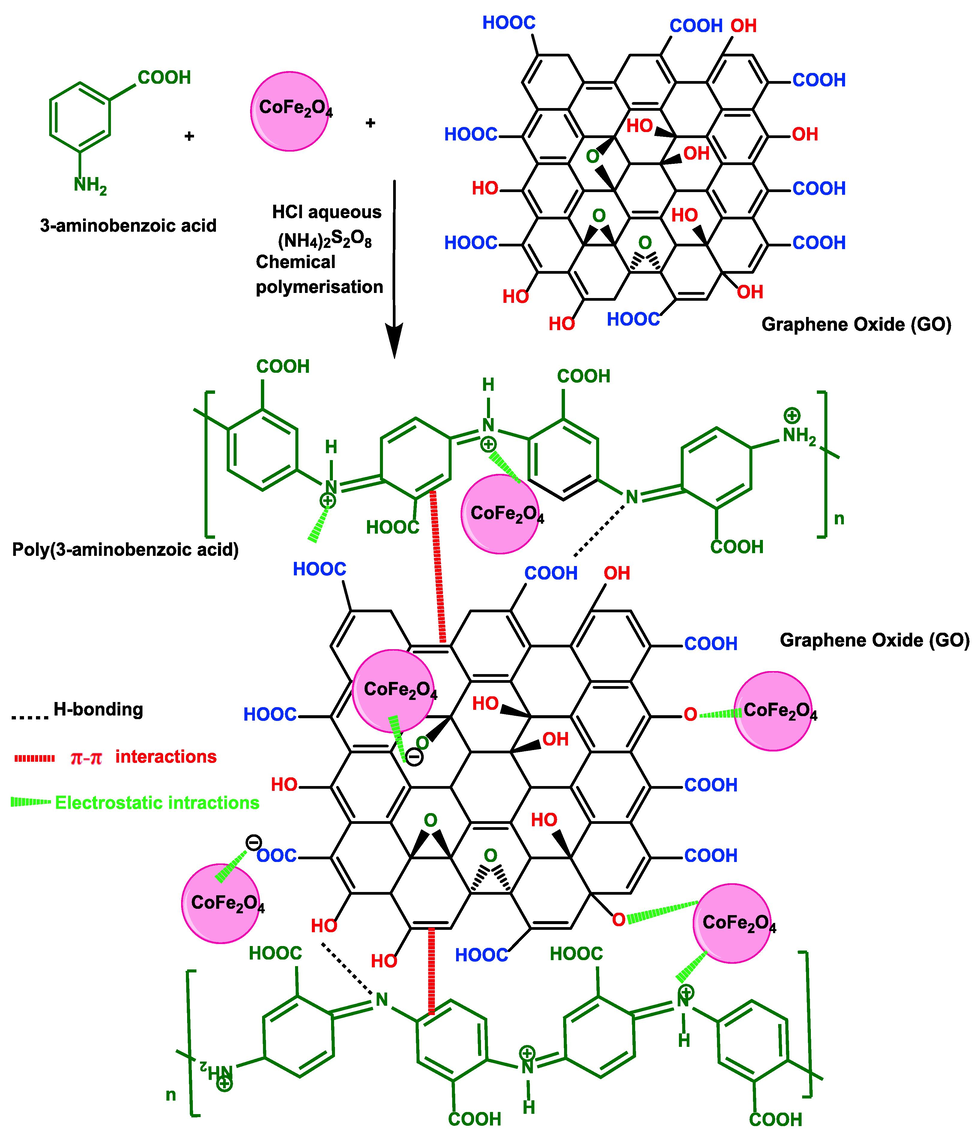
Schematic of the proposed mechanism of synthesis of the P3ABA/GO/CoFe2O4 composite nanocomposites.
2.5 Batch adsorption experiments
The adsorption experiments were performed using the batch method to investigate the efficiency of 3ABA/GO/CoFe2O4 as an adsorbent for the removal CR anionic organic dye from aqueous solution. Herein, the influence of various factors on dye removal was studied, such as pH (in the range of pH 2–10), dye concentration (10–100 ppm mg/L), amount of adsorbent (10 – 70 mg), contact time (10 – 240 min), and temperature of solution (25–45 °C). The volume of solution in each study was fixed at 100 mL; for details, see figure legends. The pH of the solutions was adjusted using diluted acid (0.1 N HCl) or alkali (0.1 N NaOH). For each study, the adsorbent and dye were placed in a series of conical flasks (250 mL) then shaken under a constant rate of 200 rpm using an orbital shaker (G BIOSCIENCES). The concentrations of the dyes after the adsorption batch process were determined by measuring the absorbance of the remaining dye solution of each sample (after removal of the adsorbent) using a UV–vis spectrophotometer (6705 UV/Vis. Spectrophotometer JENWAY) at a wavelength of 501 nm for CR dye.
2.6 Surface charge analysis
The pH zero point of charge (pHzpc) of the surface of the adsorbent P3ABA/GO/CoFe2O4 was examined using a solid addition method. Herein, nine different solutions of pH 2–10 for each dye containing 50 mL of KCl solution (0.1 M) were prepared. 0.01 g of the adsorbent P3ABA/GO/CoFe2O4 was added to each of the above solutions and then shaken. This was continued for 24 h at 298 K. The initial and final pH of each solution was measured via a pH meter using solutions of HCl and NaOH (0.1 N) to adjust the required pH of the solutions. The pHzpc was calculated by plotting the ΔpH = pHf – pHi against pHi. pHzpc was selected as the crossing point of ΔpH = 0 (Datta et al., 2017, Malakootian et al., 2018).
2.7 Experimental data and model fitting
The rate of elimination of dye and adsorption capacities qe (mg/g) of CR dye at equilibrium were calculated using equations (1) and (2), respectively:
where Ci (mg/L) is the initial dye concentration at time 0, Ce indicates the equilibrium concentration (mg/L), V (L) refers to the volume of dye solution, and M (g) refers to the mass of the adsorbent nanocomposites. Moreover, the average adsorption of three determinations as well as the relative errors of the experimental results were less than 5 %.
2.8 Statistical error analysis of adsorption process
The Chi squared test (χ2) and the sum of square error (SSE) were used to evaluate the results obtained from isotherm and kinetic adsorption model. Well-fitted isotherm and kinetic models will have high R2 values, and minimal Chi squared (χ2) and sum of square error (SSE) values. Thus, both statistical error factors, χ2 and SSE, were computed using Equations (3) and (4), respectively (Abd Ali et al., 2021).
2.9 Regeneration of P3ABA/GO/CoFe2O4 adsorbent
The recovery of adsorbate (CR dye) from the adsorbent makes the treatment of adsorption process and the adsorbent more economically feasible. Therefore, in this study, the dye-loaded P3ABA/GO/CoFe2O4 nanocomposite adsorbents were desorbed with 20 mL of 0.1 M NaOH in which the sorbent was shaken for 60 min. Thereafter, the adsorbent was separated by an external magnet and then washed with distilled water several times, after which the renewed adsorbent was dried in an oven at 70 °C under vacuum and reused for sequential cycles. The adsorption and desorption experiments were repeated five times for the adsorbent in each dye to evaluate their reusability.
2.10 Cost estimation per gram of adsorbent
The estimated cost of the prepared P3ABA/GO/CoFe2O4 nanocomposite was determined from the cost of the individual steps occurring during the preparation process of 1 g P3ABA/GO/CoFe2O4 nanocomposite. This includes the cost of the chemicals, electricity consumption, and other overheads. All calculations were based on the adsorption capacity of the P3ABA/GO/CoFe2O4 nanocomposite prepared for CR dye removal.
2.11 Instrumental
Several techniques were used for the purposes of characterization and analyzing the CoFe2O4, GO, P3ABA, and P3ABA/GO/CoFe2O4 nanocomposite. The spectra of the prepared materials in their solid states were recorded using the potassium bromide (KBr) disc method, with spectra recorded in the range 400–4000 cm−1 using a Perkin-Elmer (Germany) Spectrum One Fourier transform infrared spectrophotometer (FTIR). An X-ray diffraction device (model: Philips X'pert Pro MPD, the Netherlands) was employed to study the crystalline properties of the samples using a single wavelength (λ = 1.54 Å) from a Cu Kα radiation source with the use of nickel as a filter within a range of deviation angles (2θ = 10° − 80°). The thermal stability was recorded at the rate of heating speed (2 °C/min) in an inert atmosphere of nitrogen within a thermal range of 25–1000 °C using a Mettler Toledo 44 TGA/DSC 1 STARe machine. The surface area, the distribution of pore diameters, and the pore sizes of the samples were investigated via the Brunauer–Emmett–Teller (BET) and Barret–Joyner–Halenda (BJH) techniques (model: BELSORP MINI X, MICROTRAC, Japan) using liquid nitrogen adsorption/desorption methods at a temperature of 77 K with a decomposition time of 3 h. The surface morphology was analyzed using scanning electron microscopy (SEM) (IGMA/VPƩ Zeiss-Germany) with an accelerator voltage of 10 keV and transmission electron microscope (TEM) (model: Zeiss-EM10C-100 KV Germany). In addition, Energy Dispersive X-ray spectroscopy (EDX) was used to characterize the elements that presented in the deposited polymer composite. The magnetic behaviors of pure CoFe2O4 and the P3ABA/GO/CoFe2O4 nanocomposite were characterized using a vibrating sample magnetometer (VSM, Magnetic Danesh Pajoh Co.) from −15000 to 15,000 Oe at 298 K to obtain a magnetization loop for the prepared materials.
3 Results and discussion
3.1 Characterization of samples
Depending on the optimization data, as found in Table 1, sample 7 of the P3ABA/GO/CoFe2O4 adsorbent was chosen for diagnostics and study of the properties of the adsorbed surface prepared and to find suitable conditions for dye removal using the adsorption method as follows:
3.1.1 Fourier-transform infrared spectroscopy (FTIR) analysis
The functional groups of CoFe2O4, GO, P3ABA, and the P3ABA/GO/CoFe2O4 composite (before and after adsorption of the dye) were investigated via the FTIR technique, the spectra for which are shown in Fig. 3. FTIR spectra of CoFe2O4 magnetic (Fig. 3a, green line) show two broad bands, the first at 3370 cm−1 and the second between 410 and 680 cm−1, which are assigned to the O—H stretching vibration of the hydroxyl group attached to the cobalt ferrites (due to adsorbed water molecules) and the stretching vibrations for the tetrahedral and octahedral coordination in ferrite metal, respectively (Belhaine et al., 2022). The O—H transmittance bands in and out of the plane were observed at 1335 cm−1 to 1646 cm−1 (Margabandhu et al., 2017). For the GO sample (Fig. 3a, black line), the broad absorption peak at 3394 cm−1 was attributed to the O—H stretching vibration while the peak at 1704 cm−1 corresponds to the carbonyl (C⚌O) stretch. The other peaks in the GO layers are located at 1561 cm−1, 1156 cm−1, and 1004 cm−1, which correspond to the C⚌C and the C—O of the epoxide group, the O—H deformation of the C–OH group, and an alkoxy C—O stretch, respectively (Ismail et al., 2022a, 2022b).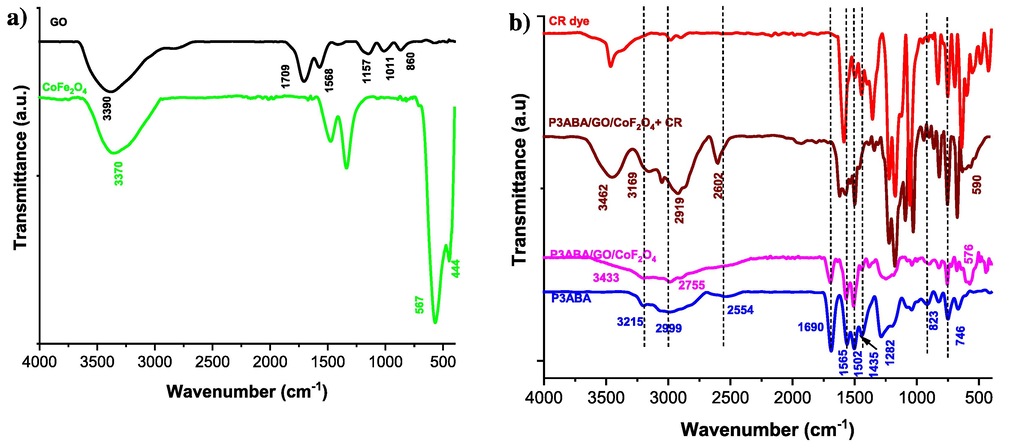
FTIR of a) CoFe2O4 and GO, and b) P3ABA and P3ABA/GO/CoFe2O4 nanocomposite (before and after adsorption of dyes).
In the FTIR spectrum of P3ABA (Fig. 3b, blue line), it can be seen that the broad bands located at around 3215 to 2999 cm−1 are related to carboxylic (COO-H) and amine (N — H) groups, respectively, while the band at 2554 cm−1 was due to the C — H of the aromatic ring. The bands at 1690 cm−1, 1565 cm−1, and 1502 cm−1 are attributed to the C⚌O, quinoid C⚌C stretching, and benzenoid ring C⚌C stretching vibrations, respectively (Zare et al., 2018a, 2018b). The peak at 1435 cm−1 is attributed to the –COO symmetric stretch of the of carboxylic acid, whereas the S⚌O vibration observed at 1034 cm−1 was due to the use of ammonium persulfate acidic solution. In addition, other bands were observed at 1282 cm−1 and 656 cm−1 due to the in-plane C—H and C—C bending vibrations, respectively. The two absorption peaks at 746 and 823 cm−1 can be ascribed to C—H out-of-plane bending vibrations (Ramohlola et al., 2017).
All of the FTIR peaks of both GO and CoFe2O4 are present in the P3ABA/GO/CoFe2O4 composite spectrum, confirming that P3ABA chains were incorporated at the edges of GO sheets and CoFe2O4. The peak observed at 576 cm−1 (Co − O − Fe) and the broad band between 3433 and 2755 cm−1 (Fe − O—C, or Co − O—C) indicates the presence CoFe2O4 and GO sheet (O—H) in the polymer composite (associated with the N—H of P3ABA). The interaction between the P3ABA structure and functional groups on the surface of GO (–COOH, –OH, and epoxy group) and CoFe2O4 can be achieved through electrostatic, π-π, and hydrogen-bonding interactions, as illustrated in Fig. 2. After adsorption, the peaks of CR (Fig. 3b, red line) are observed in the P3ABA/GO/CoFe2O4 composite (Fig. 3b, brown line), and due to electrostatic, hydrogen-bonding, and π-π interactions the majority of peaks are shifted to higher wavenumber in all nanocomposites compared to those seen in the P3ABA/GO/CoFe2O4 composite alone, indicating the occurrence of physiochemical interactions between the CR dye and polymer nanocomposites.
3.1.2 X-ray diffraction analysis
The crystalline structure was investigated via X-ray diffraction (XRD), as depicted in Fig. 4. It can be seen that graphene oxide (black line) shows broad and weak peaks located at 23.7° and 43.2°, which are attributed to the (0 0 2) and (1 0 0) reflections, respectively, and which are in agreement with those obtained in previous studies (Sun et al., 2020, Kooti et al., 2021). For the CoFe2O4 sample, the diffraction peaks located around at 2θ = 30.45°, 35.88°, 38.00°, 43.56°, 54.17°, 57.59°, 63.16°, and 75.1° are ascribed to the (2 2 0), (3 1 1), (2 2 2), (4 0 0), (4 2 2), (5 1 1), (4 4 0), and (5 3 3) crystalline planes, respectively, suggesting strong crystallization in the structure of CoFe2O4, as reported in the literature (Kim et al., 2016, Kooti et al., 2021). The XRD of P3ABA pattern exhibits an amorphous structure, showing two diffraction peaks at 2θ = 18.18° and 26.1° (blue line) attributed to the (0 2 0) and (2 0 0) crystal planes, which is similar to the XRD spectra of polyaniline in previous work. Comparing the functional groups of GO, CoFe2O4, and P3ABA samples with the sample of P3ABA/GO/CoFe2O4 composite, all XRD peaks associated with GO, CoFe2O4, and P3ABA were present in the P3ABA/GO/CoFe2O4 composite sample. Furthermore, in the P3ABA/GO/CoFe2O4 composite, the diffraction peak for the P3ABA become shaper at 2θ = 18.52° while the peaks associated GO and CoF2O4 interacted to produce a high intensity peak at 43.44°, suggesting an increased crystallinity in the P3ABA/GO/CoFe2O4 composite. Thus, these indicated that P3ABA had successfully interacted with GO, CoFe2O4, and the structure of the P3ABA/GO/CoFe2O4 composite was preserved without changes in the crystal planes except for slight shifts in positions and differences in the intensities of the associated XRD peaks compared to those found in the individual GO, CoFe2O4, and P3ABA samples. In summary, these results confirm that GO and CoFe2O4 was successfully coated with P3ABA, which is in accordance with the FTIR results.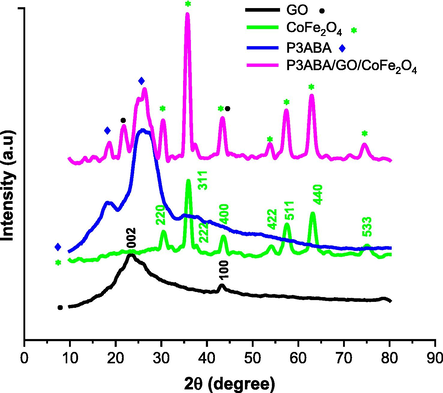
XRD spectra of GO, CoF2O4, P3ABA, and the P3ABA/GO/CoFe2O4 composite. Each color indicates a typical sample (see graph keys).
3.1.3 Thermogravimetric analysis (TGA)
Fig. 5 illustrates TGA and DTG (derivative of TGA) curves for the P3ABA and P3ABA/GO/CoFe2O4 composite samples. From the TGA curves in this figure, we can see that there are three regions where weight loss occurs. This observation is similar to the findings reported in the literature (Abd Ali et al., 2021), where P3ABA showed an initial weight loss of 5.8 % at 83 °C, while the P3ABA/GO/CoFe2O4 composite showed a 4.9 % weight loss at 89 °C. This can be attributed to the removal of moisture from the surfaces of the polymeric materials. The second phase of weight loss for P3ABA occurred at 222 °C with a considerable weight loss of around 12.3 %; however, the weight loss for the P3ABA/GO/CoFe2O4 composite at this stage was found to be 13.8 % at 276 °C. The weight loss at this stage is related to the loss of the dopant anion in both cases. The final weight loss for P3ABA occurred at 503 °C with a loss of 37.1 %, while for the P3ABA/GO/CoFe2O4 composite a loss of 19.1 % at 522 °C was observed, which can be attributed in each case to the degradation of the polymer backbone. The small peak (Fig. 5b) at 768 °C for P3ABA/GO/CoFe2O4 composite could be related to metal oxides present in the polymer nanocomposite. The relative total weight losses up to 1000 °C at the end of experiment stage were found to be 66 % and 51.5 % for the pure P3ABA and P3ABA/GO/CoFe2O4 composite, respectively. These data indicate that the thermal stability of the P3ABA/GO/CoFe2O4 composite has been improved due to the interactions between the functional groups (amine, carboxyl, hydroxyl, epoxy group, and CoFe2O4) present in the structure of the P3ABA/GO/CoFe2O4 nanocomposite.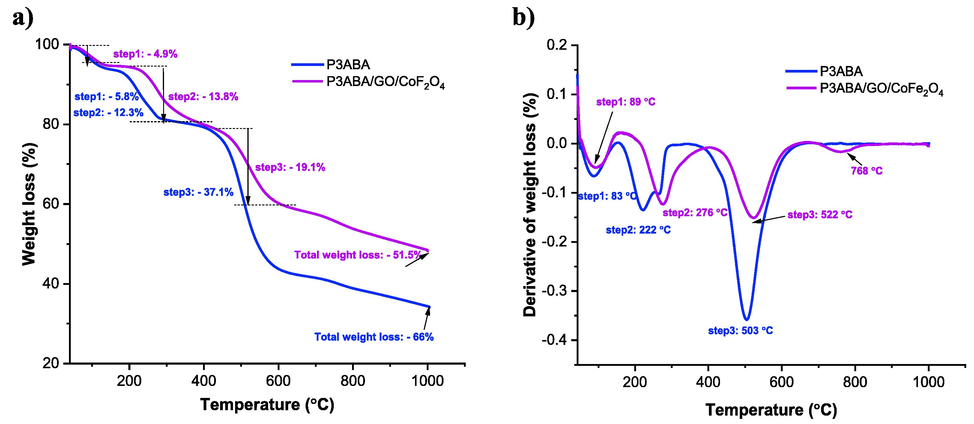
a) TGA and b) DTG curves for P3ABA and the P3ABA/GO/Fe2O4 composite. Each color indicates a typical sample (see graph keys).
3.1.4 Pore size distribution BET analysis
The specific surface areas and porosity characteristics of samples were determined from nitrogen adsorption–desorption isotherms using the BET technique and the BJH method, as depicted in Fig. 6. The surface characterization for pure P3ABA, CoFe2O4, and the P3ABA/GO/Fe2O4 nanocomposite is shown in Table 2. As shown in Fig. 6a, the hysteresis loops for P3ABA and P3ABA/GO/Fe2O4 at relative pressures (P/P0) were around 0.75 and 0.81, respectively, suggesting the mesoporosity of the structures of both samples. The specific surface area, total pore volume, and mean pore diameters for pure P3ABA were found to be 22.50 m2/g, 0.026 cm3 g−1, and 18.14 nm, respectively. However, for the P3ABA/GO/Fe2O4 nanocomposite, the specific surface area, total pore volume, and mean pore diameters were 51.61 m2/g, 0.163 cm3 g−1, and 30.25 nm, respectively, indicating that the adsorbents exhibit mesoporous behavior (note that a material containing pores with diameters of less than 2 nm is referred to as having macropores, between 2 and 50 nm as having mesopores, while>50 nm as having macropores (Kim et al., 2016). According to the BJH plot (Fig. 6b), the pore size distribution for the polymer nanocomposite was in the range of 1 to 100 nm, indicating to there are two groups of pores as follows: (i) from 2 to 50 nm is attributed to the mesopore range (most pores fall within this range), and (ii) from 50 to 100 nm is related to the macropore range. It is apparent that the fabrication of P3ABA with GO and CoFe2O4 led to a decrease to mesoporous characteristics, somewhat owing to pore blockage. However, the coating of P3ABA on the surface of GO and CoFe2O4 led to an increase in surface area and total pore volume, making a significant improvement to the porosity and better adsorption performance compared to the P3ABA homopolymer, as shown in Table 1, where a large pore size facilitates the binding of dye molecules onto the surface of adsorbent. This could be attributed to the change in the growth orientation and morphology of the surface of the P3ABA/GO/Fe2O4 nanocomposite, which is agreement with the TEM data (Fig. 9). It can be concluded that the P3ABA/GO/Fe2O4 nanocomposite plays a significant role in the extraction of the dyes due to its enhanced porosity and surface area characteristics, as well as the presence of a large number of functional groups.
a) Nitrogen adsorption–desorption isotherms, and b) pore size distributions for the P3ABA and P3ABA/GO/CoFe2O4 nanocomposite samples.
Sample
BET surface area (m2/g)
Total pore volume (cm3/g)
Mean pore diameter (nm)
CoFe2O4
32.28
0.172
15.2
P3ABA
22.50
0.026
18.14
P3ABA/GO/CoFe2O4
51.61
0.163
30.25
3.1.5 Morphology and microstructural analysis
The surface morphologies of GO, CoF2O4, P3ABA, and the P3ABA/GO/CoFe2O4 nanocomposite were studied using scanning electron microscopy (SEM), as shown in Fig. 7. Fig. 7a shows the SEM image of GO sheets, which illustrate a homogeneous surface with thin layers and crumpled edges, while the SEM image of CoFe2O4 in Fig. 7b exhibits two irregular regions related to identified elements of Fe and Co, aggregated magnetic sphere-shaped regions with grain sizes in the nanometer range (∼15 nm). The typical morphology of pure P3ABA (Fig. 7c) was observed to be a homogeneous and network-shaped with porous surfaces and a chain thickness of about 20 nm. However, the surface morphology of the P3ABA/GO/CoFe2O4 nanocomposite is completely changed when P3AB is incorporated with GO and CoF2O4 nanoparticles, as observed in Fig. 7d. In addition, the surface of the nanocomposite sample clearly indicates irregular porosity with a rough surface showing the grafting of CoF2O4, and P3ABA onto the surface of the GO, resulting in aggregation and the formation of a network structure. This change in the morphology of P3ABA/GO/CoFe2O4 occurs due to the electrostatic, π-π, and hydrogen-bonding interactions between the CoF2O4, GO sheets, and P3ABA/GO/CoFe2O4, which are the result of the presence of large active functional groups in the structure of the composite such as hydroxyls, epoxies, amines, and carboxyls, in addition to electrostatic forces. The morphology of the P3ABA/GO/CoFe2O4 nanostructure could be one of significant parameters for improving adsorption of dye, which is consistent with pore features such as specific surface area.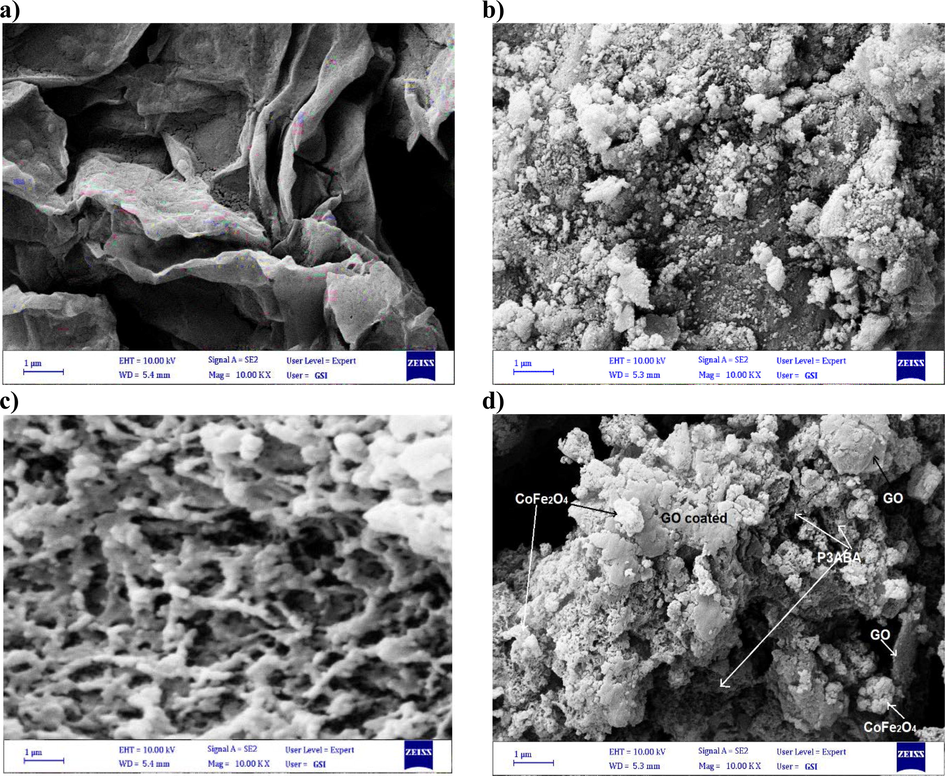
SEM images of a) GO, b) CoFe2O4, c) P3ABA, and d) the P3ABA/GO/CoFe2O4 nanocomposite.
EDX was also used to assess the chemical content of the P3ABA/GO/CoFe2O4 nanostructure, as depicted in Fig. 8. The chemical analysis of P3ABA/GO/CoFe2O4 nano-adsorbent was investigated using mapping and peak lines, the results of which indicate an atomic composition of 47 % C, 6 % N, 15 % O, 22 % Fe, and 10 % Co, indicating that the prepared P3ABA/GO/CoFe2O4 had good homogeneity. This result is consistent with the FTIR and XRD results, confirming the successful synthesis of P3ABA/GO/CoFe2O4.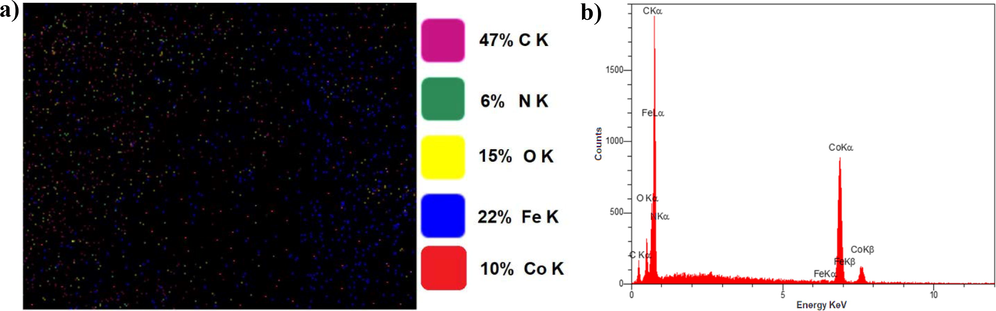
EDX images for a) elemental mapping, and b) peak line analysis of the P3ABA/GO/CoFe2O4 nanocomposite.
The transmission electron microscopy (TEM) images of GO, CoFe2O4, P3ABA, and the P3ABA/GO/CoFe2O4 nanocomposite were studied, as per the data displayed in Fig. 9. The TEM image of GO (Fig. 9a) shows a thin and transparent layer due to the occurrence of GO exfoliation during its chemical fabrication from graphite. Fig. 9b exhibits clear uniform oval-shaped squashed-sphere nanoparticles of CoFe2O4 with a few aggregation particles and an average diameter of about 15 nm. In the case of the P3ABA image, the TEM result suggests an agglomerated nanoparticle morphology, as can be seen in Fig. 9c. The TEM image of P3ABA/GO/CoFe2O4, depicted in Fig. 9d-f, reveals that the P3ABA and CoFe2O4 nanoparticles deposited on the surface of GO sheets had different sizes and aggregation distributions due to the magnetic property, confirming the occurrence of the interaction between the components (GO with P3ABA and CoFe2O4 nanoparticles).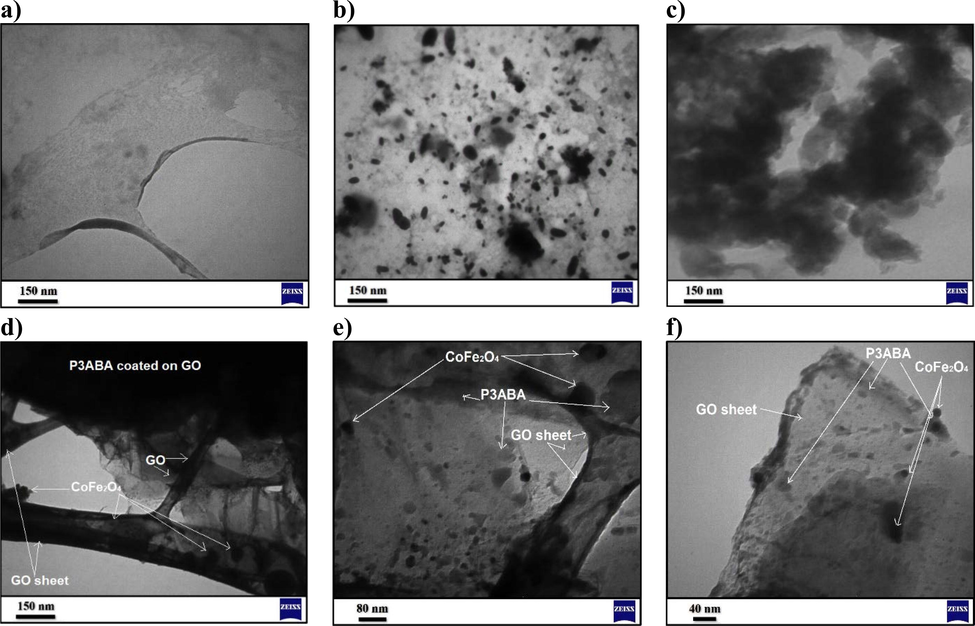
TEM images for a) GO sheet, b) CoFe2O4 nanoparticles, c) P3ABA, and (d-f) the P3ABA/GO/CoFe2O4 nanocomposite at different magnifications.
3.1.6 Electromagnetic shielding performance
The characterization of magnetic behavior for pure CoFe2O4 and the P3ABA/GO/CoFe2O4 nanocomposite was investigated using a vibrating sample magnetometer (VSM) from −15000 to 15,000 Oe at 298 K. Fig. 10a shows the magnetization curve for pure CoFe2O4 and the P3ABA/GO/CoFe2O4 nanocomposite. Both samples exhibit the magnetic properties in their behaviors throughout typical hysteresis loops. The saturation magnetization (Ms), remanent magnetization (Mr), and coercivity (Hc) for CoFe2O4 are 34.39 emu/g, 14.49 emu/g, and 353.51 Oe, respectively, whereas for the P3ABA/GO/CoFe2O4 nanocomposite these are 13.62 emu/g, 1.21 emu/g, and 17.13 Oe, respectively. These data are also consistent with previous studies (Hafeez et al., 2019, Chandel et al., 2020). The decrease in the magnetic properties of the P3ABA/GO/CoFe2O4 nanocomposite correspond to the strong interfacial interaction between GO and P3ABA with CoFe2O4, which indicates that the properties of magnetic CoFe2O4 were present in the P3ABA/GO/CoFe2O4 nanocomposite to some extent. In addition, and as shown in Fig. 10b, the P3ABA/GO/CoFe2O4 nanocomposite adsorbent can easily attracted by an external magnetic field to allow the separation of the adsorbent from the suspended system after adsorption of dye.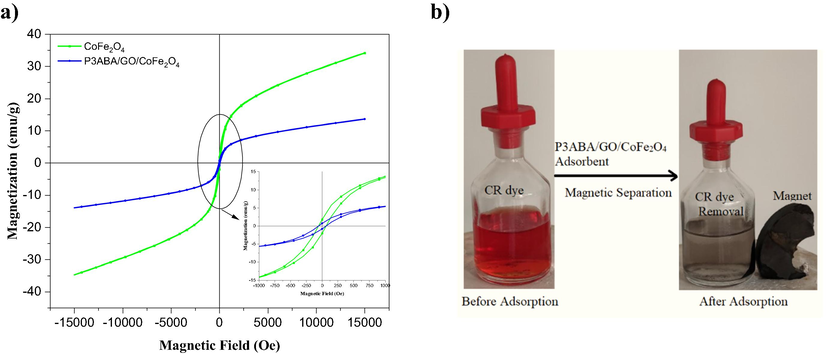
a) VSM magnetization curve of CoFe2O4 (green line) nanomagnetic and the adsorbent of the P3ABA/GO/CoFe2O4 nanocomposite (blue line). b) shows the dye solution before and after the adsorption process and the separation of the P3ABA/GO/CoFe2O4 nanocomposite using an external magnet.
3.2 Impact of diverse factors on the CR dye adsorption process.
3.2.1 Impact of initial solution pH
The initial solution pH is an important factor in the elimination mechanism of dye from the liquid solution. Also, the pH of the solution influences the charge of any pollutants, and the activity of any functional groups in the adsorbent and thus the adsorbent’s capacity. The protonation of the adsorbed surface groups differs at acidic and basic pH, which may relate to the anionic structure of the CR dye. It is well known that, firstly, with increasing pH, the elimination rate (E %) in CR improved, reaching its maximum at pH 5, which is 98.3 % (Fig. 11a). Then, as the pH increases (pH > 5.0), the elimination rate declines considerably, which could be attributable to the deprotonation of the adsorbent surface, as shown in Fig. 1a. It may be possible that an anionic CR dye (neutrally charged in the basic medium, as shown in Fig. 1b) and neutrally charged adsorbent experience a decreased attraction to each other electrostatically, limiting adsorption between them in comparison to other interactions such as π-π and hydrogen bonding, and therefore the elimination rate steadily declined with increasing pH > 5. Finally, the minimum elimination rate was reached at pH 10 (E % = 48.22 %). At a pH of around 5 to 6.45 (pH < pHZPC), the CR dye experiences its highest removal efficiency at pH 5. This is because of imine and amine groups on the surface of P3ABA/GO/CoFe2O4 becoming protonated, which leading to an increase in electrostatic attraction between the CR dye (negatively charged) and the positively charged sites of the P3ABA/GO/CoFe2O4 adsorbent, in addition to other interactions such as π-π and hydrogen bonding. However, at the lowest pH of around 4 to 2 (pH less than 5), the large amount of Cl- produced under these pH conditions (Cl- released from addition of the required amount of 0.1 N HCl to adjust pH) might compete with the anionic dye (CR) for the adsorption sites on imine and amine groups presented on the adsorbent surface, leading to an associated decline in CR adsorption. Therefore, the π–π interaction between CR and P3ABA/GO/CoFe2O4 is of most significance in the adsorption process (Wang et al., 2018, Karim et al., 2022). The pH that results in a zero net charge is termed the zero-point charge (ZPC). The ZPC is a significant factor frequently employed to describe the adsorption properties of materials (Koohi et al., 2021). In this test, the pHZPC is 6.45 (Fig. 10b). Therefore, for this reason the surface charge of the P3ABA/GO/CoFe2O4 nanocomposite would be positive below pHZPC, and neutrally charged above it (pH > 6.45), as shown in Fig. 1a. Therefore, when pH < pHZPC, the adsorbent would be favorable for CR anionic dye adsorption due to the dye being negatively charged (Fig. 1b); as pH increases (pH > pHZPC) the adsorption of CR dyes from the solution will accordingly decline.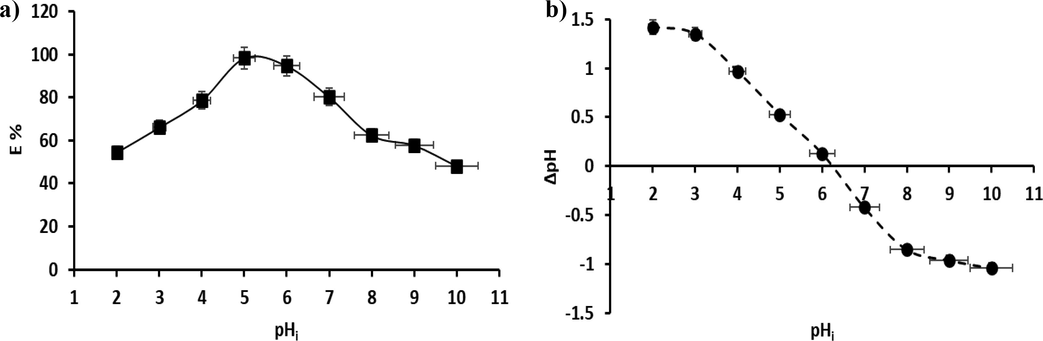
a) The impact of initial pH of the solution (2–10), b) the study of the pHZPC of the P3ABA/GO/CoFe2O4 nanocomposite adsorbent.
The complicated mechanisms involved in the adsorption of CR dye molecules, as well as the P3ABA/GO/CoFe2O4 nanocomposite adsorbent, can involve mechanisms such as π-π interactions and hydrogen bonding, in addition to electrostatic interaction. To understand the adsorption mechanism of the P3ABA/GO/CoFe2O4 nanocomposite for the CR dye, a plausible diagram for the P3ABA/GO/CoFe2O4 nanocomposite with the CR dye can be constructed, as depicted in Fig. 12. Certainly, the interpretation of these tendencies can be basically dependent on the value of pHZPC, the nature of the chemical structure of the adsorbate, the surface chemistry of the adsorbent, and the adsorption conditions (Doan et al., 2021), where CR dyes are negatively charged and the P3ABA in P3ABA/GO/CoFe2O4 nanocomposite is positively charged when pH < pHZPC. Therefore, reasonable mechanisms for CR adsorption onto the surface of P3ABA/GO/CoFe2O4 nanocomposite are as follows: (i) a π-π interaction between the aromatic rings of the CR molecules and π electrons in the P3ABA/GO/CoFe2O4 nanocomposite construction, containing charge transfer, scattering force, and polar electrostatic, (ii) an electrostatic interaction between the net positive charge of the P3ABA/GO/CoFe2O4 nanocomposite adsorbent at a pH less than pHZPC and anionic construction of CR dye in liquid solutions, and (iii) other functional groups in the P3ABA/GO/CoFe2O4 nanocomposite containing oxygen (–OH, –COOH, –CO) that could form hydrogen bonding interactions with nitrogen and oxygen present in the structure of CR dye, which play a crucial role in the adsorption mechanism of dye onto the adsorbent surface (P3ABA/GO/CoFe2O4).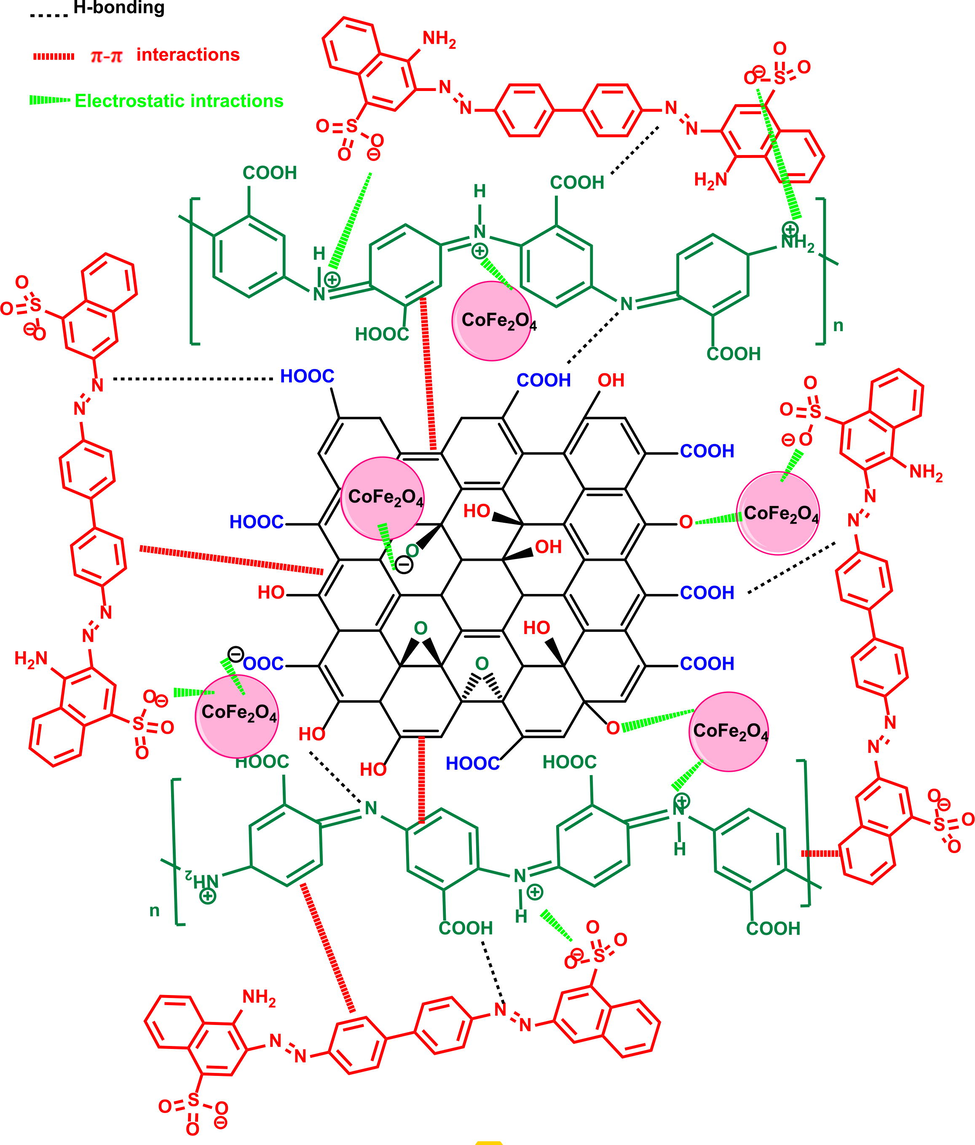
Reaction scheme for the P3ABA/GO/CoFe2O4 nanocomposite with the CR dye during the adsorption process.
3.2.2 Impact of nanocomposite adsorbent dosage
In the adsorption method, the adsorbent dosage is a significant practical factor that has important effects on the elimination rate, and thus shows whether the batch process is cost-effective or otherwise. The impact of nanocomposite adsorbent dosage was made apparent via an adsorbent dosage of 10–70 mg by keeping other affecting influences constant (conditions: initial pH 5; V = 100 mL; initial CCR = 50 mg/L; T = 298 K, t = 60 min). The details of the adsorbent dosage variants in the elimination rate of the P3ABA/GO/CoFe2O4 nanocomposite are presented in Fig. 13a.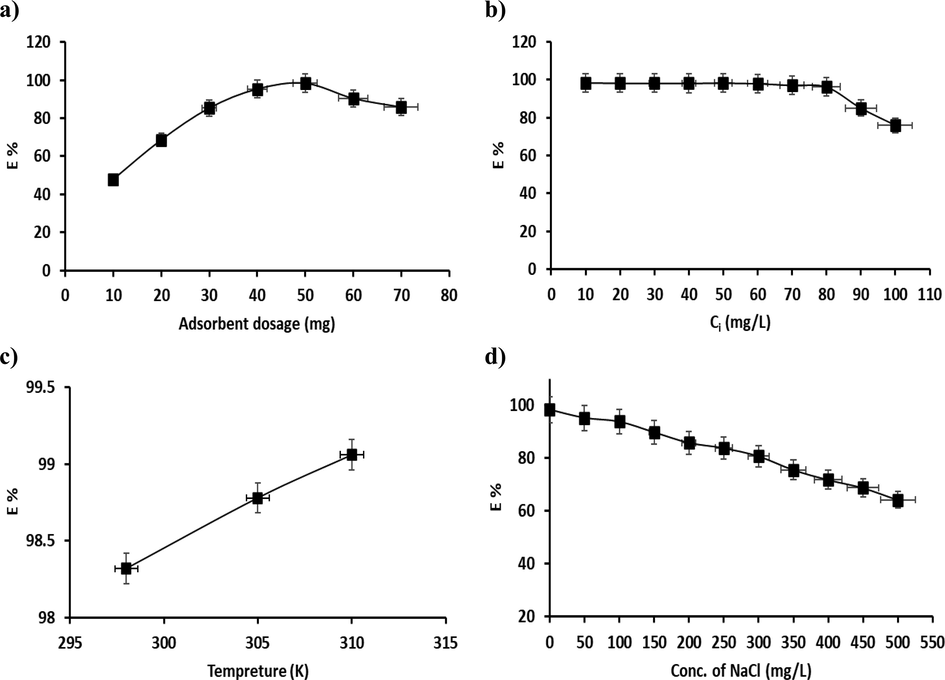
Effects of a) adsorbent dosage (10 to 70 mg), b) initial CR dye concentration (10–100 mg/L), c) reaction temperature (298–310 K), d) addition of salt (0–500 mg/L) on the elimination rate of CR dye.
The data obtained showed that on increasing the nanocomposite adsorbent dosage, the elimination rate improved from 47.89 % to 98.42 % on increasing the amount of nanocomposite adsorbent from 10 mg to 50 mg, which indicates that the number of adsorbent particles improved with increasing nanocomposite adsorbent dose, further indicating that the surface area and number of active sites increased during dye adsorption (Yu et al., 2021), which then reaches a maximum at the adsorption equilibrium. However, the elimination rate slightly decreased after this point (i.e., after 50 mg) due to the accumulation of adsorbents (Fig. 13a). In the other words, it means aggregation of adsorbents in excess to the amount of the adsorbent leads to a decrease in the adsorption capacity, which could result from a decrease in the total surface area of the adsorbent.
3.2.3 Impact of initial concentrations of CR dye
Initial concentration variations are one of the key factors in equilibrium studies and for achieving optimized studies to improve the relevant values between pollutants in aqueous solution as well as adsorbents. Fig. 13b explains why the dye elimination rate decreased from 98.4 to 75.9 % with an increase in initial solution concentration from 10 to 100 mg/L (other conditions: initial pH 5; V = 100 mL; dosage = 50 mg; T = 298 K, t = 60 min). By increasing the concentration of the solution, the ion potential transfer to the adsorbent surface increases as a result of the high abundance of the functional groups on the adsorbent surface and the increase in driving forces or a high diffusion of CR dye molecules from solution onto the surface of adsorbent. However, at high dye concentrations, the competition between dye molecules for the reduced abundance of active site could be the main reason for a decline in the percentage removal of dye. It can be concluded that by increasing the initial concentration of CR dye in solution, the elimination rate will increase until finally reaching a maximum, which can decrease the number of active adsorption sites and their saturation with increasing solute concentration (Zhou et al., 2019).
3.2.4 Impact of reaction temperature
In general, one can predict that with the increase in temperature associated with the increase in velocity, as well as the diffusion of dye ions from the solution to the surface of the adsorbent, that a significant increase in the rate of the elimination reaction will be observed. The temperature of a reaction is a significant factor that can produce a change in the removal system. The temperature of the reaction was used with a dose of 50 mg of adsorbent in 50 mg/L of solution containing CR dye at an initial pH 5 for a time of 60 min. Fig. 13c shows the impact of temperature on elimination of CR dye via the P3ABA/GO/CoFe2O4 nanocomposite. It can be determined that with an increase in temperature from 298 to 310 K, the elimination rate (E %) increased slightly from 98.32 to 99.06 %, and thus the method used in this study is endothermic in nature (Koohi et al., 2021). The maximum elimination rate was found at 310 K, at 99.06 %.
3.2.5 Impact of salt addition
The impact of salt addition on the rate of elimination of CR dye via the P3ABA/GO/CoFe2O4 nanocomposite was investigated under optimal conditions (pH 5, dosage = 50 mg, T = 298 K, and 100 mL of 50 mg/L CR solution). NaCl concentration was adjusted from 0 to 500 mg/L in steps of 50 mg/L. As illustrated in Fig. 13d, the elimination rate reduced from 98.32 % to 64.18 % as the salt concentration was increased from 0 to 500 mg/L. These data may attribute to the competition between Cl– (from NaCl) and CR anions for the active sorption sites (Wu et al., 2020). It can be concluded that the rate of elimination of CR dye is significantly affected by the ionic strength of the saline aqueous liquor due to the reduction of the electrostatic interaction between CR and the adsorbent.
3.2.6 Impact of reaction time
The equilibrium reaction time of the adsorption method, in addition to the rate at which equilibrium is reached, are vital to characterizing the adsorption mechanism. Not only should an adsorbent quickly reach equilibrium, but the equilibrium itself should be as heavily biased towards adsorption as possible. In order to realize the reaction time for an increased CR dye adsorption process, the test was carried out via an adsorbent dosage of 50 mg with different initial concentrations of CR dye (10, 40, and 80 mg/L solution) at pH 5, The impact of reaction time on the rate of elimination of CR dye by the P3ABA/GO/CoFe2O4 nanocomposite is shown in Fig. 14a. When equilibrium was achieved, the concentration of CR dye remaining in the solution was determined. As can be seen, due to the availability of large functional sites, the adsorption rate was very fast in the first 5–50 min of the reaction. After 60 min, only a small further change in the adsorption capacity was detected, as the process moved towards equilibrium.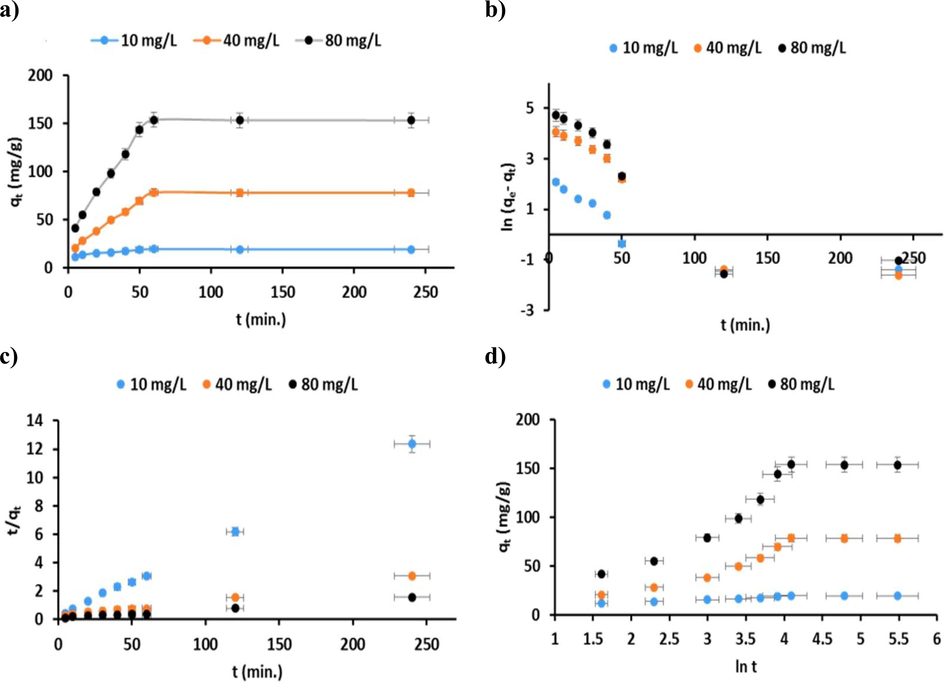
a) Impact of reaction time; fitting the adsorption kinetics plots for CR dye for P3ABA/GO/CoFe2O4 nanocomposite adsorbent: b) pseudo-first order model; c) pseudo-second order model; and d) Elovich model (conditions: initial pH 5; dosage = 50 mg; V = 100 mL; initial CCR = 10, 40, and 80 mg/L; T = 298 K).
After equilibrium has been achieved, increasing the reaction time will have no effect on adsorption. Past equilibrium, the sites on the surface of the adsorbents will have been filled, and the diffusion of the remaining ions in the solution, as well as the bonding with the adsorbent, becomes increasingly difficult. The illustrations demonstrated that the rapid reaction was essentially completed within 50 min, and that equilibrium had been reached after 60 min (dual step) (Abdul Rahim et al., 2021). The optimal time for proper adsorption for the P3ABA/GO/CoFe2O4 nanocomposite is thus considered to be 60 min.
3.3 Statistical analysis and model fitting
In this study, the response surface methodology (RSM) was used to determine the main interaction effects and to optimize the number of the various process experiments using the Design-Expert 13.0.1 software, the results of which are shown in Figures S1-S2 and Tables S1-S10.
3.4 Adsorption modelling study
3.4.1 Kinetics modelling study
To observe the adsorption process of the CR dye kinetically, three different initial concentration of CR dyes (10, 40 and 80 mg/L) were used and the linear form of the pseudo-first order (PFO) model (Lagergren 1898) was applied:
From Equation (5), qe and qt refer to dye adsorbed per unit weight of P3ABA/GO/CoFe2O4 nanocomposite at equilibrium (mg/g) and at time t (min), respectively. k1 (min− 1) defines the rate constants of adsorption for the PFO model, where the magnitude of k1 can be identified from the linear plots between ln(qe−qt) against t (Fig. 14b), from the results observed in Table 3; obviously, lower correlation coefficients (R2) were found, so the experimental results of the adsorption method are not obeyed entirely by the PFO model. The results were then validated by a pseudo-second order (PSO) kinetics model (McKay et al., 1999).
Kinetic models
Factors
Initial CR dye concentration
10 mg/L
40 mg/L
80 mg/L
Pseudo-first order
qm (exp.) (mg/g)
19.68
78.48
153.92
k1 (1/min)
0.0149
0.027
0.0281
qe cal.(mg/g)
4.0828
49.0872
83.6130
R2
0.7067
0.8514
0.7798
χ2
59.584
17.6000
59.1184
SSE
243.272
863.936
4943.074
Pseudo-second order
k2 (mg/g.min)
0.01245
0.00069
0.00039
qe cal.(mg/g)
19.8807
85.4700
166.666
h (mg/g min)
4.92368
5.09683
10.8577
R2
0.9993
0.9928
0.9929
χ2
0.002
0.57166
0.97388
SSE
0.04
48.8601
162.3076
Elovich
α (mg/g.min)
122.846
28.9017
52.0956
β (g/mg)
0.44899
0.05597
0.02871
R2
0.8707
0.8879
0.8754
From Equation (6), k2 (mg/g. min) expresses the rate constants for PSO kinetic models at 298 K. Both k2 and qe can be determined from the intercept as well as the gradient of the plot of t/qt against t, as shown in Fig. 14c. From the results summarized in Table 3, the correlation coefficient for PSO (R2 > 0.992) for the three initial CR dye concentrations showed that the kinetic experimental adsorption results were a better fit to the theoretical results obtained from the PSO model; furthermore, the results shown from the PSO are in agreement with the adsorption kinetic results through comparing the experimentally determined adsorption capacity qm (exp.) (mg/g) and the calculated adsorption capacity qe cal. (mg/g). In addition, the low statistical errors according to the χ2 and SSE tests revealed that the PSO model is a better fit for the adsorption of CR dye onto the P3ABA/GO/CoFe2O4 nanocomposite adsorbent.
Moreover, the Elovich model (Equation (7))(Elovich and Zhabrova 1939) is one of the most useful for describing the chemical adsorption process, where adsorption sites can evolve exponentially, as well as α and β being the two coefficients of the equation that can be computed from the gradient and intercepts of the linear plots between qt vs ln t, as presented in Fig. 13d. Further, the Elovich model describes multilayer adsorption. Table 3 reports the factors calculated for the Elovich model for CR dye at three different initial concentrations (10, 40, and 80 mg/L).
3.4.2 Isothermal modelling study
The experimental results for CR dye adsorption, in addition to the homogeneous and heterogeneous nature of the adsorbent, were predicted using three different theoretical models: the Langmuir (Langmuir 1916), Freundlich (Freundlich 1907), and the Temkin (Tempkin and Pyzhev 1940). Isotherms adsorption studies were performed at initial CR dye concentrations in the range of 10 to 100 mg/L at three separate temperatures 298, 305, and 310 K (Fig. 15a). The Langmuir model is assumed to be the structure of adsorbate molecules on a homogeneous surface of the adsorbent. The linear mathematical expression for the Langmuir model (Equation (8)) can be given as:
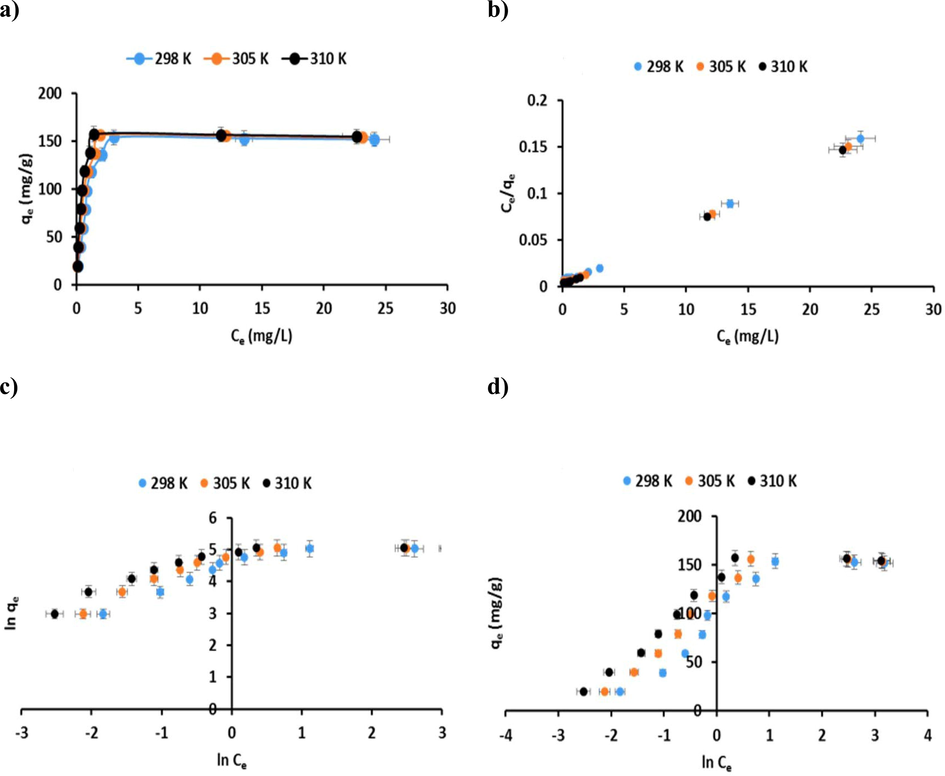
a) Adsorption isotherms of CR dye onto the P3ABA/GO/CoFe2O4 nanocomposite adsorbent (conditions: initial pH 5; dosage = 50 mg; V = 100 mL; reaction time = 60 min; T = 298, 305, and 310 K); fitting the adsorption isotherm plots for CR dye on the P3ABA/GO/CoFe2O4 nanocomposite adsorbent: (b) Langmuir isotherm model; (c) Freundlich isotherm model; and (d) Temkin isotherm model.
Ce refers to the concentration (in mg/L) of CR dye uptake by the P3ABA/GO/CoFe2O4 nanocomposite adsorbent at equilibrium, qe is the equilibrium capacity of CR dye (mg/g), kL (L/mg) is the Langmuir isotherm constant associated with the binding energy between the adsorbate molecules (CR dye) and the P3ABA/GO/CoFe2O4 nanocomposite adsorbent, and qmax is the maximum adsorption capacity of the adsorbent (mg/g). A straight line can be acquired when Ce/qe is plotted against Ce, as illustrated in Fig. 15b. qmax and kL were determined from the gradient and intercepts of this graph, and the parameters so obtained are summarized in Table 4. The Langmuir separation factor, RL (RL = 1/1 + KLCi), was utilized to estimate the suitability of the adsorption process isothermally, where the computed value of RL was in the range 0 < RL less than 1 (summarized in Table 4), which shows that adsorption of CR dye via the P3ABA/GO/CoFe2O4 nanocomposite adsorbent is a favorable process. The linear mathematical expression of the Freundlich model (Equation (9)) can be given as:
Isotherm models
Factor
Temperatures of reaction
298 K
305 K
310 K
Langmuir
qm (exp.) (mg/g)
153.92
156.18
157.16
qm (mg/g)
156.25
158.73
156.25
KL(L/mg)
1.561
2.423
3.555
RL range
0.006–0.060
0.004–0.039
0.002–0.027
R2
0.9980
0.9989
0.9995
χ2
0.03474
0.0409
0.00529
SSE
5.4289
6.5025
0.8281
Freundlich
KF (mg/g (L/mg)1/n)
73.69
84.25
92.53
n
2.717
2.977
3.251
R2
0.7012
0.6718
0.6591
χ2
4069.712
4498.869
4665.929
SSE
22052.63
22832.66
23163.50
Temkin
A
89.466
100.18
107.81
B
28.539
26.677
24.60
R2
0.8072
0.7909
0.7780
where Kf (mg/g (L/mg)1/n) is the Freundlich coefficient, Ce characterizes the adsorbate concentration, qe is the amount of CR dye adsorbed at equilibrium, while n refers to Freundlich heterogeneity constant. In Fig. 15c, both Kf and n can be determined from a plot of ln qe against ln Ce. The value of the constant n is frequently applied to indicate the suitability of the adsorption process. The calculated values of n are in the range from 1 to 10 (Table 4), which indicates a favorable adsorption of CR dye on the P3ABA/GO/CoFe2O4 nanocomposite. This agrees well with the results for RL (see Table 4).
The Temkin isotherm model (Equation (10)) considers the relationships between the adsorbent and the adsorbate as well as managing a linear decline in the adsorption energy across the surface coverage of the adsorbent. The linear mathematical expression of the Temkin model (Equation (10)) can be given as:
where A refers to the Temkin equilibrium binding constant (L/g), and B is the heat of adsorption constant in J/mol. Both constants A and B can be determined from a plot of qe against ln Ce (Fig. 15d). The isotherm factors for the adsorption of CR dye are reported in Table 4. Based on the values of R2 at three different temperatures (Table 4), it can be assumed that the results of the Langmuir adsorption model were in best agreement with the experimental results. Furthermore, it was recognized from the χ2 and SSE tests that the Langmuir model characterized the best fitting for adsorption CR dye on the P3ABA/GO/CoFe2O4 nanocomposite adsorbent (Table 4). In addition, the monolayer maximum adsorption capacities of the CR dye calculated from the Langmuir adsorption isotherm qmax were very close to the actual experimental values. Furthermore, in this work, non-linear least-squares (NLLS) adjustments were applied for the kinetic and isothermal study, the results of which are shown in Figures S3-S4.
3.5 Comparison of the adsorption capacity obtained with other previously reported adsorbents
Compared with other adsorbents previously reported in the literature (shown in Table 5), it can be shown that the maximum adsorption capacity (qmax) of the P3ABA/GO/CoFe2O4 nanocomposite adsorbent has a higher relative adsorption capacity for CR dye than the majority of adsorbents.
Adsorbents
Optimal pH
Contact
Time (min)
Adsorption Capacity
qmax (mg/g)
References
Polyaniline and polypyrrole
6.5
45
50
(Chafai et al., 2017)
CoFe2O4–chitosan composite
2.2
180
15.60
(Simonescu et al., 2021)
Polyaniline-zinc titanate (PANI/ZTO) nanocomposite
5.6
15
64.51
(Singh et al., 2021)
PPy/Fe3O4/SiO2 nanocomposite
3.0
480.0
361
(Alzahrani et al., 2021)
PANI@ZnO nanocomposite
5.0
60
69.82
(Toumi et al., 2022)
pTSA doped polyaniline@graphene
oxide5.0
150
66.66
(Ansari et al., 2017)
polyvinyl alcohol/sodium alginate/
ZSM‑5 zeolite membrane3.0
130
5.33
(Radoor et al., 2020)
wet-torrefied Chlorella sp. microalgal biochar
6.0
240
164.35
(Yu et al., 2021)
Chitosan/UiO66–1
7.0
60
11.76
(Wen et al., 2020)
P3ABA/GO/CoFe2O4 nanocomposite
5.0
60
153.92
Current study
3.6 Thermodynamic analysis
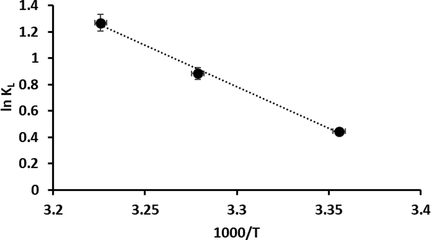
Thermodynamic analysis is necessary to describe the nature of the adsorption method. The thermodynamic behavior of a method is defined by factors such as standard enthalpy change (ΔHo (J/mol K)), standard entropy change (ΔSo (J/mol)), as well as changes in standard Gibbs free energy (ΔGo (J/mol)), which can be determined via the equations below. ΔHo and ΔSo were estimated using the Van’t Hoff equation (Equation (11)) (Maruthapandi et al., 2018):
where KL and R are the Langmuir equilibrium constant (L/mg) and the universal gas constant (8.314 J/mol K), respectively, while T is the absolute temperature (K). Using Fig. 16, ΔHo and ΔSo were determined from the slope and intercept of the linear equation ln (KL) vs 1000/T. ΔGo was determined from Equation (12) at the three temperatures considered (298, 305, and 310 K).
Liner plot of ln kL against 1000/T for CR dye adsorption onto the P3ABA/GO/CoFe2O4 nanocomposite adsorbent.
The activation energy (Ea) offers a fact about the type of adsorption, such as whether it is likely to be physical (0–40 kJ/ mol) or chemical (40–800 kJ/mol) in nature (Kul et al., 2021). The Ea for this adsorption system was computed from the Arrhenius equation, which is given by Equation (13):
where k2 characterizes the adsorption rate constant (g/ mol s), Ea is the activation energy (J/ mol), and A is the Arrhenius factor (g/ mol s). Ea was calculated from the gradient of a plot of ln k2 against 1/T.
For the CR dye-P3ABA/GO/CoFe2O4 nanocomposite system, ΔHo and ΔSo are determined as 52.30 (kJ/mol) and 179.12 (J/mol K), respectively, Moreover, ΔGo was measured as − 1.103 kJ/mol at 298 K, −2.244 kJ/mol at 305 K, and − 3.269 kJ/mol at 310 K. From the above data, the negative value of ΔGo (ΔGo less than 0) and the positive value of ΔHo (ΔHo > 0) indicated that the adsorption of CR dye onto the P3ABA/GO/CoFe2O4 nanocomposite was endothermic in nature. Further, CR dye adsorption is favorable at higher temperatures; moreover, the positive entropy change (ΔSo > 0) indicates an increase in irregularities at the solid–liquid boundary on the heterogeneous adsorbent surface during the adsorption reaction.
The Arrhenius plot for CR adsorption onto the P3ABA/GO/CoFe2O4 nanocomposite is shown in Fig. 17. From this plot, the activation energy (Ea) was determined to be 40.47 kJ/mol for CR dye adsorption onto P3ABA/GO/CoFe2O4 nanocomposite adsorbent. The activation energy was higher than 40 kJ/mol, where this value indicated the fact that the CR dye-P3ABA/GO/CoFe2O4 nanocomposite system proceeded via chemical adsorption.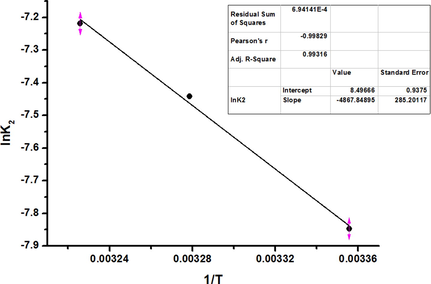
Liner plot of ln k2 against 1/T for CR dye adsorption onto the P3ABA/GO/CoFe2O4 nanocomposite adsorbent.
3.7 Regeneration of P3ABA/GO/CoFe2O4 adsorbent
The recycle evaluation was performed to evaluate the productivity as well as stability of the P3ABA/GO/CoFe2O4 nanocomposite for uptake of CR dye from liquid samples. CR-loaded P3ABA/GO/CoFe2O4 nanocomposite adsorbents were desorbed with 20 mL of 0.1 M NaOH as the desorb agent, as described in section 2.9. The adsorption/desorption cycle was performed five times, over which the elimination rate of CR dye decreased from 98.3 % to 74.4 % (Fig. 18). In contrast, a persistent decrease in the amount of adsorbed and reusability efficiency of the adsorbent may indicate the presence of dye residue remaining on the adsorbent after each reuse, which would lead to a reduction in the availability of vacant adsorption sites.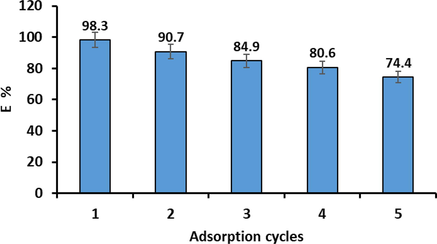
Adsorption cycles of CR dye adsorption by the P3ABA/GO/CoFe2O4 nanocomposite adsorbent (conditions: initial pH 5; dosage = 50 mg; initial CCR = 50 mg/L; V = 100 mL; reaction time = 60 min; T = 298 K).
3.8 Real sample study
In order to assess the practical performance of the synthesized P3ABA/GO/CoFe2O4 nanocomposite adsorbent in the elimination of CR dye in real water samples, local tap water samples were used with different concentrations of CR dye (10, 40 and 80 mg/L) added. The concentration of CR dye was measured after treatment via the P3ABA/GO/CoFe2O4 nanocomposite adsorbent. The associated data are reported in Table 6, which show that the P3ABA/GO/CoFe2O4 nanocomposite adsorbent has a high elimination rate for CR dye in tap water samples. The elimination rates for CR dye from the tap water samples are all above 90 %. This data shows that it would be practicable to employ the P3ABA/GO/CoFe2O4 nanocomposite adsorbent for real-world water usage to simultaneously adsorb CR dye. a: Tap water samples were collected from Koya, Iraq.
Sample a
Add concentrations (mg/L)
Found concentration (mg/L)
Elimination rate
(E %)
Tap water
10
0.87
91.3
40
3.89
90.2
80
7.46
90.6
3.9 The effect of matrix synthetic dyes on the elimination rate
To inspect the efficiency of the prepared nanoadsorbent, in this study, P3ABA/GO/CoFe2O4 nanocomposite was examined in matrix synthetic wastes containing a mixture of cationic and anionic dyes. Fig. 19 illustrates the impact of adding a mixture of anionic and cationic dyes such as methyl orange, methyl red, rhodamine B, and malachite green at various concentrations between 10 and 50 mg/L on the efficiency of CR dye removal by the P3ABA/GO/CoFe2O4 nanoadsorbent. The efficiency of the percentage removal for the P3ABA/GO/CoFe2O4 nanoadsorbent was reduced from 94.55 % to 65.45 % by increasing the concentration of the matrix dyes mixture of 50 mg/L. This reduction in adsorption efficiency could be attributed to the competition of other dye species to adsorb on the surface of the adsorbent, which in turn would affect the surface charge neutralization of the P3ABA/GO/CoFe2O4 nanocomposite, causing the reduction in the adsorption of CR dye molecule by the nanoadsorbent. On the other hand, this reduction in the efficiency of CR dye removal is not particularly drastic, but indicates that the P3ABA/GO/CoFe2O4 nanoadsorbent can successfully remove CR dye from an aqueous solution, even in the presence of high concentrations of other dyes. Therefore, we conclude from these results that the nanoadsorbent (P3ABA/GO/CoFe2O4) can be used effectively to remove different types of dyes to CR that also pollute wastewater in the real world.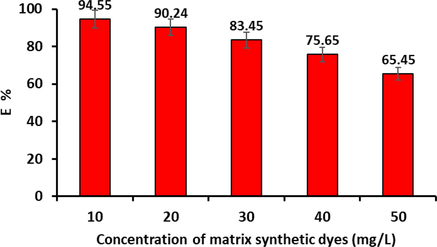
Effect of the concentrations of matrix synthetic dyes on the elimination rate of CR dye onto P3ABA/GO/CoFe2O4 nanoadsorbent (conditions: initial pH 5; dosage = 50 mg; initial CCR = 50 mg/L; V = 100 mL; reaction time = 60 min; T = 298 K).
3.10 Cost analysis
The synthesis low-cost adsorbent is another crucial parameter that should be considered in the remediation of contaminated source waters. The total cost of the preparation of the P3ABA/GO/CoFe2O4 nanocomposite per gram is represented in detail in Table 7. It was found to be nearly 2.96 (USD$) per gram of adsorbent. This is minimal in contrast to the synthesis of chitosan/glutaraldehyde/graphite oxide [15.20 (USD$) per gram], chitosan/glutaraldehyde/FeCl2·4H2O, and FeCl3·6H2O/graphite [6.13 (USD$) per gram] (Gkika et al., 2019), which were used as polymer composite adsorbents, while the commercial costs per gram of graphene oxide powder (50 nm) and magnetic CoFe2O4 from Merck (Sigma Aldrich) are about 479 (USD$) and 20.10 (USD$), respectively. This means that P3ABA/GO/CoFe2O4 is more economic and feasible for use as an adsorbent to remove pollutants such as dyes or other organic and inorganic compounds from wastewater.
Raw material
Cost (USD$) / Amount
Cost (USD$) / Amount used
Cost (USD$) /Yield for GO and CoF2O4
Cost (USD$)/ Yield of adsorbent
Magnet
Cobalt (II)chloride hexahydrate
75 (100 g)
1.785 (5.4 g)
3.11 (1.6 g)
1.50 (0.75 g)
Iron (III) chloride hexahydrate
30 (500 g)
0.324 (2.38 g)
Other regents
–
0.2
Cost of heating and drying
–
0.8
Graphene oxide
Graphite Powder nanoparticle
310 (50 g)
12.4 (2 g)
14.24 (1.9 g)
5.62 (0.75 g)
Hydrogen peroxide
9 (L)
0.036 (4 mL)
Potassium permanganate
110 (Kg)
0.55 (5 g)
Sodium nitrate
150 (Kg)
0.15 (1 g)
Other regents
–
0.2
Cost of heating and drying
–
0.9
Polymerization
3-amino benzoic acid
228 (Kg)
0.684 (3 g)
Ammonium persulfate
110 (Kg)
0.55 (5 g)
Hydrochloric acid
40 (L)
0.8 (20 mL)
Iron (III) chloride hexahydrate
30 (500 g)
0.12 (2 g)
Other regents
–
0.25
Cost of heating and drying
–
1.0
Total of Yield
10.524 (3.55 g)
Total cost per gram
2.96 (1 g)
4 Conclusion
In the present study, the adsorption of an anionic dye (Congo Red) in a batch system has been demonstrated using a new adsorbent of polymer nanocomposite (P3ABA/GO/CoFe2O4) that has magnetic properties. The characterization of pure P3ABA in comparison with the P3ABA/GO/CoFe2O4 adsorbent was carried out using several techniques such as FTIR, XRD, TGA, SEM, TEM, EDX, BET, and VSM. The experimental batch studied the influences of initial pH, adsorbent dosage, initial dye concentration, contact time, temperature, and the addition of salt on the removal of the CR dye.
The adsorption isotherms for the CR dye on the surface of the adsorbent showed the Langmuir isotherm to be the best-fitting model (maximum adsorption capacity, qmax = 153.92 mg/g) at 298 K and with R2 = 0.9980, which indicates monolayer coverage and the homogeneous nature of the adsorption of the CR dye on the adsorbent surface. The study of the adsorption kinetics of dyes on the surface of the adsorbent composite found that the adsorption follows a pseudo-second order (R2 = 0.9993) mechanism. In addition, thermodynamic data showed the adsorption process was endothermic due to the amount of adsorption increasing with increasing temperature, while the free energy for the adsorption of CR dye was negative, suggesting a spontaneous reaction. A real water sample was used to test the P3ABA/GO/CoFe2O4 using tap water and matrix synthetic dye samples containing the CR dye material. In addition, it was found that P3ABA/GO/CoFe2O4 can be reused up to five times to remove dyes using a convenient and straightforward washing process. The cost analysis and reuse of the P3ABA/GO/CoFe2O4 adsorbent showed effective optimal in real/simulated water samples. The development of this adsorbent is expected to be employed for future treatment of water for waste materials.
Acknowledgments
The authors thank Koya University and the University of Raparin for providing the required materials and instruments for this work. The authors acknowledge Dr. Mark Watkins (University of Leicester) for helping with and proofreading the manuscript.
Declaration of Competing Interest
The authors declare that they have no known competing financial interests or personal relationships that could have appeared to influence the work reported in this paper.
References
- A nanocomposite based on polyaniline, nickel and manganese oxides for dye removal from aqueous solutions. Int. J. Environ. Sci. Technol.. 2021;18:2031-2050.
- [CrossRef] [Google Scholar]
- Promising low-cost adsorbent from desiccated coconut waste for removal of Congo red dye from aqueous solution. Water Air Soil Pollut.. 2021;232:357.
- [CrossRef] [Google Scholar]
- Synthesis and fabrication of graphene and graphene oxide: A review. Open J. Compos. Mater.. 2019;9:207.
- [CrossRef] [Google Scholar]
- A Kinetic Study of Removing Methylene Blue from Aqueous Solutions by Modified Electrospun Polyethelene Terephthalate Nanofibres. Egypt. J. Chem.. 2021;64:2803-2813.
- [CrossRef] [Google Scholar]
- A comparative study of the effect of organic dopant ions on the electrochemical and chemical synthesis of the conducting polymers polyaniline, poly (o-toluidine) and poly (o-methoxyaniline) Chem. Pap.. 2021;75:5087-5101.
- [CrossRef] [Google Scholar]
- Immobilization of peroxidase on polypyrrole-cellulose-graphene oxide nanocomposite via non-covalent interactions for the degradation of Reactive Blue 4 dye. Chemosphere.. 2018;202:198-207.
- [CrossRef] [Google Scholar]
- Voltammetric Determination of Hg2+, Zn2+, and Pb2+ Ions Using a PEDOT/NTA-Modified Electrode. ACS Omega.. 2022;7:20405-20419.
- [CrossRef] [Google Scholar]
- Synthesis of polymer-based magnetic nanocomposite for multi-pollutants removal from water. Polymers.. 2021;13:1742.
- [CrossRef] [Google Scholar]
- Anion selective pTSA doped polyaniline@ graphene oxide-multiwalled carbon nanotube composite for Cr (VI) and Congo red adsorption. J. Colloid Interface Sci.. 2017;496:407-415.
- [CrossRef] [Google Scholar]
- Synthesis and characterization of CoFe2O4@SiO2-polyethyleneimine magnetic nanoparticle and its application for ultrasonic-assisted removal of disulfine blue dye from aqueous solution. Arab. J. Chem.. 2020;13:5430-5437.
- [CrossRef] [Google Scholar]
- Synthesis and Characterization of Nano-CoFe2O4 Ferrite: Application to the Adsorption of AG25 Dye in Aqueous Solution. Int J Environ Res.. 2022;16:1-16.
- [CrossRef] [Google Scholar]
- Study of congo red adsorption on the polyaniline and polypyrrole. J. Dispers. Sci. Technol.. 2017;38:832-836.
- [CrossRef] [Google Scholar]
- Magnetically separable ZnO/ZnFe2O4 and ZnO/CoFe2O4 photocatalysts supported onto nitrogen doped graphene for photocatalytic degradation of toxic dyes. Arab. J. Chem.. 2020;13:4324-4340.
- [CrossRef] [Google Scholar]
- Highly efficient removal of methylene blue dye from an aqueous solution using cellulose acetate nanofibrous membranes modified by polydopamine. ACS Omega.. 2020;5:5389-5400.
- [CrossRef] [Google Scholar]
- Adsorption behaviors of modified clays prepared with structurally different surfactants for anionic dyes removal. Environ. Eng. Res.. 2023;28:220076
- [CrossRef] [Google Scholar]
- Adsorptive removal of malachite green and Rhodamine B dyes on Fe3O4/activated carbon composite. Journal of Dispersion Science and Technology.. 2017;38:1556-1562.
- [CrossRef] [Google Scholar]
- Comparative study on adsorption of cationic and anionic dyes by nanomagnetite supported on biochar derived from Eichhornia crassipes and Phragmites australis stems. Environ. Nanotechnol. Monit. Manag.. 2021;16:100569
- [CrossRef] [Google Scholar]
- Hollow Polyaniline Microsphere/MnO2/Fe3O4 Nanocomposites in Adsorptive Removal of Toxic Dyes from Contaminated Water. ACS Appl. Mater. Interfaces.. 2021;13:54324-54338.
- [CrossRef] [Google Scholar]
- Mechanism of the catalytic hydrogenation of ethylene on nickel. I. Kinetics of the process. J. Phys. Chem.. 1939;13:1761.
- [Google Scholar]
- Effective removal of anionic dyes from aqueous solutions by novel polyethylenimine-ozone oxidized hydrochar (PEI-OzHC) adsorbent. Arab. J. Chem.. 2022;15:103757
- [CrossRef] [Google Scholar]
- Synthesis of iron-based magnetic nanocomposites: a review. Arab. J. Chem.. 2021;14:103301
- [CrossRef] [Google Scholar]
- Über die adsorption in lösungen. Zeitschrift für physikalische Chemie.. 1907;57:385-470.
- [Google Scholar]
- Structural, thermal, magnetic and electrical properties of polyaniline/CoFe2O4 nano-composites with special reference to the dye removal capability. J. Inorg. Organomet. Polym.. 2019;29:2197-2213.
- [CrossRef] [Google Scholar]
- Cost estimation of polymeric adsorbents. Polymers.. 2019;11:925.
- [CrossRef]
- Environmentally sustainable synthesis of a CoFe2O4–TiO2/rGO ternary photocatalyst: a highly efficient and stable photocatalyst for high production of hydrogen (solar fuel) ACS Omega.. 2019;4:880-891.
- [CrossRef] [Google Scholar]
- Synthesis and characterization of starch-g-polymethyl methacrylate and their properties as adsorbents for removing Rhodamine 6G from water. J. Polym. Res.. 2021;28:330.
- [CrossRef] [Google Scholar]
- ZnO Based Material as Photocatalyst for Treating the Textile Anthraquinone Derivative Dye (Dispersive Blue 26 Dye): Removal and Photocatalytic Treatment. J. Phys.: Conf. Ser.. 2020;1664 012064
- [CrossRef] [Google Scholar]
- Synthesis and characterisation of polyaniline and/or MoO2/graphite composites from deep eutectic solvents via chemical polymerisation. J. Polym. Res.. 2019;26:65.
- [CrossRef] [Google Scholar]
- Synthesis of a poly (p-aminophenol)/starch/graphene oxide ternary nanocomposite for removal of methylene blue dye from aqueous solution. J. Polym Res.. 2022;29:159.
- [CrossRef] [Google Scholar]
- Effect of graphene oxide and temperature on electrochemical polymerization of pyrrole and its stability performance in a novel eutectic solvent (choline chloride–phenol) for supercapacitor applications. ACS Omega 2022
- [CrossRef] [Google Scholar]
- Fabrication of polymeric nanocomposite forward osmosis membranes for water desalination-A review. Environ. Technol. Innov.. 2021;23:101561
- [CrossRef] [Google Scholar]
- Active removal of anionic azo dyes (MO, CR, EBT) from aqueous solution by potential adsorptive capacity of zinc oxide quantum dots. J. Chem. Technol. Biotechnol.. 2022;97:2087-2097.
- [CrossRef] [Google Scholar]
- Hollow cobalt ferrite–polyaniline nanofibers as magnetically separable visible-light photocatalyst for photodegradation of methyl orange. J. Photochem. Photobiol. A: Chem.. 2016;321:257-265.
- [CrossRef] [Google Scholar]
- Efficient removal of congo red dye using Fe3O4/NiO nanocomposite: Synthesis and characterization. Environ. Technol. Innov.. 2021;23:101559
- [CrossRef] [Google Scholar]
- Synthesis, characterization, and performance of nanocomposites containing reduced graphene oxide, polyaniline, and cobalt ferrite. Phys. B: Condens. Matter.. 2021;612:412974
- [CrossRef] [Google Scholar]
- An investigation of natural and modified diatomite performance for adsorption of Basic Blue 41: Isotherm, kinetic, and thermodynamic studies. Desalination Water Treat.. 2021;229:384-394.
- [CrossRef] [Google Scholar]
- About the theory of so-called adsorption of soluble substances. Sven. Vetenskapsakad. Handingarl.. 1898;24:1-39.
- [Google Scholar]
- The constitution and fundamental properties of solids and liquids. Part I. Solids. J. Am. Chem. Soc.. 1916;38:2221-2295.
- [Google Scholar]
- Graphene oxide-based materials for efficient removal of heavy metal ions from aqueous solution: A review. Environ. pollut.. 2019;252:62-73.
- [CrossRef] [Google Scholar]
- Preparation of CoFe2O4/activated carbon@ chitosan as a new magnetic nanobiocomposite for adsorption of ciprofloxacin in aqueous solutions. Water Sci. Technol.. 2018;78:2158-2170.
- [CrossRef] [Google Scholar]
- Preparation and characterization of chitosan-poly (vinyl alcohol) nanocomposite films embedded with functionalized multi-walled carbon nanotube. Carbohydr. Polym.. 2017;166:377-386.
- [CrossRef] [Google Scholar]
- Investigation of structural, morphological, magnetic properties and biomedical applications of Cu2+ substituted uncoated cobalt ferrite nanoparticles. Braz. Arch. Biol. Technol.. 2017;59
- [CrossRef] [Google Scholar]
- Kinetics, isotherm, and thermodynamic studies of methylene blue adsorption on polyaniline and polypyrrole macro–nanoparticles synthesized by C-Dot-Initiated polymerization. ACS Omega.. 2018;3:7196-7203.
- [CrossRef] [Google Scholar]
- Biosorption of copper from waste waters: a review. Sep. Purif. Methods.. 1999;28:87-125.
- [CrossRef] [Google Scholar]
- CoFe2O4@ Methylcellulose/AC as a New, Green, and Eco-friendly Nano-magnetic adsorbent for removal of Reactive Red 198 from aqueous solution. Arab. J. Chem.. 2022;15:103745
- [CrossRef] [Google Scholar]
- Removal of anionic dye Congo red from aqueous environment using polyvinyl alcohol/sodium alginate/ZSM-5 zeolite membrane. Sci. Rep.. 2020;10:15452.
- [CrossRef] [Google Scholar]
- Electrocatalytic hydrogen production properties of poly (3-aminobenzoic acid) doped with metal organic frameworks. Int. J. Electrochem. Sci.. 2017;12:4392-4405.
- [CrossRef] [Google Scholar]
- Synthesis of Schiff's base magnetic crosslinked chitosan-glyoxal/ZnO/Fe3O4 nanoparticles for enhanced adsorption of organic dye: Modeling and mechanism study. Sustainable Chemistry and Pharmacy.. 2021;20:100379
- [CrossRef] [Google Scholar]
- Superabsorbent magnetic Fe3O4-based starch-poly (acrylic acid) nanocomposite hydrogel for efficient removal of dyes and heavy metal ions from water. J. Polym. Res.. 2019;26:271.
- [CrossRef] [Google Scholar]
- Synthesis of chitosan composite of metal-organic framework for the adsorption of dyes; kinetic and thermodynamic approach. J. Hazard. Mater.. 2022;427:127902
- [CrossRef] [Google Scholar]
- Adsorptive remediation of Congo Red Dye in aqueous solutions using acid pretreated sugarcane bagasse. J. Polym. Environ.. 2020;28:1129-1137.
- [CrossRef] [Google Scholar]
- Significance of conducting polyaniline based composites for the removal of dyes and heavy metals from aqueous solution and wastewaters-A review. Chemosphere.. 2020;267:129201
- [CrossRef] [Google Scholar]
- Removal of anionic and cationic dyes from wastewater by adsorption using multiwall carbon nanotubes. Arab. J. Chem.. 2020;13:4797-4810.
- [CrossRef] [Google Scholar]
- Comparative study of CoFe2O4 nanoparticles and CoFe2O4-chitosan composite for Congo Red and Methyl Orange removal by adsorption. Nanomaterials.. 2021;11:711.
- [CrossRef] [Google Scholar]
- Dramatic enhancement in adsorption of congo red dye in polymer-nanoparticle composite of polyaniline-zinc titanate. J. Environ. Chem. Eng.. 2021;9:105149
- [CrossRef] [Google Scholar]
- Preparation of copper-cobalt-nickel ferrite/graphene oxide/polyaniline composite and its applications in microwave absorption coating. Prog. Org. Coat.. 2020;141:105552
- [CrossRef] [Google Scholar]
- Kinetics of ammonia synthesis on promoted iron catalyst. Acta Phys. Chim. USSR.. 1940;12:327.
- [Google Scholar]
- Graphene and graphene oxide-based composites for removal of organic pollutants: a review. J. Chem. Eng. Data.. 2019;64:833-867.
- [CrossRef] [Google Scholar]
- Zeolite-based adsorbent from alum sludge residue for textile wastewater treatment. Int. J. Environ. Sci. Technol.. 2020;17:2485-2498.
- [CrossRef] [Google Scholar]
- Synthesis of PANI@ ZnO hybrid material and evaluations in adsorption of congo red and methylene blue dyes: structural characterization and adsorption performance. J. Inorg. Organomet. Polym.. 2022;32:112-121.
- [CrossRef] [Google Scholar]
- Reduction of Cr6+ from wastewater using a novel in situ-synthesized PANI/MnO2/TiO2 nanocomposite: renewable, selective, stable, and synergistic catalysis. ACS Sustainable Chem. Eng.. 2017;5:9313-9324.
- [CrossRef] [Google Scholar]
- Graphene oxide edge grafting of polyaniline nanocomposite: an efficient adsorbent for methylene blue and methyl orange. Water Sci. Technol.. 2018;77:2751-2760.
- [CrossRef] [Google Scholar]
- Ice-templated porous polymer/UiO-66 monolith for Congo Red adsorptive removal. Arab. J. Chem.. 2020;13:5669-5678.
- [CrossRef] [Google Scholar]
- Biosorption of Congo red from aqueous solutions based on self-immobilized mycelial pellets: kinetics, isotherms, and thermodynamic studies. ACS Omega.. 2020;5:24601-24612.
- [CrossRef] [Google Scholar]
- Ternary titania–cobalt ferrite–polyaniline nanocomposite: a magnetically recyclable hybrid for adsorption and photodegradation of dyes under visible light. Ind. Eng. Chem. Res.. 2013;52:10105-10113.
- [CrossRef] [Google Scholar]
- Removal of methyl orange from water using sulfur-modified nZVI supported on biochar composite. Water Air Soil Pollut.. 2018;229:335.
- [CrossRef] [Google Scholar]
- The Efficient Removal of Methylene Blue Dye Using CuO/PET Nanocomposite in Aqueous Solutions. Catalysts.. 2021;11:241.
- [CrossRef] [Google Scholar]
- Adsorptive removal of cationic methylene blue and anionic Congo red dyes using wet-torrefied microalgal biochar: Equilibrium, kinetic and mechanism modeling. Environ. Pollut.. 2021;272:115986
- [CrossRef] [Google Scholar]
- Synthesis of conductive poly (3-aminobenzoic acid) nanostructures with different shapes in acidic ionic liquids medium. J. Mol. Liq.. 2018;271:514-521.
- [CrossRef] [Google Scholar]
- Nanoadsorbents based on conducting polymer nanocomposites with main focus on polyaniline and its derivatives for removal of heavy metal ions/dyes: a review. Environ. Res.. 2018;162:173-195.
- [CrossRef] [Google Scholar]
- Sustainable fabrication, optical properties and rapid performance of bio-engineered copper nanoparticles in removal of toxic methylene blue dye in an aqueous medium. Curr. Res. Green Sustainable Chem.. 2021;4:100103
- [CrossRef] [Google Scholar]
- Poly (acrylic acid) functionalized magnetic graphene oxide nanocomposite for removal of methylene blue. RSC Adv.. 2015;5:32272-32282.
- [CrossRef] [Google Scholar]
- Efficient removal of organic pollutant by activation of persulfate with magnetic Co3O4/CoFe2O4 composite. Arab. J. Chem.. 2020;13:5332-5344.
- [CrossRef] [Google Scholar]
- Hierarchical MWCNTs/Fe3O4/PANI magnetic composite as adsorbent for methyl orange removal. J. Colloid Interface Sci.. 2015;450:189-195.
- [CrossRef] [Google Scholar]
- Recent advances for dyes removal using novel adsorbents: a review. Environ. Pollut.. 2019;252:352-365.
- [CrossRef] [Google Scholar]
Appendix A
Supplementary data
Supplementary data to this article can be found online at https://doi.org/10.1016/j.arabjc.2022.104318.
Appendix A
Supplementary data
The following are the Supplementary data to this article:Supplementary data 1
Supplementary data 1


