

Translate this page into:
Reaction mechanism study of calcium carbide residue with graphene oxide in aqueous environment: Adsorption properties and mechanical potentials
⁎Corresponding author. wellswang@usx.edu.cn (Wei Wang)
-
Received: ,
Accepted: ,
This article was originally published by Elsevier and was migrated to Scientific Scholar after the change of Publisher.
Abstract
Graphene Oxide (GO) is widely used, but its hydrophilic properties make it difficult to remove once it enters water and soil environments. In this paper, the adsorption effect of calcium carbide residue (CCR) as adsorbent on GO was investigated through a series of adsorption tests. Adsorption thermodynamics, kinetics, isotherm models, and various characterization techniques were employed to explore the adsorption mechanism. Additionally, the study assessed CCR’s ability to stabilize GO-contaminated soils through unconfined compressive strength tests. The results showed that (1) at T = 303 K, with a pH of 11 and an initial GO concentration of 80 mg/L, CCR demonstrated excellent adsorption performance. (2) The adsorption process followed the Langmuir isotherm and a quasi-second-order kinetic model, indicating chemical adsorption with spontaneous heat adsorption. (3) CCR not only acts as an effective adsorbent for removing GO from wastewater but also has the potential to strengthen GO-contaminated soils. In addition, due to its favorable environmental benefits, this study has a wide range of potential applications in industrial fields such as wastewater treatment, air purification, and energy storage and conversion. This study not only proposes an effective method for removing graphene oxide from aqueous environments, but also provides a new idea for waste resource utilization, which helps to achieve the dual goals of environmental protection and resource reuse.
Keywords
Graphene oxide
Calcium carbide residue
Adsorption
Mechanical properties

1 Introduction
Graphene oxide is a product resulting from the chemical oxidation of graphene, both of which have excellent electrical, thermal and mechanical properties (Moradi, O. et al., 2022). Graphene is a unique material due to its strong C–C grafting, electron transfer properties and charge carrier mobility, high density, and excellent mechanical and physical properties (Naeini et al., 2022). Graphene oxide is hydrophilic, easy to synthesize and has excellent chemical stability due to the presence of –OH, –CH (O)CH–, −C = O, and −carboxylic groups on its surface and edges (Li et al., 2024), and is now widely used in biomedicine, catalysts, electronics, and highly efficient adsorbents (Moradi and Panahandeh, 2022; Moradi et al., 2021, 2022b). However, toxicological studies have found GO to be cytotoxic and neurotoxic (Ma et al., 2015), production and use in large quantities may lead to leakage into the water environment and seepage into foundations, which can lead to high water hardness and environmental instability, posing ecological risks (Lanphere and Walker, 2013). Therefore, how to effectively remove GO from aqueous solutions is a topic of research. Methods for removing impurities from solution include adsorption (Demin et al., 2019), chemical precipitation (Barbosa Segundo et al., 2019), electrochemical method (Wang et al., 2022), ion analysis (Koliehova et al., 2019), etc. Compared with other methods, adsorption technology is an economic, efficient, rapid and eco-friendly treatment method (Cheng and Wang, 2024), solid wastes be transformed into adsorbents for adsorption, which has the advantages of fewer steps, low energy consumption, and low pollution. It has become one of the research hot spots to achieve the goal of “curing waste with waste”, which is conducive to the protection of global resources and sustainable development.
Each production of 1 t of polyvinyl chloride (PVC) consumes about 1.5 t of calcium carbide, and each production of 1 t of calcium carbide will produce 1.5 ∼ 1.9 t of calcium carbide residue (CCR) (Zhao et al., 2017). CCR is produced by the reaction of tourmaline (CaC2) and water (H2O) in the production of acetylene (C2H2) (Rodygin et al., 2022).
CaC2 + 2H2O → C2H2 + Ca(OH)2.
The primary component of CCR is 85–95 % Ca(OH)2, with a smaller portion of 1–10 % CaO. Additionally, CCR contains minor components such as alumina (Al2O3) and iron oxide (Fe2O3). Although their concentrations are relatively low, these components contribute to the overall chemical properties of CCR (Lv et al., 2023). From 2007 to 2013, with the rapid increase in PVC production, the amount of CCR generation increased by 36.15 %, after 2013, PVC production capacity is basically balanced, and with the elimination of high-energy-consuming, heavily polluting production capacity and a slight decline, but CCR still maintains tens of millions of tonnes of annual emissions. The emission of CCR is large, alkaline and high humidity, and most enterprises use the pile method or landfill method to dispose of it, leading to the consumption of a large amount of land resources and the pollution of soil and water environment problems (Lu et al., 2011). The Department of Environment (DOE) encourages the management of solid waste applications, the reuse of unwanted by-products as potential resources. With the increasing awareness of CCR, it has been widely used in the fields of environmental management, building materials and chemistry (Abo-El-Enein et al., 2016; Samoylenko et al., 2023). In environmental management, CCR is used to prepare hydrogen, a green energy source (Lotsman and Rodygin, 2023). Prinya Chindaprasirt et al. (Chindaprasirt et al., 2023) used CCR solution to capture CO2 to reduce CO2 emissions and mitigate global warming. In the field of construction, Chindaprasirt et al. (Chindaprasirt et al., 2020) used CCR to improve the strength, modulus of elasticity and other engineering properties of laterite. In the field of chemistry, Tao Chen et al. (Chen et al., 2024) investigated the synthesis of a low-carbon curing agent using CCR as well as other solid wastes for the solidification and stabilisation of cadmium-contaminated soil. It shows that CCR has a certain ability to adsorb and solidify the soil, and CCR is used to treat wastewater as a secondary raw material, which achieves the purpose of waste to waste, waste recycling, and maximising economic benefits in the case of beneficial to the environment.
In this paper, CCR was used as an adsorbent for the removal of GO from aqueous solution, and the effects of environmental conditions, such as pH, sorbent mass, temperature, and GO concentration, on the removal quotiety of GO from aqueous solution were investigated. To attempt to comprehend the mechanism of interaction, characterization was done using x-ray diffraction (XRD), Fourier transform infrared spectroscopy (FT-IR), scanning electron microscopy (SEM), atom force microscopy (AFM), transmission electron microscopy (TEM), and x-ray photoelectron spectroscopy (XPS). And the use of CCR on the GO-contaminated foundation soil and ordinary foundation soil curing, through the unconfined compression test to explore the impact of CCR and GO interaction on the soil. This study not only proposes a method for efficiently removing graphene oxide from aqueous environments, which provides an important technological basis for future water pollution control, but also has important strategic significance in the comprehensive utilization of solid wastes and the promotion of sustainable development. This method provides a new idea for waste resourcing and helps to achieve the dual goals of environmental protection and resource reuse.
2 Test content
2.1 Materials
Aqueous GO solution with a concentration of 2 mg/mL was produced by Suzhou Carbon Fountain Technology Co. Graphene oxide, while not “dissolved” in the traditional sense, can form stable dispersions in water. This is due to the abundant oxygen-containing functional groups on the surface of graphene oxide, such as hydroxyl (–OH), carboxyl (–COOH), and epoxy (−O-), which are polar groups that can form hydrogen bonds with water molecules and enhance their affinity in water, thus making them dispersed in water. The water solubility of graphene oxide is highly dependent on its oxidation degree and sheet size. In general, ultrasonic treatment can make graphene oxide form a uniform dispersion in water, and this dispersion can be stable for a long time. In order to reduce the interaction force before the graphene oxide lamellae, decrease the possibility of agglomeration, and make the dispersion in solution more homogeneous, the graphene oxide was subjected to dilution treatment during the test.
The 18 MΩ⋅cm deionised water used in the experiment was produced by UPW-R15 water purifier produced by Shanghai Yidian Scientific Instrument Co. The adsorbent CCR was produced from Gongyi Yuanheng Water Purification Materials Factory. The main chemical composition (Table 1) was determined by X-ray Fluorescence Spectrometer (XRF, Zetium, Holland).
Chemical composition
Ca(OH)2
SiO2
CaO
Al2O3
Fe2O3
Others
Content (%)
91.2
3.8
1.5
1.2
0.3
2
The pH was adjusted using NaOH solution at pH = 13.1 and HCl solution at pH = 0.25, in which NaOH solution was produced from Oulian Hongda Industry and Trade Co. Ltd, and HCl solution was produced from Guangzhou Hewei Pharmaceutical Science and Technology Co. Ltd, both of which are Chinese analytical-grade reagents and do not require further purification. The soil used was the pile foundation disposal soil of a project in Shaoxing area, Zhejiang Province, which was brownish yellow in colour, and the physical characteristics are presented in Table 2.
Index name
The natural content of water (%)
Liquid limit
(%)Plastic limit (%)
Liquid index IL
Plasticity index Ip
Maximum dry density (g/cm3)
Digital value
35
36.7
22.9
0.88
13.8
1.66
2.2 Adsorption test
2.2.1 Test scheme
The adsorption test adopts the controlled variable method, where the influencing factors affecting the adsorption effect are pH, mass of adsorbent, initial concentration of adsorbent, and experiment temperature, and the test is carried out by changing only one of the factors and keeping the other conditions unchanged to determine the adsorption kinetic and thermodynamic conditions. For the adsorption kinetic test, measurements were carried out at reasonable time intervals according to the test conditions. In order to reduce the error, absorbance was determined using three parallel runs and the data were averaged and analysed. The test scheme is shown in Table 3.
Number
pH
CCR mass (mg)
Initial GO concentration (mg/L)
Temperature
(K)Shaking time (h)
Quiescent Time (h)
Test aim
1
3,4,5,6,7,8,9,10,11,12
5
100
303
2
12
Selection of optimal pH
2
Optimal pH
5
60,80,100,120,140
303
2
12
Selection of optimal initial concentration
3
Optimal pH
1,2,3,4,5,6
Optimal initial
concentration303
2
12
Selection of
optimal mass
4
Optimal pH
Optimal quality
60,80,100,120,140
283,293,303
2
12
adsorption isotherm and thermodynamic analysis
5
Optimal pH
Optimal quality
Optimal initial concentration
Optimal temperature
2
12
adsorption kinetics analysis
2.2.2 Test procedure
Referring to the test methods of some related researchers (Li et al., 2024; Li et al., 2022a), as shown in Fig. 1. The final test steps were determined as follows:
The dried CCR powder was sieved with a normative sieve of 0.074 mm.
Graphite oxide dilution with a concentration of 2 mg/mL was placed in an ultrasonic cleaner and sonicated for 30 min to homogenise the medium.
Take 2 ml of GO at a concentration of 2 mg/mL by means of a pipette gun and add it to a specimen bottle. Then 48 ml of deionised water was added to make 50 mL of aqueous GO solution.
Using an electronic analytical balance weigh the appropriate mass of CCR powder into an aqueous solution and shake well.
Use a pH meter to test and correct the solution's pH to the appropriate level after adding small volumes of hydrochloric acid and sodium hydroxide solutions.
Place the specimen bottle in a thermostatic shaker and vibrate at 240 rpm for 2 h at the specific temperature.
After vibration, place the specimen bottle in a thermostat and let it stand at the specific temperature for 12 h.
After curing, take 1 ml of the supernatant with a pipette gun and place it in a test tube. Take the same sample for three groups and dilute to 25 mL with deionised water.
The sample's absorbance was measured at 230 nm after the supernatant was collected and the UV–Vis spectrophotometer was preheated for 20 min.
After centrifugal drying of the precipitates, FTIR, XRD, SEM, TEM, XPS and AFM microscopic characterisations were carried out.
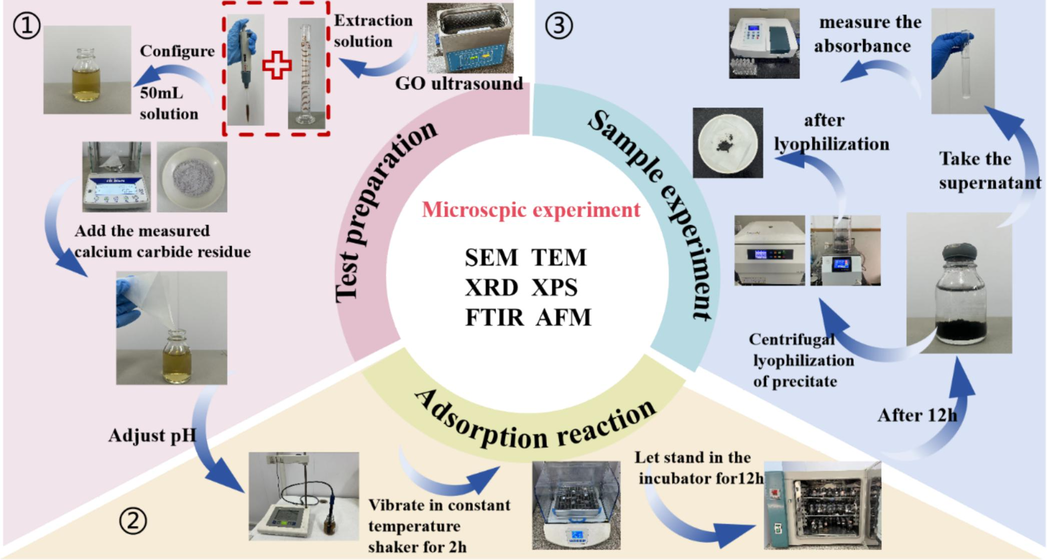
- Flow of adsorption test.
2.2.3 Methods of analysis
The basic methodology of adsorption studies is to evaluate the adsorption performance of the adsorbent using the GO removal quotiety, adsorption capacity and partition coefficient, and to further understand the GO adsorption properties of the adsorbent by analysing the adsorption kinetics, isotherms and thermodynamics related models.
The adsorption amount Qe (mg/g), the adsorption rate R (%) and the partition coefficient Kd were calculated based on the initial GO concentration C0 (mg/L) and the equilibrium concentration Ce (mg/L). The equations were calculated as follows (Zhu et al., 2023).
Where m(mg) represents the mass of CCR powder and V (mL) represents the volume of the solution.
In order to study the adsorption model of GO adsorption by CCR with full consideration of the ambient temperature, the adsorption of GO at distinct concentrations was carried out at 3 temperatures (283 K, 293 K,303 K), and several adsorption equilibrium experiments were carried out and plotted and plotted adsorption isotherms were drawn. To fit the adsorption data, the Langmuir, Freundlich, and Temkin models were introduced.
2.3 Microscopic characterization
The test samples were microscopically characterized using Scanning Electron Microscopy (SEM, Empyrean), Transmission Electron Microscopy (TEM, JEM-2100F), Atomic Force Microscopy (AFM, Bruker Dimension), and X-ray Diffraction (XRD, Empyrean) with detection limits ranging from 1 % to 3 %. Additionally, Fourier Transform Infrared Spectroscopy (FTIR, NEXUS) and X-ray Photoelectron Spectroscopy (XPS, Thermo Scientific Nexsa) were employed, with detection limits of 0.1 % to 1 % and 0.1 % to 5 %, respectively. Among them, the CCR microstructure was determined using TEM and SEM. GO and precipitates after adsorption, AFM was mainly used to research the appearance and morphology of the samples and the changes in the thickness of the samples before and after adsorption, XRD was used for the physical phase analysis of crystalline substances, FTIR was used to obtain the sample functional groups or chemical robustness, and XPS was used to detect the binding energies of the electrons of the samples to determine the chemical compositions on the surface of the specimens.
2.4 Unconfined compressive strength test
Five parallel samples were experimented in each group and the test program adopted is shown in Table 4.
Sample number
Dosage of CCR (%)
2 mg/L of GO (%)
Water (%)
Conservation age (d)
Test content
CCRx-0
0
0
20
7
Unconfined compressive test
3
17
CCRx-5
5
0
20
3
17
CCRx-10
10
0
20
3
17
CCRx-15
15
0
20
3
17
3 Microscopic characterisation
3.1 FTIR, XRD analysis
FTIR spectroscopy is a useful technique for identifying functional groups on a substance's surface (Xu and Zhu, 2013) and for differentiating between chemical substances or compounds. The samples were mixed with potassium bromide under a certain ratio, and the infrared spectra were tested by the potassium bromide press method, reflecting the changes in functional groups before and after the reaction of the substances, and the wave numbers were measured in the range of 400 cm−1 to 4000 cm−1, and the infrared spectra obtained are shown in Fig. 2 (a). The adsorption crest value of GO at 3392 cm−1 is the characteristic vibrational adsorption crest value of hydroxyl functional group (–OH), which may be due to the attached water molecules on the surface of the material; 1728 cm−1 is the C = O telescopic vibration of carboxyl and carbonyl groups on the edge of GO lamellae (Al-Gaashani et al., 2019). 1623 cm−1 is the C = C vibrational absorption peak; the crest value at 1416 cm−1 is attributed to C–H vibration of structure. 1223 cm−1 is the characteristic adsorption crest value of epoxy group (C-O-C) (Lin et al., 2023). 1073 cm−1 is the C-O telescopic vibrational adsorption crest value (Krishnamoorthy et al., 2013). GO The appearance of the sharp diffraction peak of (001) crystal plane at 2θ = 10.28°is due to the access of oxygen-containing functional groups and the interposition of water molecules in the oxidation process of graphite (Jiang et al., 2024).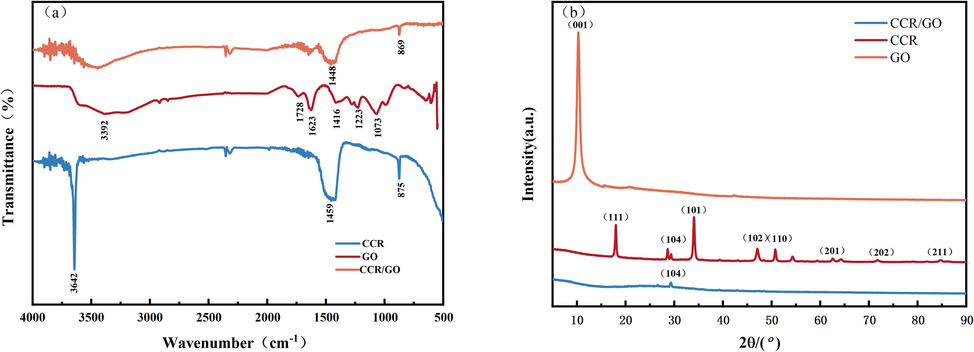
(a) FTIR and (b) XRD of GO, CCR, CCR/GO.
The major constitute of CCR is Ca(OH)2, and the characteristic peak of hydroxide –OH at 3642 cm−1 is sharp and strong. At 1459 cm−1 is the broad adsorption crest value of C-O anti-symmetric telescopic vibration, and at 875 cm−1 is the sharp absorption peak of CO32− in-plane bending vibration, which can prove that there is calcium carbonate component(Cheng et al., 2017).
After adsorption, the characteristic peaks of the CCR/GO precipitate were weakened, and the crest value at 3642 cm−1 was severely contracted, indicating that the hydroxyl group of the CCR was combined with the carboxyl group of GO during the adsorption process, and –OH was consumed, and the acid-base neutralisation reaction occurred (Guo et al., 2024). The weakening of the adsorption crest value of the CO32− in-plane flexural vibration at 869 cm−1 is due to the chemical reaction of a portion of the CO32−(Ding et al., 2024). No new absorption peaks appeared, and both physisorption and chemisorption were present.
The crystal constructions of CCR, GO, and CCR/GO were analysed by X-ray diffractometry (XRD). Fig. 2(b) shows that the mineral phase in the CCR is primarily dominated by Ca(OH)2, with a small quantity of CaCO3 present. Characteristic diffraction peaks at 18.1°, 34.1°, 47.1°, 50.8°, 62.5°, 71.8°, and 84.7°on PDF card with reference to ICSD standards are due to (111), (101), (102), (110), (201), (202), and (211) of calcium hydroxide, respectively. The diffraction peak at 29.4°is caused by the (104) of calcium carbonate. After adsorption, the diffraction peak of Ca(OH)2 disappears, which corresponds to the disappearance of the –OH characteristic peak in the FTIR spectrum. GO The appearance of the sharp diffraction peak of (001) crystal plane at 2θ = 10.28°is due to the access of oxygen-containing functional groups and the interposition of water molecules in the oxidation process of graphite, the interlayer spacing of graphite is gradually opened, and the characteristic peaks are also gradually enhanced in this process (Jeong et al., 2008).
3.2 SEM and TEM analysis
In order to gain further insight into the adsorption mechanism, microscopic tests were carried out on CCR/GO as well as the precipitates of GO adsorbed by CCR to understand the effect of adsorption on the surface morphology, which are shown in the scanning images of transmission electron microscopy in Fig. 3(a)–(c) and scanning electron microscopy in Fig. 3(d)–(f). GO is a layered two-dimensional structure with obvious folded and stacked structures on its surface (Fig. 3(b)), just like a folded paper, which is put down to the strong van der Waals forces that generate electrostatic attraction between the layers of GO flakes (Chen and Duan, 2020). However, the edges were transparent and the folds were obviously weakened, which indicated that GO was reduced. Fig. 3(d) shows that the microstructure of CCR is loose, the particle size is different, the distribution is messy and irregular, and the pores between the particles are large and not tightly arranged, which can provide a large quantity of adsorption sites for adsorption to achieve the role of pore filling, which is necessary as an adsorbent.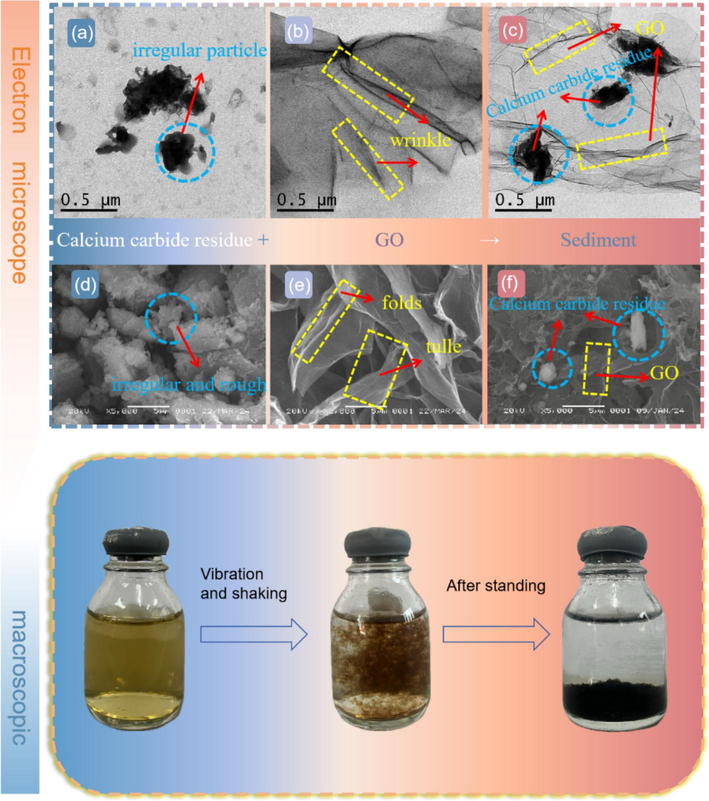
SEM (a) and TEM (d) for CCR, SEM (b) and TEM (e) for GO, SEM (c) and TEM (f) for CCR/GO, and solution changes during adsorption.
GO adhered to the surface of the CCR (Fig. 3(c) and Fig. 3(f)), and similarly, the macroscopic images show the CCR/GO precipitate at the bottom of the specimen bottle with a clear supernatant, suggesting that GO was adsorbed by the CCR, a phenomenon is in accordance with the SEM and TEM images.
3.3 AFM and XPS analysis
AFM is a high-resolution microscope for observing the microstructure of the surface of an object, and is used for imaging the surface morphology of substances (Liu et al., 2017) Observing the 3D morphology Fig. 4(a), the bright coloured small particles are the CCR, which is small and well dispersed, whereas the morphology after GO adsorption (Fig. 5(a)) shows the phenomenon of particle agglomeration and increase in accumulation. Further observation of the heights showed that the maximum height of CCR (Fig. 4(c)) was 6.96 nm and that of CCR/GO (Fig. 5(c)) was 11.48 nm. the appearance of substance attachment indicated that GO was effectively adsorbed on top of CCR, a result that is consistent with SEM and TEM.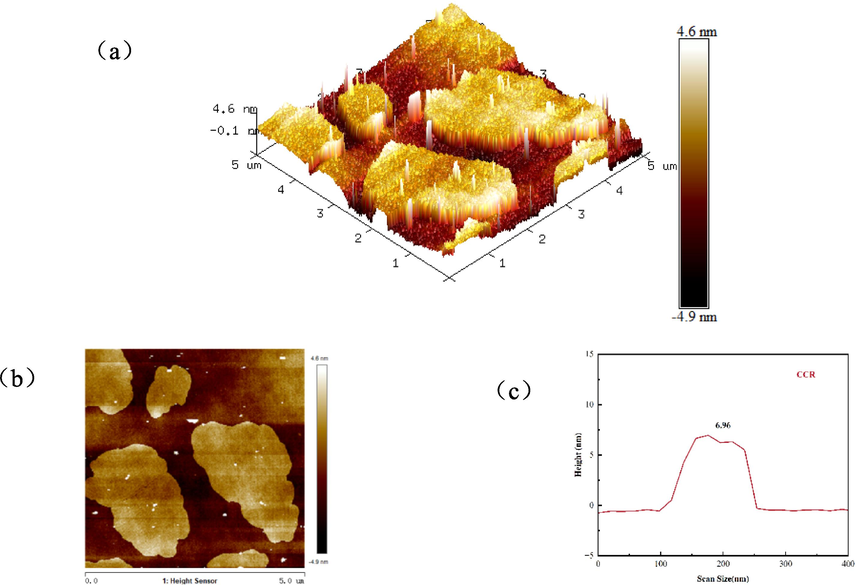
(a) 3D height topography of CCR, (b) AFM map and (c) height distribution.
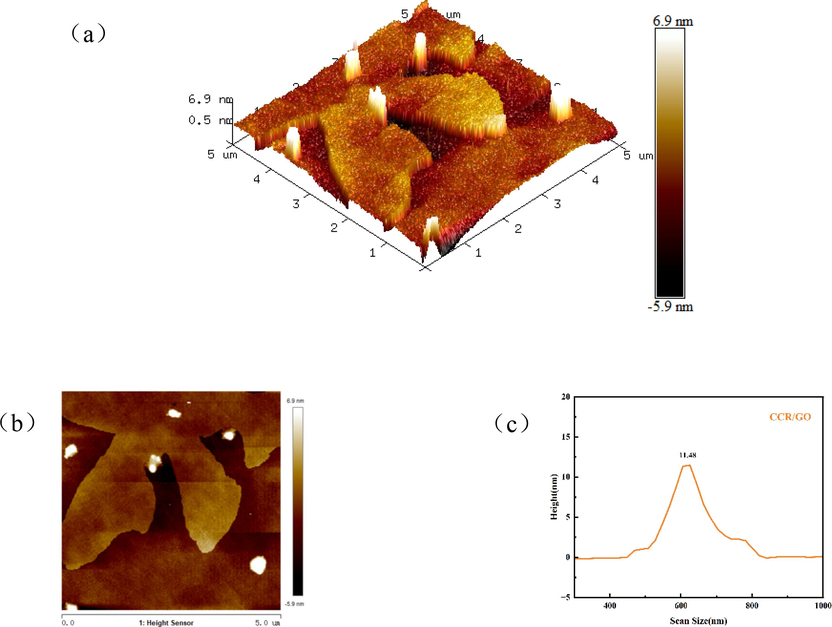
(a) 3D height topography of CCR/GO, (b) AFM map and (c) height distribution.
XPS (X-ray photoelectron spectroscopy) is a surface analysis technique for studying the composition, chemical structure and relative content of elements (Isaacs et al., 2021).The XPS full spectrum (Fig. 6) showed that GO had two energy peaks, O1s and C1s, while CCR/GO showed Ca2p, Si2p and Al2p energy peaks, indicating successful adsorption. The results of the fitting using Avantage peak splitting are shown in Fig. 6(a), and for GO, the three peaks at 284.8 eV, 287.0 eV, and 288.7 eV of its binding energy correspond to the C–C, C-O, and O-C = O moieties, respectively. For CCR/GO, the three peaks of its binding energy at 284.8 eV, 286.5 eV, and 287.5 eV correspond to C–C, C-O, and O-C = O groups, respectively, which undergo changes in the intensity of the groups and chemical shifts, indicating a change in the chemical state of the atoms. The C-O crest value showed the greatest intensity increase, with the surface area ratio falling from 53.4 % to 26.5 %. From 3.2 % to 7.4 %, the O-C = O crest value's surface area ratio increased, and that of the C–C crest value from 47.6 % to 66.1 %, proving that C-O and O-C = O were involved in the main adsorption.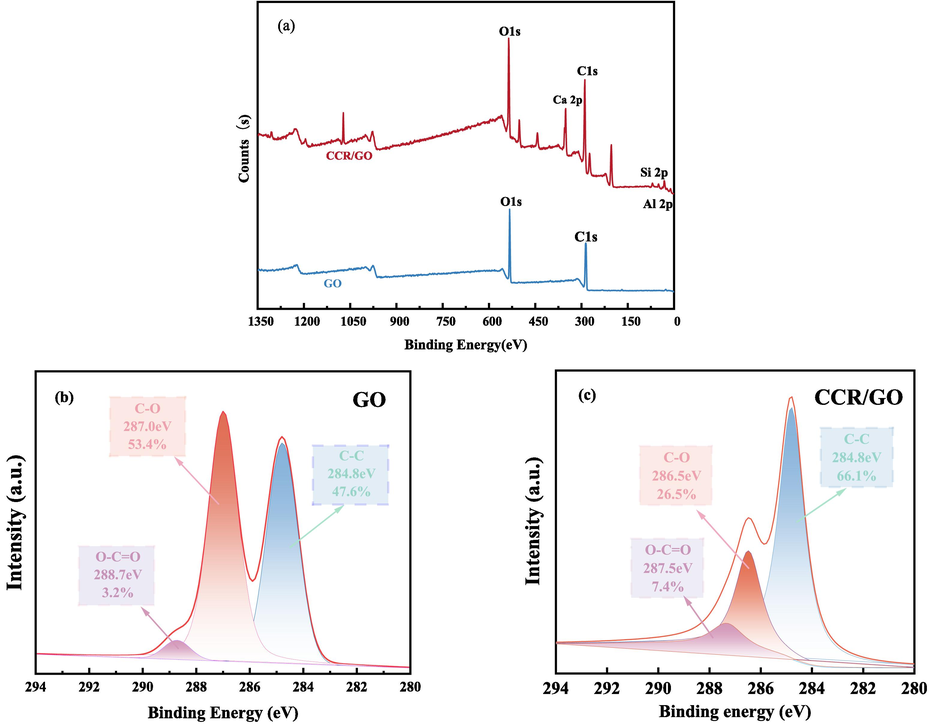
(a)XPS of GO and CCR/GO, (b) High C1 s deconvolution for GO and (c) CCR/GO.
3.4 Adsorption mechanism
The above experiments indicate that CCR has a good adsorption effect on GO, and it is also crucial to understand the interaction mechanism between CCR and GO. The increase in pH value when CCR was added to GO aqueous solution was attributed to the fact that Ca(OH)2, the main component of CCR, produced a large amount of OH−1 in the aqueous environment, and the number of hydroxyl groups (–OH) on the surface increased, which resulted in the rapid diffusion of metal ions and the enhancement of chemical adsorption, and these hydroxyl groups could be used as the adsorption sites, which were conducive to the adsorption of metal ions (Al3+, Fe3+), and the formation of complexes. (Leyva-Ramos et al., 2012) These positively charged metal ions may also have electrostatic interactions with the negatively charged hydroxyl and carboxyl groups on the surface of GO. CCR contains a small amount of SiO2, Si-O bonds will interact with –COOH and –OH on the surface of GO to form hydrogen bonds. Under alkaline conditions, the diffusion rate of calcium carbide slag in solution is increased and the kinetics of the adsorption process shows excellent results. However, the presence of some interfering ions in the solution may significantly affect the adsorption behavior of GO, as they are able to interact with components in GO or CCR, thus altering the kinetic and thermodynamic properties of the adsorption process. Electrostatic interactions with oxygen-containing functional groups (e.g., carboxyl groups, hydroxyl groups, etc.) on the surface of GO affect the charge distribution on the surface of GO, which in turn alters its adsorption capacity(Su et al., 2024). multivalent cations such as Ca2+ may compete with the adsorption sites on the surface of GO or CCR, thereby affecting the amount of GO adsorbed by CCR. Anions in solution (e.g., Cl-, SO42-) may form insoluble salts (e.g., CaSO4) with Ca2+ or other cations in the CCR, which may change the ionic balance of the solution and thus affecting the adsorption of GO (Zhang et al., 2021).
4 Study of adsorption properties of CCR
4.1 Influence of pH on GO adsorption
Differences in the pH of the aqueous solution environment affect the electrical properties of the adsorbent surface as well as the distribution and morphology of the adsorbate GO in aqueous solution (Cheng et al., 2017). These changes determine the adsorption capacity and interaction mechanisms of the adsorbent. The original pH of the GO aqueous solution was approximately 3.84, and the CCR had the effect of altering the alkalinity of the solution to evaluate the adsorption capacity of CCR on GO in various pH environments, With the addition of CCR, the pH of the solution increased to about 11.3, and then the pH of the solution was adjusted from 3 to 12 by the addition of HCl and NaOH at intervals of one. The adsorption tests were carried out at T = 303 K, using 5 mg of CCR, and a starting concentration of GO of 100 mg/L to determine the optimum pH for adsorption of GO. Fig. 7 shows the enhancement of adsorption performance of CCR on GO with increasing pH values at pH = 3–10. At pH = 3, the adsorption quotiety is extremely low. In acidic environment, the major component of CCR is Ca(OH)2, which takes the lead in acid-base interaction, thus inhibiting the adsorption (Zhang et al., 2024b).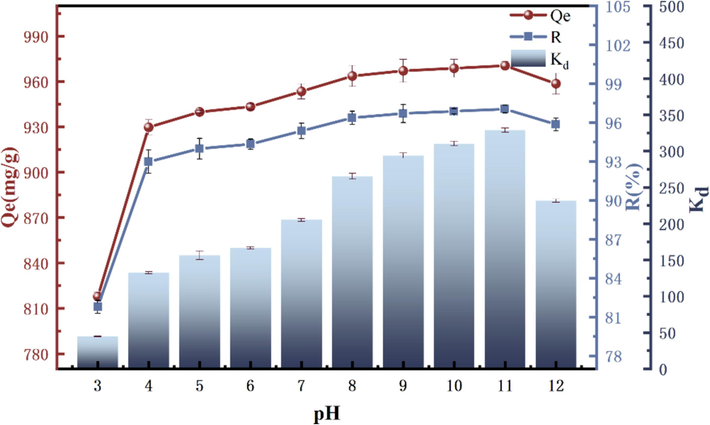
Influence of pH on GO adsorption.
The adsorption rate R reaches the highest at pH = 11, 97.04 %, which is due to the fact that the carboxyl group of GO reacts with the hydroxyl group of the CCR, and the hydroxide root is prone to chemically precipitate with the metal ions in the CCR under the alkaline environment (e.g., Al2O3, Fe(OH)3) (Fang et al., 2018).And at pH = 11, which is not necessary to be adjusted with HCl and NaOH, and the test goal can be achieved by using the CCR itself only. The alkalinity of the electroslag itself was used to achieve the test goal, and finally pH = 11 was set as the subsequent test value. Table 5 shows a comparison of previous studies.
Adsorbents
Adsorbate
pH
Adsorbent quality(mg)
Adsorbate
Concentration
(mg/L)Adsorption
Capacity(mg/g)Optimal
Removal rateReference
Red Sandstone
GO
4
40
80
89.08
89.08
(Li et al., 2022c)
SiO2/CS
Uranium (VI)
3.5
60
200
165
−
(Vareda, 2023)
nanocomposite
diclofenac and amoxicillin
7
50
20
526.31
94
(Moradi et al., 2022a)
WG
GO
3
40
80
61.3
94.3
(Li et al., 2024)
4.2 Influence of initial GO concentration on adsorption
The concentration of adsorbent is one of the conditions affecting adsorption. The results of the experiment, which was conducted with T = 303 K, an adsorbent mass of 5 mg, and a pH of 11, by adjusting the starting concentration of GO, are displayed in Fig. 8. CCR the concentration increases, the unit adsorption amount also continues to intensify, but after reaching a certain threshold, the adsorption rate R slows down, due to the lack of adsorption sites, the quotiety of adsorption slows down (Chen et al., 2019), this is due to the fact that the adsorbent certain with the concentration of adsorbent adsorption gradually reaches saturation state (Radoor et al., 2021). In terms of the adsorption quotiety, the highest adsorption quotiety of 97.2 % was achieved at the initial concentration of GO of 80 mg/L. The concentration of GO for subsequent tests was set at 80 mg/L.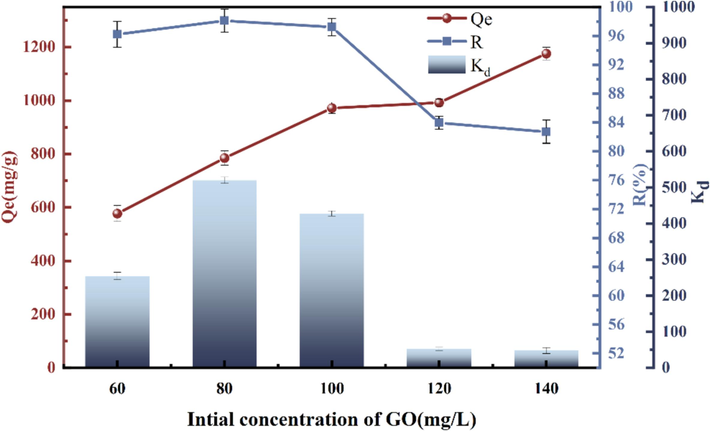
Influence of initial GO concentration on adsorption.
4.3 Influence of CCR mass on GO adsorption
The effect of CCR mass on the adsorption of GO is shown in Fig. 9. The best adsorption efficiency of 97.2 % was achieved when pH = 11, T = 303 K, and the mass of CCR was 5 mg. The CCR was extremely effective as an adsorbent, with adsorption rates above 90 % at 2–6 mg, and a small amount of the adsorbent was able to adsorb the GO rapidly. Thus the adsorption capacity per mg decreases with increasing adsorbent dosage at a certain concentration of adsorbent. The adsorption quotiety decreased slightly when the mass of CCR was more than 5 mg. This may be due to the fact that the concentration of GO remains constant with the rise in the CCR mass, and these active adsorption sites can only bind to a limited amount of GO, which makes the adsorption less effective (Cui et al., 2023). The maximum removal was achieved when the adsorbent dosage was 5 mg and the adsorption ability was saturated. Therefore, 5 mg adsorbent was chosen for the adsorption experiments.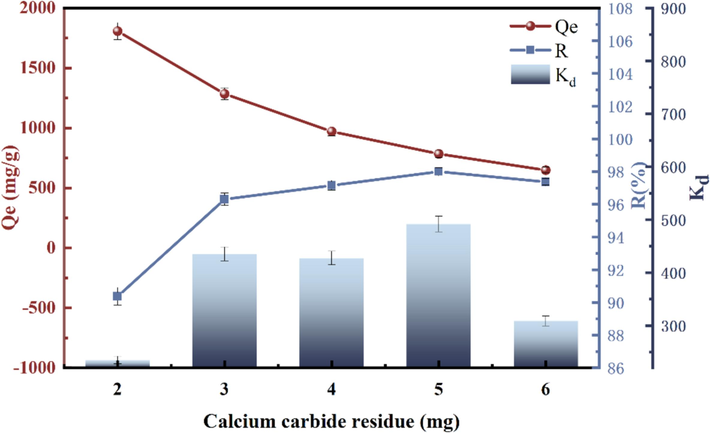
Influence of mass on GO adsorption.
4.4 Adsorption thermodynamics, kinetics and isotherm studies
From the analysis of the above tests, it was determined that the adsorption kinetic tests were carried out at T = 303 K, pH = 11, CCR mass of 5 mg, and GO starting concentration of 80 mg/L. The total test time was 1 h. The models of intraparticle diffusion, quasi-primary and quasi-secondary kinetics(Kumar et al., 2019) and Boyd-Ruthven-Homodel (Bai et al., 2024)were selected to fit the experimental data and substituted into Eqs. (4) to (8) to obtain the relevant parameters as shown in Table 6.
Kinetic model
T = 303 K, pH = 11, C0 = 80 mg/L, m = 5 mg
Parameter
Numerical value
Fitting coefficient R2
Pseudo-first-order
Qe (mg·g−1)
k1 (g·mg−1·min−1)799.901
0.0190.904
Pseudo-second-order
Qe (mg/g)
k2 (g·mg−1·min−1)769.761
3.577 × 10⁻⁴
0.962
Elovich
α (mg·g−1·min−1)
β (g·mg−1)846.134
0.0030.882
Intraparticle diffusion
kd1 (mg·g−1·min−1/2)
C1 (mg·g−1)120.016
−358.1920.981
kd2 (mg·g−1·min−1/2)
C2 (mg·g−1)20.878
475.1910.871
kd3 (mg·g−1·min−1/2)
C3 (mg·g−1)0.745
733.3650.950
Boyd-Ruthven-Ho
KC
0.001 1.433
0.829
Quasi-level kinetic modelling:
Quasi-secondary kinetic modelling:
Intraparticle diffusion model:
Boyd-Ruthven-Homodel:
where Qe (mg/g) represents the equilibrium adsorption capacity; Qt (mg/g) represents the adsorption capacity at adsorption time t; k1 (g/mg·min) and k2 (g/mg·min) represent rate constants for quasi-primary and quasi-secondary kinetic models, respectively; kd (mg/g·min1/2) represents the diffusion rate coefficient within the particles, and C (mg/g) represents the constant related to the thickness of boundary layer; Bt represents a time constant; F(t) represents the ratio of the adsorption capacity at time t to the equilibrium adsorption capacity.
The outcomes of quasi-primary and quasi-secondary kinetic model fitting are shown in Fig. 11(a), the CCR has a large specific surface acreage, as an adsorbent in the first 0.167 h shows a very fast adsorption quotiety, Fig. 10 demonstrates the increase of agglomerates in a short space of time in the procedure of adsorption, the solution becomes clear, corresponding to the adsorption quantity as high as 746.74 mg/g, this is because the adsorption site is enough during the first 0.167 h, which is not yet fully covered, and easily with the GO binding in the solution. After 0.167 h, the curve tends to flatten, and the equilibrium adsorption time was finally confirmed to be 1 h, which reached the maximum adsorption capacity of 773.88 mg/g, with the characteristics of rapid adsorption. With the advancement of time, the adsorption sites were occupied rapidly, and the quotiety of increase of the equilibrium adsorption quotiety decreased and gradually levelled off. The quasi-primary kinetic model has an R2 of 0.904 and an equilibrium sorption amount of 799.901 mg/g. The quasi-secondary kinetic model has an R2 of 0.962 and an equilibrium sorption amount of 769.761 mg/g, which is more in line with the adsorption amount. Therefore, it is more in line with the quasi-secondary kinetic model and the adsorption procedure is chemisorption.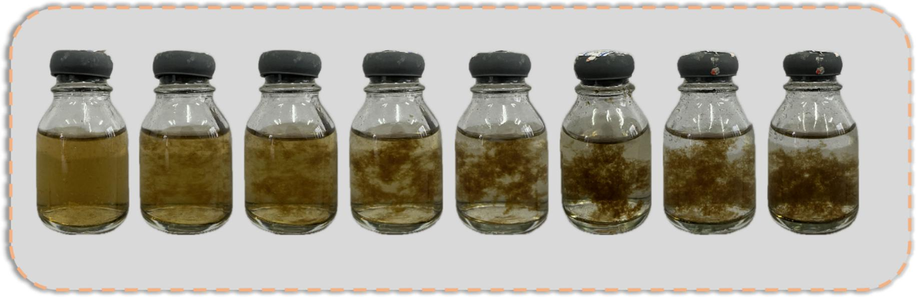
Solution changes during adsorption in the first 0.167 h.
The Elovich model was used to study the kinetics of the chemical reaction and Fig. 11(b) shows a poor fit indicating that model is not applicable to describe this adsorption procedure. From the intra-particle diffusion model (Fig. 11(c)), there are three stages, and the curve shows rapid adsorption in the early stage and gradually becomes flat towards equilibrium, where C ≠ 0 for the fitted curve, indicating that intra-diffusion is not the only rate-limiting step (Xie et al., 2019). The first stage is surface diffusion with a fast adsorption quotiety and a good fit with an R2 of 0.981. The second stage is intra mesopore diffusion, where the resistance increases as the diffusion reaches the interior, making the diffusion quotiety decrease. The third stage is intra-micropore diffusion and the curve is relatively flat until the adsorption reaches a plateau. The presence of intra-pore diffusion also indicates that the CCR belongs to a porous structure.
Different models for the kinetics: (a) quasi-primary and secondary kinetic model fitting curves, (b) Elovich model fitting curves, (c) Intraparticle diffusion model fitting curves, and (d) Boyd-Ruthven-Ho model fitting curves.
Whether the dominant step in the adsorption process is internal or surface diffusion can be determined by fitting the Boyd model to Fig. 11(d). The fact that the curve does not pass through the origin indicates that the adsorption process is influenced by chemical processes or surface diffusion (Mortazavian et al., 2018).
The adsorption effect of CCR on GO was investigated at pH = 11 and the mass of CCR was 5 mg at different temperatures (283 K, 293 K, 303 K) for different GO initial content of C0 (60 mg/L, 80 mg/L, 100 mg/L, 120 mg/L, 140 mg/L) and the adsorption isotherms were obtained on the test results, as shown in Fig. 12(a). The influence of temperature on the adsorption amount was more obvious as the initial concentration of GO aggrandized. At T = 283 K, the adsorption amount at equilibrium was relatively low, and the adsorption amount was enhanced at temperatures of 293 K and 303 K. Increasing the temperature enhances the adsorption effect, which may be conducive to the fact that the elevated temperature favours the mass transfer of GO in solution.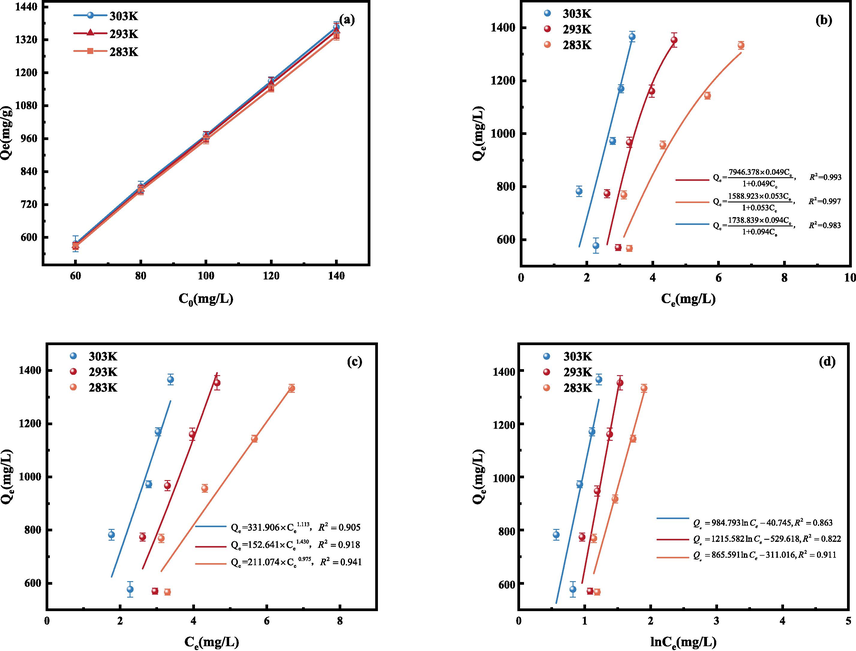
Adsorption isotherm (a), Langmuir isothermal model fit curve (b), Freundlich isothermal model fit line (c) and Temkin isothermal model fit curve (d).
In order to further resolve the adsorption process, Langmuir, Freundlich and Temkin models were used to fit the experimental data (Al-Ghouti and Da'ana, 2020), and the outcomes are displayed in Fig. 12(b–d), respectively. The relevant parameters of the three models were obtained according to Eqs. (9) to (11), as shown in Table 7 (Li et al., 2022b).
Temperature
(K)Langmuir
Freundlich
Temkin
Qmax
(mg/g)KL
(L/mg)R2
KF
(mg/g)1/n
R2
KT
(L/mg)C
R2
303
7946.378
0.049
0.993
331.906
1.113
0.905
1.042
984.793
0.863
293
1588.923
0.053
0.997
152.641
1.430
0.918
0.647
1215.582
0.822
283
1738.839
0.094
0.983
211.074
0.975
0.941
0.682
865.591
0.911
Langmuir model:
Freundlich model:
Temkin model:
where Qe (mg/g) represents the equilibrium adsorption amount; Ce (mg/L) represents the equilibrium concentration; Qmax (mg/g) represents the maximum adsorption amount; KL (L/mg) represents the Langmuir equilibrium factor with respect to the affinity of the binding site; KF (mg/g) represents the Freundlich equilibrium constant; n represents the nonlinearity factor; KT (L/mg) represents the adsorption equilibrium constant; C stands for a minuscule value that is connected to the adsorption system's characteristics and temperature.
In the Freundlich model, 1/n is close to 1, the adsorption process is chemisorption. When 1/n is greater than 1, synergistic sorption occurs (Wang et al., 2023). And the K value indicates that the adsorbent interacts with the adsorbent and the maximum K value at T = 303 K indicates the strongest adsorption capacity (Bai et al., 2022). With rising temperatures, the Langmuir model's maximal adsorption rises, which indicates that warming is favourable for adsorption. According to Table 7, the R2 of all three models is close to 1. The R2 value of the Langmuir equation fitting results is higher than that of Freundlich, and the adsorption of GO by CCR is more satisfying to the Langmuir model. Therefore, the Langmuir fitting model, which mainly describes monolayer adsorption, is more accurate in describing the adsorption process of graphene oxide on CCR Compared to the Freundlich model, the Langmuir model R2 is closer to 1. Therefore, the Langmuir model is better than the Freundlich model at these three temperatures, so the adsorption of GO by the adsorbent is a homogeneous adsorption in the monomolecular layer (Guo et al., 2021).The parameter KL reflects the ease of adsorption, and the KL < 1 in this test is easy to adsorb (Song et al., 2017). The Temkin model has all values of C positive, an indication that the adsorption reaction is a heat absorber.
To analyse the influence of adsorption at distinct temperatures, varying the initial concentration of GO was tested at three temperatures (283 K, 293 K and 303 K). The entropy change (ΔS), enthalpy change (ΔH) and Gibbs free energy (ΔG) thermodynamic parameters were obtained according to Eqs. (12) to (15) and the consquences are shown in Table 8.
Co (mg/L)
ΔG (kJ/mol)
ΔH (kJ/mol)
ΔS (J/mol·K)
283 K
293 K
303 K
60
−12.118
−12.824
−13.949
13.898
91.651
80
−12.957
−13.864
−15.355
21.128
120.045
100
−12.957
−13.353
−14.756
12.433
89.123
120
−12.487
−13.618
−14.083
23.332
126.339
140
−12.459
−13.822
−15.123
25.604
134.437
where T(K) represents the absolute Kelvin temperature; R represents the standard molar gas constant (8.3145 J/mol·K); and Kd represents the partition coefficient.
Fig. 13 shows that 1/T is linearly correlated with lnKd, and lnKd tends to aggrandize and then reduce with the rise of initial GO concentration. In order to further understand the energy changes during adsorption, the entropy change and enthalpy change were further obtained, which are two important state functions in thermodynamics. A positive value of ΔH indicates that the adsorption process is an endothermic reaction, i.e., the system needs to absorb heat from the external environment during the adsorption process, which usually implies that the adsorption effect is enhanced as the temperature increases. A negative value of ΔG indicates that the adsorption process is spontaneous under the conditions studied. In summary, ΔH > 0, Gibbs energy change ΔG < 0, and ΔS > 0, indicating that the adsorption process is a heat adsorption reaction that can be carried out spontaneously (Vieira et al., 2021), and the adsorption reaction favoured by temperature increase, which is in line with the result that the adsorption amount is subsequently enhanced with the increase in temperature.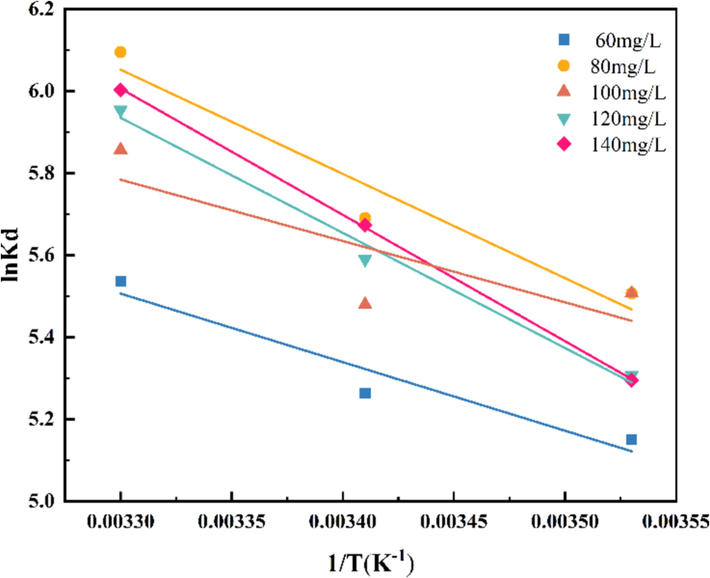
Adsorption thermodynamics.
5 Desorption test
The precipitate obtained after adsorption was lyophilized by centrifugation and poured into 0.5 mol/L sodium hydroxide solution and the desorption bottle was placed in a constant temperature water bath. Continuous stirring was carried out for 2 h by means of a magnetic stirrer to ensure that the adsorbent and the desorbent solution were well mixed. At the end of the desorption, the solid obtained after centrifugal lyophilization of the solution was re-run for the adsorption test. The above procedure was carried out for five cycles. An initial GO concentration of 5 mg CCR and 80 mg/L was used at 303 K. The GO removal efficiency was 87.4 % after one cycle (Fig. 14). As the number of cycles increased, the CCR may have agglomerated, thus reducing the number of adsorption sites and slightly decreasing the removal efficiency. 5 cycles resulted in a high removal efficiency of 72.6 %, indicating that the CCR is highly stable and reusable.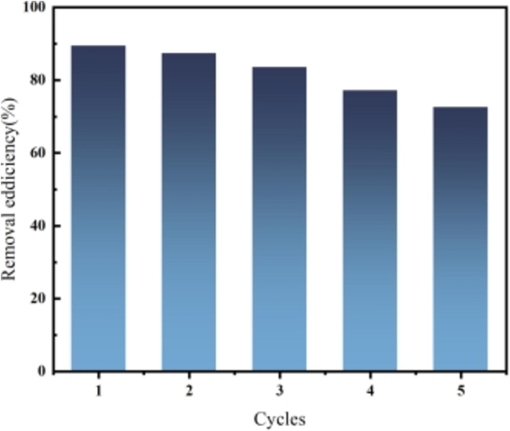
Number of cycles and resolution of CCR desorption.
6 Application of soil curing using CCR
Fig. 15 shows the unconfined compressive stress–strain curves of CCRX specimens with different CCR contents at 7d curing age, and there is a clear peak in the curves. The peak of this curve is shown in Fig. 16. With the rise in strain, the axial stress gradually rise to the crest value and reduces to a stable value as time advances. The compressive strength increases linearly with CCR content and the slope of the trend line also increases, indicating that elevating the content of CCR at a certain doping level improves the strength and ductility of the specimens. For example, the strength of CCR test with different dosage of CCR was enhanced by 29 %, 20 %, 27 % and 29 % compared with the specimens without GO doping, which may be due to the fact that CCR in solution, hydroxide root is in a free state, which enhances the alkalinity of the system and puts the soil body in a strong alkaline environment (Sargent et al., 2016).One of the reactive silica dissociates under alkaline environmental excitation, and Ca+ reacts with the carboxyl groups of GO to produce colloidal substances such as calcium silicate (C-S-H) (Zhang et al., 2024a). Gelation leads to the formation of a stable skeleton structure, which enhances the compressive strength of the soil and produces a curing effect similar to that of cement. The results show that the incorporation of CCR can interact with GO to produce a curing effect on the soil, and it is feasible to use CCR to reinforce the foundation soil contaminated with GO.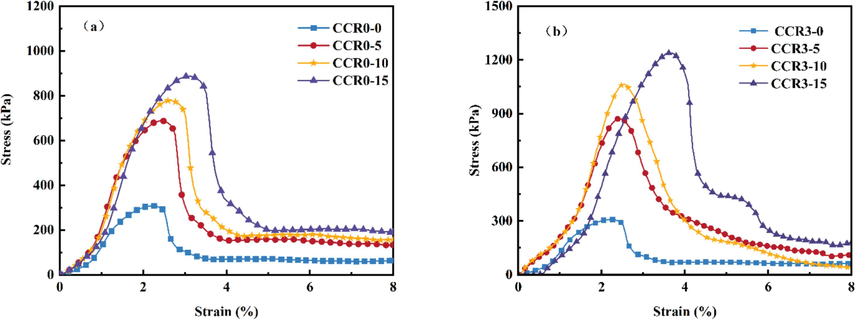
Stress–strain curves with different CCR dosages.
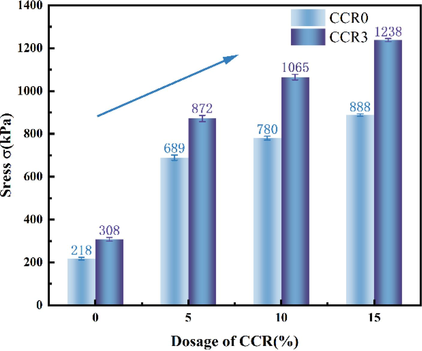
Unconfined compressive strength of CCRX specimens with different CCR dosages.
7 Discussion
From an economic point of view, CCR is a by-product of the acetylene production process and belongs to the industrial waste CCR, which has a negligible raw material cost but may involve a small amount of treatment and pre-treatment costs, which has significant economic benefits. In the experiment, the dosage of CCR was only 5 mg, which is significantly less compared with other adsorbents in Table 5, but still achieves a high adsorption efficiency. This indicates that CCR per unit mass has a strong adsorption capacity for GO and can achieve the expected pollutant removal effect with less material consumption.
8 Conclusions
In this paper, the adsorption of CCR and its curing effect on soil were investigated from environmental and geotechnical perspectives. The effect of adsorption of CCR on graphene oxide under different conditions was investigated using adsorption isotherms, thermodynamics and adsorption kinetics, and characterised by microscopic experiments for example SEM, TEM, XRD, FTIR, XPS and AFM. Mechanical property tests were used to reveal the effect of CCR content on the strength of specimens, and the chief consequences are as follows:
(1) The optimal test criteria obtained by varying one of the factors affecting the adsorption effect (pH, adsorbent mass, initial concentration of adsorbate, and test temperature) were pH = 11, CCR mass of 5 mg, GO initially 80 mg/L, and temperature of 303 K. The optimal test conditions for the adsorption effect are as follows.
(2) CCR reacts with flaky GO, which attaches to the surface of CCR. The adsorption mechanism of CCR on GO is mainly due to the chemical precipitation of metal ions and the interaction between functional groups. Where the interaction of functional groups is done through C-O and O-C = O covalent bonds.
(3) The Langmuir isotherm model better represents the adsorption process of the removal of GO by CCR, which belongs to the homogeneous adsorption of monomolecular layers. The adsorption kinetics is more in line with the pseudo-secondary kinetic model, which belongs to chemisorption. The kinetics showed that the reaction quotiety was faster in the first 0.167 h, and the equilibrium could be reached in 1 h, and the adsorption capacity of CCR was stronger. The rise in temperature is favourable to the reaction, which is a heat-absorbing reaction.
(4) Elevating the CCR content within a certain range, CCR combines with GO to produce a gelling effect, which can effectively enhance the strength of soil samples.
It can be seen that CCR is beneficial for the removal of detrimental substances in solution and the solidification of soil. As an adsorbent and curing agent, it has the potential for sustainable development, promotes the secondary use of waste resources, improves the state of the environment, and has extensive applications in solid waste management. This approach not only promotes the resourceful reuse of waste, but also provides a new way for the treatment and utilization of CCR, which has good prospects for sustainable development. In addition, the process of adsorption of GO by CCR provides a positive contribution to the enhancement of resource utilization and improvement of environmental quality. However, we also noticed that CCR may have competitive adsorption of other impurities or organic matter in the water body when adsorbing GO, which in turn affects its selectivity and adsorption efficiency for GO. This finding provides a new direction for our future research.
CRediT authorship contribution statement
Na Li: Writing – review & editing, Conceptualization. Meixin Fan: Writing – original draft, Investigation. Ping Jiang: Visualization, Formal analysis. Yingdi Pang: Methodology. Song Yang: Project administration, Formal analysis. Wei Wang: Supervision, Project administration, Methodology.
Declaration of Competing Interest
The authors declare that they have no known competing financial interests or personal relationships that could have appeared to influence the work reported in this paper.
References
- Physicochemical characteristics of cementitious building materials derived from industrial solid wastes. Constr. Build. Mater.. 2016;126:983-990.
- [CrossRef] [Google Scholar]
- XPS and structural studies of high quality graphene oxide and reduced graphene oxide prepared by different chemical oxidation methods. Ceram. Int.. 2019;45(11):14439-14448.
- [CrossRef] [Google Scholar]
- Guidelines for the use and interpretation of adsorption isotherm models: A review. J. Hazard. Mater.. 2020;393
- [CrossRef] [Google Scholar]
- The remediation efficiency of heavy metal pollutants in water by industrial red mud particle waste. Environ. Technol. Innov.. 2022;28
- [CrossRef] [Google Scholar]
- The migration process and temperature effect of aqueous solutions contaminated by heavy metal ions in unsaturated silty soils. Heliyon. 2024;10(9)
- [CrossRef] [Google Scholar]
- Sulphur compounds removal from an industrial landfill leachate by catalytic oxidation and chemical precipitation: From a hazardous effluent to a value-added product. Sci. Total Environ.. 2019;655:1249-1260.
- [CrossRef] [Google Scholar]
- Effect of functional groups on crumpling behavior and structure of graphene oxide. Acta Phys Sin-Ch Ed. 2020;69(19)
- [CrossRef] [Google Scholar]
- Host-guest complexes of β-cyclodextrin with methyl orange/methylene blue-derived multi-heteroatom doped carbon materials for supercapacitors. Compos. Commun.. 2019;16:117-123.
- [CrossRef] [Google Scholar]
- Study on the solidification/stabilization of cadmium-contaminated soil by red mud-assisted blast furnace slag under excitation conditions. J. Clean Prod.. 2024;435
- [CrossRef] [Google Scholar]
- Effect of pH on Adsorption Characteristics of Uranium and Plutonium. He-Huaxue Yu Fangshe Huaxue/journal of Nuclear and Radiochemistry. 2017;39(3):213-217.
- [CrossRef] [Google Scholar]
- Removal of bisphenol a from wastewater by adsorption and membrane separation: Performances and mechanisms. Chem. Eng. J.. 2024;484
- [CrossRef] [Google Scholar]
- Performance and evaluation of calcium carbide residue stabilized lateritic soil for construction materials. Case Stud. Constr. Mater.. 2020;13
- [CrossRef] [Google Scholar]
- Carbon dioxide capture with aqueous calcium carbide residual solution for calcium carbonate synthesis and its use as an epoxy resin filler. J. Environ. Manage. 2023;345
- [CrossRef] [Google Scholar]
- Study of the adsorption behavior of tetracycline onto suspended sediments in the Yellow River, China: Insights into the transportation and mechanism. Sci. Total Environ.. 2023;889
- [CrossRef] [Google Scholar]
- Removal of the heavy metal ion nickel (II) via an adsorption method using flower globular magnesium hydroxide. J. Hazard. Mater. 2019
- [CrossRef] [Google Scholar]
- Water security assessment for effective water resource management based on multi-temporal blue and green water footprints. J. Hydrol.. 2024;632
- [CrossRef] [Google Scholar]
- Evaluation of porous calcium silicate hydrate derived from carbide slag for removing phosphate from wastewater. Chem. Eng. J.. 2018;354:1-11.
- [CrossRef] [Google Scholar]
- Preparation of 2-hydroxy-1-naphthalene Functionalized SBA-15 Adsorbent for the Adsorption of Chromium(III) Ions from Aqueous Solution. J. Inorg. Mater.. 2021;36(11):1163-1170.
- [CrossRef] [Google Scholar]
- Noble Metal Phosphides Supported on CoNi Metaphosphate for Efficient Overall Water Splitting. ACS Appl. Mater. Interfaces.. 2024;16(7):8939-8948.
- [CrossRef] [Google Scholar]
- Advanced XPS characterization: XPS-based multi-technique analyses for comprehensive understanding of functional materials. Mater. Chem. Front.. 2021;5(22):7931-7963.
- [CrossRef] [Google Scholar]
- Evidence of graphitic AB stacking order of graphite oxides. J. Am. Chem. Soc.. 2008;130(4):1362-1366.
- [CrossRef] [Google Scholar]
- The absorption effect and mechanism of graphene oxide removal from aqueous solution by basalt stone power. Arabian Journal of Chemistry. 2024;17(7)
- [CrossRef] [Google Scholar]
- Treatment of Wastewater Containing a Mixture of Heavy Metal Ions (Copper-Zinc, Copper-Nickel) using Ion-Exchange Methods. J. Ecol.. 2019;Eng. (11)
- [CrossRef] [Google Scholar]
- The Chemical and structural analysis of graphene oxide with different degrees of oxidation. Carbon. 2013;53:38-49.
- [CrossRef] [Google Scholar]
- Effect of pore size distribution and particle size of porous metal oxides on phosphate adsorption capacity and kinetics. Chem. Eng. J.. 2019;358:160-169.
- [CrossRef] [Google Scholar]
- Effects of solution chemistry on the stability and transport of graphene oxide nanoparticles in saturated porous media. Abstr. Pap. Am. Chem. Soc.. 2013;245
- [CrossRef] [Google Scholar]
- Modification of corncob with citric acid to enhance its capacity for adsorbing cadmium(II) from water solution. Chem. Eng. J.. 2012;180:113-120.
- [CrossRef] [Google Scholar]
- Performance and mechanism of illite in removing graphene oxide from aqueous solution. Appl. Clay Sci.. 2022;230
- [CrossRef] [Google Scholar]
- Study on the adsorptionperformance and adsorption mechanism of graphene oxide by red sandstone inaqueous solution. Adsorpt. Sci. Technol. 20222557107
- [CrossRef] [Google Scholar]
- Potential of waste glass to adsorb graphene oxide from aqueous solutions: Mechanisms and behavior. Ceram. Int.. 2024;50(13):24326-24338.
- [CrossRef] [Google Scholar]
- The fate of aggregated graphene oxide upon the increasing of pH: An experimental and molecular dynamic study. Sci. Total Environ.. 2022;851
- [CrossRef] [Google Scholar]
- Effect of Al<sub>2</sub>O<sub>3</sub>/SiO<sub>2</sub> mass ratio on the structure and properties of medical neutral boroaluminosilicate glass based on XPS and infrared analysis. Ceram. Int.. 2023;49(23):38499-38508.
- [CrossRef] [Google Scholar]
- Research Progress and Applications of qPlus Noncontact Atomic Force Microscopy. Acta Phys. Chim. Sin.. 2017;33(1):183-197.
- [CrossRef] [Google Scholar]
- Calcium carbide residue - a promising hidden source of hydrogen. Green Chem.. 2023;25(9):3524-3532.
- [CrossRef] [Google Scholar]
- Materials, Effects of Calcium Carbide Residue and High-Silicon Limestone on Synthesis of Belite-Barium Calcium Sulphoaluminate Cement. J. Inorg. Mater.. 2011;21(4):900-905.
- [CrossRef] [Google Scholar]
- An efficient strategy for improving short-chain fatty acid production from sludge anaerobic fermentation with calcium carbide residue addition. J. Environ.. 2023;11(5)
- [CrossRef] [Google Scholar]
- Metal-Based Nanotoxicity and Detoxification Pathways in Higher Plants. Environ. Sci. Techno.. 2015;49(12):7109-7122.
- [CrossRef] [Google Scholar]
- Synthesis of GO/HEMA, GO/HEMA/TiO<sub>2</sub>, and GO/Fe<sub>3</sub>O<sub>4</sub>/HEMA as novel nanocomposites and their dye removal ability. Adv. Compos. Hybrid Mater.. 2021;4(4):1185-1204.
- [CrossRef] [Google Scholar]
- Removal of pharmaceuticals (diclofenac and amoxicillin) by maltodextrin/reduced graphene and maltodextrin/reduced graphene/copper oxide nanocomposites. Chemosphere. 2022;299:134435.
- [CrossRef] [Google Scholar]
- Fabrication of different adsorbents based on zirconium oxide, graphene oxide, and dextrin for removal of green malachite dye from aqueous solutions. Environ. Res.. 2022;214
- [CrossRef] [Google Scholar]
- Synthesis and characterization Agar/GO/ZnO NPs nanocomposite for removal of methylene blue and methyl orange as azo dyes from food industrial effluents. Food Chem. Toxicol.. 2022;169
- [CrossRef] [Google Scholar]
- Activated carbon impregnated by zero-valent iron nanoparticles (AC/nZVI) optimized for simultaneous adsorption and reduction of aqueous hexavalent chromium: Material characterizations and kinetic studies. Chem. Eng. J.. 2018;353:781-795.
- [CrossRef] [Google Scholar]
- Synthesis, characterization and application of Carboxylmethyl cellulose, Guar gam, and Graphene oxide as novel composite adsorbents for removal of malachite green from aqueous solution. Adv. Compos. Hybrid Mater.. 2022;5(1):335-349.
- [CrossRef] [Google Scholar]
- Efficient removal of methyl orange from aqueous solution using mesoporous ZSM-5 zeolite: Synthesis, kinetics and isotherm studies. Colloid. Surface a.. 2021;611
- [CrossRef] [Google Scholar]
- Calcium carbide residue - a key inorganic component of the sustainable carbon cycle. Russ. Chem. Rev+.. 2022;91(7)
- [CrossRef] [Google Scholar]
- Sustainable application of calcium carbide residue as a filler for 3D printing materials. Sci. Rep-Uk.. 2023;13(1)
- [CrossRef] [Google Scholar]
- A new low carbon cementitious binder for stabilising weak ground conditions through deep soil mixing. Soils Found.. 2016;56(6):1021-1034.
- [CrossRef] [Google Scholar]
- Removal of Co(II) from fuel ethanol by silica-gel supported PAMAM dendrimers: Combined experimental and theoretical study. Fuel. 2017;199:91-101.
- [CrossRef] [Google Scholar]
- Porous alginate hydrogel beads with spatially separated acidic and basic moieties for selective adsorption of dyes. J. Clean Prod.. 2024;451
- [CrossRef] [Google Scholar]
- On validity, physical meaning, mechanism insights and regression of adsorption kinetic models. J. Mol. Liq.. 2023;376
- [CrossRef] [Google Scholar]
- Chitosan-based hydrogels for the sorption of metals and dyes in water: isothermal, kinetic, and thermodynamic evaluations. Colloid. Polym. Sci. 2021;299(4):649-662.
- [CrossRef] [Google Scholar]
- Direct current electrochemical method for removal and recovery of heavy metals from water using straw biochar electrode. J. Clean Prod.. 2022;Mar. 10:339.
- [CrossRef] [Google Scholar]
- Adsorption of antibiotics on different microplastics (MPs): Behavior and mechanism. Sci. Total Environ.. 2023;863
- [CrossRef] [Google Scholar]
- Polyethyleneimine modified activated carbon for adsorption of Cd(II) in aqueous solution. J. Environ.. 2019;7(3)
- [CrossRef] [Google Scholar]
- Elimination of Bisphenol A from Water via Graphene Oxide Adsorption. Acta Phys. Chim. Sin.. 2013;29(4):829-836.
- [CrossRef] [Google Scholar]
- Study of the dynamic adsorption and the effect of the presence of different cations and anions on the adsorption of As(V) on GUT-3. Appl. Organomet. Chem.. 2021;35(8)
- [CrossRef] [Google Scholar]
- Experimental investigation and analysis of the impact of salinity erosion on the strength of graphene oxide cement soil. Case Stud. Constr. Mater.. 2024;21
- [CrossRef] [Google Scholar]
- Synthesis of Ca-based metal-organic frameworks from carbide slag for CO<sub>2</sub> adsorption. Sep. Purif. Technol.. 2024;335
- [CrossRef] [Google Scholar]
- Evaluation of dioxins and dioxin-like compounds from a cement plant using carbide slag from chlor-alkali industry as the major raw material. J. Hazard. Mater.. 2017;330:135-141.
- [CrossRef] [Google Scholar]
- Removal of anionic and cationic dyes using porous chitosan/carboxymethyl cellulose-PEG hydrogels: Optimization, adsorption kinetics, isotherm and thermodynamics studies. Int J Biol Macromol. 2023;231
- [CrossRef] [Google Scholar]


