

Removal of Eosin dye from simulated media onto lemon peel-based low cost biosorbent
-
Received: ,
Accepted: ,
This article was originally published by Elsevier and was migrated to Scientific Scholar after the change of Publisher.
Peer review under responsibility of King Saud University.
Abstract
Abstract
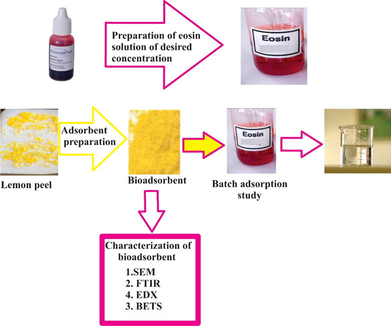
Synthetic dyes from different sources (wastewater and effluents) can be harmful to the environment even at minor quantity. Low cost natural biosorbent have been proved beneficial for water treatment and have excellent capability for the elimination of certain dyes from aqueous media. The present study purposed to utilize lemon peel as a natural sorbent for eosin dye in an aqueous media. The biosorbent were analyzed utilizing fourier transform infrared spectroscopy, scanning electron microscope (SEM), energy-dispersive X-ray analysis (EDX) and surface area analyzer (BET). The batch adsorption approach was carried out to optimize the basic parameters affecting the sorption phenomena. Anionic dye, eosin, was removed by adsorption utilizing lemon peel, as an biosorbent and such adsorption are affected by different physical factors i.e adsorbent dose, contact time, temperature etc. Freundlich and Langmuir's adsorption isotherm models are used to verify the results. The monolayer adsorption capacity was 8.240 mg/g at 30 °C that is calculated from Langmuir isotherm. The adsorption process is exothermic, shown by calculations thermodynamic parameters. Kinetics studies have represented that the adsorption process could be better explained by pseudo-second-order kinetics. All the parameters of biosorbent were compared with each other and proved that lemon peel, which is readily available, economic biosorbent, for the removal of eosin dye from the aqueous media.
Keywords
Lemon peel
Dye
Langmuir and Freundlich constants
SEM
FTIR
EDX

1 Introduction
A healthy environment is the right of every human being but rapid industrialization deprived humans of this right. For the last couple of decades major cities of most of the countries are facing the issue of pollution. Pollution is a worldwide problem, but developing countries suffers more due to lack of resources for waste management. Among all the kinds of pollution, water pollution causes the worst effect on the ecosystem as it disturbs aquatic life and affects directly or indirectly human health. Water is necessary for the existence of life.
Freshwater without contamination is essential for not only domestic use but also important in agriculture and industrial use. Highly contaminated water is discharged from chemical industries such as textile, leather, cosmetics, paint, and food processing due to the high consumption of dyes in these industries. It has been estimated that almost 10–15% of dyes are not bound and discharged into the effluent (Shah, Sharma, Dar, & Bamezai, 2021).
Eosin dye is commonly used in textile, pharmaceutical preparations, and the art industry (Atia, Marzouq, Hassan, & Eltoukhi, 2019). It binds with protein and forms a water-soluble stable complex. Due to this property, it is also used for staining cytoplasm in histology. It is highly toxic and makes water unfit for use. It has aromatic rings which make it stable against degradation. It is highly carcinogenic and causes adverse effects on human health. It causes damage to gastrointestinal organs, liver, kidneys, and lungs (Guruge et al., 2019). It causes redness, swelling, and pain and is very harmful in direct contact with the cornea. Its high concentration even affects the central nervous system (Liu et al., 2021). Various approaches have been utilized for elimination of pollutants (dyes and heavy metals) from aqueous media i.e. ion exchange (Bajpai & Bhowmik, 2010), photocatalytic degradation (Arief, Jamarun, & Stiadi, 2017; Singh, Chang, Koduru, & Yang, 2018; Stiadi, 2018), oxidation (Igwegbe, Ahmadi, Rahdar, Ramazani, & Mollazehi, 2020; Rahdar, Igwegbe, Rahdar, & Ahmadi, 2018), membrane filtration (Mi, Xu, Guo, Wu, & An, 2020) (M. Li, Wang, Wu, Li, & Zhi, 2012), biological treatment (Sekar, Surianarayanan, Ranganathan, MacFarlane, & Mandal, 2012), flocculation/coagulation (Villalobos, Cid, & González, 2016), and adsorption (Ighalo & Adeniyi, 2020, 2021; Wang et al., 2014). Adsorption is most favored by scientists and researchers due to its simplicity, low cost (Eletta, Adeniyi, Ighalo, Onifade, & Ayandele, 2020), convenience and efficient performance (Hasanzadeh, Moghadam, Bahri-Laleh, & Ziaee, 2016; Zare, Lakouraj, & Masoumi, 2018).
Several attempts have been made in recent years to develop more effective and cost-effective biosorbents derived from natural biomass resources rather than commercial adsorbents. Biologically based materials i.e. starch (Karoyo, Dehabadi, & Wilson, 2018), chiston (Ayoub, Venditti, Pawlak, Salam, & Hubbe, 2013), cellulose (Y. Li, Xiao, Pan, & Wang, 2018) and lignin (Qin, Yang, & Qiu, 2015) have been utilized dye for various reasons. These reasons involve their low preparation cost, superior physiochemical characteristic, biocompatibility, copiousness, biodegradability, affordability and chemical functionality (Kean & Thanou, 2010). Although commercial activated carbon is the favored sorbent for elimination of dye due to its high surface area, greater adsorption capability and microporous structure but its excess use is limited due to greater economical and regeneration cost (Dutta, Basu, & Ghar, 2001; Jain, Gupta, & Bhatnagar, 2003; Malik, 2003). Therefore, several attempts have been made by scientists and researchers to develop a new low cost biosorbent from different waste derived from agriculture and industries, possessing same potential as commercial activated carbon. Despite a lot of investigation have been carried out in this area (Garg, Gupta, Yadav, & Kumar, 2003; Lata, Garg, & Gupta, 2007, 2008; Pavan, Lima, Dias, & Mazzocato, 2008), no research was conducted to explore the feasibility of usage of lemon peel (a market waste) as the low cost precursor for activated carbon preparation.
Pakistan is largest producer of Citrus Limonum in the whole world. Citrus Limonum is of great importance in Pakistan because lemon is used as essential ingredient in cooking, juice lemonade, beverage and some other drink. To make fruitful use of this inexpensive waste, lemon peel after juice extraction can be used as adsorbent for eosin dye removal from water. Bhatnagar, abdul Razak, Zainab, et al. used the lemon peel for removal reactive red (abdul Razak, Rushdi, Gadhban, Al-Najjar, & Al-Sharify, 2020) and similarly Aichour, Amina, et al. reported the removal of methylene blue using lemon peels activated with phosphoric acid(Aichour, Zaghouane-Boudiaf, Iborra, & Polo, 2018). Therefore, the current study attempted to prepare a low-cost adsorbent from lemon peel by carbonizing it using a chemical activation method. Lemon peel has no use after the juice has been extracted from the fruit and is therefore cheap and widely available; however, as a market waste, citrus fruit peel creates disposal issues in regarding the environmental pollution. Therefore, converting lemon peel into a low-cost sorbents serves two main purposes. First, undesired market waste is turned into a value-added product, and secondly, this product can then be effectively used to reduce environmental pollution.
In this work, the adsorption capacity of lemon peels was studied at different physical parameters such as pH, time, dose, concentration, and temperature. Kinetics and equilibrium results were explained using Langmuir and Freundlich isotherm models.
2 Materials and experimental methods
2.1 Materials
2.1.1 Chemicals
All the apparatus used throughout the experimental work had standard quick fit joints and were dried at 110 °C. The chemicals for the research were eosin dye (Merck), doubly distilled water, sodium hydroxide (Merck), nitric acids (Merck), Hydrochloric acid (Merck), and lemon peel. The structural formula of eosin Showed in Fig. 1.
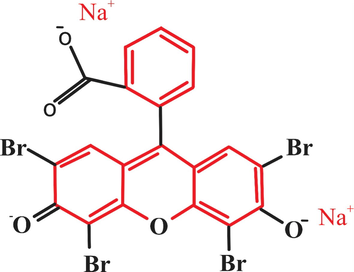
- Structure formula of eosin.
2.1.2 Preparation of biosorbent
The lemon peel was collected from native market of Punjab province in January 2019. Lemon peel used in the experiments was washed with distilled water to remove foreign impurities. It was then dried in oven at 110 °C for 24 h till all moisture was evaporated. The dried lemon peel wasthen thermally activated at 425 K in furnace for 90 min in the air presence. After this activation, the ash content was removed by further washing it with double distilled water and dried in oven at 110 °C for 19 hrs and different particles size in the range of 20–90 nm was obtained after sieving the powder.
2.1.3 Characterizations of biosorbent
The morphological biosorbent were investigated by SEM (Model: Nova Nano-450, FEI, US) at 10.0 kV and 500 magnifications. Dynamic light scattering (Model: Malvern Nano -ZS90) was utilized to calculate the particles size distribution. Brunauer- Emmett- teller (Model: BETASP 2020) measurements were performed and the nitrogen adsorption isotherm values were evaluated by using ASAP 2020-Micromeretics 77 K.
2.1.4 Adsorption experiments
Lemon peel(biosorbent) with particle size greater than 10 nm was added 25 mL eosin having initial concentration (0.1–2 mg L-1) with a variation in pH (2–8). The pH of solution was monitored utilizing either 0.1 sodium hydroxide (NaOH) and 0.1 N nitric acids (HNO3) that maintained the pH via buffer solution (Zein et al., 2015). The impact of contact time was studied 0, 20, 40 and 80 min utilizing stirring rate (50–250 rpm). The effect of particles size was studied at 10, 20, 30, 40, 50, 60, 70, 80 and 90 nm. The study of impact of temperature was performed at temperature in the rang of 20–60 °C. The mixture was then filtered and change in dye concentration was investigated using UV–Vis double beam UVD = 3500, Labomeda, Inc. at λmax = 515 nm. In the meantime, the utilized biosorbent was characterized by FTIR, SEM, EDX and BET.
The elimination or removal (R%) was calculating utilizing eqn (1).
The formula used to find the amount of dye adsorbed, qe, by is shown in eqn (2):
2.2 Adsorption isotherm
Various equation of isotherm are given in the literature to investigate the equilibrium data (Abu-El-Halawa, Zabin et al. 2016). Freundlich and Langmuir isotherm are applied in the present study. Langmuir isotherm in its linear form is represented by equation (3) (Abu-El-Halawa, Zabin, & Abu-Sittah, 2016).
Freundlich isotherm in its linear form is represented by eqn (4) (Shakoor and Nasar 2018).
The Langmuir model is useful in calculating the RL, which has not any dimension showed in eqn (5).
RL predict, the sorption phenomena can be either unfavorable (RL greater than 1), favorable (0 < RL < ), irreversible (RL = 0) and linear (RL = 0) (Ray, Gusain, & Kumar, 2020).
2.3 Biosorption kinetics
The pseudo first order kinetic equation is given by Lagergren (Ghosh, Kar, Chatterjee, Bar, & Das, 2021), showed by eqn (6).
The pseudo second order kinetic equation is defined as in eqn (7) (Hamoudi, Hamdi, & Brendlé, 2018) and defined as eqn (7).
Where, qe represents the adsorption capability (mg g−1) at equilibrium state and qt represents adsorption capability at any time (minute) and K2 (g/mg min−1) represent rate constant for second order adsorption phenomena.
2.4 Thermodynamic analyses
Thermodynamic study is required to investigate the feasibility and spontaneity of adsorption phenomena. These thermodynamic parameters were examined utilizing eqn (8) and (9) (Ray et al., 2020).
ΔSo (Kjmol−1) represents entropy, ΔGo (Kjmol−1) represents Gibb’s free energy and ΔHo (Kjmol−1) represents enthalpy.
3 Results and discussion
3.1 Characterizations of biosorbent
The FTIR spectrum of biosorbent and eosin load with lemon peel was recoded and compared in the range of 500 to 4000 cm-1to attain information related to the nature of dye ion-adsorbent relationship. This interaction showed in Fig. 2. The peak obtained at 1035 cm−1 due to CO-O-CO (anhydride) strong or broad stretching. The peak obtained at 1226 cm-1 was attributed to stretching frequency of amine (C-N) group. The peak obtained at 2850 cm-1 was attributed to stretching frequency of amine (N-H) amine salt. The peak obtained at 3290 cm-1 was attributed to strong stretching of amine Hydroxyl (O-H) group. The FTIR spectrum of biosorbent and eosin represented same characteristics expect for minor changes in peaks. These minor changes in peaks before or after adsorption indicates the involvement of few functional groups in the sorption of eosin on biosorbent surface through Van der Waals forces (weak electrostatics interaction).
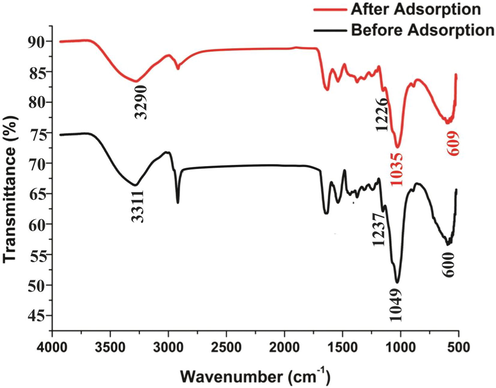
- FTIR Spectrum of Lemon peel before or after adsorption.
3.1.1 SEM analysis
The biosorbent was investigated on SEM at X300 Magnification before and after adsorption and the result is illustrated in Fig. 3. The SEM images displayed irregular porous surface with cavities. Adsorption capacity largely depends on the multiporous surface with cavities and similar results is reported by Elella et al. and Manna et al. (Elella, Sabaa et al. 2019),(Manna, Roy et al. 2017). The morphology biosorbent predicted that adsorpton of eosin dye might have been occurred through diffusion process. Fig. 3B interpret that large number of micro and macro pores are remained open for access to the interior of cavities.
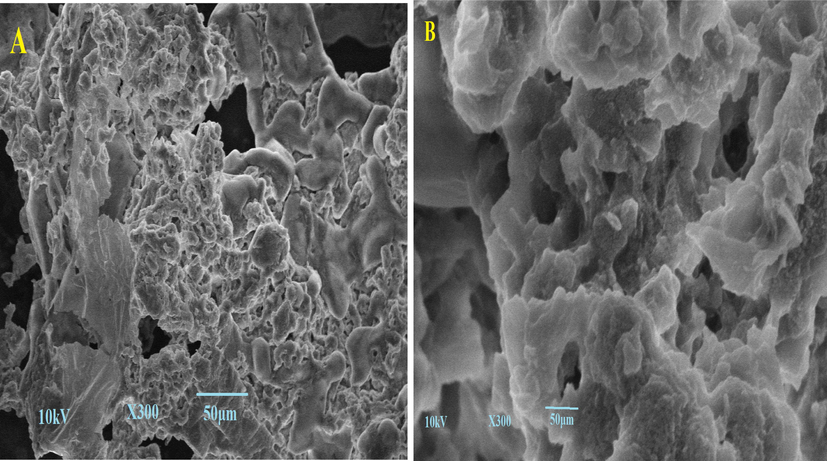
- SEM images of lemon peel (A) before adsorption (B) After adsorption.
3.1.2 Energy-Dispersive X-ray analysis
The elemental analysis of biosorbent showed the existence of various chemical elements in Fig. 4. Fig. 4 interpreted the existence of carbon, oxygen and hydrogen evaluated at 54%, 25% and 20% respectively. The presence of sulfur confirmed the organic nature of biosorbent (Boumchita, Lahrichi et al.). High content of oxygen revealed that the surface of biosorbent is more acidic.
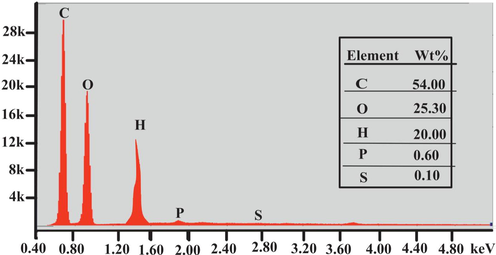
- EDX spectra of Lemon peel.
3.1.3 Nitrogen Adsorption- desorptsion isotherm
The nitrogen adsorption–desorption isotherm was achieved at 77 K showed in Fig. 5. According to IUPAC classification, the isotherm curve is Type II. It proved that bio-adsorbent surface was macroporous. The pore size was calculated using equation 4Vp/S (Balogoun, Bawa et al. 2015). A wide pore distribution are in the range ranging from 0.9 to 193 nm. Fig. 6 also confirmed the presence of few mesopores, micropores along with macropores. The diameter of an eosin dye molecule is 1.084 nm (10.84 A°)(Jin, Zhang, Lu, & Li, 2006). This result shows that eosin dye molecule can easily diffuse into the inner available pore of biosorbent.
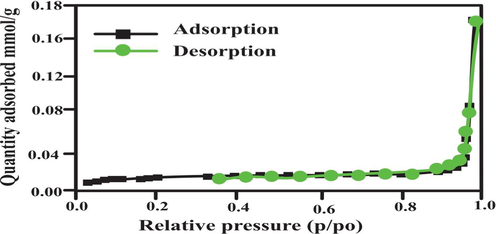
- Bet isotherm for Lemon peel.
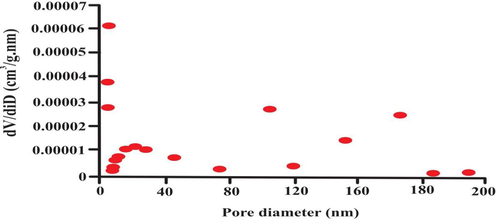
- Bet analysis for pore size distribution.
3.2 Effect of particles size of biosorbent
The correlation of adsorption capacity with the size of biosorbent’s particles (20–90 nm) of biosorbent was studied and reported in Table 1 and Fig. 7.. It was investigated that adsorption decrease with increase in biosorbent sizes. This is because of the increase in the surface area of the biosorbent. The study showed that biosorbent adsorption capacity decreased linearly. Similar result was reported by Ravikumar, Deebika et al. (Ravikumar, Deebika et al. 2005). The maximum rate of adsorption of eosin dye was observed at 10 nm of particles size while minimum at 90 nm of particles size. This may be described by the fact that the biosorbent consist of greater number of accessible active site and possessed greater surface area with smallest particles size. (Ikenyiri & Ukpaka, 2016).
| Size (mesh) | 10–20 | 20–40 | 40–60 | 60–80 | |||||
|---|---|---|---|---|---|---|---|---|---|
| Adsorption rate (%) | 82.56 | 86.72 | 91.12 | 92.16 | |||||
|
Amount of adsorbent (g) |
0.1 | 0.25 | 0.50 | 0.75 | 1.00 | 1.25 | 1.50 | 1.75 | 2.00 |
| Adsorption rate (%) | 56.80 | 82.76 | 90.76 | 89.56 | 87.80 | 84.68 | 83.20 | 76.28 | 71.60 |
| Time (min) | 10 | 20 | 30 | 40 | 50 | 60 | 70 | 80 | |
| Adsorption rate (%) | 82.92 | 85.80 | 87.00 | 87.64 | 87.92 | 88.28 | 87.56 | 86.12 | |
| Initial dye conc( mg L-1) | 5 | 10 | 15 | 20 | 25 | ||||
| Adsorption rate (%) | 80.58 | 82.96 | 86.5 | 88.38 | 90.06 |
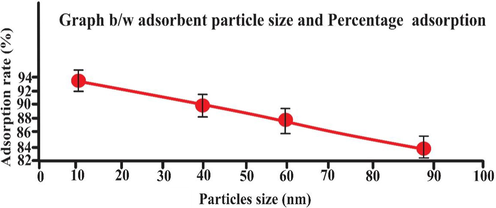
- Effect of biosorbent particle size (mesh) on adsorption rate (25 mL eosin having initial concentration 25 mg L-1,adsorbent dosage = 0.5, particles size = 20 nm, pH = 2, temperature = 30 0C, contact time = 60 min, stirring rate = 150 rpm). Error bars indicate standard deviation of thrice replicates.
3.3 Effect of biosorbent dose
The biosorbent dose plays a major role in eosin uptake as shown in Fig. 8. The rate of elimination increased with the increase in biosorbent dose (El-Katori, Fouda, & Al-Sarawy, 2011). Removal of dye is observed when the absorbent dose was 0.1 g to 2.0 g. maximum adsorption is found at 0.5 g. This is due to increase in the surface area and number of site of biosorbent (Bello & Ahmad, 2011). The decrease in elimination rate was due to unsaturation of available adsorption sites during process, however, the number of sites available for elimination of increase or to agglomeration or aggregation of biosorbent that leads to the decrease of total absorbent surface area (Blázquez, Martín-Lara, Tenorio, & Calero, 2011; Shakoor & Nasar, 2016). There are some other bioadsorbent such as Orange peel (Al-Azabi, Al-Marog, Abukrain, & Sulyman, 2018). Salix babylonica leaves (Khodabandehloo, Rahbar-Kelishami, & Shayesteh, 2017), lotus leaf (X. Han, Wang, & Ma, 2011) and Phonix tree’s leaves (R. Han et al., 2007) were utilized for the elimination of dye from water, same effect of biosorbent dosage on the elimination rate and capacity was recorded.
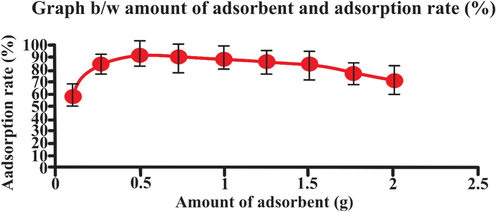
- Effect of adsorbent amount (g) on adsorption rate (25 mL eosin having initial concentration 25 mg L-1,adsorbent dosage = 0.5, particles size = 20 nm, pH = 2, temperature = 30 0C, contact time = 60 min, stirring rate = 150 rpm). Error bars indicate standard deviation of thrice replicate.
3.4 Effect of contact time:
The adsorption of 25 mg L-1 of eosin dye was examined at different contact time (10 – 80 min).
The relationship between the dye uptake and contact time is illustrated in Fig. 9. The Fig. 9 showed that, initially adsorption rate is greater on the external surface of adsorbent followed by a slower internal diffusion phenomena that is rate determining step (Yaneva, Koumanova et al. 2013), (Gialamouidis, Mitrakas et al. 2010). The optimum time period for the adsorption of eosin on the biosorbent, in order to achieve the equilibrium, was found to be 60 min. Fig. 9 indicated that rate of adsorption is increased with contact time till 60 min and there after it line became straight line, showing the attainment of equilibrium.
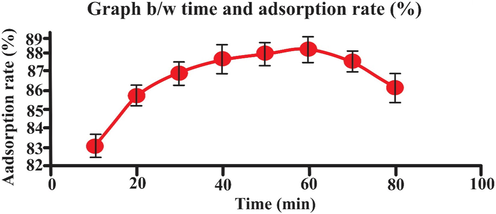
- Effect of time (min) on adsorption rate (25 mL eosin having initial concentration 25 mg L-1,adsorbent dosage = 0.5, particles size = 20 nm, pH = 2, temperature = 30 0C, contact time = 60 min, stirring rate = 150 rpm). Error bars indicate standard deviation of thrice replicates.
Bai, M. Tukaram, et al., Fella, et al. and Raju, et al. were reported optimum contact time of 60 min or the elimination of eosin dye using biomass (Allouche, Yassaa, & Lounici, 2015; Bai, Anudeep, Raju, Rao, & Chittibabu, 2021).
3.5 Effect of initial dye concentration
The initial concentration effects on adsorption capacity. It was studied in the range of 5 to 25 mg L-1 concentration at pH 2. The obtained result illustrated in Fig. 10, indicated that adsorption and dye concentration has direct relation. The fluctuation may be caused as desorption occurring alongside of adsorption (Abechi, Gimba, Uziaru, & Ndukwe, 2006). biosorbent showed minimum adsorption at 5 mg L-1 and maximum adsorption at mg L-1.
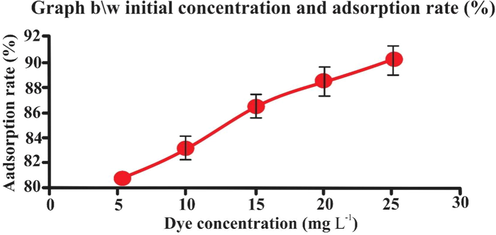
- Effect of initial dye concentration (mgL-1) on adsorption rate (25 mL eosin having initial concentration 25 mg L-1,adsorbent dosage = 0.5, particles size = 20 nm, pH = 2, temperature = 30 0C, contact time = 60 min, stirring rate = 150 rpm). Error bars indicate standard deviation of thrice replicates.
3.6 Effect of pH
Batch method was carried out by changing the pH of solution 2–10 and all other parameters kept constant. Fig. 11 exhibited the eosin (dye) elimination (removal) percentage versus pH. The pH of dye has important impact on adsorption capacity (Annadurai, Juang, & Lee, 2002). The obtained results are shown in Table 2 and Fig. 11. As the dye is anionic so the adsorption capacity is maximum at pH = 2. Acidic environment could be more favorable for the bio-adsorption between bio-adsorbent (lemon peel) and dye, due to considerable strong electrostatic force of attraction present between the negatively charged eosin dye and positively charged surface of lemon peel. The low adsorption capability under alkaline environment could be primarily related to the growing number of negative charges on the biosorbent surface, which could consequences in electrostatic repulsion between the bio-adsorbent and eosin dye (anionic) molecules (Aksu & Dönmez, 2003).
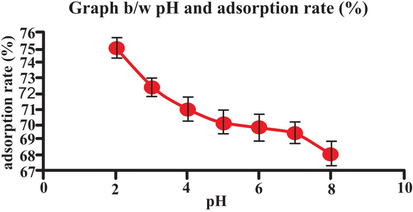
- Effect of pH on adsorption rate (25 mL eosin having initial concentration 25 mg L-1,adsorbent dosage = 0.5, particles size = 20 nm, pH = 2, temperature = 30 0C, contact time = 60 min, stirring rate = 150 rpm). Error bars indicate standard deviation of thrice replicates.
| pH | 2 | 3 | 4 | 5 | 6 | 7 | 8 |
|---|---|---|---|---|---|---|---|
| % ads. | 75.00 | 72.32 | 70.96 | 70.00 | 69.76 | 69.44 | 68.00 |
| Speed (rpm) | 50 | 100 | 150 | 200 | 250 | ||
| % ads. | 82.56 | 83.68 | 84.76 | 79.96 | 73.92 | ||
| Temp. (oC) | 20 | 30 | 40 | 50 | 60 | ||
| % ads. | 83.24 | 88.72 | 87.56 | 86.84 | 85.96 |
3.7 Effect of stirring rate
The effect of stirring upon adsorption was studied at different rates ranging from 50 to 250 rpm. The results obtained are illustrated in Table 2 and in Fig. 12 which shows the sorption kinetics of biosorbent. The dye was best absorbed at 150 rpm, which is low agitation speed. After that adsorption yield decreases and no further increase in adsorption noted. This decrease in adsorption efficiency is due to low agitation speed in which biosorbent accumulates at bottom instead of spreading in the solution. The adsorption of dye by lemon peel is faster at 150 rpm than at lower ones.
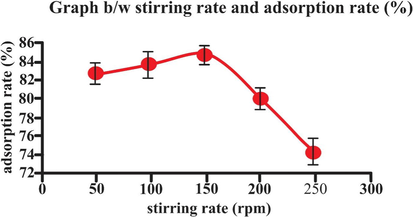
- Effect of stirring rate on adsorption rate (25 mL eosin having initial concentration 25 mg L-1,adsorbent dosage = 0.5, particles size = 20 nm, pH = 2, temperature = 30 0C, contact time = 60 min, stirring rate = 150 rpm). Error bars indicate standard deviation of thrice replicates.
3.8 Effect of temperature:
Temperature is also important the phenomena of adsorption. The effect of the adsorption was studied at different temperature ranging from 20 to 60 0C.
The obtained results illustrated in Table 2 and in Fig. 13. Maximum adsorption was observed at 30 0C and decreases at elevated temperature. It was noted that initially rate of biosorption was increase from 20 to 30 °C. Maximum adsorption was observed at 30 0C and decreases at elevated temperature. However, at temperature more than 30 0C, a decrease in rate of biosorption from 94% to 86% was observed with raise in temperature 40–70 °C. This decrease confirmed physio-sorption process (Rehman et al., 2018). With increasing in temperature, the movement of eosin dye became rapid. Consequently, eosin dye escaped from solid phase to liquid phase. Thus, rate of adsorption increased with increase in temperature (Rukayat, Usman, Elizabeth, Abosede, & Faith, 2021).
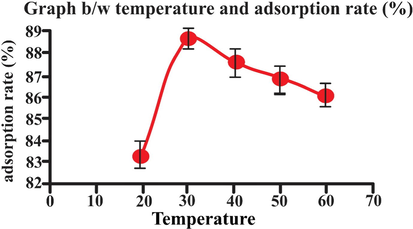
- Effect of temperature adsorption rate (25 mL eosin having initial concentration 25 mg L-1,adsorbent dosage = 0.5, particles size = 20 nm, pH = 2, temperature = 30 0C, contact time = 60 min, stirring rate = 150 rpm). Error bars indicate standard deviation of thrice replicates.
3.9 Adsorption isotherm
Adsorption isotherms generally explain the nature of behavior or interaction between adsorbate and biosorbent by creating the relationship between the amount of dye adsorbed and the dye remaining in solution at equilibrium. In this work, two models were used to analyze the equilibrium data of eosin dye loaded on the lemon peel (Langmuir and Freundlich, isotherms). The different isotherm parameters were deduced from the intercept and slope of the linear curve shown in Figs. 14 and 15. By investigating these results, it was found that the Langmuir isotherm model showed the best fit for eosin system pursued by Freundlich isotherm model (qe = 8.240: R = 0.993 and Kf = 1.940: R2 = 0.9647 respectively). The both Langmuir and Freundlich isotherms model suggested that lemon peel may exhibit monolayer coverage. Adsorption isotherm is used to eliminate the organic pollutant (Iram, Shabbir, Zafar, & Javaid, 2015). The adsorption isotherms explain adsorption mechanisms, surface properties and adsorption affinity for adsorbate (Abdelwahab, 2008). The monolayer adsorption capacity observed from Langmuir was 8.240 mg/g and from Freundlich was 1.947 (mg/g). The results of Langmuir and Freundlich isotherms illustrated in Table 3 and in Figs. 14 and 15.
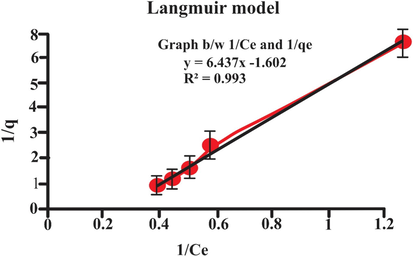
- Langmuir adsorption isotherm.
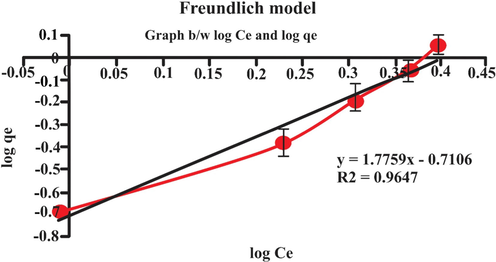
- Freundlich adsorption isotherm.
| Isotherm models | parameters | values |
|---|---|---|
| Langmuir | q max (mgg−1) | 8.240 |
| KL (L/mg) | 0.2489 | |
| R2 | 0.9935 | |
| Freundlich | KF (mgg−1) | 1.947 |
| n | 0.5630 | |
| R2 | 0.9647 |
3.10 Thermodynamic parameter
Thermodynamics studies are effective for the determination of the adsorption process's nature and feasibility. Therefore, thermodynamic parameters are determined by examining the effect of temperature on the adsorption process under suitable conditions. The values of ΔHo and ΔS° were calculated from the slope and the intercept of the linear plot (i.e. lnk Vs 1/T). Various thermodynamic parameters were studied at different temperature and results are mentioned in Table 4 and also graphically represent in Fig. 16. The physical adsorption value of ΔHo should be range from −4 to −40 kg/mol. The negative value of ΔH° emphasized the exothermic behavior of the physical adsorption process. Thus, enthalpy value attained in this work indicates that biosorption occurred due to physisorption (physical adsorption) (Yu, Zhang, Shukla, Shukla, & Dorris, 2001).
| TemperatureoC | Gibbs free energy ΔGo (Kjmol-1) | Enthalpy changeΔHo(Kjmol-1) | Entropy changeΔSo(Kjmol-1) |
|---|---|---|---|
| 30 | −2.36 | −6.98 | −30.84 |
| 40 | −2.67 | −6.98 | −30.84 |
| 50 | −2.98 | −6.98 | −30.84 |
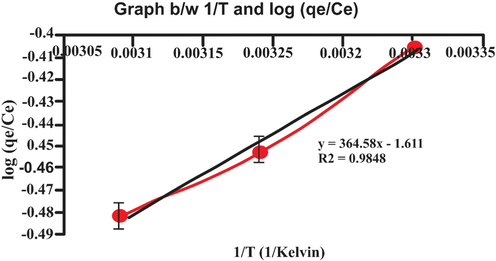
- Graph b/w 1/T and log (qe/Ce).
The negative value of ΔS° indicated the depreciation of disorder at the solid/liquid interface during the phenomena of the bio-absorption resulting in lowering the adsorption capacity because of eosin (dye) molecule escaping from the lemon peel (adsorbents)(Ghosh et al., 2021). Adsorption process was exothermic and the negative values of entropy show the decreased randomness of adsorbate molecules during adsorption. The negative value of Gibb’s free energy proves that adsorption process was spontaneous.
3.11 Kinetic studies
A kinetic study of the adsorption process was carried out. Process obeyed pseudo-second order kinetics as its R2 value is 1.00, as compared to pseudo-first order kinetics whose R2 value is 0.9977 as shown in Table 5 and in Figs. 17 and 18. The evaluation of adsorption kinetics is of great importance for the investigation of rate of adsorption and equilibrium time (Lou, 2017) (Different parameters of each model were deduced form intercept and the slope of suitable linear curved Shown in Figs. 17 and 18. Moreover in this study theoretical qe values agreed well with the experimental qe values.Fig. 19..
| Kinetics models | Parameters | Values |
|---|---|---|
| pseudo-first order | K1 (min)-1 | 0.675 |
| qe (exp) mg/g | 1.1035 | |
| qe (cal) mg/g | 0.1246 | |
| R2 | 0.9977 | |
| pseudo-second- order | K2 (g/mg min−1) | 1.13 |
| qe (exp) mg/g | 1.1035 | |
| qe (cal) mg/g | 1.1165 | |
| R2 | 1.00 |
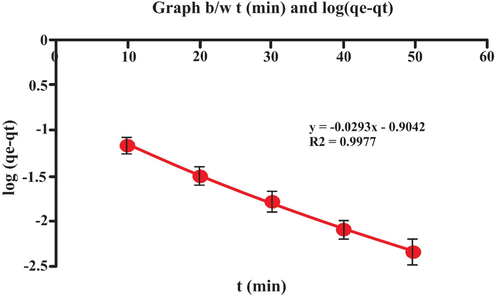
- Graph b/w t (min) and log (qe-qt).
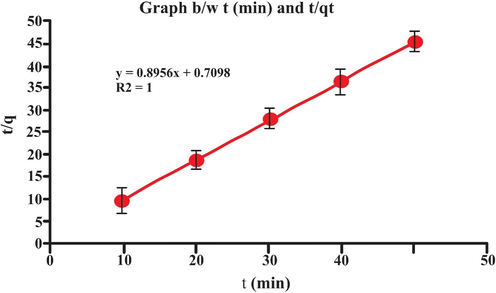
- Graph b/w t (min) and t/q).
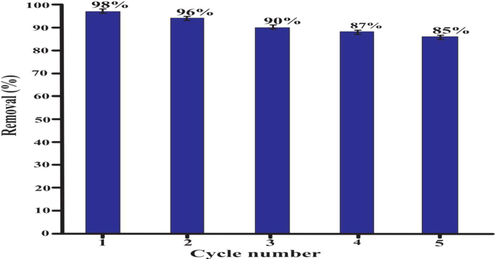
- Adsorption-desorption of eosin dye and reusability of biosorbent.
4 Impact of adsorption–desorption cycles on the dye elimination capacity of lemon peel
The adsorption–desorption analysis for determination of regeneration and reusability capacity of lemon peel was carried out utilizing 0.1 M sodium hydroxide (NaOH) and 0.1 M hydrochloric acid HCL to monitor dye adsorption (for five successive cycles) onto the lemon peel. The lemon peel was used to adsorb for five cycles and elimination capacity was measured relating first cycle. The obtained results are indicated in the figure. The absorption capability for lemon peel was found to be slightly decreased during repeated cycle. After five cycles, the lemon peel's adsorption capability is still at 85% percent for eosin dye in contrast to the first cycle, illustrating lemon peel's reusability and reliable recyclability potential for consecutive operations. The structural stability of the material observed in this case was not significantly altered during the subsequent absorption desorption cycles. The eosin (dye) adsorption capacity of greater than 85% even after fifth cycle certified this postulate. However, a faint degree deformation came as a result of force used to extract the absorbed dye in order to repeat the cycle.
5 Comparison with some other biosorbents
The sorption capacity of biosorbent was compared with various other biosorbent that are already reported in literature and showed in Table 5. A comparison of sorption capability of different biosorbents indicates that lemon peel can be considered as potential sorbent for the elimination of dyes.
6 Cost estimation
Lemon peel is a waste product collected from the juice industry, therefore easily available at null cost. However, the handling cost of transportation (for collection of lemon peel), energy and water for its further processing would be 0.012 USD per Kg. Lowest type of powdered activated carbon charges about 5 USD/Kg for eosin dye elimination (Bello, Olusegun, & Njoku, 2013). Compared to the previously reported powdered activated carbon, the net cost of lemon peel is about hundred times cheaper. Therefore, the utilization of lemon peel as bisorbent is thoughtful economic effort for its significantly valuable use in eosin dye elimination from aqueous media.
| Biosorbents | Maximum biosorption Capacity | Reference |
|---|---|---|
| simulated mediaonto lemon peel | 8.240 | This study |
| Rubber wood sawdust | 5.729 | (Gündoğan, Acemioğlu, & Alma, 2004) |
| Posidonia oceanica (L.)fibres | 5.56 | (Ncibi, Mahjoub, & Seffen, 2007) |
| Caulerpa racemosavar.cylindracea | 5.23 | (Cengiz & Cavas, 2008) |
| Bagasse fly ash | 2.26 | (Gupta & Ali, 2000) |
| Maple sawdust | 1.79 | (Yu et al., 2001) |
| Living biomass | 1.17 | (Fu & Viraraghavan, 2000) |
7 Conclusion
The minor changes in FTIR peaks before or after adsorption indicates the involvement of few functional groups in the sorption of eosin on biosorbent surface through Van der Waals forces. SEM images of biosorbent interpret that large number of micro and macro pores are remained open for access to the interior of cavities. BET analysis shows that the diameter of an eosin dye molecule is 1.084 nm (10.84 A°). This result shows that eosin dye molecule can easily diffuse into the inner available pore of biosorbent. Eosin dye adsorption onto the biosorbent was investigated relating, isotherm, equilibrium and kinetics. Batch processes were utilized to known the effect of various parameters for the removal of Eosin. The conclusion drawn from the present study is that all parameters affected the rate of adsorption. Maximum capacity was achieved, using 5 mg L-1 of eosin dye, 0.5 g of biosorbent at 60 min, pH 2 and 30 °C. The equilibrium data is efficiently fitted in Langmuir and Freundlich isotherm equation showing monolayer adsorption on the surface of biosorbent. The thermodynamic study showed that the adsorption was exothermic, spontaneous and feasible at any temperature. The negative sign of ΔSo showed the decreased randomness of adsorbate molecules during adsorption. It is concluded from above study that the biosorbent is efficient low cost biosorbent for the removal of eosin dye.
Acknowledgement
The authors thank the chemistry Department of Minhaj University Lahore.
Funding
The authors extend their appreciation to the Deanship of Scientific Research at King Khalid University for funding the work through Research Project (R.G.P.2/156/42)
Declaration of Competing Interest
The authors declare that they have no known competing financial interests or personal relationships that could have appeared to influence the work reported in this paper.
References
- Evaluation of the use of loofa activated carbons as potential adsorbents for aqueous solutions containing dye. Desalination. 2008;222(1):357-367.
- [CrossRef] [Google Scholar]
- Possibility of utilizing the lemon peels in removing of red reactive (RR) dye from simulated aqueous solution. J. Green Eng.. 2020;10:7343-7359.
- [Google Scholar]
- Comparative studies on adsorption of methylene blue (MB) by sawdust and walnut shells carbon coated with ZnO. Sci. World J.. 2006;1(1)
- [Google Scholar]
- Investigation of methylene blue dye adsorption from polluted water using oleander plant (Al defla) tissues as sorbent. Am. J. Environ. Sci. 2016;12:213-224.
- [Google Scholar]
- Bioadsorbent beads prepared from activated biomass/alginate for enhanced removal of cationic dye from water medium: Kinetics, equilibrium and thermodynamic studies. J. Mol. Liq.. 2018;256:533-540.
- [Google Scholar]
- A comparative study on the biosorption characteristics of some yeasts for Remazol Blue reactive dye. Chemosphere. 2003;50(8):1075-1083.
- [Google Scholar]
- Equilibrium, isotherm studies of dye adsorption onto orange peel powder. Chem. Res. J. 2018;3(1):45-59.
- [Google Scholar]
- Sorption of methyl orange from aqueous solution on chitosan biomass. Procedia Earth Planet. Sci.. 2015;15:596-601.
- [Google Scholar]
- Use of cellulose-based wastes for adsorption of dyes from aqueous solutions. J. Hazard. Mater.. 2002;92(3):263-274.
- [Google Scholar]
- Magnetically separable ZnO-MnFe2O4 nanocomposites synthesized in organic-free media for dye degradation under natural sunlight. Orient. J. Chem.. 2017;33(6):2758.
- [Google Scholar]
- A new sensitive approach for spectrofluorimetric assay of Milnacipran and Amisulpride in real plasma and pharmaceutical preparations via complexation with Eosin Y dye. Spectrochim. Acta Part A Mol. Biomol. Spectrosc.. 2019;214:399-406.
- [Google Scholar]
- Novel hemicellulose–chitosan biosorbent for water desalination and heavy metal removal. ACS Sustain. Chem. Eng.. 2013;1(9):1102-1109.
- [Google Scholar]
- Decolourization of Eosin yellow (EY) dye using a variety of brown algae. Mater. Today Proc.. 2021;42:1130-1137.
- [Google Scholar]
- Poly (acrylamide-co-itaconic acid) as a potential ion-exchange sorbent for effective removal of antibiotic drug-ciprofloxacin from aqueous solution. J. Macromol. Sci. Part A. 2010;48(2):108-118.
- [Google Scholar]
- Adsorptive removal of a synthetic textile dye using cocoa pod husks. Toxicol. Environ. Chem.. 2011;93(7):1298-1308.
- [Google Scholar]
- Fly ash: an alternative to powdered activated carbon for the removal of eosin dye from aqueous solutions. Bull. Chem. Soc. Ethiop.. 2013;27(2):191-204.
- [Google Scholar]
- Batch biosorption of lead (II) from aqueous solutions by olive tree pruning waste: Equilibrium, kinetics and thermodynamic study. Chem. Eng. J.. 2011;168(1):170-177.
- [Google Scholar]
- Removal of methylene blue by invasive marine seaweed: Caulerpa racemosa var. cylindracea. Bioresour. Technol.. 2008;99(7):2357-2363.
- [Google Scholar]
- Studies on adsorption of p-nitrophenol on charred saw-dust. Sep. Purif. Technol.. 2001;21(3):227-235.
- [Google Scholar]
- El-Katori, E., Fouda, A., & Al-Sarawy, A. (2011). Removal of some thiazole dyestuffs from aqueous media by adsorption onto different types of carbon.
- Valorisation of Cocoa (Theobroma cacao) pod husk as precursors for the production of adsorbents for water treatment. Environm. Technol. Rev.. 2020;9(1):20-36.
- [Google Scholar]
- Removal of a dye from an aqueous solution by the fungus Aspergillus niger. Water Quality Res. J.. 2000;35(1):95-112.
- [Google Scholar]
- Dye removal from aqueous solution by adsorption on treated sawdust. Bioresour. Technol.. 2003;89(2):121-124.
- [Google Scholar]
- Removal of methylene blue from aqueous solution using Lathyrus sativus husk: adsorption study, MPR and ANN modelling. Process Saf. Environ. Prot.. 2021;149:345-361.
- [Google Scholar]
- Copper (II) adsorption from aqueous solution by herbaceous peat. J. Colloid Interface Sci.. 2004;269(2):303-309.
- [Google Scholar]
- Utilisation of bagasse fly ash (a sugar industry waste) for the removal of copper and zinc from wastewater. Sep. Purif. Technol.. 2000;18(2):131-140.
- [Google Scholar]
- First nationwide investigation and environmental risk assessment of 72 pharmaceuticals and personal care products from Sri Lankan surface waterways. Sci. Total Environ.. 2019;690:683-695.
- [Google Scholar]
- Removal of ions Pb2+ and Cd2+ from aqueous solution by containment geomaterials Exergetic, Energetic and Environmental Dimensions. Elsevier; 2018. p. :1029-1043.
- Biosorption of methylene blue from aqueous solution by fallen phoenix tree's leaves. J. Hazard. Mater.. 2007;141(1):156-162.
- [Google Scholar]
- Adsorption characteristics of methylene blue onto low cost biomass material lotus leaf. Chem. Eng. J.. 2011;171(1):1-8.
- [Google Scholar]
- A reactive copolymer based on Glycidylmethacrylate and Maleic Anhydride: 1-synthesis, characterization and monomer reactivity ratios. J. Polym. Res.. 2016;23(8):1-19.
- [Google Scholar]
- Adsorption of pollutants by plant bark derived adsorbents: an empirical review. J. Water Process Eng.. 2020;35:101228
- [Google Scholar]
- Statistical modelling and optimisation of the biosorption of Cd (II) and Pb (II) onto dead biomass of Pseudomonas aeruginosa. Chem. Prod. Process Model.. 2021;16(1)
- [Google Scholar]
- Efficiency comparison of advanced oxidation processes for ciprofloxacin removal from aqueous solutions: Sonochemical, sono-nano-chemical and sono-nano-chemical/persulfate processes. Environ. Eng. Res.. 2020;25(2):178-185.
- [Google Scholar]
- Overview on the effect of particle size on the performance of wood based adsorbent. J. Chem. Eng. Process Technol.. 2016;7(1):2.
- [Google Scholar]
- Biosorption and bioaccumulation of copper and lead by heavy metal-resistant fungal isolates. Arab. J. Sci. Eng.. 2015;40(7):1867-1873.
- [Google Scholar]
- Utilization of industrial waste products as adsorbents for the removal of dyes. J. Hazard. Mater.. 2003;101(1):31-42.
- [Google Scholar]
- Improved quantum yield for photocatalytic hydrogen generation under visible light irradiation over eosin sensitized TiO2—Investigation of different noble metal loading. J. Mol. Catal. A: Chem.. 2006;259(1–2):275-280.
- [Google Scholar]
- Renewable starch carriers with switchable adsorption properties. ACS Sustain. Chem. Eng.. 2018;6(4):4603-4613.
- [Google Scholar]
- Biodegradation, biodistribution and toxicity of chitosan. Adv. Drug Deliv. Rev.. 2010;62(1):3-11.
- [Google Scholar]
- Methylene blue removal using Salix babylonica (Weeping willow) leaves powder as a low-cost biosorbent in batch mode: kinetic, equilibrium, and thermodynamic studies. J. Mol. Liq.. 2017;244:540-548.
- [Google Scholar]
- Removal of a basic dye from aqueous solution by adsorption using Parthenium hysterophorus: an agricultural waste. Dyes Pigm.. 2007;74(3):653-658.
- [Google Scholar]
- Adsorptive removal of basic dye by chemically activated Parthenium biomass: equilibrium and kinetic modeling. Desalination. 2008;219(1–3):250-261.
- [Google Scholar]
- Adsorption of hazardous dyes indigo carmine and acid red on nanofiber membranes. RSC Adv.. 2012;2(3):900-907.
- [Google Scholar]
- Novel composite adsorbent consisting of dissolved cellulose fiber/microfibrillated cellulose for dye removal from aqueous solution. ACS Sustain. Chem. Eng.. 2018;6(5):6994-7002.
- [Google Scholar]
- Adsorption of toxic dye Eosin Y from aqueous solution by clay/carbon composite derived from spent bleaching earth. Water Environ. Res.. 2021;93(1):159-169.
- [Google Scholar]
- Applied adsorption kinetics model for removal of hazards from aqueous solution: more informational parameters for industrial design. J. Environm. Sci. Public Health. 2017;1(4):228-239.
- [Google Scholar]
- Use of activated carbons prepared from sawdust and rice-husk for adsorption of acid dyes: a case study of Acid Yellow 36. Dyes Pigm.. 2003;56(3):239-249.
- [Google Scholar]
- Development of antifouling nanofiltration membrane with zwitterionic functionalized monomer for efficient dye/salt selective separation. J. Membr. Sci.. 2020;601:117795
- [Google Scholar]
- Kinetic and equilibrium studies of methylene blue biosorption by Posidonia oceanica (L.) fibres. J. Hazard. Mater.. 2007;139(2):280-285.
- [Google Scholar]
- Methylene blue biosorption from aqueous solutions by yellow passion fruit waste. J. Hazard. Mater.. 2008;150(3):703-712.
- [Google Scholar]
- Hydroxypropyl sulfonated lignin as dye dispersant: Effect of average molecular weight. ACS Sustain. Chem. Eng.. 2015;3(12):3239-3244.
- [Google Scholar]
- Efficiency of sono-nano-catalytic process of magnesium oxide nano particle in removal of penicillin G from aqueous solution. Desalin. Water Treat.. 2018;106:330-335.
- [Google Scholar]
- Ray, S. S., Gusain, R., & Kumar, N. (2020). Carbon nanomaterial-based adsorbents for water purification: Fundamentals and applications: Elsevier.
- Role of sorption energy and chemisorption in batch methylene blue and Cu2+ adsorption by novel thuja cone carbon in binary component system: linear and nonlinear modeling. Environ. Sci. Pollut. Res.. 2018;25(31):31579-31592.
- [Google Scholar]
- Kinetic Adsorption of Heavy Metal (Copper) On Rubber (Hevea Brasiliensis) Leaf Powder. S. Afr. J. Chem. Eng.. 2021;37:74-80.
- [Google Scholar]
- Choline-based ionic liquids-enhanced biodegradation of azo dyes. Environ. Sci. Technol.. 2012;46(9):4902-4908.
- [Google Scholar]
- Adsorptive removal of methyl orange dye from aqueous solution using populous leaves: Insights from kinetics, thermodynamics and computational studies. Environm. Chem. Ecotoxicol.. 2021;3:172-181.
- [Google Scholar]
- Removal of methylene blue dye from artificially contaminated water using citrus limetta peel waste as a very low cost adsorbent. J. Taiwan Inst. Chem. Eng.. 2016;66:154-163.
- [Google Scholar]
- Potential degradation of methylene blue (MB) by nano-metallic particles: A kinetic study and possible mechanism of MB degradation. Environ. Eng. Res.. 2018;23(1):1-9.
- [Google Scholar]
- Utilization of Natural Zeolite Clipnotilolit-Ca as a Support of ZnO Catalyst for Congo-Red Degradation and Congo-Red Waste Applications with Photolysis. Orient. J. Chem.. 2018;34(2):887.
- [Google Scholar]
- Removal of textile dyes and metallic ions using polyelectrolytes and macroelectrolytes containing sulfonic acid groups. J. Environ. Manage.. 2016;177:65-73.
- [Google Scholar]
- Kinetics and thermodynamics of adsorption of methylene blue by a magnetic graphene-carbon nanotube composite. Appl. Surf. Sci.. 2014;290:116-124.
- [Google Scholar]
- The removal of heavy metals from aqueous solutions by sawdust adsorption—removal of lead and comparison of its adsorption with copper. J. Hazard. Mater.. 2001;84(1):83-94.
- [Google Scholar]
- Efficient removal of Pb (II) and Cd (II) from water by cross-linked poly (N-vinylpyrrolidone-co-maleic anhydride)@ eggshell/Fe3O4 environmentally friendly nano composite. Desalin. Water Treat.. 2018;106:209-219.
- [Google Scholar]
- Zein, R., Astuti, A. W., Wahyuni, D., Furciani, F., Khoiriah, & Munaf, E. (2015). Removal of Methyl Red from Aqueous Solution by Neplhelium lappaceum. Res. J. Pharm. Biol. Chem. Sci. 6(3), 86–97.


