

Translate this page into:
RGB pattern of images allows rapid and efficient prediction of antioxidant potential in Calycophyllum spruceanum barks
⁎Corresponding author. carpes@utfpr.edu.br (Solange T. Carpes)
-
Received: ,
Accepted: ,
This article was originally published by Elsevier and was migrated to Scientific Scholar after the change of Publisher.
Peer review under responsibility of King Saud University.
Abstract
The use of fast and low-cost methods to optimize the total phenolic compounds (TPC) extraction has been gaining attention in ethnopharmacological research. Extraction conditions of the bioactive compounds from Calycophyllum spruceanum barks were established through multivariate regression models. In this sense, fractional factorial design (FFD) and central rotational composite design (CCRD) were developed using partial least squares regression (PLSR) combined with the information from the color images and spectrophotometry tools to evaluate the antioxidant activity from C. spruceanum barks. In fact, was possible to optimize the extraction of TPC with AA (ethanol 10% v/v, 1 h extraction time at 75 °C temperature). Besides, the precision and performance of generated models were established for the three response variables (TPC, AA by ABTS and FRAP methods) with R2 above 0.98 in the PLSR and residual predictive value (RPD) above 3. Thus, the approaches suggested in this study, with emphasis on the use of image analysis, proved to be potential and promising as simple, fast, non-destructive methods for quantifying TPC and antioxidant activity in C. spruceanum barks.
Keywords
Calycophyllum spruceanum
Antioxidant potential
Optimization
Chemometric
Computer vision
Image analysis
RGB (Red - Green - Blue) channels

1 Introduction
Plants for various purposes have been widely used by traditional communities in both developed and developing countries (Silva et al., 2014). From the knowledge of the popular use of plants, the beneficial effects of the antioxidant properties of their constituents on health have been studied (Sekhon-Loodu and Rupasinghe, 2019). In fact, the crude extracts of plants from different families and the compounds isolated from these extracts, from the most varied classes, have been attracting the attention of researchers from the scientific and industrial environment. As in pharmacological products (Heidari-Soreshjani et al., 2017), perfumery (Nour, 2018), food (Pandey et al., 2017) and fine chemistry (Mohammadinejad et al., 2015).
Medicinal plants as a source of compounds with antioxidant (Anjos et al., 2018), antimicrobial (Sekhon-Loodu and Rupasinghe, 2019), anti-inflammatory and anticancer (Orlikova et al., 2013) and anti-diabetic (Sari et al., 2020) potential; have been listed as considerable drug candidates, as they have properties similar to drugs (Dutra et al., 2016). This fact arouses the interest of researchers, for the pharmacological and chemical studies of these plants, especially the plants native from Brazilian biomes, whose analysis may lead to the discovery of new compounds with pharmacological action. Among the most investigated botanical families, today are those of the Fabaceae, Asteraceae, Lamiaceae and Euphorbiaceae taxons (Dutra et al., 2016).
Calycophyllum spruceanum commonly known as Mulateiro or pau-mulato belongs to the family Rubiaceae. This species is typically found in the Amazon Forest, which has a high commercial value, being used mainly in the timber area, but also as a medicinal use (Figueiredo Filho et al., 2014). Traditional uses of this plant used by Indigenous led to popular knowledge it believes that the stem bark can combat several types of diseases or even for health maintenance (Duke et al., 2009). It is traditionally used in the anti-ageing process (Peixoto et al., 2018), as an antimicrobial agent against fungal infections and on wound healing (Pandey et al., 2017). In Paraguay, the barks are widely used for treating diabetes, while in Colombia, this plant is used against parasites and for the treatment of other diseases (Peixoto et al., 2018). Besides, the use of the bark has exhibited a promising prospect in the industrial once that the plant has the capacity to regenerate annually. Thus, it can be seen as one promising market of biomolecules in the chemical or pharmaceutical industry.
Although studies on the antioxidant potential of this species are quite scarce in the literature (Anjos et al., 2018; de Vargas et al., 2016; Figueiredo Filho et al., 2016), the agronomic characteristics of this plant have been studied (Figueiredo Filho et al., 2014; Peixoto et al., 2018). However, further studies on the optimization of the extraction conditions of phenolic compounds and their antioxidant potential, as well as the use of images as tools that relate this potential to the species C. spruceanum have not yet been reported in specialized literature.
Thus, as a strategy for predicting the concentration of phenolic compounds and antioxidant potential, multivariate calibration is one of the most important tools used in chemometric studies (Song et al., 2020). In summary, a mathematical model is developed, which correlates variable responses obtained in reference analyzes with spectroscopic analyzes. From the mathematical model developed, it is possible to predict the values of new samples (Santos et al., 2019). There are several mathematical tools used for this purpose, including the regression of partial least squares (PLSR), significance multivariate correlation (sMC), main component analysis (PCA) and PLS-discriminant analysis (PLS-DA) (Santos et al., 2019).
PLSR is a robust chemometric method for data treatment of complex matrices and is commonly used in the chemical and food area (Silva et al., 2014) for its simplicity, generating reliable results and quick response. Additionally, multivariate calibration in PLSR regression models can be performed using all or only intervals of spectral bands, to then build predictive regression models, by correlating with the property of interest (Kawamura et al., 2017). In fact, the PLSR has been used to predict total phenolic contents and antioxidant properties from FTIR spectral data in red wine (Versari et al., 2010), dessert wines (Silva et al., 2014), onion (Lu et al., 2011), honey (Tahir et al., 2017) and fruit extracts (Lam et al., 2006).
In this study, in order not only to quantify the phenolic contents in C. spruceanum extract bark and their antioxidant potential using conventional methods also proposed to generate predictive models of its antioxidant properties through image analysis and chemometric tools. Thus, the aim of this proposes modelling to predict the levels of these variables using partial least squares regression (PLSR). The study was based on the hypothesis that the species Calycophyllum spruceanum has a high antioxidant potential, not yet explored in scientific research.
2 Material and methods
2.1 Chemicals
Gallic acid, 2,-2′-azino-di-(3-ethylbenzthiazoline sulfonic acid) (ABTS), 2,4,6-tris(2-pyridyl)-s-triazine (TPTZ), Folin–Ciocalteu phenol reagents, Trolox were obtained from Sigma-Aldrich Chemical Co. (St. Louis, MO, USA). Ethanol (Êxodo Científica) (Sumaré, SP, Brazil). All reagents used were of analytical grade.
2.2 Plant material and sample preparation
Bark samples of Calycophyllum spruceanum (Mulateiro) were provided by Fonte Clara Indústria e Comércio de Produtos Naturais LTDA, obtained in the rural area of Alto Paraíso (RO), Brazil, in July 2019. The samples were kiln-dried at 37 ± 3 °C for 24 h, ground (30 mesh) in a knife mill (Tecnal R-TE-650/1 model, Piracicaba, SP, Brazil). The samples were placed in plastic packaging and stored in a freezer at −12 °C. In the function of the study aiming at the optimization of the extraction conditions and development of the predictive modelling of the response variables (total phenolic compounds (TPC) and antioxidant activity by two methods). The study was divided into three phases: first the elaboration of a fractional factorial design (FFD); second planning, central composite rotational design (CCRD), and finally, the third stage corresponding to PLSR modelling using images and spectroscopy.
The extracts of the Calycophyllum spruceanum bark in both plans (FFD and CCRD) were obtained from two grams and 30 mL of solvent in a water bath, under time and temperature described in the respective plans (Table 1 and Table 2). The plant extracts were vortexed at 15 min intervals and subsequently centrifuged at 12000 rpm (Hermle Z 200 A, Wehingen, Germany) for 15 min at 20 °C. The supernatant was collected and stored in a freezer at −12° C until analysis. Values followed by different letters in the same column are significantly different (P < 0.05). GAE: Gallic acid equivalent, TEAC: antioxidant capacity equivalent to Trolox. The results are expressed as mean ± standard error (n = 3). Values followed by different letters in the same column are significantly different (P < 0.05). GAE: Gallic acid equivalent, TEAC: antioxidant capacity equivalent to Trolox. The results are expressed as mean ± standard error (n = 3).
Run
Ethanol (%)
Temperature (°C)
Time (min)
TPC (mg GAE g−1)
ABTS (mM TEAC g−1)
FRAP (mM Fe+2 g−1)
1
20 (−1)
40 (−1)
30 (−1)
731.97 ± 3.94 c
7.75 ± 0.03 e
11.01 ± 0.21 d
2
20 (−1)
60 (0)
90 (1)
921.65 ± 2.62 b
16.05 ± 0.16 b
21.05 ± 0.51 b
3
20 (−1)
80 (1)
60 (0)
956.36 ± 1.98 a
21.93 ± 0.66 a
25.04 ± 0.98 a
4
60 (0)
40 (−1)
90 (1)
242.22 ± 0.66 e
2.86 ± 0.03 f
6.18 ± 0.12 e
5
60 (0)
60 (0)
60 (0)
322.18 ± 3.93 d
8.80 ± 0.12 d
11.60 ± 0.39 d
6
60 (0)
80 (1)
30 (−1)
325.36 ± 2.53 d
13.32 ± 0.11 c
12.99 ± 0.11 c
7
100 (1)
40 (−1)
60 (0)
60.74 ± 1.50 g
0.58 ± 0.01 g
3.41 ± 0.06 f
8
100 (1)
60 (0)
30 (−1)
54.25 ± 0.16 h
0.49 ± 0.01 gh
0.35 ± 0.03 g
9
100 (1)
80 (1)
90 (1)
91.82 ± 0.40 f
0.29 ± 0.001 h
3.36 ± 0.01 f
Run
Ethanol (%)
Temperature (°C)
TPC (mg GAE g−1)
ABTS (µM TEAC g−1)
FRAP (µM Fe+2 g−1)
1
10 (−1)
55 (−1)
839.42 ± 3.75 b
20.19 ± 0.12 cd
18.73 ± 0.06 d
2
50 (1)
55 (−1)
429.22 ± 1.36 f
12.19 ± 0.14 g
9.61 ± 0.08 f
3
10 (−1)
75 (1)
998.07 ± 17.84 a
23.00 ± 0.67 a
25.55 ± 0.04 a
4
50 (1)
75 (1)
503.17 ± 3.71 d
14.93 ± 0.25 f
14.19 ± 0.08 e
5
0 (−1.41)
65 (0)
989.20 ± 1.80 a
21.55 ± 0.52 b
22.16 ± 0.07 c
6
60 (1.41)
65 (0)
414.06 ± 4.21 f
11.56 ± 0.02 h
9.81 ± 0.18 f
7
30 (0)
50 (−1.41)
472.42 ± 9.23 e
13.77 ± 0.49 f
9.71 ± 0.01 f
8
30 (0)
80 (1.41)
697.48 ± 4.07 c
21.23 ± 0.30 bc
22.92 ± 0.01 b
9
30 (0)
65 (0)
675.24 ± 3.05 c
18.71 ± 0.01 e
18.79 ± 0.03 d
10
30 (0)
65 (0)
683.62 ± 3.43 c
18.91 ± 0.03 de
18.68 ± 0.03 d
2.3 Fractional factorial design (FFD)
A fractional factorial design 33-1 was used, aiming at screening factors and their influence on the extraction process of phenolic compounds and assessing antioxidant activity for the C. spruceanum barks. Based on the FFD, each independent variable (or factor) was assessed at three levels: −1 for the lowest level, +1 for the highest level and 0 for the central level. The factors considered were: ethanol concentration, temperature and extraction time, totalling 9 experimental runs. All runs were carried out in triplicate. Table 1 presents the matrix with the respective factors and their levels used in the design and the experimental results for the three response variables evaluated, such as total phenolic compounds (TPC) and antioxidant activity (AA) by ABTS and FRAP methods.
2.4 Central composite rotational design (CCRD)
In order to refine the results obtained by the FFD and improve the optimization of factors such as ethanol concentration and extraction temperature, a second design was carried out. For this purpose, the time was fixed at 1 h in accordance with the FFD and was employed a CCRD with a four-point axis and two repetitions on the central point, totaling 10 trials in triplicate. Each combination of ethanol concentration and temperature consisted of an assay. Table 2 shows the levels of the actual and coded independent variables, as well as the results of TPC (mg GAE g−1) and antioxidant activity (AA) in the individual treatments.
2.5 Predictive ability of the PLSR models
The samples belonging to the last planning (CCRD) were used to perform the modelling. Initially, the images of the samples corresponding to the extracts of each run and the assays themselves (total phenolic compounds and antioxidant activity by ABTS and FRAP) were recorded. The acquisition of the digital images was obtained using the Samsung Galaxy S9 cell phone (SM-G9600) in controlled conditions of brightness and distance, performed in a mini photo studio (mini studio of 56 Leds Evobox 60 cm Plus - EVOBOX PLUS). The digital images (8-bit) were edited using the program GIMP version 2.10.18. All digital images were cut in the GIMP program with a pixel dimension of 400 × 400. The image gray tones of the three red, green, blue (RGB) color channels were extracted to compose the data matrix. The gray tones in each image were 256 for each color channel. As we had three color channels (RBG space), the data matrix was composed of 256 * 3 = 768 attributes (response variables). This same matrix of data from the gray tones of each image, together with the reference values of the assay, was used for PLS modeling. The reaction medium was composed of the C. spruceanum bark extract and with the specific reagents of each spectrophotometric assay. The images of each sample in their respective spectrophotometric assay were acquired with a smartphone and modeling by PLSR. The partial least squares (PLSR) regression method always requires two types of matrices; an X matrix (gray tones from digital images) and another Y with the reference values of the spectrophotometric assays.
From the obtained digital images, two methods for modeling (PLSR) were used: the first by using images of pure extracts with reference values, which were obtained by UV/Vis spectroscopy. These samples were named Extract Image (EI) referring to the images of the pure extracts. In the second method, images corresponding to the assays of each response variable, TPC, antioxidant activity by ABTS and FRAP methods were used, correlating with spectroscopic analyzes (UV/Vis). This group of images was named Assay Image (AI). The images generated from EI and AI for each variable response are shown in Fig. 1. For the elaboration of this step, the images (extraction of grey tones from the RGB channels (Red - Green - Blue), as well as the PLSR modelling were performed using the Chemostat®V software. The predicted versus observed graphics were developed using the OriginPro 8.0 software.
The extracted color pattern of extracts from Calycophyllum spruceanum barks (A), color pattern along with the reaction medium for testing total phenolic compounds (B), along antioxidant activity measured by DPPH assay (C) and along FRAP assay (D) used for modelling by PLSR corresponding to run R1 to R10, according to central composite rotational design (CCDR) on Calycophyllum spruceanum barks.
The precision and performance of the generated models were obtained by the optimum number of latent variables (NLV), dependent proportion (DP), root mean square error of calibration (RMSEC), coefficient of determination (R2) and residual predictive value (RPD). According to D’Acqui et al. (2010), the RPD can be considered of higher performance when the value is greater than or equal to 3, of good quality in values between 2 and 3, of medium quality when the values are between 1.5 and 2 and of poor quality when is <1.5.
2.6 Total phenolic compounds (TPC) and antioxidant activity (AA)
The TPC of the extracts from C. spruceanum barks was determined using the Folin–Ciocalteu method as described by Singleton et al. (1999). The absorbance of the extract was measured at 740 nm in a spectrophotometer (UV–Vis Bel Photonics, 2000 Piracicaba, Brazil) and expressed in mg GAE g−1 (GAE: gallic acid equivalent).
The antioxidant activity by the ABTS•+ method was performed according to the methodology described by Re et al. (1999). The absorbance was measured at 734 nm and the results were expressed in mM TEAC g−1 sample (TEAC: antioxidant capacity equivalent to Trolox).
The ferric reducing antioxidant power (FRAP) of the extracts were determined by the procedure described by Pulido et al. (2000), based on the antioxidant's ability to reduce Fe+3 in Fe+2, in the presence of 2,4,6-tri (2 -pyridyl) −1,3,5-triazine (TPTZ). The absorbance readings were performed on a spectrophotometer at 595 nm. The results were expressed in mM Fe+2 g−1. All analyzes were performed in triplicate.
2.7 Statistical analysis
The STATISTICA 8.0 software was used to analyze the results obtained in FFD and CCRD planning. Data were analyzed for analysis of variance (ANOVA) (p ≤ 0.05), effects estimation, regression coefficients, Tukey's test (p ≤ 0.05), determination coefficient, chi-square, and lack of fit (results presented in the Supplementary material Table SI 1 to Table SI 3). The results were considered statistically significant when p-value < 0.05. Contour surface graphics were also generated. Pearson correlation was generated between TPC and AA methods (correlations data presented only in the text). The values obtained in the planning runs are presented as mean ± standard deviation. Aiming at the general optimization of the response variables in a single condition, the global response (RG) calculation was used as described by Novaes et al. (2017).
3 Results and discussion
3.1 Effect of factors: ethanol, extraction time and temperature of phenolic compounds and antioxidant activity in Calycophyllum spruceanum bark
According to previous studies (Chew et al., 2011), the main factors that influence the efficiency of the extraction process of phenolic compounds with antioxidant potential in plants are the concentration of the solvent, time, and extraction temperature. Thus, in this study, each of these three factors was assessed at three levels. The minimum and maximum levels for each factor were selected based on the aforementioned literature reports, while the sample-to-solvent ratio was kept constant and supported by previous team studies (Casagrande et al., 2019; Moura et al., 2018). Thus, considering solvent consumption, the ratio of 2 g 30 mL−1 was selected for the optimization experiments. Regarding the dependent variables, the content of TPC and the AA were reported by two methods to evaluate these responses by different mechanisms of action.
The ABTS method is one of the most effective and prominent methods to analyze antioxidant activity in plants and foods (Floegel et al., 2011). This method is used to measure the radical scavenging ability of antioxidants (single-electron or hydrogen atom transfer). While, the ferric ion reducing antioxidant power (FRAP) assay is a redox-linked assay and only reflect the reducing capacity of the compounds and, therefore, do not identify potential antioxidants that work through a hydrogen atom transfer as ABTS assay. Therefore, these two methods are complementary and enable more complete information on the antioxidant capacity of natural products.
The TPC values ranged from 54.25 ± 0.16 to 956.36 ± 1.98 mg GAE g−1. While antioxidant activity by ABTS and FRAP methods varied from 0.29 ± 0.001 to 21.93 ± 0.07 mM TEAC g−1 and from 0.35 ± 0.003 to 25.04 ± 0.98 mM Fe+2 g−1, respectively (Table 1). The highest TPC values were observed in the extract with 20% ethanol at 80 °C for 60 min of the extraction and significant difference (p < 0.05) was found among the values with other extraction conditions (Table 1). In this study, extracts obtained with lower hydro-ethanolic solutions (20%) were more effective in the extraction of total phenolic compounds than the more concentrated hydro-ethanolic solutions (60% and 100%). Similar behavior was observed in the AA by ABTS and FRAP methods, where the increase in the concentration of ethanol led to a reduction in the concentrations of such response variables.
Thus, the extracts obtained with a lower concentration of ethanol revealed greater performance in the extraction of phenolic compounds and also in the AA capacity. Possibly, the compounds present in the bark of C. spruceanum, appear to be more polar, solubilizing in ethanol at low concentrations. This result is in line with other studies in other plant species, such as Morinda citrifolia (formengkudu) (Thoo et al., 2010) and Orthosiphon stamineus (Chew et al., 2011).
Previous studies with Callycophyllum spruceanum, revealed the presence of tannins and phenols, which were related to the photoprotection of this specie Additionally, the amount of tannins and other phenolic compounds, can be influenced by the time when Mulateiro bark is harvested (Anjos et al., 2018).
Another study investigated a factorial design 23 aiming at the quantification of the tannin contents in C. spruceanum bark from the Brazilian biome, which was extracted by decoction and evaluated the time and the solvent rate (proportion of water in relation to the material dry) used in the process. In this study, the authors found the best condition in 15 min of extraction at a rate of 2.5% solvent/ sample (da Costa et al., 2011). However, other conditions, such as temperature, have not been evaluated. Additionaly, Zuleta et al. (2003) identified the presence of secairidoides and iridoides in 100% ethanolic extract, however without the optimization of the extraction.
Figueiredo Filho et al. (2016), to study the effect of ethanolic extract of Mulateiro on anti-aging of fibroblasts in adult humans, the authors evaluated the antioxidant activity by the DPPH method in extracts with 70% ethanol. However, these researchers reinforce the need to optimize the conditions for the extraction of the compounds with antioxidant potential.
Based on the results obtained in this study, the three factors: solvent, temperature, extraction time, and their interactions were statistically significant. Besides the factors affected the amounts of TPC and AA (Supplementary material - Table SI 1). The estimation of the effects of each factor were also evaluated and is presented in Supplementary material - Table SI 1. The ethanol concentration had the most influence on all the responses followed by temperature and extraction time.
The time and temperature factors (quadratic terms) did not show statistical significant variation (p > 0.05) for AA by the ABTS and FRAP methods, respectively. However, the interaction between these two factors had a significant influence (p < 0.05). Thus, it is suggested that lower ethanol concentrations and higher temperatures may be more effective in the extraction of phenolic compounds with antioxidant potential. However, the combination of solvent, temperature, and extraction time needs to be efficient for the maximum transfer of compounds with the antioxidant potential to the extract. However, the conditions for extracting compounds with antioxidant activity can be extreme, to the point of causing degradation of phenolic compounds in natural products. Temperatures above 80 °C were not used, because some studies report the possible degradation of compounds at higher temperatures (Sari et al., 2020).
Although the models presented lack of fit (Supplementary material – Table SI 1) for the three response variables, the chi-square assay (Supplementary material – Table SI 2), for TPC and ABTS were no statistically significant difference between the observed values and predicted in the models.
The equations of the generated models are presented in the Supplementary material Table SI 2. In this study, it was possible to verify values of determination coefficients (R2) equal for all responses (TPC, ABTS and FRAP), which was 0.99 (Supplementary material Table SI 2), showing that 99% of the data variability can be explained by the respective models.
Mathematical modelling was used to create the contour surface and response graphs of the dependent variables (TPC, ABTS and FRAP) as a function of the factors (time, temperature and ethanol concentration) evaluated in this research (Fig. 2). Therefore, when analyzing Fig. 2C, F and I, it is possible to observe that the time factor for TPC, ABTS and FRAP was significant and affects these dependent variables. The concentration of ethanol visibly shows a tendency to improve responses when used in lower concentrations (Fig. 2A–H). In addition, the temperature seems to be more efficient for the extraction of phenolic compounds and has greater antioxidant activity in extracts subjected to higher temperatures (Fig. 2A, C, D, F, G and I). In this study, all response variables (TPC, ABTS and FRAP) showed similar behaviour in relation to the factors evaluated. In this context, when calculating the global response (RG) for the experimental design, the RG value of 3.0 was obtained, which corresponds exactly to run 3 (20% ethanol, 80 °C temperature, during 1 h of extraction). This condition, in turn, corroborates with the other data presented in this work.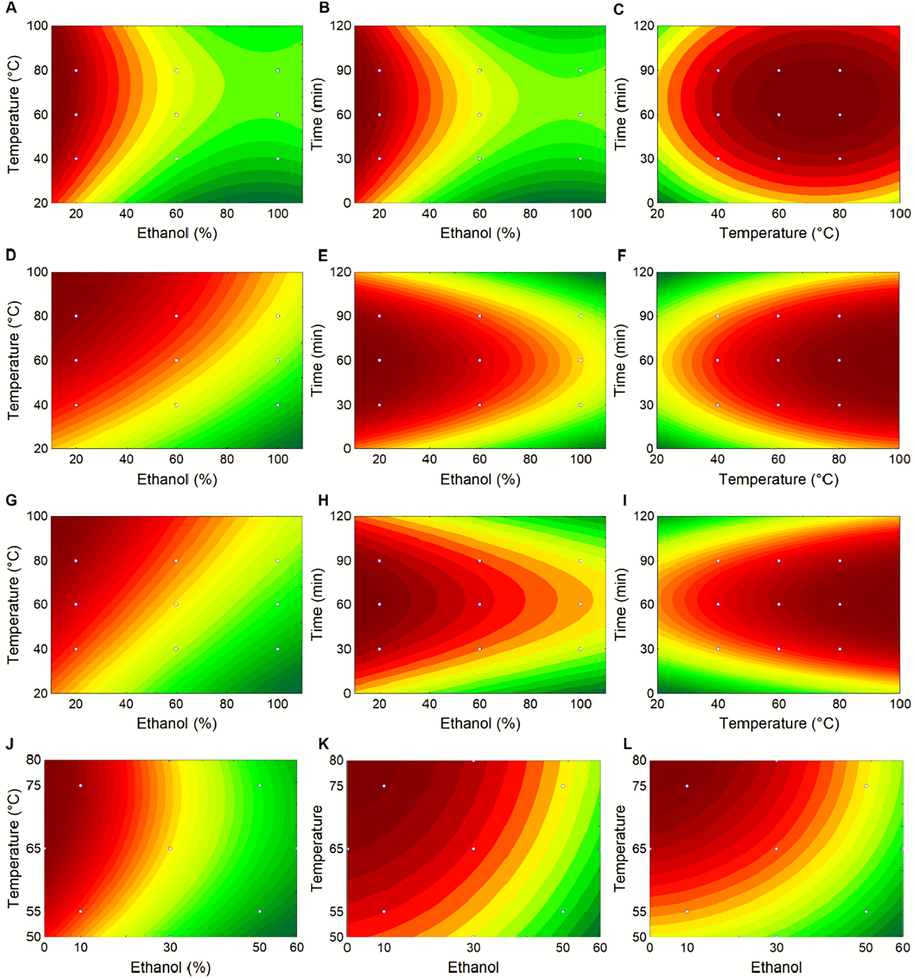
(A-I) Surface plot for the effect of extraction temperature (°C), time (min) and ethanol (%) by fractional factorial design (FFD) on total phenolic compounds (TPC) (A-C), antioxidant activity measured by ABTS method (D-F), and antioxidant activity measured by FRAP method (G-I). (J-L) Surface plot for the effect of extraction temperature (°C) and ethanol (%) by central composite rotational design (CCRD) on total phenolic compounds (TPC) (J), antioxidant activity measured by ABTS method (K), and antioxidant activity measured by FRAP method (L) on Calycophyllum spruceanum barks.
3.2 Central composite rotational design (CCRD) to improve the optimization of extraction compounds with antioxidant activities
In an attempt to further improve (refine) the responses to the extraction conditions, especially regarding the ethanol concentration and temperature used in the experiments, a second experimental design, the CCRD, was carried out. After screening the main influencing factors in the extraction process of phenolic compounds and antioxidant potential in mulateiro’s bark using FFD, a new experimental design was outlined. Thus, CCRD with only two factors was used in order to optimize the process of extraction of TPC and AA. Modelling using CCRD and response surface methodology also allows estimating second-order polynomial models between dependent and independent variables, providing information on the interactions of these variables (Xiong et al., 2014).
Table 2 presents the real and coded levels for the factors evaluated and their respective responses (TPC, ABTS and FRAP) through the CCRD. In this new experimental design, the extraction time was kept constant (1 h) for all assays. The TPC values in this design were higher than the FFD and ranged from 414.06 ± 4.21 to 998.07 ± 17.84 mg GAE g−1 (Table 2). The solvent, temperature and quadratic effect of these factors had significant effects on TPC values (pvalue < 0.05) by ANOVA (Supplementary material, Table SI 3). In this study, the extraction temperature and solvent concentration had significant effects on TPC yield implying that an extraction temperature higher than the optimum, results in the decrease of TPC yields. However, solvent-temperature interaction was not significant on TPC values (pvalue > 0.05), it could be concluded that the interaction between ethanol concentration and temperature may negatively affect TPC yields.
A similar trend was observed in the antioxidant activity analyzed by both methods, where ABTS and FRAP activities decreased as the extraction temperature and concentration ethanol increased simultaneously. Thus, the antioxidant activity values ranged from 11.56 ± 0.02 a 23.00 ± 0.67 mM TEAC g−1 and of 9.61 ± 0.077 to 25.55 ± 0.05 mM Fe+2 g−1 for antioxidant activity by ABTS and FRAP, respectively. These findings are in agreement with Chew et al. (2011) who showed that some phenolic compounds with antioxidant capacity might be degraded because of thermal oxidation. The highest values for TPC, ABTS and DPPH were achieved at extraction temperatures of 75 and 65 °C obtained in runs 3 and 5, which corresponding to extractions with 10% ethanol and pure water, respectively (Table 2). These results followed the trend obtained in the FFD design (Table 1). In this sense, it was observed that in lower concentrations of ethanol and temperatures between 65 and 75 °C, the extracts showed more efficient results for the extraction of phenolic compounds with antioxidant activity.
In this study, it was observed that the solvent factor had a greater influence on the analyzed responses and the coefficients for each model and each response are presented in Supplementary material Table SI 2. The determination coefficient (R2) for this model was 0.99 for TPC and 0.97 for both responses ABTS and FRAP. Despite the models generated lack of adjustment for TPC, the R2 was 0.99, implying that 99% of the variation was explained by the model. The models for TPC, ABTS and FRAP, showed a lack of adjustment by ANOVA and the chi-square assay (Supplementary material Table SI 2).
The response surface plots provide two points for discussion: exploring the performance of the whole experimental domain and to find the ideal conditions for the analyzed variables, including their interactions. In this sense, the contour surface plots obtained in the CCRD experimental project are shown in Fig. 2. J, K and L. It is possible to observe that the concentration of ethanol was the main influencing factor in the TPC and AA (via radical scavenging and redox reactions) in mulateiro's bark extracts. From Fig. 2 J, the remarkable decrease of TPC with lower ethanol concentration was observed. In fact, the results show that the extracts assayed with an ethanol concentration above 10% (30, 50 and 60%) presented TPC8 < 700 mg of GAE g−1, regardless of temperature used. This behaviour was also observed in the analysis of antioxidant activity by both methods (ABTS and FRAP) (Fig. 2 K and L), where the extracts in concentrations above 10% of ethanol showed values below 19000 µM TEAC g−1 and 19,000 Fe+2 g−1 for ABTS and FRAP, respectively.
However, the results show that there is no need to use high concentrations of ethanol to obtain a greater release of phenolic compounds with antioxidant activity on C. spruceanum (Mulateiro) barks. From the economical and environmental point of view, it is a positive finding, since the excessive use of solvents is not recommended. Besides, the extraction time for 1 h fixed from the FFD proved to be efficient, due to the improvement in the results obtained between the designs. The results indicate that the increase in temperature favours the release of phenolic compounds and compounds with antioxidant activity. It is also important to note that, as an advantage in this study, the best extraction conditions were the same for the three response variables TPC, FRAP and ABTS.
Although some studies indicating the chemical composition of this plant, the results are still limited regarding the optimization of phenolic compounds extraction with antioxidant potential. Nevertheless, de Vargas et al. (2016), who reported 602 mg GAE g−1 on C. spruceanum bark extracts obtained with ethanol in an ultrasound bath for 20 min and this value is lower than that obtained in this study, especially when low concentrations of ethanol were used (Table 2). Which shows the importance of process optimization.
In addition, the linear correlation between the response variables can also be informative and when analyzing the correlation between the TPC and ABTS content, it was found to be high (0.94) and statistically significant (p < 0.0001) (correlations data presented only in the text). The same occurred with the correlation between TPC and FRAP (0.90 and p < 0.0001). These results indicate that the compounds responsible for the antioxidant activity in mulateiro extracts are mostly from the phenolic class. Besides, the determinations for ABTS and FRAP also presented a positive correlation of 0.98 and significant (p < 0.0001), indicating that the techniques responded in a very similar way and strongly related to the TPC.
3.3 Prediction performance of partial least squares regression (PLSR) model
The partial least squares regression is a very versatile linear multivariate analysis and was used to predict the total phenolic contents and antioxidant activity by ABTS and FRAP of Mulateiro barks. The models and their use are discussed in this step to analyze the chemical data and understand the antioxidant properties. The prediction data of the response variables by PLSR and the performance of each model are shown in Fig. 3. From the results, it is possible to observe that the method used showed significant performance in its efficiency.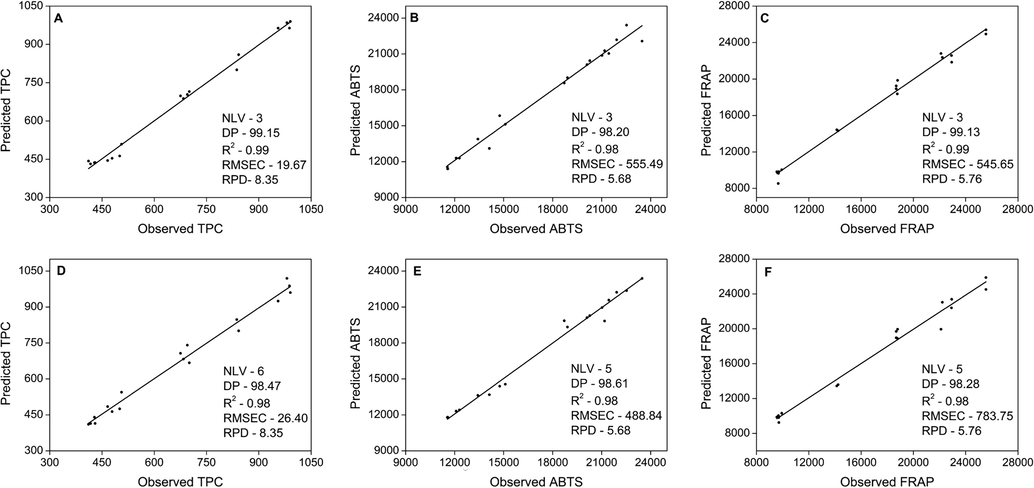
(A-C) Observed versus predicted plot for total phenolic compounds (A), antioxidant activity by ABTS method (B), and antioxidant activity measured by FRAP method (C) in assay images; (D-F) Observed versus predicted plot for total phenolic compounds (D), antioxidant activity measured by ABTS method (E), and antioxidant activity measured by FRAP method (F) in extract images, respectively, using partial least squares regression (PLSR). NLV: Optimum number of latent variables, DP: dependent proportion, R2: coefficient of determination, RMSEC: root mean squared errors of calibration, RPD: residual predicted value.
In order to find an efficient way to predict the levels of TPC and antioxidant activity in Mulateiro barks, the data were organized and assayed by two methods: (1) Extract Image (EI) method and (2) Assay Image (AI) method (images were presented in Fig. 1). The EI method consists of obtaining images of pure extracts, while the AI method consists of obtaining images from the assays (TPC, ABTS and FRAP). Both methods have used the images and values obtained by spectroscopy in the visible region for all responses (TPC, ABTS and FRAP) in extracts from the CCRD design.
In order to minimize errors and obtain greater assurance in the robustness of the study, the least possible number of latent variables (NVL) was chosen. In this choice, the determination coefficient was kept above 98%, since the greater the NVL are used, the more noise can be incorporated into the models (Santos et al., 2019). In this sense, for the Assay Image method, the number of latent variables for each response/assay (TPC, ABTS and FRAP) was 3 (Fig. 3A, B and C, respectively). For the EI method, the NVL was superior, 6 for TPC and 5 (Fig. 3D) for each ABTS (Fig. 3E) and FRAP (Fig. 3F) response/assay.
In studies with PLSR modelling, the basic assumption of the models is that the studied context is driven by a small number of these latent variables, which are estimated as linear combinations of weighted averages of the observed variables (Silva et al., 2014). However, the Assay Image method showed greater efficiency regarding this parameter, as it uses less NVL.
In addition to the PLSR, there are other calibration methods, which are possible to carry out prediction modelling studies by chemometrics. In previous studies, similar values of latent variables (VL) were used, however, in the vast majority, higher than that used in this work. In fact, da Silva et al. (2018) used 10 to 12 VL to determine TPC, FRAP, ABTS and DPPH with determination coefficients between 0.87 and 0.95 in propolis extracts. While, Kawamura et al. (2017) used 7 to 14 VL with R2 between 0.96 and 0.99 in determining carbon and nitrogen in soil by VIS-NIR (Near Infrared Spectroscopy).
On the other hand, it is important to note that most previous chemometric studies seen in the literature do not include what was done in this study. Since, we use images and concentration data (spectrophotometric) applied to tests for the TPC and AA assays in mulateiro bark extracts.
However, it is possible to mention some previous studies in the construction of PLSR models for determinations of phenolic compounds and antioxidant activity by DPPH in grape leaf extracts. In this study, UV–Vis spectrophotometry and ultra-high pressure liquid chromatography coupled with mass spectrometry were used, obtaining satisfactory results (Song et al., 2020). The development of predictive models for total phenolics and free p-coumaric acid contents in barley grains analyzed by NIR was studied by (Han et al., 2017). Additionally, PLSR for the determination of phenolic compounds in honey (Tahir et al., 2017) and in 14 other different plant matrices were also studied and analyzed by Fourier-transform infrared (FTIR) spectroscopy (Johnson et al., 2020).
PLSR graphs of the three response variables evaluated in this study (TPC, ABTS and FRAP) with the observed values versus predicted values are shown in Fig. 3. In this sense, the PLSR modelling for the TPC performed with only 3 VL, showed high capacity predictive with determination coefficient equal to 99.15% for Assay Image (AI) method (Fig. 3A). However, in another model for TPC, which was used 6 VL, its presented R2 = 98.47% for Extract Image (EI) method (Fig. 3D), revealing in both cases suitable and robust models. The values for RMSEC were also used to assess the fit and predictive power of the models, with a value of 19.67 for AI and 26.40 for EI, that are considered as a measure of the modelling error (Fig. 3).
The R2 value for AI was 0.99, which was higher than EI whose value was 0.98, indicating the adequate slope of the curve and good robustness and predictive capacity for this calibration model. In other studies, satisfactory determination coefficients, between 0.88 and 0.99, were also obtained for modelling phenolic compounds in barley and honey (Han et al., 2017; Tahir et al., 2017).
In addition, another important parameter to be considered is the residual predictive values (RPD), which presented a value of 8.35 for TPC and the model could be considered to have an excellent predictive accuracy (Fig. 3A and D). In fact, high RPD value indicates the greater performance of the model, that can be considered excellent when the value is higher than 8 as suggested by D’Acqui et al. (2010). However, when RPD value is higher than 3 it is classified as good and below this value, this metric is categorized as unreliable (Santos et al., 2019). This parameter is the quotient of the standard deviation between the predicted values and the real ones of the model, being directly related to the variability explained by the R2.
Likewise, when analyzing the modelling results obtained for antioxidant activity (ABTS and FRAP), the number of latent variables (NVL) were equal within each method, respectively 3 and 5 for AI and EI. In these models, the RMSEC values for antioxidant activity by the ABTS and FRAP methods were 555.49 and 545.65 for AI (Fig. 3B and C) and 488.74 and 783.75 for EI (Fig. 3E and F), respectively. It is possible to notice that the data obtained for AI were more efficient when compared to EI for FRAP and TPC, since the RMSEC indicates the measurement of the modelling error, the lower the value, the smaller the error. However, although EI needs a greater number of latent variables, for better response, the determination coefficient for ABTS and FRAP also remained adequate, with values of 0.98 (R2). This metric, R2, above 0.9 is considered to have an excellent predictive capacity (Shi and Yu, 2017). Besides, the RPD is a significantly important parameter to be considered, since both variables showed excellent performance and generated values above 3 (5.68 for ABTS and 5.76 for FRAP) (Fig. 3).
In summary, it should be noted that despite the use of two different methods (AI and EI), the models for the total quantification of TPC and AA by ABTS and FRAP showed coefficients of determination greater than 0.98. This metric, together with RPD values greater than 3, using, however, few latent variables (from 3 to 6), for both models (EI and AI) developed in this work were satisfactory.
In addition, the adequacy of the models was also supported by observed vs predicted plots, where the points are very close to the fitted line (Fig. 3). Therefore, all models by PLSR generated in this study has an excellent predictive capacity. With emphasis, we mention the modelling for TPC, which was the most efficient among all the models generated, especially when considering the AI method, as it presented R2 of 0.99 and RPD of 8.35. Finally, the extraction of compounds with antioxidant activity from the Calycophylloum spruceanum barks was optimized and presented high antioxidant potential.
4 Conclusion
The extraction of compounds with antioxidant activity could be successfully performed due to the experimental designs proposed in this research. The use of the two types of designs, FFD and CCRD enabled the optimization of conditions to obtain extracts rich in phenolic compounds with high antioxidant activity. In this sense, the best extraction conditions occurred by using 10% ethanol at 75 °C during 1 h of extraction.
In addition, the technique used to acquire images of the extracts and tests for the dependent variables (TPC, ABTS and FRAP) with the reference values obtained by spectroscopic techniques were developed and the generated PLSR models proved to be efficient and low cost to predict the content of phenolic compounds with antioxidant potential in Calycophylloum spruceanum bark. New studies using chromatographic techniques could be carried out to determine the chemical diversity present in Mulateiro, thus contributing to increase the number of information about this species found in the Brazilian Biome, in the Amazon Forest, enabling further applications in several areas, as medicinal, cosmetic and in food.
Acknowledgement
The authors gratefully acknowledge the technical and financial support of the UTFPR - Pato Branco, Paraná, Brazil, Brazilian National Research Council (CNPq), and Coordination for the Improvement of Higher Level Personnel (CAPES).
Declaration of Competing Interest
Authors have no conflict of interest to declare.
References
- Anjos, A.P.S. dos, Cantanhede, A.K.A., Tenorio, K.M.M., Clemente, R.C., Nascimento, G. N. do, Pereira, R.J., 2018. Fitoquímicos e atividade antioxidante das espécies Lafoensia pacari e Calycophyllum spruceanum. Enciclopédia Biosfera 15, 1227. https://doi.org/10.18677/EnciBio.
- Optimization of the extraction of antioxidant phenolic compounds from grape pomace using response surface methodology. J. Food Meas. Charact.. 2019;13:1120-1129.
- [CrossRef] [Google Scholar]
- Effect of ethanol concentration, extraction time and extraction temperature on the recovery of phenolic compounds and antioxidant capacity of Centella asiatica extracts. Int. Food Res. J.. 2011;18:571-578.
- [Google Scholar]
- Soil properties prediction of western Mediterranean islands with similar climatic environments by means of mid-infrared diffuse reflectance spectroscopy. Eur. J. Soil Sci.. 2010;61:865-876.
- [CrossRef] [Google Scholar]
- Technological development of aqueous extracts from Calycophyllum spruceanum (mulateiro) using factorial design. Braz. J. Pharm.. 2011;21:181-186.
- [CrossRef] [Google Scholar]
- Determination of Total Phenolic Compounds and Antioxidant Activity of Ethanolic Extracts of Propolis Using ATR–FT-IR Spectroscopy and Chemometrics. Food Anal. Method.. 2018;11:2013-2021.
- [CrossRef] [Google Scholar]
- Antioxidant activity and peroxidase inhibition of Amazonian plants extracts traditionally used as anti-inflammatory. BMC Complemen. Altern. Med.. 2016;16:1-8.
- [CrossRef] [Google Scholar]
- Duke’s Handbook of Medicinal Plants of Latin America. Boca Raton, FL, USA: CRQ Press; 2009.
- Medicinal plants in Brazil: Pharmacological studies, drug discovery, challenges and perspectives. Pharmacol. Res.. 2016;112:4-29.
- [CrossRef] [Google Scholar]
- Mulateiro (Calycophyllum spruceanum) stem cell extract: An evaluation of its anti-aging effect on human adult fibroblasts. Int. J. Sci. Eng. Res.. 2016;7:87-90.
- [Google Scholar]
- In vitro micropropagation and callus induction of Mulateiro (Calycophyllum Spruceanum) seeds collected from the Amazon basin. Int. J. Sci. Technol.. 2014;2:2-4.
- [Google Scholar]
- Comparison of ABTS/DPPH assays to measure antioxidant capacity in popular antioxidant-rich US foods. J. Food Comp. Anal.. 2011;24:1043-1048.
- [CrossRef] [Google Scholar]
- Development of predictive models for total phenolics and free p-coumaric acid contents in barley grain by near-infrared spectroscopy. Food Chem.. 2017;227:342-348.
- [CrossRef] [Google Scholar]
- Phytotherapy of nephrotoxicity-induced by cancer drugs: An updated review. J. Nephropathol.. 2017;6:254-263.
- [CrossRef] [Google Scholar]
- Potential for Fourier transform infrared (FTIR) spectroscopy toward predicting antioxidant and phenolic contents in powdered plant matrices. Spectrochim. Acta A Mol. Biomol. Spectrosc.. 2020;233:118228.
- [CrossRef] [Google Scholar]
- Vis-NIR spectroscopy and PLS regression with waveband selection for estimating the total C and N of paddy soils in Madagascar. Remote Sens.. 2017;9:1081.
- [CrossRef] [Google Scholar]
- Rapid fruit extracts antioxidant capacity determination by Fourier transform infrared spectroscopy. J. Food Sci.. 2006;70:C545-C549.
- [CrossRef] [Google Scholar]
- Determination of total phenolic content and antioxidant capacity of onion (Allium cepa) and shallot (Allium oschaninii) using infrared spectroscopy. Food Chem.. 2011;129:637-644.
- [CrossRef] [Google Scholar]
- Plant-derived nanostructures: types and applications. Green Chem.. 2015;18:20-52.
- [CrossRef] [Google Scholar]
- Moura, C. de, Reis, A.S.dos, Silva, L.D.da, Lima, V.A. de, Oldoni, T.L.C., Pereira, C., Carpes, S.T., 2018. Optimization of phenolic compounds extraction with antioxidant activity from açaí, blueberry and goji berry using response surface methodology. Emir. J. Food Agric. 30, 180–189. https://doi.org/10.9755/ejfa.2018.v30.i3.1639.
- Formulation of solid/liquid perfumes of essential oils from different medicinal plants. J. Facul. Sci.. 2018;5:95-117.
- [Google Scholar]
- Novaes, C.G., Yamaki, R.T., De Paula, V.F., Do Nascimento Júnior, B.B., Barreto, J. A., Valasques, G.S., Bezerra, M.A., 2017. Optimization of analytical methods using response surface methodology part I: process variables. Rev. Virtual Quim. 9, 1184–1215. https://doi.org/10.21577/1984-6835.20170070.
- Anti-inflammatory and anticancer drugs from nature. Cancer Res. Treat.. 2013;159:123-143.
- [CrossRef] [Google Scholar]
- Essential oils: sources of antimicrobials and food preservatives. Front. Microbiol.. 2017;7:2161.
- [CrossRef] [Google Scholar]
- Calycophyllum spruceanum (Benth.), the Amazonian “Tree of Youth” prolongs longevity and enhances stress resistance in Caenorhabditis elegans. Molecules. 2018;23:534.
- [CrossRef] [Google Scholar]
- Antioxidant activity of dietary polyphenols as determined by a modified ferric reducing/ antioxidant power assay. J. Agric. Food Chem.. 2000;48:3396-3402.
- [CrossRef] [Google Scholar]
- Antioxidant activity applying an improved ABTS•+ radical cation decolorization assay. Free Radical Bio. Med.. 1999;26:1231-1237.
- [CrossRef] [Google Scholar]
- Chemometrics in analytical chemistry – an overview of applications from 2014 to 2018. Eclética Quím. J.. 2019;44:11-25.
- [CrossRef] [Google Scholar]
- Extraction of phenolic compounds from Tabernaemontana catharinensis leaves and their effect on oxidative stress markers in diabetic rats. Molecules. 2020;25:1-16.
- [CrossRef] [Google Scholar]
- Evaluation of antioxidant, antidiabetic and antiobesity potential of selected traditional medicinal plants. Front. Nutr.. 2019;6:1-11.
- [CrossRef] [Google Scholar]
- Comparison of grating-based near-infrared (NIR) and Fourier transform mid-infrared (ATR-FT/MIR) spectroscopy based on spectral preprocessing and wavelength selection for the determination of crude protein and moisture content in wheat. Food Control. 2017;82:57-65.
- [CrossRef] [Google Scholar]
- Application of FTIR-ATR to Moscatel dessert wines for prediction of total phenolic and flavonoid contents and antioxidant capacity. Food Chem.. 2014;150:489-493.
- [CrossRef] [Google Scholar]
- Analysis of total phenols and other oxidation substrates and antioxidants by means of Folin-Ciocalteu reagent. Method Enzymol.. 1999;299:152-178.
- [CrossRef] [Google Scholar]
- Predicting the antioxidant capacity and total phenolic content of bearberry leaves by data fusion of UV–Vis spectroscopy and UHPLC/Q-TOF-MS. Talanta. 2020;213:120831
- [CrossRef] [Google Scholar]
- Rapid prediction of phenolic compounds and antioxidant activity of Sudanese honey using Raman and Fourier transform infrared (FT-IR) spectroscopy. Food Chem.. 2017;226:202-211.
- [CrossRef] [Google Scholar]
- Effects of binary solvent extraction system, extraction time and extraction temperature on phenolic antioxidants and antioxidant capacity from mengkudu (Morinda citrifolia) Food Chem.. 2010;120:290-295.
- [CrossRef] [Google Scholar]
- Prediction of total antioxidant capacity of red wine by Fourier transform infrared spectroscopy. Food Control. 2010;21:786-789.
- [CrossRef] [Google Scholar]
- Extraction, characterization and antioxidant activities of polysaccharides from E. corneum gigeriae galli. Carbohydr. Polym.. 2014;108:247-256.
- [CrossRef] [Google Scholar]
- Seco-iridoids from Calycophyllum spruceanum (Rubiaceae) Phytochem.. 2003;64:549-553.
- [CrossRef] [Google Scholar]
Appendix A
Supplementary material
Supplementary data to this article can be found online at https://doi.org/10.1016/j.arabjc.2020.07.015.
Appendix A
Supplementary material
The following are the Supplementary data to this article:Supplementary Data 1
Supplementary Data 1


