

Translate this page into:
Rhenium-molybdenum separation in an alkaline leaching solution of a waste superalloy by N263 extraction
⁎Corresponding author. yiaifei@grinm.com (Aifei Yi)
-
Received: ,
Accepted: ,
This article was originally published by Elsevier and was migrated to Scientific Scholar after the change of Publisher.
Peer review under responsibility of King Saud University.
Abstract
The recovery of rhenium from waste superalloys has always been a research focus. This study focuses on the performance of extraction of rhenium and its separation with molybdenum in alkali leaching solution of waste superalloy by methyl trioctylammonium chloride (N263). Minitab 17 Statistical Software (Trial version, Techmax, USA) was used to create a four-factor (N263 concentration, sec-octyl alcohols concentration, extraction time and organic to aqueous ratio (O/A ratio)) two-level orthogonal experiment table. According to the orthogonal experiment results of rhenium extraction and rhenium molybdenum separation coefficient, rhenium extraction model, rhenium molybdenum separation coefficient model and the corresponding regression equation were established. The rhenium extraction performance of N263 was investigated by the rhenium equilibrium curve and NaSCN concentration. It was found that the N263 concentration was the main factor affecting rhenium extraction, and the regression equation of rhenium extraction was Re extraction/% = 0.672 + 9.880 [N263]. Moreover, N263 concentration and O/A ratio are the main factors affecting rhenium molybdenum separation coefficient. The regression equation of rhenium molybdenum separation coefficient is Re/Mo = 37.5 + 116.88* [N263] −24.3 *(O/A ratio) −20.62 [N263]*(O/A ratio). At the same concentration of the rhenium stripping agent, the rhenium stripping efficiency is perchloric acid > nitric acid > sodium thiocyanate. However, the strong oxidability of perchloric acid and nitric acid destroys the organic phase, making the organic phase produce visible destruction. The rhenium stripping was about 75.8 % with 40 times the theoretical amount of sodium thiocyanate. The results showed that Re was easy to be extracted in the alkali solution, but it was not easy to be stripped from the loaded N263 phase.
Keywords
Rhenium
Molybdenum
Waste superalloy
N263

1 Introduction
Nickel-based superalloys contained rhenium 3 %-6% (w/w) for its high melting point, which are used most extensively in the combustion and turbine sections of the engine [Sinha, 2006; Gaur et al., 2015; Hori et al., 2015]. The superalloy sector accounts for 80 % rhenium use with an average annual rise in demand of 5 % expected in the coming decades [Srivastava et al., 2016].
Rhenium was considered as an element of strategic military importance by many national governments [Huang & Zhu, 2016]. And, recycling research to create a secure rhenium resource is urgently needed. Recycling of rhenium reached more than 50 % due to its scarce availability and the growing demand for rhenium containing superalloys in high-tech engines and turbines [Gaur et al., 2015; Laatikainen, 2015].
Considering from industrial production, the method of recovering rhenium in superalloy not only focuses on product purity, but also focuses on energy consumption and environmental protection points [Mamo et al., 2019]. And its essence is due to the separation efficiency of rhenium and other metals in the alloy. Hydrometallurgy is one of the common methods because it is more environmentally friendly and consumes less energy. Rhenium in the separation solution was separated and extracted by ion exchange [Zhang et al., 2017] adsorption [Virolainen et al., 2015; Xiong et al., 2013], imprinted polymer [Xiong et al., 2017] and solvent extraction. [Cheema et al., 2018; Villarroel et al., 2021].
In the process of rhenium extraction recovery, the efficient separation of rhenium and molybdenum is difficult, and a promising effective separation method is solvent extraction. Mixtures of tri-alkylamine (N235, R3N, R = C8-C10) and tri-n-butyl phosphate (TBP) dissolved in kerosene were used to extract Re (VII) and Mo (VI) [Xiong et al., 2010]. Amine N235 as extractant of rhenium from sulphuric acid solution, its Re extraction was above 99 %. Molalities of perrhenate after extraction were measured at different ionic strengths which arranged from 0.2 to 2.0 (mol/kg). It was shown that N235 has high selectivity and extraction ability for rhenium by anion exchange in acidic solution containing rhenium [Wu et al., 2021]. However, rhenium, tungsten and molybdenum belonged to alkali-fused metals, can be selectively melted to a slag through roasting under alkaline system, and the slag was leached with water to obtain an alkaline leachate containing rhenium, molybdenum and tungsten. While in alkaline condition, rhenium exists in the leachate only in the form of ReO4- and molybdenum exists in the form of MoO42-. Because of the simple forms of rhenium, molybdenum and tungsten in alkaline solution, it is more advantageous to separate rhenium, molybdenum and tungsten [Wang & Chen, 2001].
A mixture of TBP and triotylamine (TOA) as extractant was used in alkaline solution to sperate rhenium from molybdenum, where the complete separation of rhenium from molybdenum was possible if repeated extraction and stripping were conducted [Cao et al., 2009]. The results showed that the mixture of TOA (20 %) and TBP (30 %) diluted in kerosene was an efficient selective extract system, where molybdenum extraction efficiency was 1.7 %, rhenium extraction efficiency was 96.8 %, and the separation coefficient Re/Mo was 1.7 × 10³, at conditions of initial pH of 9.0 for the feed solution, room temperature and O/A ratio of 1:1. In addition, for the stripping process of rhenium into aqueous phase, the rhenium stripping could reach to 99.3 % under conditions of phase ratio of 1:1 (O/A) for 10 min at 40 °C when 18 % (v/v) of ammonia liquor was applied. The separation of rhenium, tungsten and molybdenum in alkaline systems is rarely studied. Quaternary ammonium salt methyl trioctylammonium chloride (N263) is a strong alkali extraction agent, which can be used to extract rhenium from both acidic and alkaline solutions, and the separation effect of rhenium and molybdenum in alkaline solution is better than that in acidic solution [Ritcey & Ashbrook, 1979].
In this research, the orthogonal experiment method was used to reveal the effect of system factors on rhenium extraction and rhenium molybdenum separation coefficient in alkaline alloy solution. Through software analysis, the data model was established and the response optimizer data was obtained. The significance of this study is to provide law understanding for the study on the separation of tungsten and molybdenum from rhenium by N263 extraction system, to predict the confidence interval of the main influencing factors through data model, and to provide guidance for resource conservation with less time and effort.
2 Materials and methods
2.1 Reagent and material
Extractant N263 (Fig. 1) and diluent kerosene were provided by Zhengmao Industries Inc. The other inorganic chemicals used were of analytical grade. The alkaline alloy solution used in the study was obtained by water leaching of the alkali fusion slag. The alkali fusion slag was obtained by the following treatment: taking the superalloy waste and alkali flux (w(NaOH): w(Na2CO3) = 3:2), mixing the material evenly according to the mass ratio of 1:4, and calcination at 900 °C for 1.0 h to obtain the alkali fusion slag. The alkali fusion slag was leached with high purity water in a mass ratio of 1:4 at 80 °C for 1.5 h. And the alkaline alloy leachate (Table 1) used to extract rhenium was obtained by solid–liquid separation. The alkaline alloy solution contains 1.49 g/L W, 430 mg/L Mo, 430 mg/L Re and 1.85 g/L Al with 1 mol/L OH–. It also contains small amounts of Nb, Hf, Ta, Co and Ni.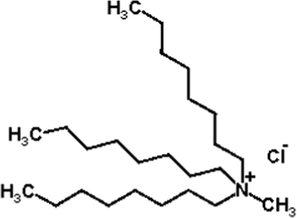
N263 chemical structural formula.
Element
W
Mo
Re
Cr
Al
Nb
Hf
Ta
Co
Ni
Concentration /mgL-1
1490.0
430.0
430.0
84.7
1850.0
less than0.1
less than0.1
3.0
less than0.1
less than0.1
2.2 Experimental methods
2.2.1 Solvent extraction
Both extraction and stripping experiments were carried out in pear shaped funnel with SXL-70 oscillator at 298 ± 2 K.
The metal concentration in the organic phase was calculated according to the metal concentration and volume change of the aqueous phase before and after the reaction. The metal (Re or Mo) extraction E (%) are calculated according to Eq.1.
Where C and V represent the concentration and volume in the phase. The subscripts F and R represent the feed solution and raffinate solution.
The distribution coefficient
is calculated according to Eq.2.
Where Corg represents the metal concentration in organic phase, Corg represents the metal concentration in aqueous phase, Vorg represents the volume of organic phase, and Vaqs represents the initial feed volume of aqueous phase.
Separation factor
is calculated according to Eq.3.
Where DRe represents the distribution coefficient of Re, DMo represents distribution coefficient of Mo metal.
2.2.2 Mechanism of N263 extracting Re
The ionic forms of rhenium and molybdenum in solution are shown in Fig. 2 drawed with software named Make Equilibrium Diagrams Using Sophisticated Algorithms (MEDUSA) (Trial version, KTH, Sweden).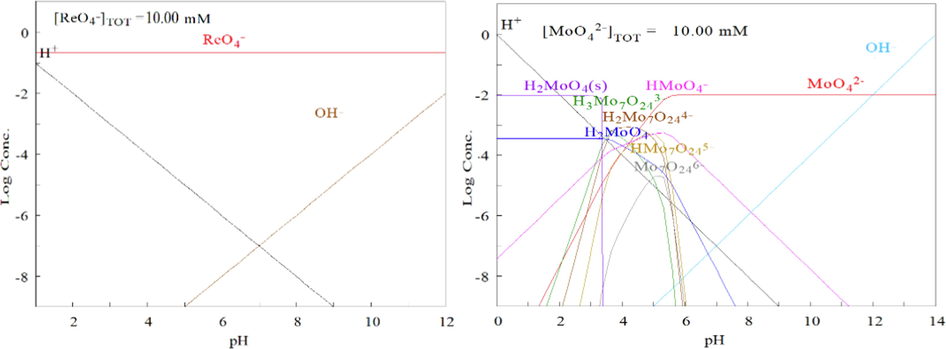
Re and Mo ion species in different pH rage.
The alkaline alloy leachate contains about 1.0 mol/L OH– concentration, belonging to the alkaline environment. Based on the data in Fig. 2, it can be inferred that Re and Mo exist in the main forms of ReO4- and MoO42- in the alkaline alloy leachate.
The mechanisms of N263 extraction Re are shown as Eq. (4).
Where R3CH3NCl(org) denotes the N263.
3 Results and discuss
The effects of factors, such as concentration of N263, concentration of sec-octyl alcohols, extraction time and O/A ratio, on rhenium extraction and separation of rhenium from molybdenum were investigated. Orthogonal experiments showed in Table 2 were designed according to four factor two levels and four central points of Box-Behnken experimental design with Minitab 17 Statistical Software (Trial version, Techmax, USA).
Stdand Order
N263 /%
Sec-octyl alcohols /%
Time /min
O/A ratio
Re extraction /%
Re/Mo
1
0
0
1
0.1
0
0
2
10
0
1
0.1
99.3
1175.3
3
0
10
1
0.1
0
0
4
10
10
1
0.1
99.3
965.6
5
0
0
10
0.1
2.4
1.1
6
10
0
10
0.1
99.3
1200.2
7
0
10
10
0.1
0
0
8
10
10
10
0.1
99.1
758.4
9
0
0
1
4
2.4
1.10
10
10
0
1
4
99.6
263.4
11
0
10
1
4
0
0
12
10
10
1
4
99.5
199.6
13
0
0
10
4
0
0
14
10
0
10
4
99.5
210.1
15
0
10
10
4
2.4
1.10
16
10
10
10
4
99.5
211.1
17
5
5
5.5
2.05
99.5
307.8
18
5
5
5.5
2.05
99.6
302.0
19
5
5
5.5
2.05
99.5
337.0
20
5
5
5.5
2.05
99.6
339.6
According to the experimental conditions in Table 2, the extraction test was carried out, and the rhenium extraction and rhenium molybdenum separation coefficient corresponding to each group of experiments were calculated. The experimental results are shown in Table 2.
Using Minitab 17 software (Trial version, Techmax, USA) to use each underlying analysis data (Table 2) as the basis, the correlation parameters between rhenium extraction are found, and the non-primary impact factor is further removed to determine the key parameters of the final modeling. Finally, a set of prediction models suitable for rhenium extraction is established, in order to be able to timely, accurately and efficiently guide the production of molybdenum for rhenium extraction and separation.
To determine whether the association between the response and each factor in the model is statistically significant, compare the P-value (Probability value), an important evidence used to judge whether the original hypothesis is correct.), to the significance level expressed in α or alpha. The p-value is not the probability that the null hypothesis is true given the sample result, but the probability that the sample result will occur given that the null hypothesis is true. Typically, significance test was performed at the level of significance α = 0.05. With a result of P-value ≤ α, it can be concluded that the association between the response variable and the factor is statistically significant. Meanwhile, with a result of a p-value > α, it is indicated that the association is not statistically significant. Therefore, a model should be refigured without the factor. If multiple predictors do not have a statistically significant correlation with the response, it can be simplified the model by deleting the terms one at a time.
3.1 Re extraction
3.1.1 Analysis of variance for Re extraction
Variance analysis of rhenium extraction corresponding to orthogonal test group was conducted. The series data obtained were shown in Table 3.
Source
DF
Adj SS
Adj MS
F-Value
P-Value
Model
5
46627.3
9325.5
13916.4
0
Linear
4
38813.7
9703.4
14480.5
0
[N263]
1
38812.3
38812.3
57919.8
0
[sec-octyl alcohols]
1
0.4
0.4
0.6
0.45
Extraction time
1
0.3
0.3
0.4
0.53
O/A ratio
1
0.7
0.7
1.1
0.32
Curvature
1
7813.6
7813.6
11660.2
0
Error
14
9.4
0.7
Lack-of-Fit
11
9.4
0.9
1785.4
0
Pure Error
3
0
0
Total
19
46636.7
As shown in Table 3, P-value of N263 concentration, sec-octyl alcohols concentration, extraction time and O/A ratio are 0, 0.45, 0.53 and 0.32, respectively. Only P-value of N263 concentration is less than 0.05, which indicates that the main factor affecting rhenium extraction is the concentration of N263. As can be seen in Pareto chart of the standardized effect (Fig. 3), the standardized effect value bar of N263 concentration crosses the reference line that is at 2.10, which is proved that the factor is statistically significant.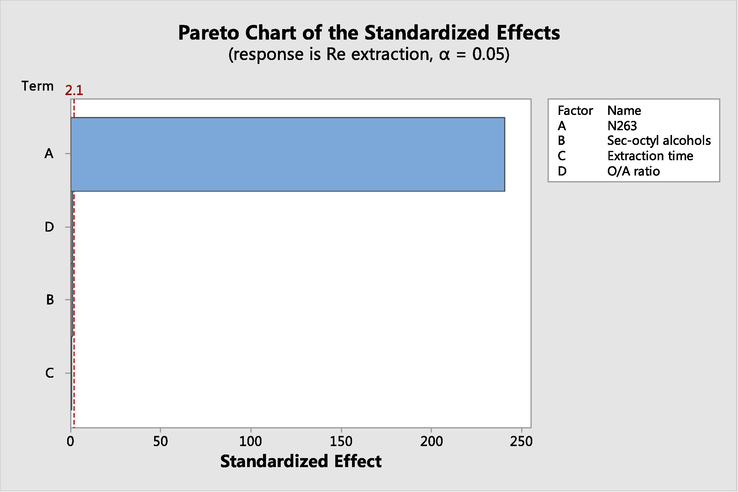
Pareto chart of the standardized effect for Re extraction.
3.1.2 Model summary and coded coefficients for Re extraction
Since the correlation between rhenium extraction and N263 concentration is basically linear (Table 4) and the correlation is good (Table 4), a linear equation is used to build a prediction model. The higher the deviation R-sq value, the better the fit of the model to the data. The R-sq values in Table 5 are as high as 99.98 %, indicating that the model and data fit well.
S
R-sq
R-sq(adj)
R-sq(pred)
0.82
99.98 %
99.97 %
99.96 %
Term
Effect
Coef
SE Coef
T-Value
P-Value
VIF
Constant
50.145
0.205
245.03
0
[N263]
98.504
49.252
0.205
240.67
0
1
[sec-octyl alcohols ]
−0.316
−0.158
0.205
−0.77
0.45
1
Extraction time
0.266
0.133
0.205
0.65
0.53
1
O/A ratio
0.427
0.213
0.205
1.04
0.32
1
Ct Pt
49.414
0.458
107.98
0
1
The Coded coefficients for Re extraction (Table 5) was obtained using Minitab data processing software. It can be used to determine which factors have statistically significant effects on the response.
As shown in Table 5, P values of N263 concentration, sec-octyl alcohols concentration, extraction time and O/A ratio are 0, 0.45, 0.53 and 0.32, respectively. Comparing these four sets of data with the significance level value of 0.05, it is found that only N263 concentration corresponds to a P value less than 0.05. With a result of P-value ≤ α, it can be concluded that the association between the response variable and the factor is statistically significant. It was inferred that N263 concentration-associated rhenium extraction were statistically significant. Contrarily, sec-octyl alcohols concentration, extraction time and O/A ratio are not statistically significant. These three insignificant factors can be removed during optimization and modeled.
3.1.3 Rhenium extraction model
In the process of regression analysis and experimental design analysis, the regression model needs to be analyzed by “residual analysis” (Fig. 4). Here is a study of how to increase the rhenium extraction in superalloy alkali. Now 20 batches of data have been collected from Table 3 to try to establish a regression model of rhenium extraction and various factors.
Four-in-one plot of salvage values for Re extraction.
The normal probability plot of the residuals in Fig. 4 is a straight line, which verifies the hypothesis that the residuals are normally distributed. The model is more realistic, that is, the regression model fit accuracy is relatively high. Regression models of rhenium extraction and individual factors are as follows:
Where [N263] is in a range of 0–10.
3.2 Re/Mo separation
3.2.1 Analysis of variance for Re/Mo separation
Variance analysis of Re/Mo separation corresponding to orthogonal test group was conducted. The series data obtained were shown in Table 6.
Source
DF
Adj SS
Adj MS
F-Value
P-Value
Model
6
2,928,013
488,002
136.99
0
Linear
3
2,227,886
742,629
208.47
0
[N263]
1
1,550,204
1,550,204
435.17
0
[sec-octyl alcohols]
1
31,987
31,987
8.98
0.01
O/A ratio
1
645,695
645,695
181.26
0
2-Way Interactions
3
700,126
233,375
65.51
0
[N263]*[sec-octyl alcohols]
1
31,791
31,791
8.92
0.01
[N263]*O/A ratio
1
646,578
646,578
181.51
0
[sec-octyl alcohols]*O/A ratio
1
21,758
21,758
6.11
0.03
Error
13
46,310
3562
Curvature
1
316
316
0.08
0.78
Lack-of-Fit
9
44,860
4984
13.19
0.03
Pure Error
3
1134
378
Total
19
2,974,322
As shown in Table 6, P-value of N263 concentration, sec-octyl alcohols concentration and O/A ratio are 0, 0.01 and 0, respectively. The three P-values of N263 concentration, sec-octyl alcohols and O/A ratio are all less than 0.05, which indicates that the three single factors affect Re/Mo separation. Meanwhile, P-values of the 2-way interactions for [N263]*[sec-octyl alcohols], [N263]*O/A ratio and [sec-octyl alcohols]*O/A ratio are 0.01, 0 and 0.03. The three P-values are also all less than 0.05, which indicates the interaction of N263 concentration, sec-octyl alcohols concentration and O/A ratio on the Re/Mo separation. As can be seen in pareto chart of the standardized effect (Fig. 5), the standardized effect values bars of [N263], O/A ratio and [N263]*O/A ratio, cross the reference line that is at 2.16, which is proved that the three factors are statistically significant.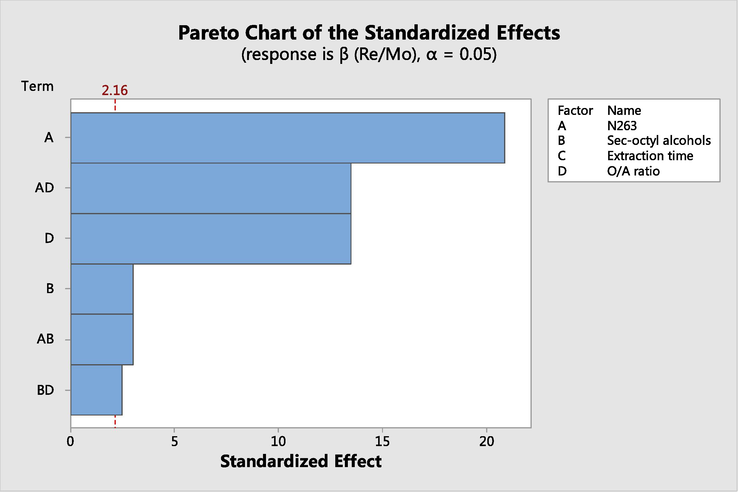
Pareto chart of the standardized effect for Re/Mo separation.
3.2.2 Model summary for Re/Mo separation
The higher the deviation R-sq value, the better the fit of the model to the data. The R-sq values in Table 7 are as high as 98.44 %, indicating that the model and data fit well.
S
R-sq
R-sq(adj)
R-sq(pred)
59.68
98.44 %
97.72 %
95.38 %
3.2.3 Coded coefficients for Re/Mo
The coded coefficients table (Table 8) was obtained to determine which factors have statistically significant effects on the response.
Term
Effect
Coef
SE Coef
T-Value
P-Value
VIF
Constant
313.7
13.3
23.5
0
[N263]
622.5
311.3
14.9
20.86
0
1
[sec-octyl alcohols]
−89.4
−44.7
14.9
−3
0.01
1
O/A ratio
−401.8
−200.9
14.9
−13.46
0
1
[N263]*[sec-octyl alcohols]
−89.1
−44.6
14.9
−2.99
0.01
1
[N263]*(O/A ratio)
−402.1
−201
14.9
−13.47
0
1
[sec-octyl alcohols]*(O/A ratio)
73.8
36.9
14.9
2.47
0.03
1
As shown in Table 8, P values of N263 concentration, sec-octyl alcohols concentration, and O/A ratio, are 0, 0.01 and 0, respectively. P values of the three are all less than 0.05. It was indicated that N263 concentration, sec-octyl alcohols concentration, and O/A ratio were statistically significant. Other insignificant factors can be removed during optimization and modeled.
In the process of regression analysis and experimental design analysis, the regression model needs to be analyzed by “residual analysis” (Fig. 6). Here is a study of how to increase the rhenium extraction in superalloy alkali. Now 20 batches of data have been collected from Table 3 to try to establish a regression model of rhenium extraction and various factors.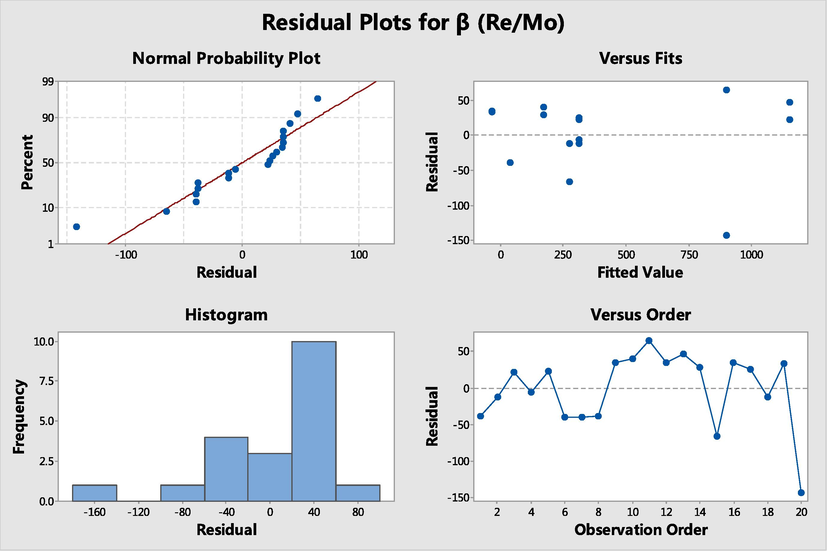
Four-in-one plot of salvage values for Re/Mo separation.
The normal probability plot of the residuals in Fig. 6 is a straight line, which verifies the hypothesis that the residuals are normally distributed. The regression model is more realistic, and its fit accuracy is relatively high. The regression models of rhenium extraction and individual factors are as follows:
Where [N263] is in a range of 0–10, %; O/A ratio is in a range of 0.1–4.
3.3 Re extraction of equilibrium isotherms
In order to achieve optimal extraction efficiency and resource efficiency, the effects of phase ratio (O/A) on Re extraction, Mo extraction and Re/Mo separation were researched. The results are shown in Fig. 7.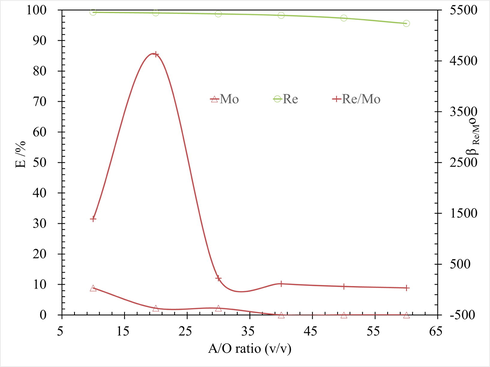
Effect of O/A ratio on Re extraction, at conditions of Re 430 mg/L, 10 % N263 + 10 % sec-octyl alcohols concentration, T 298.15 ± 2 K for 3 mins.
McCabe-Thiele equilibrium isotherms of N263 organic phase were drawn in Fig. 8, according to the experimental results of O/A comparison conditions. As shown in Fig. 8, when O/A works at 1/30, a theoretical extraction stage of 1 is required to obtain the Re extraction more than 99 %.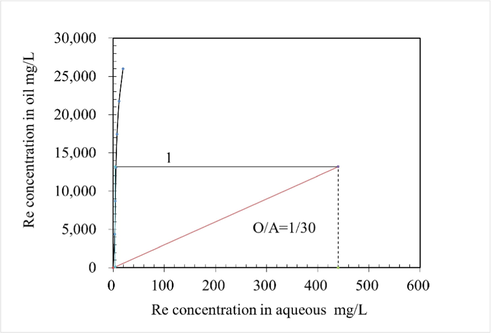
McCabe-Thiele Re extraction equilibrium isotherms, at conditions of Re 422 mg/L, 10 % N263 + 10 % sec-octyl alcohols concentration, T 298.15 ± 2 K for 3 mins.
3.4 Effect of the stripping reagent type on the Re stripping
The effects of stripping agent type such as NaSCN solution (0.5 mol/L), HClO4 solution (0.5 mol/L) and HNO3 solution (0.5 mol/L) on Re stripping efficiency were researched, where water stripping as a blank control. The results are shown in Fig. 9a. According to the results in Fig. 9a, the Re stripping of NaSCN solution (0.5 mol/L), HClO4 solution (0.5 mol/L), HNO3 solution (0.5 mol/L) and H2O are 25.1 %, 50.1 %, 0.9 % and 0.01 %, respectively. The Re stripping of perchloric acid solution is the best, but its strong oxidant has a breaking effect on the organic phase, and the organic phase changes from yellow to reddish-brown after the experiment (Fig. 9b). Nitric acid solutions also have this negative effect. The corresponding rhenium extraction rate of NaSCN solution is 25.1 %, but the damage to the organic phase is low.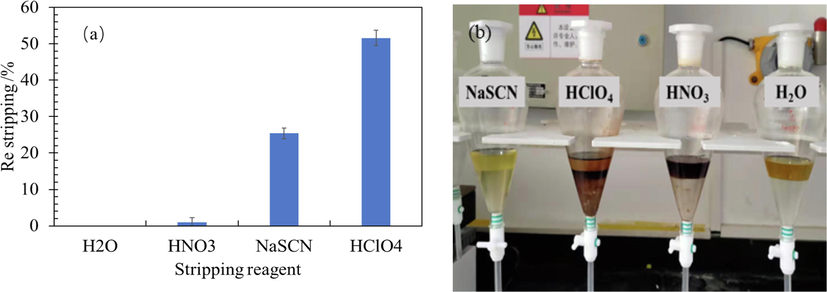
The effects of stripping agent type on Re stripping and its phenomenon.
Infrared spectrum analysis was carried out on samples of unloaded organic, Re loaded organic, and Re loaded organics stripped with NaSCN, HClO4 and HNO3 solution. The spectral diagram is shown in Fig. 10. The only difference between the spectra of unload organic and Re loaded organic is that there is an olefin substitution absorption peak at wave number 910.22 cm−1 in the spectra of Re loaded organic phase, while no such absorption peak in the spectra of unloaded organic phase, which is mainly caused by the substitution of ReO4- for Cl- ion in the carbon chain of N263. At peak of 910.22 cm−1, the corresponding absorbance of organic phase infrared spectrum decreases gradually after stripped with HNO3, NaSCN and HClO4 solutions. Combined with the gradual increase of Re stripping in Fig. 9a, it is indicated that the reduced absorbance here is caused by the stripping of ReO4-. In their spectra of all samples, there are absorption peaks at 2954.34 cm−1, 2922.24 cm−1, 2854.48 cm−1, 1458.89 cm−1, 1376.44 cm−1 and 725.13 cm−1. The peaks of 2954.34 cm−1 and 2922.24 cm−1 are alkane antisymmetric stretching vibration; the peak of 2854.48 cm−1 is CH symmetric stretching vibration; the peak of 1458.89 cm-1and 1376.44 cm−1 are bending and stretching vibrations of CH; the peak of 725.13 cm−1 is NH bending vibration, which is the characteristic peak of the N263 functional group.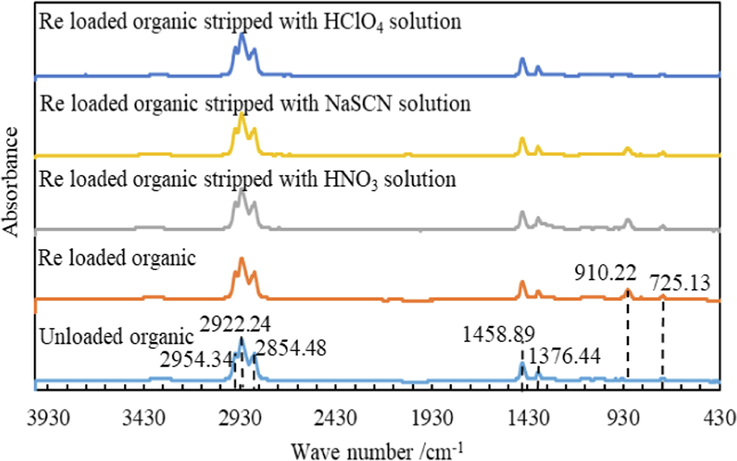
FTIR Spectra of different organics.
Organic phase composition: 10 %N263 + 10 %sec-octyl alcohols + 80 % kerosene;NaSCN, HClO4 and HNO3 concentrations are all 0.5 mol/L.
3.5 Effect of the NaSCN concentration on the Re stripping
An organic loaded Re 11.9 g/L, was used the feed of stripping experiment. Here, different NaSCN solution was used as the stripping reagent. The effect of NaSCN concentration on Re stripping was carried out, and the results were shown in Fig. 11.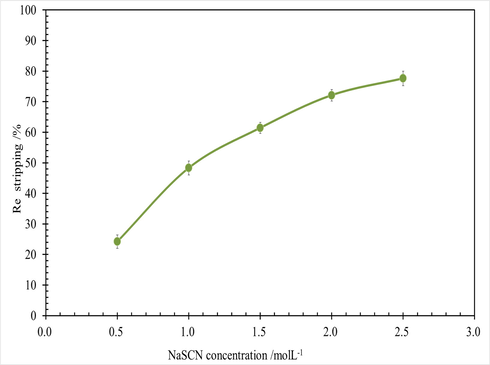
Effect of NaSCN concentration on Re stripping, at conditions of Re 11.9 g/L in organic phase, O/A 1/1, T 298.15 ± 2 K, 250 rpm for 3 mins.
As shown in Fig. 11, Re stripping was increased with the NaSCN concentration increasing. when initial NaSCN concentration was 0.5 mol/L 7.8 times the theoretical amount 0.064 mol/L, Re stripping was only 25.1 %. When initial NaSCN concentration was 2.5 mol/L 39 times the theoretical amount 0.064 mol/L, Re stripping was only 75.8 %. It was indicated that it is necessary to consume a large amount of excess sodium thiocyanate to complete rhenium stripping from N263 rhenium phase, and the Re stripping efficiency is low. This is due to the nucleophilic substitution reaction between sodium thiocyanate and halogenated amine N263, and then cyclization to obtain aminothiazoline derivatives.
According to the above research contents, it is found that N263 has good selective extraction performance for rhenium in alkaline solution, but the stripping treatment of N263 phase loaded rhenium is not ideal, and the commonly used stripping agents, such as NaSCN, HClO4 and HNO3, have different degrees of damage to the organic phase with extraction agent N263, which is not conducive to the stripping of rhenium.
3.6 Conclusion
By studying orthogonal experiments and factor condition experiments, the conclusions were as followed:
(1) The regression equation of rhenium extraction was Re extraction/% = 0.672 + 9.880 [N263]. Meanwhile, the regression equation of rhenium molybdenum separation coefficient is Re/Mo = 37.5 + 116.88* [N263] −24.3 *(O/A ratio) −20.62 [N263]*(O/A ratio).
(2) when O/A works at 1/30, a theoretical extraction stage of 1 is required to obtain the Re extraction more than 99 %.
(3) N263 has good selective extraction performance for rhenium in alkaline solution, but the stripping treatment of N263 phase loaded rhenium is not ideal, and the commonly used stripping agents, such as NaSCN, HClO4 and HNO3, have different degrees of damage to the organic phase with extraction agent N263, which is not conducive to the stripping of rhenium.
CRediT authorship contribution statement
Aifei Yi: Writing – original draft, Writing – review & editing, Investigation, Methodology, Conceptualization. Honglin Jiang: Writing – review & editing, Data curation.
Acknowledgments
This research was supported by GRINM Group Corporation Limited Youth Fund (NO. G12620213129037), and National Natural Science Foundation of China Youth Science Foundation Project (NO.51904271).
Declaration of Competing Interest
The authors declare that they have no known competing financial interests or personal relationships that could have appeared to influence the work reported in this paper.
References
- Solvent extraction of rhenium from molybdenum in alkaline solution. Hydrometallurgy. 2009;97:153-157.
- [CrossRef] [Google Scholar]
- Selective recovery of rhenium from molybdenite flue-dust leach liquor using solvent extraction with TBP. Sep. Purif. Technol.. 2018;191:116-121.
- [CrossRef] [Google Scholar]
- Recycling of rhenium-containing wirescrap. Int. J. Refract. Met. Hard. Mater.. 2015;50:79-85.
- [CrossRef] [Google Scholar]
- Efficient photochemical recovery of rhenium from aqueous solutions. Sep. Purif. Technol.. 2015;156:242-248.
- [CrossRef] [Google Scholar]
- An over view of rhenium effect in single crystal superalloys. Rare Met. Nonferrous Metals Soc. China. 2016;35(2):127-139.
- [CrossRef] [Google Scholar]
- Recovery of ReO4- by weakly basic anion exchangers: modeling of sorption equilibrium and rate. Sep. Purif. Technol.. 2015;153:19-28.
- [CrossRef] [Google Scholar]
- Leaching kinetics, separation, and recovery of rhenium and component metals from CMSX-4 superalloys using hydrometallurgical processes. Sep. Purif. Technol.. 2019;212:150-160.
- [CrossRef] [Google Scholar]
- Ritcey G.M., Ashbrook A.W., 1979. Solvent Extraction principles and Applications to Process Metallurgy. Amsterdam, New York.
- Constant-load tertiary creep in nickel-base single crystal superalloys. Mater. Sci. Eng. A. 2006;432:129-141.
- [CrossRef] [Google Scholar]
- Novel aqueous processing of the reverted turbine-blade superalloy for rhenium recovery. Ind. Eng. Chem. Res.. 2016;55(29):8191-8199.
- [CrossRef] [Google Scholar]
- Diluent effects in the solvent extraction of rhenium (VII) with amine extractants in [Tf2N]- based ionic liquids: experimental and COSMO-RS analysis. J. Mol. Liq.. 2021;346:113091
- [CrossRef] [Google Scholar]
- Ion exchange recovery of rhenium from industrially relevant sulfate solutions: single column separations and modeling. Hydrometallurgy. 2015;158:74-82.
- [CrossRef] [Google Scholar]
- Wang J.D., Chen J.Y., 2001. Solvent Extraction Brochure. Beijing.
- Recovery of nickel and molybdate from ammoniacal leach liquor of spent hydrodesulfurization catalyst using LIX84 extraction. Sep. Purif. Technol.. 2021;269:188750
- [CrossRef] [Google Scholar]
- Kinetics and mechanism of Re(VII) extraction with mixtures of tri-alkylamine and tri-n-butylphosphate. Hydrometallurgy. 2010;100:110-115.
- [CrossRef] [Google Scholar]
- A new approach for rhenium (VII) recovery by using modified brown algae Laminaria japonica adsorbent. Bioresour. Technol.. 2013;127:464-472.
- [CrossRef] [Google Scholar]
- Adsorption-controlled preparation of anionic imprinted amino-functionalization chitosan for recognizing rhenium (VII) Sep. Purif. Technol.. 2017;177:142-151.
- [CrossRef] [Google Scholar]
- Recovery of rhenium from copper leach solutions using ion exchange with weak base resins. Hydrometallurgy. 2017;173:50-56.
- [CrossRef] [Google Scholar]


