

Translate this page into:
Role of cationic moiety in phosphate fertilizers’ molecules on their solution behavior in terms of volumetric and acoustic parameters at different temperatures and atmospheric pressure
⁎Corresponding author. bnbsk@yahoo.co.uk (Bushra Naseem)
-
Received: ,
Accepted: ,
This article was originally published by Elsevier and was migrated to Scientific Scholar after the change of Publisher.
Peer review under responsibility of King Saud University.
Abstract
Ultrasonic parameters are very useful tools used to study the physic-chemical behavior and molecular interactions of various liquid mixtures. More than 50% problems of irrigated areas are associated with cultivated land and they frequently occur due to salinity. Application of fertilizers into agricultural land could be a remedy for soil salinity by providing essential nutrients to plants. In this research paper, ultrasonic and volumetric properties of phosphate based fertilizers of different molecular compositions at different temperatures have been studied. This is experimental based work; this knowledge can be employed in formulation of fertilizers according to the nature of their application which could enhance fertilizer’s activity either in terms of nutrients development or to control the salinity of soil. Results obtained from calculated ultrasonic and volumetric parameters indicated presence of strong interactions in aqueous fertilizer solutions which depends upon nature of molecules. Among presently studied phosphate fertilizers i.e. triple superphosphate, nitrophosphate and diammonium phosphate, maximum molecular interactions were observed in aqueous triple super phosphate solutions due to the presence of highly charged cationic specie i.e. calcium ions, which can also be used to control the salinity of soil using electrostatic interactions among saline salts and charged cationic species.
Keywords
Phosphate fertilizers
Ultrasonic parameters
Partial molar expansibility
Compressibility factor
Hydration number

1 Introduction
During recent years, the acoustic studies have found extensive applications in characterizing the aspects of physicochemical behavior and to predict the solute–solute, solute–solvent and ion–solvent interactions in aqueous, non-aqueous and mixed solutions. The various parameters derived from measurements of speed of sound are known to give valuable information regarding different types of intermolecular interactions existing in solutions. Also spectral techniques like UV–Visible may be productive in order to explore our knowledge regarding solution behavior and presence of various molecular interactions among different components of mixture.
Fertilizers are mainly used in agricultural land to supply the micro and macro nutrients for crop production, to provide better plant nutrition and to increase the fertility of saline soil (Nunes et al., 2014). Numerous factors are involved in plant response to fertilizers under saline, sodic, or waterlogged conditions so a suitable fertilizer should be used for this purpose. Efficiencies of fertilizers applied to salt – affected soils are lower than when applied to non-saline soils. A decrease in the ability of the plants to absorb K or NH4 usually takes place in saline soils containing excess Na, Mg, or Ca. Also, P absorption may be decreased in presence of excess Cl− or SO4−. Application of K, NH4 or P fertilizers not only corrects their deficiencies but also decreases the adverse effects of Na, Cl, or SO4− on the plants (Naseem and Arif, 2017).
Phosphorus being a macro nutrient is a multivalent element in periodic table with non-metallic characteristics significant for a living system. Phosphorus is found to be an essential element in growth of plants and it plays an important role in physiological functions related to energy transformations (Chien et al., 2011). Application of phosphate (P) to plants in the form of synthetic fertilizers has become very common practice in agro ecosystem (Nunes et al., 2014; Gupta et al., 2014; Cao et al., 2003).
When applied to soil, several types of interactions occur among ions of fertilizer molecules and water. These types of interactions need a thorough investigation, the basis of solute–solute interactions among functional groups of macro molecules may arise from any specific interactions which include dipole-diploe, dipole induced dipole, ion–dipole, hydrogen bonding and charge transfer interactions. It is desirable to employ simple, low cost and rapid techniques such as ultrasonic method to study the miscibility of macromolecular blends. Studies on various types of intermolecular interactions existing among phosphate fertilizers and water molecules in solution using data of thermo physical properties like density and sound velocity of aqueous phosphate fertilizers solutions may provide useful information about the efficiency of different phosphate fertilizers. This knowledge could be helpful in understanding the role of fertilizers to control soil salinity.
A detailed literature survey indicated that the role of fertilizers or pesticides for reducing the toxic effects of heavy metals present in soil and also their role for increasing the crop yield is being studied for many years. Further experiments have been performed for the identification and quantification of specific forms of organic phosphorus in organic fertilizers and soils (Campos, 2002; Thawornchaisit and Polprasert, 2009; Annaheim et al., 2015). Recently, role of a phosphate fertilizer in order to remove or to reduce soil salinity has also been investigated in terms of intermolecular interactions prevailing among fertilizer molecule and saline salts usually present in saline soil (Naseem and Arif, 2017), there is a severe lack of study on interaction of phosphate fertilizers in aqueous solutions.
Therefore, present study is aimed to explore the comparative efficiency of different phosphate fertilizers like triple super phosphate, di ammonium phosphate and nitro phosphate for improving the crop production in terms of intermolecular interactions present in their solutions. Knowledge about thermo physical properties provides an insight into molecular interactions in solutions and effect of different parameters on interactions which could be helpful for choosing a suitable fertilizer for a specific soil under ambient conditions of temperature and pressure. In present study three phosphate fertilizers i.e. di ammonium phosphate (DAP), triple super phosphate (TSP) and nitro phosphate have been used. Chemical structure of three phosphate fertilizers is shown in Fig. 1.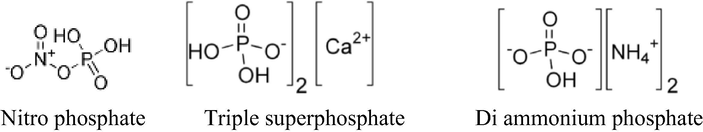
Chemical structures of phosphate fertilizers.
Volumetric and acoustic parameters of solutions are governed by variation in density and sound velocity passing through solutions. Volumetric properties e.g. apparent and partial molar volume, Hepler’s constant, thermal expansion coefficient and so on, while acoustical properties such as compression factor, hydration number, acoustic impedance and relative association etc. are indicative of intermolecular interactions present in solutions (Sadeghi and Goodarzi, 2008; Omota et al., 2009).
2 Materials and methods
2.1 Materials
Fertilizers (triple superphosphate, di ammonium phosphate and nitro phosphate) used were Sigma Aldrich products. In order to minimize the experimental or purity errors, glassware used in the experiment was washed with de-ionized water and then dried in oven. In present study for preparation of solutions de-ionized water having conductivity of 1.5 × 10⁻⁴ Ω−1 m−1 was used.
2.2 Methods
Instrument used in present study is Anton paar density and sound velocity analyzer (DSA 5000 M) and is very accurate and precise. Density (ρ) and ultrasonic velocity (u) of phosphate fertilizer’s solutions in water was measured at different temperatures with single sample solution. Oscillation frequency of U-shaped tube in instrument determines the density of sample and propagation time technique is used for measuring speed of sound waves passing through the sample being injected into the instrument. Fundamental frequency of instrument for sound velocity measurement is 3 MHz. Thus, the sound velocity is obtained by dividing the known distance between transmitter and receiver by the measured propagation time of the sound waves up to 0.5 m s−1 accuracy and 0.1 ms−1 repeatability. The accuracy and repeatability of DSA 5000 M for density are 5 × 10⁻⁶ gcm−3 and 5 × 10⁻⁶ gcm−3 respectively. Accuracy in Temperature is ±0.01 K (Rajagopal and Edwin Gladson, 2011). The weighing of chemicals was done by Wiggen Hauser electronic balance (model no. WH180-4) with a precision of ±0.0001 g. The measured densities and ultrasound speeds were utilized in determining volumetric and acoustical properties of solutions. The standard uncertainties in molality (m), density (ρ), sound velocity (u), and temperature (T) and pressure (P) are ±0.000090 mol·kg−1, ±0.66 × 10⁻⁶ g·cm−3, ±0.029 m·s−1, ±10−2 K and ±5 kPa respectively
Phosphate fertilizer’s solutions of various concentrations (for TSP 0.0042–0.0384 mol·kg−1, for DAP 0.0075–0.09 mol·kg−1 and for nitro phosphate 0.0069–0.089 mol·kg−1) were prepared in water and then density and speed of sound passing through these solutions were measured using a temperature range of 293.15–313.15 K.
3 Results and discussion
3.1 Density and sound velocity measurements of phosphate fertilizers solutions
Measured data of density and ultrasonic speed of water and aqueous solutions of phosphate fertilizers with different fertilizer concentrations at different temperatures has been given in Table 1, Comparison of measured density and ultrasonic speed data for water with literature reported data showed that measured data is in accordance with data reported in literature (Omota et al., 2009; Rajagopal and Edwin Gladson, 2011; Kapadi et al., 1997; Chauhan and Kumar, 2014). The standard uncertainties in molality (m), density (ρ), sound velocity (u), and temperature (T) and pressure (P) are ±0.0009 mol·kg−1, ±0.66 × 10⁻⁶ g·cm−3, ±0.029 m·s−1, ±10−2 K and ±5 kPa respectively. Expanded uncertainties (k = 2) in density and sound velocity are ±1.32 × 10⁻⁶ g·cm−3 and ±0.058 m·s−1 respectively
m/mol·kg−1
ρ/g·cm−3
293.15 K
298.15 K
303.15 K
308.15 K
313.15 K
Water
0.998202
0.997025
0.995748
0.994258
0.992567
Triple super phosphate
0.0042
0.998627
0.997448
0.996167
0.994671
0.992977
0.0128
0.999487
0.998301
0.997009
0.995512
0.993806
0.0213
1.000317
0.999121
0.997813
0.996311
0.994607
0.0299
1.001137
0.999931
0.998616
0.997111
0.995396
0.0384
1.001927
1.000711
0.999414
0.997881
0.996147
Nitro phosphate
0.0069
0.999569
0.999278
0.997851
0.995741
0.994345
0.0209
0.999780
0.999481
0.998041
0.995921
0.994511
0.0419
1.000091
0.999735
0.998264
0.996132
0.994713
0.0629
1.000402
0.999956
0.998436
0.996301
0.994871
0.0839
1.000713
1.000109
0.998532
0.996378
0.994969
Di ammonium phosphate
0.0075
0.998921
0.997765
0.996364
0.994723
0.993247
0.0227
1.000356
0.999186
0.997763
0.996059
0.994576
0.0450
1.002445
1.001262
0.999802
0.998005
0.996501
0.0680
1.004557
1.003357
1.001885
0.999996
0.998439
0.0900
1.006578
1.005345
1.003857
1.001832
1.000294
u/m·s−1
Water
1482.63
1497.06
1509.57
1519.15
1529.63
Triple super phosphate
0.0042
1503.32
1513.45
1524.56
1536.76
1552.91
0.0128
1509.08
1519.21
1530.32
1542.52
1558.67
0.0213
1514.84
1524.97
1536.08
1548.28
1564.43
0.0299
1520.60
1530.73
1541.84
1554.04
1570.19
0.0384
1526.36
1536.49
1547.60
1559.80
1575.95
Nitro phosphate
0.0069
1487.63
1505.96
1515.23
1521.98
1533.88
0.0209
1494.08
1512.41
1521.68
1528.43
1540.33
0.0419
1500.53
1518.86
1528.13
1534.88
1546.78
0.0629
1506.98
1525.31
1534.58
1541.33
1553.23
0.0839
1513.43
1531.76
1541.03
1547.78
1559.68
Di ammonium phosphate
0.0075
1485.13
1496.71
1512.03
1521.36
1531.23
0.0227
1489.86
1500.72
1516.05
1525.47
1534.24
0.0450
1494.59
1504.73
1520.07
1529.58
1537.25
0.0680
1499.32
1508.74
1524.09
1533.69
1540.26
0.0900
1504.05
1512.75
1528.11
1537.80
1543.27
From data given in Table 1 it is obvious that with increasing concentration of fertilizer’s molecules in solutions, density of solutions also increases which could be due to enhanced molecular interactions between water and fertilizer molecules at higher concentrations while density decreases with rising temperature because at higher temperatures the kinetic energy of the molecules in solutions increases which dominates over binding energy among solution components and hence solution becomes less dense (Rajagopal and Edwin Gladson, 2011; Naseem et al., 2013). Data given in Table 1 shows that the sound velocity of aqueous fertilizer’s solutions increases with increasing concentration of fertilizer’s molecules in solutions due to increased associations between water and phosphate fertilizer’s molecules at higher concentrations of solutions. While at higher temperature, due to loose binding and enhanced degree of collisions in a solution results in an increase in sound velocity (Chauhan and Kumar, 2014).
3.2 Acoustic parameters
Ultrasonic or acoustic parameters like compressibility factor, hydration number and intermolecular length are useful tool to study the physicochemical behavior and molecular interactions of various liquid mixtures. Ion-ion and ion–solvent interactions play an important role in solution chemistry (Dhondge et al., 2017).
3.2.1 Apparent and partial molar isentropic compression
Apparent molar isentropic compression (Kϕ) is degree of compression of ions in solution. Kϕ can be calculated from following equation using measured data of density and ultrasonic velocity.
Calculated data of Kϕ for aqueous phosphate fertilizer’s solutions at different temperatures have been given in Table 2. The standard uncertainties in molality (m), apparent molar isentropic compression (Kϕ), temperature (T) and pressure (P) are ±0.0009 mol·kg−1, ±0.02 × 10⁻⁴ cm3·mol−1·Pa−1, ±10−2 K and ±5 kPa respectively.
m/mol·kg−1
Kϕ × 10−4/cm3·mol−1·Pa−1
293.15 K
298.15 K
303.15 K
308.15 K
313.15 K
Triple super phosphate
0.0042
−4.99
−4.75
−4.73
−3.15
−2.88
0.0128
−3.75
−3.30
−3.24
−2.70
−2.06
0.0213
−3.51
−2.99
−2.95
−2.61
−1.87
0.0299
−3.39
−2.84
−2.80
−2.56
−1.78
0.0384
−3.32
−2.77
−2.72
−2.52
−1.74
Nitro phosphate
0.0069
−4.83
−4.65
−3.94
−3.53
−2.97
0.0209
−3.13
−3.01
−2.74
−2.59
−2.37
0.0419
−2.23
−2.13
−1.98
−1.90
−1.77
0.0629
−1.93
−1.83
−1.72
−1.66
−1.56
0.0839
−1.78
−1.68
−1.58
−1.53
−1.45
Di ammonium phosphate
0.0075
−4.65
−3.74
−3.42
−2.95
−2.24
0.0227
−3.19
−2.85
−2.69
−2.47
−2.18
0.0450
−2.48
−2.28
−2.18
−2.03
−1.85
0.0680
−2.21
−2.07
−1.98
−1.86
−1.71
0.0900
−2.10
−1.98
−1.90
−1.78
−1.66
Reported results in Table 2 show that with increasing temperature, Kϕ values of phosphate fertilizers in water increases. This can be due to the greater degree of thermal agitation among the solution components at higher temperature, resulting in release of more solvent molecules from solvation shell of fertilizer’s molecules into bulk which positively contribute to overall compression of solution. This is an indication of weaker solute–solvent interactions at higher temperature. Less compressible solutions of phosphate fertilizers in water at higher concentration of fertilizer’s molecules indicated the presence of stronger electrostatic intermolecular interactions in solutions (Dhondge et al., 2017).
Among these fertilizers (triple super phosphate, di ammonium phosphate and nitro phosphate) maximum values of Kϕ at respective temperatures have been observed for aqueous triple superphosphate solutions because of the formation of most compact structure of solute (TSP) molecules in solvent (water) due to presence of stronger intermolecular interactions (hydrogen bonding) among highly charged Ca2+ ions (from TSP) and negatively charged end of polar water molecules than prevailing in nitro phosphate and di ammonium phosphate solutions. Hence observed order of decreasing apparent molar isentropic compression is.
Kϕ (Triple superphosphate) > Kϕ (Nitrophosphate) > Kϕ (Diammonium phosphate)
Partial molar isentropic compression Koϕ can be calculated from plots between concentration and Kϕ of fertilizer solutions in water using following equation (George et al., 2002; Naseem et al., 2016).
Calculated data for Koϕ and Sk of fertilizers in water have been given in Table 3. The standard uncertainties in Partial molar compression (Kϕo), temperature (T) and pressure (P) are ±0.35 × 10⁻⁴ cm3·mol−1·Pa−1, ±10−2 K and ±5 kPa respectively.
Fertilizers
293.15 K
298.15 K
303.15 K
308.15 K
313.15 K
Koϕ/cm3·mol−1·Pa−1
Triple super phosphate
−0.0005
−0.0004
−0.0003
−0.0003
−0.0002
Nitrophosphate
−0.0004
−0.0004
−0.0004
−0.0004
−0.0004
Diammonium phosphate
−0.0003
−0.0003
−0.0002
−0.0002
−0.0001
Sk/kg·cm3·mol−2·Pa−1
Triple super phosphate
0.0018
0.0009
0.0004
0.0008
0.0005
Nitrophosphate
0.0003
0.0003
0.0002
0.0002
0.0002
Diammonium phosphate
0.0002
0.0002
0.0001
0.0001
0.0001
Obtained negative values of Koϕ for phosphate fertilizer’s solutions in water indicated the presence of strong solute -solvent (phosphate fertilizers-water) interactions in solutions. At higher temperature, due to discharge of solvent molecules from second hydration layer of fertilizer’s molecules, compressibility of bulk water molecules increases and hence Koϕ, values become less negative. Positive Sk values for aqueous phosphate fertilizers solutions are indicative of weak solute–solute interactions in solutions (Naseem et al., 2016).
3.2.2 Hydration number
Hydration number; another acoustic parameters is defined as the number of water molecules which on addition of a solute in solution get bounded with incoming solute molecules. Hydration numbers reveal the dynamic situation of ions as they move in solution. In this way number of water molecules moving freely in solutions decreases which in result cause a decrease in the overall compressibility of solution because bonding or formation of rigid links of water molecules with solute molecules has resulted into a decrease in distance between interacting. From the obtained compressibility data, hydration number for phosphate fertilizers is being calculated using following relation (Burakowski and Gliński, 2007).
The standard uncertainties in molality (m), temperature (T) and pressure (P) are ±0.0009 mol·kg−1, ±10−2 K and ±5 kPa respectively.
m/mol·kg−1
nh
293.15 K
298.15 K
303.15 K
308.15 K
313.15 K
Triple super phosphate
0.0042
67.89
65.91
64.89
47.89
45.22
0.0128
53.06
48.10
48.03
42.32
34.78
0.0213
50.20
44.52
44.87
41.10
32.45
0.0299
48.68
42.67
41.68
40.74
31.54
0.0384
47.79
41.78
40.18
39.89
30.99
Nitro phosphate
0.0069
65.70
64.90
56.62
51.80
45.34
0.0209
44.95
44.41
41.51
39.79
37.51
0.0419
34.01
33.49
32.09
31.10
29.83
0.0629
30.27
29.79
28.73
28.15
27.19
0.0839
28.33
27.80
26.89
26.41
25.66
Di ammonium phosphate
0.0075
60.24
49.68
46.59
41.53
32.92
0.0227
41.85
38.24
37.05
35.10
32.08
0.0450
32.83
30.95
30.25
29.10
27.47
0.0680
29.40
28.11
27.60
26.73
25.57
0.0900
27.88
26.87
26.45
25.68
24.78
Reported results show that for all used phosphate fertilizers, nh values are positive indicating the structure making behavior of phosphate fertilizers in their aqueous solutions. With increasing concentration of phosphate fertilizers in their solutions, nh values decrease. This suggests the presence of strong intermolecular interactions of phosphate fertilizers with water molecules. Presence of strong intermolecular interactions in aqueous phosphate fertilizer’s solution leads to decrease in compressibility of solutions which results in decreasing hydration number. As all phosphate fertilizers are of electrolytic nature, decrease in hydration number with increasing solute concentration can also be explained according to Pasynski suggestions, who states that in electrolytic solutions due to electrostatic field of ions, water molecules experience electrostrictive compression which acts like very high static pressure and renders the solutions very less compressible (or even non compressible at all) that in turn leads to decrease in hydration number (Burakowski and Gliński, 2008).
Electrostatic interactions at higher temperature become weaker and water molecules are released into the bulk leading to decreased compressibility of water molecules around solute molecules. Hence hydration number is observed to be decreasing with increasing temperature (Kharat, 2013).
Hydration number for aqueous TSP solutions is greater than its value for aqueous nitro phosphate and di ammonium phosphate solutions; highly hydrated molecule has greater nh values and in present case TSP is more hydrated molecule due to presence of greater charge Ca2+ ions. Hydration number for these phosphate fertilizers has the following trend.
Triple superphosphate > Nitrophosphate > Di ammonium phosphate.
3.2.3 Intermolecular free length (Lf)
Intermolecular free length is another acoustical parameter describing the nature and strength of molecular interactions present in a solution and is referred to as distance among the surfaces of two molecules. Molecules of liquid are assumed to be spherical and the average value of distance that ultrasonic waves travel between two molecules is called intermolecular free length (Lf). It could be evaluated from isentropic compressibility (βs) using following equation.
Nature and extent of molecular interactions present in solution affects the values of Lf. When isentropic compressibility decreases, free length also decreases and vice versa. Generally, Lf is affected by different parameters like temperature and concentration of solution components etc. Using measured sound velocity data at different temperatures Lf was calculated and that data is given in Table 5. Graphical presentation of variation of intermolecular free length with molality of phosphate fertilizers is shown in Figs. 2–4. The standard uncertainties in molality (m), Acoustic impedance (Z), intermolecular free length (Lf), Relative association (RA), temperature (T) and pressure (P) are ±0.0009 mol·kg−1, ±0.02 × 10⁴ (kg·m−2·s−1), ±0.002 × 10⁻³ m, ±0.000010, ±10−2 K and ±5 kPa respectively.
T/K
m/(mol·kg−1)
Z/(kg·m−2·s−1)
RA
Lf × 10−3/(m)
Triple super phosphate
0.0042
1501.70
0.996126
7.018
0.0128
1509.62
0.996286
6.954
293.15
0.0213
1518.54
0.997099
6.887
0.0299
1527.53
0.997937
6.821
0.0384
1536.41
0.998685
6.756
0.0042
1510.07
0.997047
6.932
0.0128
1517.97
0.997204
6.866
298.15
0.0213
1526.89
0.998016
6.804
0.0299
1535.87
0.998848
6.739
0.0384
1544.72
0.999575
6.675
0.0042
1519.02
0.997272
6.841
0.0128
1526.90
0.997417
6.780
303.15
0.0213
1535.78
0.998205
6.716
0.0299
1544.75
0.999037
6.652
0.0384
1553.57
0.999761
6.589
0.0042
1536.61
0.995201
6.674
0.0128
1544.41
0.995302
6.616
308.15
0.0213
1553.18
0.996015
6.554
0.0299
1562.03
0.996773
6.493
0.0384
1570.67
0.997379
6.434
0.0042
1548.38
0.993352
6.563
0.0128
1556.18
0.993457
6.507
313.15
0.0213
1564.94
0.994161
6.446
0.0299
1573.73
0.994882
6.387
0.0384
1582.42
0.995517
6.329
Nitro phosphate
0.0069
1486.99
0.999882
7.162
0.0209
1493.75
0.999682
7.099
293.15
0.0419
1500.67
0.999456
7.036
0.0629
1507.59
0.999222
6.973
0.0839
1514.51
0.998961
6.912
0.0069
1504.87
1.000432
6.991
0.0209
1511.63
1.000395
6.929
298.15
0.0419
1518.46
1.000327
6.869
0.0629
1525.24
1.000253
6.810
0.0839
1531.93
1.000145
6.752
0.0069
1511.97
0.999821
6.915
0.0209
1518.71
0.999781
6.855
303.15
0.0419
1525.48
0.999704
6.796
0.0629
1532.18
0.999628
6.738
0.0839
1538.77
0.999549
6.681
0.0069
1515.50
1.000225
6.869
0.0209
1522.22
1.000171
6.810
308.15
0.0419
1528.94
1.000076
6.751
0.0629
1535.63
0.999984
6.693
0.0839
1542.17
0.999864
6.637
0.0069
1525.21
0.999028
6.772
0.0209
1531.88
0.999208
6.714
313.15
0.0419
1538.6
0.99936
6.657
0.0629
1545.26
0.999501
6.601
0.0839
1551.83
0.999604
6.546
Di ammonium phosphate
0.0075
1483.09
1.000264
7.193
0.0227
1489.11
0.999033
7.141
293.15
0.0450
1495.06
0.997910
7.091
0.0680
1501.02
0.996794
7.042
0.0900
1506.95
0.995685
6.990
0.0075
1492.89
1.000212
7.091
0.0227
1498.17
0.998991
7.046
298.15
0.0450
1503.41
0.997828
7.003
0.0680
1508.64
0.99664
6.961
0.0900
1513.83
0.995391
6.918
0.0075
1506.23
1.000806
6.956
0.0227
1511.52
0.999582
6.914
303.15
0.0450
1516.75
0.998395
6.872
0.0680
1521.98
0.997166
6.830
0.0900
1527.21
0.995868
6.789
0.0075
1513.25
1.001165
6.882
0.0227
1518.62
0.999935
6.839
308.15
0.0450
1523.94
0.998744
6.797
0.0680
1529.26
0.997518
6.755
0.0900
1534.54
0.996208
6.714
0.0075
1520.48
0.999828
6.805
0.0227
1524.74
0.998597
6.772
313.15
0.0450
1528.96
0.997409
6.741
0.0680
1533.17
0.996185
6.709
0.0900
1537.32
0.994908
6.678
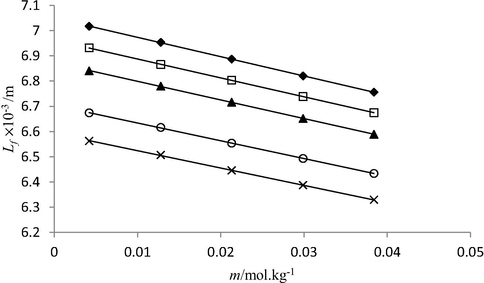
Plot between molality (m) and intermolecular free length (Lf) of triple super phosphate solutions in water at 293.15 K (♦), 298.15 K (□), 303.15 K (▲), 308.15 K (○) and 313.15 K (×).
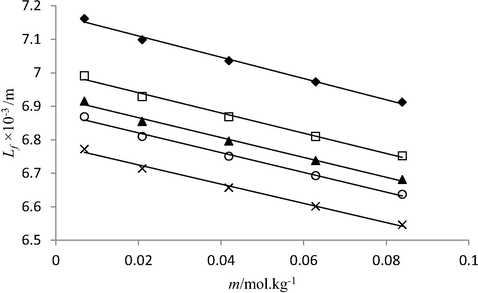
Plot between molality (m) and intermolecular free length (Lf) of nitro phosphate solutions in water at 293.15 K (♦), 298.15 K (□), 303.15 K (▲), 308.15 K (○) and 313.15 K (×).
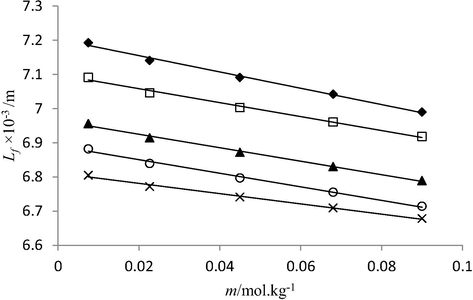
Plot between molality (m) and intermolecular free length (Lf) of di ammonium phosphate solutions in water at 293.15 K (♦), 298.15 K (□), 303.15 K (▲), 308.15 K (○) and 313.15 K (×).
It was found that values decrease with increase in concentration of phosphate fertilizers (solute), and temperature. The decrease in free length with increase in solute concentration indicates that molecular interactions among solution components get stronger on addition of solute molecules in solutions. This is because more number of solute molecules become available for solvent molecules to interact with. The presence of phosphate fertilizer in solution causes visible change in sound velocity values, which increases with increasing concentration of the phosphate fertilizers. Ultrasonic velocity depends on intermolecular free length Lf. With the decrease in free length, velocity increases and vice versa. Such dependency is clearly observed in studied solutions, the highest sound velocity data found in triple super phosphate solutions correlates the smallest Lf data among other studied phosphate fertilizers. The intermolecular length of three studied phosphate fertilizers in water lies in following order: di ammonium phosphate > nitro phosphate > Triple super phosphate. This is due to presence of stronger molecular interactions (hydrogen bonding) between highly charged Ca2+ ions (from TSP) and negatively charged end of polar water molecules than prevailing in nitro phosphate and di ammonium phosphate solutions.
3.2.4 Relative association (RA)
Relative association (RA) is another acoustic parameter which helps in understanding the intermolecular interactions, i.e. extent of association in solution relative to association existing in water. It is associated with following two types of effects taking place in solution:
-
The breaking of solvent molecules on addition of solute to it, which tends to decrease the RA value.
-
Simultaneous solvation of solute by solvent molecules which leads to increase in magnitude of RA.
RA can be calculated using following formula
Calculated data of RA for phosphate fertilizers solutions in water is given in Table 5, which show that RA values decrease with increasing fertilizer concentration indicating that in addition to solute molecules in solution breaking of solvent molecules occurs developing strong inter-ionic interactions in solutions. Among three phosphate fertilizers lowest RA values have been observed for TSP solutions in water than those obtained for nitro phosphate and di ammonium phosphate. This can be explained on the basis of presence of stronger rmolecular interactions (hydrogen bonding) among highly charged Ca2+ ions (from TSP) and negatively charged end of polar water molecules than those present in aqueous nitro phosphate and di ammonium phosphate solutions.
3.2.5 Specific acoustic impedance (Z)
Specific acoustic impedance is the product of ultrasonic velocity and density of solution. It is a measure of resistance offered by the medium for the propagation of sound waves through it. It is directly proportional to ultrasonic velocity and inversely proportional to adiabatic compressibility. Acoustic impedance (Z), explains molecular interactions present in the solution and is dependent on both temperature and concentration of solution. Acoustic impedance (Z) can be calculated using this equation.
The calculated data of acoustic impedance is given in Table 5. It is observed that value of Z increases with increasing concentration of phosphate fertilizers in aqueous solutions suggesting the presence of stronger molecular interactions due to closer packing structure of solute and solvent molecules. Increase in specific acoustic impedance with increasing fertilizer concentration and variation with increase of temperature show that molecular interactions in aqueous phosphate fertilizers solutions is associative. This also indicates the possibility of strong molecular interactions among the components present in the mixture.
The variation of Z in different fertilizer solutions lies in following order: triple super phosphate > nitro phosphate > di ammonium phosphate, due to presence of stronger intermolecular interactions (hydrogen bonding) among highly charged Ca2+ ions (from TSP) and negatively charged end of polar water molecules than prevailing in nitro phosphate and di ammonium phosphate solutions.
3.3 Volumetric parameters
Volumetric parameters e.g. molar volume, expansibility factor and its temperature derivative give detailed information about strength and nature of intermolecular interactions present in solutions and have been calculated in the present study in order to support the results of ultrasonic or acoustic parameters about strength and nature of intermolecular interactions in solutions (Ameta et al., 2013; Awasthi and Awasthi, 2012).
3.3.1 Apparent molar volume (Vϕ)
Apparent molar volume (Vϕ); an important volumetric parameter gives information about intermolecular interactions in solutions and manifests the behavior of solutes in solution with change in temperature and can be calculated using following mathematical relation (Iqbal and Verrall, 1989).
M is molar mass of fertilizers (for triple superphosphate 234.05 g·mol−1, for nitro phosphate 140.99 gmol−1, for di ammonium phosphate 132.07 g·mol−1). m is the molality (mol·kg−1) of phosphate fertilizer’s solutions in water. ρ is density of fertilizer’s solution and ρo is density of pure solvent, i.e. water respectively.
Calculated values of Vϕ for aqueous fertilizer’s solutions are given in Table 6. Representative 3-D plots of Vϕ vs. concentration in terms of molality (m) of phosphate fertilizer’s solutions in water as a function of temperature have been shown in Figs. 5–7. The standard uncertainties in molality (m), apparent molar volume (Vϕ) temperature (T) and pressure (P) are ±0.0009 mol·kg−1, ±0.03 cm3·mol−1, ±10−2 K and ±5 kPa respectively.
m/mol·kg−1
Vϕ/cm3·mol−1
293.15 K
298.15 K
303.15 K
308.15 K
313.15 K
Triple super phosphate
0.0042
131.90
134.57
138.65
144.54
153.83
0.0128
137.94
138.07
140.73
146.48
154.13
0.0213
138.59
141.52
144.45
147.64
158.88
0.0299
139.12
143.58
146.37
148.00
160.84
0.0384
140.43
144.18
147.15
149.50
161.11
Nitro phosphate
0.0069
126.95
127.42
128.30
129.57
131.05
0.0209
127.60
128.16
129.19
130.26
131.54
0.0419
128.56
129.53
130.87
131.83
132.77
0.0629
129.42
130.49
132.23
133.01
133.87
0.0839
130.73
131.77
133.82
134.70
135.15
Di ammonium phosphate
0.0075
36.67
37.67
38.67
40.63
43.64
0.0227
37.15
38.05
39.31
41.36
43.96
0.0450
37.56
38.28
39.70
42.08
44.53
0.0680
38.28
38.98
40.07
42.81
45.37
0.0900
38.57
39.45
40.44
44.09
45.71
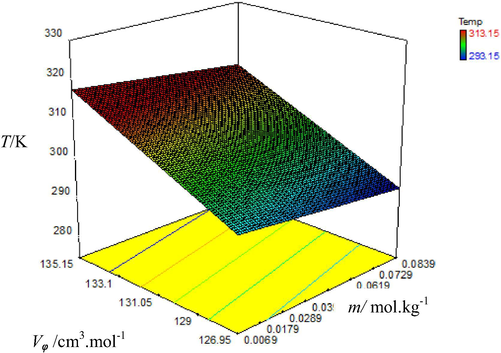
Graphical representation of variation of apparent molar volume (Vϕ) with molality (m) of aqueous nitro phosphate solutions at different temperatures.
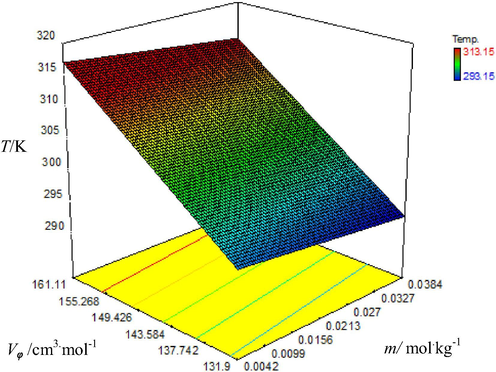
Graphical representation of variation of apparent molar volume (Vϕ) with molality (m) of aqueous triple super phosphate solutions at different temperatures.
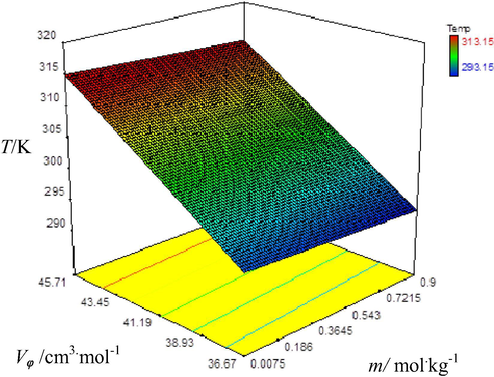
Graphical representation of variation of apparent molar volume (Vϕ) with molality (m) of aqueous di ammonium phosphate solutions at different temperatures.
Vϕ values increase with rising temperature and molality of fertilizer solutions which is shown by color of plots as the color of plots changes from blue to red. The dark blue color represents lowest value of Vϕ at low temperature and red color represents the highest Vϕ value at highest temperature i.e. 313.15 K. From these results it is obvious that with concentration of fertilizer’s molecules in aqueous solutions, apparent molar volume (Vϕ) increases which show the presence of strong intermolecular interactions in solutions due to enhanced degree of hydration of ions of fertilizer molecules with water molecules. As a result interactions of water with fertilizer molecules tend to increase (Golabiazar and Sadeghi, 2014). Vϕ increases with rising temperature of the solution because expansion in volume occurs due to removal of water molecules from outermost hydration layer of solute molecules into bulk at elevated temperatures (Chadha et al., 2016). Results given in table also show that the values of Vϕ are maximum for triple super phosphate solutions among all fertilizers used which could be due to molecular weight of TSP which is greater as compared to other fertilizers used. According to previous knowledge i.e. increasing molecular weight of solute causes increase in Vϕ values of solutions (Nain and Pal, 2013). Hence observed order of increasing Vϕ for three phosphate fertilizers in water is:
Vϕ (Di ammonium phosphate) < Vϕ (Nitro phosphate) < Vϕ (Triple super phosphate)
All fertilizers used have same anionic group (phosphate ion) but with different cations; the Vϕ value is highest in the solution of fertilizer having higher cationic charged specie than the fertilizer with lower charge on their cationic specie (Shamil et al., 1989; Godhani et al., 2014; Anwar and Nain, 1996; Naderi and Sadeghi, 2016). This trend could be explained due stronger intermolecular interactions between highly charged Ca2+ (dissociated from TSP molecules) and polar water molecules as compared to those present in case of NO2+ and NH4+ (produced from the dissociation of nitro phosphate and di ammonium phosphate) in water. Therefore due to greater degree of hydrogen bonding, Ca2+ ions from triple super phosphate tend to attract more OH– ends of water molecules in solutions as compared to NO2+ and NH4+ ions from nitro phosphate and di ammonium phosphate solutions respectively. Hence at each respective temperature for a fixed concentration of fertilizer, Ca2+ ions from triple super phosphate get more hydrated in their solutions and have larger apparent molar volume than the hydrated ions of NO2+ from nitro phosphate and NH4+ from di ammonium phosphate fertilizer in their solutions.
3.3.2 Partial molar volume (Voϕ)
Limiting or partial molar volumes for aqueous phosphate fertilizers molecules have been obtained using following Masson equation (Anwar and Nain, 1996).
Voϕ is the partial molar volume and gives information regarding solute–solvent interactions present in aqueous fertilizer solutions because at infinite dilution solute molecules are far away from each other and are surrounded only by solvent (water) molecules. Therefore, Voϕ is not found to be affected by solute–solute interactions. The term Sv in above Eq. (2) is the slope of plots of molality and Vϕ of aqueous phosphate fertilizer solutions and it suggests the solute- solute interactions present in solutions. Voϕ and Sv values have been given in Table 7. The standard uncertainties in partial molar volume (Vϕo), temperature (T) and pressure (P) are ±0.77 cm3·mol−1, ±10−2 K and ±5 kPa respectively.
Fertilizers
293.15 K
298.15 K
303.15 K
308.15 K
313.15 K
Voϕ/cm3·mol−1
Triplesuper phosphate
130.64
133.02
135.17
140.10
144.02
Nitrophosphate
127.14
127.24
127.77
128.99
130.54
Diammonium phosphate
36.55
37.49
38.69
42.57
43.40
Sv/kg·cm3·mol−1
Triplesuper phosphate
131.71
110.46
106.63
114.24
128.88
Nitrophosphate
11.16
56.31
71.86
66.32
53.97
Diammonium phosphate
23.35
21.34
20.16
25.81
26.49
It is obvious from data that Voϕ increases with increasing temperature. It may also be considered that two terms shown in equation given below may contribute to overall partial molar volume of solutions (Anwar and Nain, 1996).
Voϕ (elect) represents the partial molar volume due to electrostriction of water molecules, i.e. reduction in volume of solution, when solute molecules in solutions are hydrated. While Voϕ (int) is the intrinsic molar volume and may be due to weak van der waals forces and caging effects or hydrophobic character of solute (fertilizers) molecules. Voϕ (int) becomes almost negligible with increasing temperature (Singla et al., 2014). Therefore, at higher temperature, due to loss of hydration sheath of solute molecules Voϕ increases. For phosphate fertilizers used, the observed order of Voϕ values is:
Voϕ (Di ammonium phosphate) < Voϕ (Nitrophosphate) < Voϕ (Triple super phosphate)
This order of Voϕ for phosphate fertilizers in their aqueous solutions may be due to stronger intermolecular interactions between Ca2+ ions dissociated from TSP and polar water molecules as compared to those in aqueous nitro phosphate and di ammonium phosphate solutions where NO2+ and NH4+ have lower charge density being bulky groups in size and with large steric hindrance can interact with less water molecules as compared to Ca2+ ions.
3.3.3 Partial molar expansion
Limiting or partial molar expansion (Eoϕ) is another important volumetric parameter which indicates the structure promoting or breaking ability of fertilizer molecules in solutions in terms of their hydrophobic character. Following polynomial equation is being used to express the variation of limiting molar volumes (Vοϕ) with temperature (Sharma et al., 2016).
In Eq. (4), a, b and c are empirical constants and their obtained values have been reported in Table 8. Eoϕ values have been calculated using following mathematical equation.
The standard uncertainties in temperature (T) and pressure (P) are ±10−2 K and ±5 kPa respectively.
Fertilizers
a/(cm3·mol−1)
b/(cm3·mol−1·K−1)
c/(cm3·mol−1·K−2)
Triplesuper phosphate
1469.2
−9.4744
0.0167
Nitro phosphate
1034.7
−6.0479
0.0104
Diammonium phosphate
576.58
−3.9201
0.0071
Eoϕ (Elect) is the expansion contributed due to the hydration of solute molecules by water molecules i.e. electrostriction changes, while expansion due to structural changes is termed as Eoϕ (str) and is more prominent at low or room temperature. While at higher temperature, electrostriction component Eoϕ (Elect) is dominant and affects the outermost solvated water molecule’s layer (Dhondge et al., 2017). Calculated values of Eoϕ for phosphate fertilizers in water at different temperatures have been reported in Table 9. The standard uncertainties in Limiting apparent molar expansion (Eoϕ), temperature (T) and pressure (P) are ±0.008 cm3·mol−1·K−1, ±10−2 K and ±5 kPa respectively.
T/K
Eoϕ × 10−2/cm3·mol−1·K−1
(∂Eoϕ/∂T)/cm3·mol−1·K−2
Triple super phosphate
293.15
48.38
298.15
51.68
303.15
65.08
0.0334
308.15
81.78
313.15
98.48
Di ammonium phosphate
293.15
24.26
298.15
31.36
303.15
38.46
0.0142
308.15
45.56
313.15
52.66
Nitro phosphate
293.15
4.96
298.15
15.36
303.15
25.76
0.0208
308.15
36.16
313.15
46.56
Values of Eoϕ shown in Table 5 are positive for all of the three fertilizer solutions. Positive values of Eoϕ indicate that at higher temperature due to release of some water molecules into bulk, volume of solution increases than that of pure solvent. Greater values of Eoϕ at higher temperature showed that structural hydrophobic hydration of solute (fertilizers) molecules is dominant over electrostriction of solvent (water) molecules. Such behavior of solute molecules in solutions may be due to the presence of ‘caging effect’ or ‘packing effect’ of solute (fertilizers) molecules in solutions and do not behave as common electrolytes because of having some hydrophobic character (Sharma et al., 2015; Dhondge et al., 2017). It means that the fertilizer molecules by occupying the interstitial spaces in their solution indicate their structure making/hydrophobic character.
From calculated results it is obvious that triple super phosphate has greater values of Eoϕ than di ammonium phosphate and nitro phosphate, indicating that triple super phosphate has maximum hydration due to greater degree of hydrogen bonding in its aqueous solutions at higher temperature. While lowest values of Eoϕ in aqueous di ammonium phosphate solutions indicate the maximum electrostriction of solute molecules in its solutions.
3.3.4 Hepler’s constant
Temperature dependent derivatives of the limiting molar expansion give information about hydrophobic character of any solute molecule in the solution (George et al., 2002). Later on quantitative information regarding hydration of solute molecules in solutions was obtained using Hepler’s constant, which is obtained using following relation (Sharma et al., 2015).
The sign of (∂Eoϕ/∂T)P determines the structure making or breaking tendency of dissolved solute in a solvent. Positive values of (∂Eoϕ/∂T)P values are indicative of structure making ability of solute molecules, while reverse happens for structure breaking behavior of solute molecules (Sharma et al., 2016). Calculated values of (∂Eoϕ/∂T)P for these phosphate fertilizers in their aqueous solutions have been given in Table 2. Reported data showed that values of (∂Eoϕ/∂T)P are positive for all three phosphate fertilizers indicating their structure making tendency in solutions. Among three fertilizers triple super phosphate has most positive value of (∂Eoϕ/∂T)P which shows that among these phosphate fertilizers, TSP has maximum structure making ability in its aqueous solution. Observed order of increasing structure making ability of three studied phosphate fertilizers is given below.
Di ammonium phosphate < Nitro phosphate < Triple super phosphate
4 Conclusions
In present work, for aqueous phosphate fertilizer solutions, volumetric (e.g. apparent molar volume and partial molar expansion) and acoustic parameters (like compression factor and hydration number) were calculated from measured data of density and ultrasonic velocity at different temperatures (293.15–313.15)K. Apparent molar volume for fertilizer solutions is positive and is found to be increasing as temperature of solutions rises and also with increasing concentration of fertilizers in their aqueous solutions. It indicated that solute–solvent interactions are dominate solute–solute interactions with increasing solute content in solutions. Values of apparent molar isentropic compression (Kϕ) an acoustical parameter for fertilizer’s aqueous solutions become less negative with an increase in concentration of phosphate fertilizers in their aqueous solutions. This indicates that water molecules are less compressible around fertilizer molecules than in bulk which shows stronger intermolecular interactions in solutions. Moreover, obtained results from partial molar expansion, Hepler’s constant and hydration number indicate the structure making ability of phosphate fertilizers in water. Calculated volumetric and acoustical parameters show that among three phosphate fertilizers triple super phosphate develops maximum interactions in solutions due to greater degree of hydrogen bonding and electrostatic interactions with polar water molecules in its aqueous solutions which indicate the prominent effect of nature of fertilizer molecule on its behavior in solutions. This knowledge can be helpful in improving fertilizer activity according to targeted application (e.g. soil salinity treatment) by changing the nature of its molecule. Thermo-acoustic studies could also be used successfully in this regard.
Acknowledgments
Authors gratefully acknowledge Lahore College for Women University, Lahorefor for providing chemicals used in this study.
Declaration of Competing Interest
The authors declare that they have no known competing financial interests or personal relationships that could have appeared to influence the work reported in this paper.
References
- Comparative study of density, sound velocity and refractive index for (water + alkali metal) phosphates aqueous systems at T = (298.15, 303.15, and 308.15) K. J. Chem. Thermodyn.. 2013;60:159-168.
- [CrossRef] [Google Scholar]
- Long-term addition of organic fertilizers has little effect on soil organic phosphorus as characterized by 31P NMR spectroscopy and enzyme additions. Geoderma. 2015;257–258:67-77.
- [CrossRef] [Google Scholar]
- Ultrasonic study of molecular interactions in N, N- dimethylacetamide + ethanol binary mixtures at various temperatures. Acoust. Lett.. 1996;19:181-186.
- [Google Scholar]
- Acoustic, volumetric, and spectroscopic studies of formamide with 2-alkoxyethanols at different temperatures. J. Chem. Thermodyn.. 2012;53:144-151.
- [CrossRef] [Google Scholar]
- Hydration of the zwitterionic forms of amino acids from the acoustic passynski method. Acta Phys. Pol.. 2008;A 114
- [Google Scholar]
- Hydration numbers of non-electrolytes – Application of the acoustic method of Pasynski. Chem. Phys.. 2007;332:336-340.
- [CrossRef] [Google Scholar]
- Arsenic in groundwater affected by phosphate fertilizers at São Paulo, Brazil. Environ. Geol.. 2002;42:83-87.
- [CrossRef] [Google Scholar]
- Effects of compost and phosphate amendments on arsenic mobility in soils and arsenic uptake by the hyperaccumulator, Pteris vittata L. Environ. Pollut.. 2003;126:157-167.
- [CrossRef] [Google Scholar]
- Interionic interactions of glycine, l-alanine, glycylglycine and phenylalanine in aqueous 1-hexyl-3-methylimidazolium chloride ionic liquid solutions at T = (288.15 to 308.15) K: Volumetric, speed of sound and viscometric measurements. J. Mol. Liq.. 2016;218:68-82.
- [CrossRef] [Google Scholar]
- Effect of glycine on aqueous solution behavior of saccharides at different temperatures: Volumetric and ultrasonic studies. J. Mol. Liq.. 2014;194:212-226.
- [CrossRef] [Google Scholar]
- Agronomic and environmental aspects of phosphate fertilizers varying in source and solubility: An update review. Nutr. Cycl. Agroecosyst.. 2011;89:229-255.
- [CrossRef] [Google Scholar]
- Physicochemical study of solute-solute and solute-solvent interactions of aqueous binary mixtures of l-alanine methyl ester hydrochloride and l-valine methyl ester hydrochloride at different temperatures: Volumetric and compressional studies. J. Chem. Thermodyn.. 2017;105:217-225.
- [CrossRef] [Google Scholar]
- Densities, viscosities, speeds of sound, and relative permittivities for methyl acrylate + 1-alcohols (C1–C6) at T = (308.15 and 318.15) K. J. Chem. Eng. Data. 2002;47:262-269.
- [CrossRef] [Google Scholar]
- Thermo-acoustical studies of 1,3,4-oxadiazole as binary mixture at three different temperatures. J. Chem. Thermodyn.. 2014;70:73-80.
- [CrossRef] [Google Scholar]
- Salt-effects in aqueous surface-active ionic liquid 1-dodecyl-3-methylimidazolium bromide solutions: Volumetric and compressibility property changes and critical aggregation concentration shifts. J. Chem. Thermodyn.. 2014;76:29-44.
- [CrossRef] [Google Scholar]
- Role of phosphate fertilizers in heavy metal uptake and detoxification of toxic metals. Chemosphere. 2014;108:134-144.
- [CrossRef] [Google Scholar]
- Apparent molar volume and adiabatic compressibility studies of aqueous solutions of some drug compounds at 25 C. Can. J. Chem.. 1989;67:727-735.
- [CrossRef] [Google Scholar]
- Partial molar volumes and viscosity B coefficients of benzyltriethylammonium chloride in dimethyl sulfoxide + water at different temperatures. J. Chem. Eng. Data. 1997;42:548-550.
- [CrossRef] [Google Scholar]
- Partial molar volume, Jones-Dole coefficient, and limiting molar isentropic compressibility of sodium ibuprofen in water and its hydration number and hydration free energy. Thermochim. Acta. 2013;566:124-129.
- [CrossRef] [Google Scholar]
- Effect of temperature on the aggregation behaviour and thermodynamic properties of surface active ionic liquid 1-decyl-3-methylimidazolium bromide in aqueous solutions: Surface tension, vapour pressure osmometery, conductivity, volumetric and compressibility study. J. Chem. Thermodyn.. 2016;102:68-78.
- [CrossRef] [Google Scholar]
- Study of solute–solute and solute–solvent interactions of l-threonine in aqueous-glucose solutions at different temperatures by using volumetric and viscometric methods. J. Chem. Thermodyn.. 2013;60:98-104.
- [CrossRef] [Google Scholar]
- A thermo-acoustical study to explore interactions between soil salts and fertilizer in view to control the soil salinity. J. Mol. Liq.. 2017;225:64-86.
- [CrossRef] [Google Scholar]
- Volumetric studies of antibiotics in aqueous media. J. Mol. Liq.. 2016;221:408-414.
- [CrossRef] [Google Scholar]
- Influence of sodium acetate on the volumetric behavior of binary mixtures of DMSO and water at 298.15 to 313.15 K. J. Mol. Liq.. 2013;181:68-76.
- [CrossRef] [Google Scholar]
- Determination of Cd, Cr and Pb in phosphate fertilizers by laser-induced breakdown spectroscopy. Spectrochim. Acta Part B At. Spectrosc.. 2014;97:42-48.
- [CrossRef] [Google Scholar]
- Densities and derived properties of water, 1,4-dioxane and dimethyl sulfoxide binary and ternary systems at temperatures from 293.15 K to 313.15 K. Rev. Roum. Chim.. 2009;54:63-73.
- [Google Scholar]
- Interactions of potassium fluoride with coexistent components in water-dimethyl sulfoxide mixed solvent at different temperatures. Thermochim. Acta. 2011;525:197-205.
- [CrossRef] [Google Scholar]
- Apparent molar volumes and isentropic compressibilities of transfer of l-alanine from water to aqueous potassium di-hydrogen citrate and tri-potassium citrate at T = (283.15 to 308.15) K. J. Mol. Liq.. 2008;141:62-68.
- [CrossRef] [Google Scholar]
- Structural functions of taste in 5-membered ring structures. Food Chem.. 1989;32:171-188.
- [CrossRef] [Google Scholar]
- Thermodynamic study of N-acetyl glycine in aqueous tetraethylammonium iodide solutions in the temperature interval (288.15 to 308.15) K: Volumetric and acoustic study. J. Chem. Thermodyn.. 2016;94:74-84.
- [CrossRef] [Google Scholar]
- Study of solute–solute and solute–solvent interactions of N-acetyl glycine in aqueous d-fructose solutions at different temperatures. Thermochim. Acta. 2015;607:1-8.
- [CrossRef] [Google Scholar]
- Solvation behaviour of biologically active compounds in aqueous solutions of antibacterial drug amoxicillin at different temperatures. J. Chem. Thermodyn.. 2014;76:100-115.
- [CrossRef] [Google Scholar]
- Evaluation of phosphate fertilizers for the stabilization of cadmium in highly contaminated soils. J. Hazard. Mater.. 2009;165:1109-1113.
- [CrossRef] [Google Scholar]


