

Translate this page into:
Rosa Damascena mediated ZnO-Red Ochre nanocomposite for the electrochemical determination of 5-Fluorouracil
⁎Corresponding authors. nasrin_soltani2056@yahoo.com (Nasrin Soltani), salavati@kashanu.ac.ir (Masoud Salavati-Niasari)
-
Received: ,
Accepted: ,
This article was originally published by Elsevier and was migrated to Scientific Scholar after the change of Publisher.
Peer review under responsibility of King Saud University.
Abstract
In this study, ZnO-Red Ochre nanocomposite was green synthesized by Rosa Damascena (RD) extract (RDZRONCs). Proton Induced X-ray Emission microanalysis (Micro-PIXE) and X-ray diffraction (XRD) pattern confirmed the presence of hematite (Fe2O3), and quartz (SiO2) mineral phases in the Red Ochre (RO) nanoclay. In addition, the XRD pattern shows the ZnO, ZnFe2O4, SiO2, Fe2O3, and Si phases in the RDZRONCs that were green synthesized with natural RD extract and RO. The RDZRONCs were used to modify the carbon paste electrode (CPE) for the electrochemical determination of the anticancer drug 5-fluorouracil (5-FU). Cyclic voltammetry (CV) and electrochemical impedance spectroscopy (EIS) techniques were employed to investigate the surface behavior of modified CPE (RDZRONCs/CPE). The electrochemical behavior of 5-FU at the RDZRONCs/CPE was exanimated by CV, differential pulse voltammetry (DPV), chronoamperometry (CA), and chronocoulometry (CC). Based on the DPV technique, a linear relationship between peak current and concentration of 5-FU was obtained in the dynamic range of 0.05–140.0 μM and with a detection limit equal to 0.0016 μM. The selectivity of RDZRONCs/CPE for 5-FU was studied in the presence of different inorganic and organic species. Also, the content of 5-FU was measured in real samples by RDZRONCs/CPE.
Keywords
Green synthesis
Rosa Damascena
ZnO-Red Ochre Nanostructures
Nanoclay
5-Fluorouracil
Electrochemical sensor

1 Introduction
Red ochre (RO) is a natural pigment that has historically been used for a variety of purposes, such as painting walls, artworks, and for extracting iron. The RO contains varying amounts of hematite (Fe2O3), goethite (FeOOH), kaolinite (Al2Si2O5(OH)4), or illite, quartz (SiO2), calcite (CaCO3), anhydrite (CaSO4) and dolomite (CaMg(CO3)2). When hematite is the main phase of iron oxide, the ochre is red, and when goethite is predominant, it is yellow (Mortimore et al., 2004; Salavati-Niasari, 2006).
Plant-mediated synthesis of nanoparticles is a one-step, cost-effective, and environmentally friendly method that uses natural and non-toxic bio-constitute as capping and reducing agents for the green synthesis of nanoparticles. Due to their bio-constitute, such as flavonoids, phenolic acids, alkaloids, saponins, carbohydrates, terpenoids, and proteins, medicinal plants with high therapeutic value are widely used in synthesizing nanoparticles (Chopra et al., 2022). Rosa Damascena (RD) is a shrub that can grow up to 2.5 m in height and is mainly cultivated in Iran, Bulgaria, Turkey, India, and Morocco. The presence of phytochemicals such as glycosides, terpenes, flavonoids, and anthocyanins causes the bright and colorful RD flowers to have medicinal properties. Also, this phytochemical can act as a reducing and capping agent for the green synthesis of nanoparticles (Boskabady et al., 2011).
Measurement of drugs has played an essential role in controlling the quality of drugs and has also been very influential on public health. Therefore, it is imperative to choose a simple and sensitive technique for measuring these compounds. Fluorouracil, with the IUPAC name of 5-fluoro-1H, 3H-pyrimidine-2,4-dione, and abbreviations 5-FU, is an antimetabolite. 5-FU is an analog of pyrimidine, so it interferes with DNA replication. 5-FU is used to control some cancers, such as gastrointestinal cancers of colorectal cancer, pancreatic cancer, and skin cancers (topically). This drug, like other chemotherapy drugs, has many side effects. Diarrhea, infection, mouth ulcers, scaling of the skin, inflammation of the skin, and peptic ulcer are important and relatively common side effects of 5-FU (Longley et al., 2003; Freelove and Walling, 2006; Salavati-Niasari, 2005). Due to the biological importance of 5-FU, simple and rapid techniques for its identification in trace quantities in daily analysis seem necessary. Various techniques such as HPLC (Loos et al., 1999; Woo et al., 2008), fluorescence spectrometry (Khot et al., 2010; Zhu et al., 2011), capillary electrophoresis (Procházková et al., 2001), GC/MS (Kubo et al., 1991; Li et al., 2018), and LC-MS/MS (Salavati-Niasari et al., 2008; Mutharani et al., 2020) have been used to measure 5-FU. Despite their high sensitivity, some of these techniques are less commonly used due to their complexity and time-consuming nature. Therefore, to solve these problems, electrochemical methods are used, which have advantages such as high sensitivity and selectivity, simplicity, and good reproducibility (Mahdi et al., 2022; Rahimi-Nasrabadi et al., 2020; Ganesan et al., 2021; Satyanarayana et al., 2015; Hatamluyi et al., 2019; Bukkitgar and Shetti, 2016; Wang et al., 2012). In 2012, a GNP (gold nanoparticles) modified screen-printer electrode (SPE) was used to measure 5-FU by using the square wave voltammetry (SWV) technique (Hua et al., 2013). In 2013, a modified glassy carbon electrode (GCE) was described for determination of 5-FU (Pattar and Nandibewoor, 2015). In another study, a glucose-modified CPE was used to measure 5-FU (Wang et al., 2012). GCE was modified with chitosan nanocomposite-MWCNT-gold nanoparticles (GNPs) for 5-FU measurement by using CV, EIS, and DPV investigated in 2015 (Hatamluyi et al., 2019). GCE modified with chitosan nanocomposite film and reduced graphene oxide to measure 5-FU using the SWV technique has also been reported (Koyuncu Zeybek et al., 2015). In 2015, a DNA biosensor based on a GCE modified with poly(bromocresol purple) was used to measure 5-FU (Bukkitgar and Shetti, 2016). In 2016, the electrochemical behavior of 5-FU was evaluated on the surface of CPE without modifier (Bukkitgar and Shetti, 2016), and CPE modified with methylene blue (Hadi et al., 2018). 5-FU measurement with screen-printed carbon and GCE electrodes modified with nanohybrid graphene oxides and carbon nanotubes has been evaluated (Lima et al., 2018). In 2018, a CPE modified with nanocomposite porphyran coated with GNPs was described for 5-FU measurement. GNP was synthesized by the green method, and the nanocomposite particle size is reported to be 128.7 nm. (Zahed et al., 2018). Pencil graphite electrode modified with nanocomposite polyaniline-silver nanoparticles (SNPs) reported for 5-FU measurement (Bojko et al., 2020). In 2020, CPE modified with green synthesized silver nanoparticles was used to measure 5-FU (Emamian et al., 2020). 5-FU has been measured on the surface of CPE modified with graphene quantum dots and ionic liquid 1-butyl pyridinium bromide (Niazazari et al., 2020). A CPE modified with ptSWCNTs and nH3MHP (n-hexyl-3-methylimidazolium hexafluorophosphate) is reported for the measurement of 5-FU (Purohit et al., 2022).
Recently, the use of nanomaterials in the construction of sensors has received much attention (Veerakumar et al., 2021; Veerakumar et al., 2021; Manavalan et al., 2019; Shanbhag et al., 2022). The use of nanorods-Hf.WO3 modified CPE to measure salbutamol, paracetamol (Bukkitgar et al., 2020), and Ambroxol measurements using CPE modified with reduced GO (graphene oxide) loaded by Ru-doped TiO2 nanoparticles (Killedar et al., 2021) are examples of the use of nanomaterials in electrochemical sensors. Nanoclays are environmentally friendly and accessible nanomaterials that are also widely used in electrode modification. The CPE and GCE modified with a hybrid of GO, and nanoclay is reported for theophylline measurements (Shetti et al., 2019; Shetti et al., 2020). The CPE modified with nanoclay has also been used to measure nimesulide (Killedar et al., 2022) and famotidine (Ghalkhani et al., 2022) by the SWV method. The use of nanocomposites for the measurement of drugs has also received much attention recently (Halakoei et al., 2021; Sohouli et al., 2021; Zokhtareh et al., 2023). The use of nanocomposite CuO/ZnFe2O4/rGO to measure carbamazepine (Halakoei et al., 2021) and the use of nanocomposite TiO2 and ionic liquid in measuring zolpidem (Zokhtareh et al., 2023) are examples of the use of nanocomposites in modifying electrodes that used in measuring drugs.
Nanomaterials synthesized by the green method have been widely used in electrochemistry, especially in electrode modification (Sherlin et al., 2022; Lee et al., 2022; Nazarpour et al., 2020; El-sayed et al., 2022; Kumar et al., 2022; Bilge et al., 2022; Sallez et al., 2000). Using Fe3O4 nanoparticles produced with the help of Sambucus ebulus L. extract to measure metronidazole (Sherlin et al., 2022), reduction of graphene oxide using reducing agents obtained from the dragon fruit peel and its application in the measurement of sulfamethoxazole (Nazarpour et al., 2020), application of reduced graphene oxide/gold nanoparticles (rGO/AuNPs) nanocomposite synthesized using E. tereticornis leaf in surface modification of screen-printed electrode for measuring l-tryptophan (El-sayed et al., 2022), and measurement of anticancer drug ruxolitinib using GCE modified with carbon materials obtained from sponge waste and Co3O4 nanoparticles (Sallez et al., 2000) are examples of reported research on the use of green synthesized nanomaterials for electrochemical measurements.
Considering the importance of using nanomaterials synthesized by the green method in the modification of electrodes, in this research, it was decided to use ZnO-Red Ochre nanocomposite synthesized using Rosa damascene to modify CPE. The cheapness and availability of Red Ochre for making nanocomposite are one of the convenient features of the present research. In addition, according to the studies conducted, Red Ochre has received very little attention in electrochemical measurements (Erol et al., 2021). On the other hand, using ZnO-Red Ochre nanocomposite synthesized in this research has not been used to modify any electrode.
In this research, RO nanoclay was green synthesized with RD extract and analyzed by Micro-PIXE and XRD analysis. In the next step, RD extract was used to green synthesis RDZRONCs nanocomposite. Finally, the green synthesized nanocomposite was used to modify CPE for the electrochemical determination of 5-FU by voltammetry techniques such as CV, DPV, CA, and CC.
2 Experimental
2.1 Materials, reagents, and solutions
The names of all the chemicals used in this research, along with the chemical formula, the name of the manufacturer, and their purity, are listed in Table 1. Graphite powder is amorphous, and its particle size is less than 50 µm. Phosphate buffer solutions, PBS, were prepared by mixing 0.1 M solutions of phosphate salts, and its pH was adjusted in the desired pH using 0.1 M NaOH or H3PO4 solutions. Ampoules containing 250 mg of 5-FU per 5 ml were bought from a drugstore in Isfahan, Iran.
Chemical
Chemical formula
Company
Purity (%)
Zinc acetate dihydrate
Zn(CH3COO)2·2H2O
Merck
99
Ethanol
C₂H₆O
Merck
96
Fluorouracil
C4H3FN2O2
Merck
99
Phosphoric acid
H3PO4
Merck
85
Sodium dihydrogen phosphate
NaH2PO4
Merck
99
Disodium hydrogen phosphate
Na2HPO4
Merck
99
Sodium hydroxide
NaOH
Merck
99
Acetic acid
C2H4O2
Merck
100
Boric acid
H3BO3
Merck
99
Sodium hydroxide
NaOH
Merck
99
Paraffin oil
–
Merck
100
Graphite powder
C
Merck
100
Potassium ferricyanide
K3Fe(CN)6
Merck
99
Potassium ferrocyanide
K4Fe(CN)6
Merck
99
Potassium chloride
KCl
Merck
99
Fluorouracil injection
C4H3FN2O2
250 mg/5 ml
2.2 Apparatus
The XRD pattern was obtained by PANalytical X’pert under Cu-K radiation, λ = 1.541 A˚, 2θ = 20–80, to analyze the RO nanoclay and determine the crystal structure and the size of RDZRONCs. The morphology of RDZRONCs was studied using a scanning electron microscope Leo 1430 Vp (Carl Zeiss). Also, the functional groups of RDZRONCs were characterized by Shimadzu 8900 FT-IR spectroscopy. The micron proton system used in this study was purchased in 2000 by the Atomic Energy Organization of Iran from Oxford Microbial Company and installed on the nuclear and nuclear research center's vendor accelerator. The launch of this system was carried out in late 2004. The proton beam required for elemental analysis is generated by the 3 MeV accelerator and nuclear physics unit. This bar has a dimension of 2 × 2 mm2 for daily analysis. However, to create a micron beam, by an object diaphragm and a diaphragm, the diameter of the beam is reduced to less than 9 mm. Then the plate is converted by three triangular magnetic poles of less than 10 µm in diameter. The micron beam is swept by two oscillators in two directions, y and ×, and the sample's surface is in a maximum dimension of 2.5 × 2.5 mm. (The broom level in this research is 0.5 × 5 mm square). Therefore, in this way, the two-dimensional distribution of the elements in the sample can be measured by the micro-pixel technique. To determine the resolution of the measurement using the micro-pixel technique, the proton beam is projected onto a metal net, for example, of the iron contained in the test chamber. Also, the degree of separation of sample measurement is known as the distance between the vertical and horizontal lines in the net (about 120 µm). In this experiment, a 1.5-meV proton beam with a pulsed flow of about 10–20 pA was used. The proton beam diameter in this test is abou9t 10 µm. Autolab device manufactured by Company Chemie-Eco Netherlands, model PGSTAT320N, was used for electrochemical measurements consist of the CV, DPV, CC, CA, and EIS. For potentiostat tests, three-electrode cells containing working (CPE, modified or unmodified), reference (saturated Ag/AgCl electrode), and auxiliary (platinum wire electrode) are commonly used in this research. The voltammograms, chronoamprograms, chronocolograms, and Nyquist curves were recorded using NOVA 1.8 software. Then the required parameters were obtained by using this software and discussed. Nyquist curves were obtained for 0.1 M KCl solution containing 1 mM Fe2+/Fe3+ redox after 15 min of equilibrium, in the frequency range of 10 kHz-0.1 Hz with an amplitude of 0.01 V. Metrohome pH meter model 827 was used to prepare the buffers.
2.3 Preparation of the RD extract
RD flowers were collected from Qamsar, Kashan, Iran, and after washing with re-distilled water, it was dried and turned into powder. 5 g of dried and grounded RD flowers was added to 100 ml of re-distilled water in a 250 ml Erlenmeyer flask and sonicated at 70 °C for 20 min. The resulting solution was filtered with Whatman No. 1 filter paper and was used to green synthesis RDZRONCs.
2.4 Preparation of RO nanoclay
RO was collected from the Persian Gulf of Iran. For the green synthesis of RO nanoclay, 100 ml of ethanol 70 % v/v was added to 0.5 g of purified RO and sonicated for 20 min. In the next step, 20 ml of RD extract was added to the supernatant solution and subjected to 50 kHz ultrasonic for one hour. Finally, the obtained precipitate was calcined at 600 °C.
2.5 Green synthesis RDZRONCs
For the green synthesis of RDZRONCs, 0.1 g of RO nanoclay was dispersed in 10 ml of ethanol and then added to 40 ml of 10 mM zinc acetate dihydrate solution. To this solution was added 10 ml of RD extract as a reducing and capping agent and kept at 60 °C on a magnetic plate for about 24 h under continuous stirring. The resulting precipitate was centrifuged at 5000 rpm for 10 min and washed with re-distilled water to remove impurities. The green synthesized RDZRONCs were dried at 80 °C and calcinated at 600 °C for 3 h.
2.6 Preparation of the RDZRONCs/CPE
To make the unmodified CPE, weigh 0.5 g of graphite powder, then grind it well in a porcelain mortar for 20 to 30 min, then add about 7 to 8 drops of paraffin to the ground powder and mix it to be uniform. The homogenized paste was then pressed into a glass tube with a cross-section of 1.34 mm. For the preparation RDZRONCs/CPE, all the steps are similar to those mentioned for making the unmodified CPE, except that the values of 0.002, 0.004, 0.006, and 0.008 g of the RDZRONCs were separately added to 0.5 g of graphite powder. In addition, a thin copper wire, inserted through the end of the glass tube into the paste, was used to make an electrical connection between Autolab and the drug solution in electrochemical measurements.
2.7 Prepare real samples
To prepare the serum solution, place the sample in a centrifuge to separate the plasma portion, then 1 ml of it is transferred with a micropipette into a 10 ml volumetric flask and brought to volume with deionized water. Then, 1 ml of the resulting solution was transferred by micropipette into the cell containing 5 ml of PBS with specified pH, and the voltammogram was obtained. After collecting the urine sample from a healthy volunteer, it was stored at 4 °C. In order to prepare the sample, 5 ml of the sample was centrifuged for 5 min at a speed of 5000 rpm. Then it was diluted twice with phosphate buffer (pH = 8). To minimize the effect of the matrix, the standard addition technique was used for the serum and urine samples. In this technique, certain values of 5-FU standard solution were spiked into the sample solution so that the resulting current of voltammograms is in the linear range of the proposed technique.
3 Results and discussion
3.1 Characterization of RO nanoclay
3.1.1 Micro-PIXE of RO nanoclay
Fig. 1 (a) shows the distribution of phases in RO nanoclay obtained from Micro-PIXE analysis. As a result, hematite (Fe2O3), quartz (SiO2), and alumina (Al2O3), with a relative percentage of 43 %, 31.6 %, and 10.9 %, respectively, form the main phases of RO nanoclay. The remaining phases included magnesium 4.5 %, calcium 7.5 %, potassium 2 %, and trace amounts of 0.2 % sulfur, 0.2 % chloride, 0.3 % titanium, 14.4 % manganese, chromium 014 / 0 % on 016 % and sodium is 0.076 %. Fig. 1 (b) shows the Micro-PIXE elemental maps of iron, calcium, aluminum, potassium, magnesium, sulfur, silicon, and chlorine. As can be seen, the sample has a uniform and completely homogeneous distribution. Also, in an area where there is a cavity or space associated with one element, it is uniformly and homogeneously filled with other elements.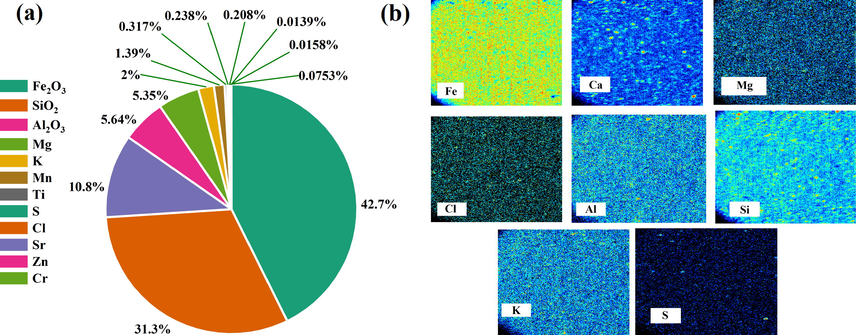
Distribution of phases in RO nanoclay (a), and elemental maps (b) obtained from Micro-Pixe analysis.
3.1.2 XRD of RO nanoclay
X-ray powder diffraction (XRD) analysis was used to evaluate the main mineral phase of synthesized RO nanoclay. As shown in the XRD pattern, Fig. 2 (a), hematite (Fe2O3) and quartz (SiO2) were the major phases of RO nanoclay. The characteristic peak at 2θ = 33.31° corresponds to the (1 0 4) miller index (reference code: 01–087-1166), confirming the presence of the hematite phase in RO nanoclay. Also, the characteristic peak at 2θ = 26.81° corresponds to the (0 1 1) miller index (reference code: 01–078-1252), confirming the quartz phase. In addition, the average size of RO nanoclay was obtained using the Scherrer equation
of 39.90 nm.
XRD pattern of RO nanoclay(a), XRD pattern of the RDZRONCs (b). and FT-IR spectrum of the RDZRONCs (c).
3.2 Characterization of green synthesized nanocomposite RDZRONCs
3.2.1 XRD analysis of RDZRONCs
Fig. 2 (b) shows the XRD pattern of RDZRONCs green synthesized with RD extract. Accordingly, the characteristic peak at 2θ = 26.72° with miller index (0 1 1), 2θ = 28.43° with miller index (1 1 1), 2θ = 33.18° with miller index (1 0 4), 2θ = 35.43° with miller index (3 1 1), and 2θ = 36.31° with miller index (1 0 1) confirm the presence of SiO2 (reference code: 01–078-1253), Si (reference code: 01–077-2110), Fe2O3 (reference code: 01–079-1741), ZnFe2O4 (reference code: 01–077-0011), and ZnO (reference code: 01–079-0206) in the RDZRONCs, respectively. The average size of RDZRONCs was calculated by the Scherrer equation equal to 36.84 nm.
3.2.2 FT-IR of RDZRONCs
FT-IR spectroscopy in the wavelength range of 400–4000 cm−1 was used to identify functional groups in RDZRONCs (Fig. 2 (c)). As a result. The absorption bands at 470 cm−1 and 582 cm−1 were attributed to the Fe-O and Zn-O vibrations. The absorption band at 1035 cm−1 can be identified as an asymmetric Si–O–Si stretching band. The absorption bands at 1384 cm−1, 1637 cm−1, 2925 cm−1, and 3417 cm−1 3400 to 2922, 1628, 1384, and 1058 cm − 1 refer to RD extract that is assigned to the aromatic ring, stretching C—C, carbonyl group (C—O), and O—H and N—H groups, respectively.
3.2.3 FE-SEM and TEM aanalysis of RDZRONCs
The FE-SEM image of green synthesized RDZRONCs is shown in Fig. 3 (a). The RDZRONCs had a mostly hexagonal crystal structure with an average diameter equal to 50 nm. Also, energy scattering spectroscopy (EDX) was used to investigate the elemental composition of RDZRONCs. In the EDX spectrum (Fig. 3 (c)), the Fe, Si, Zn, and O elements were seen as indicators.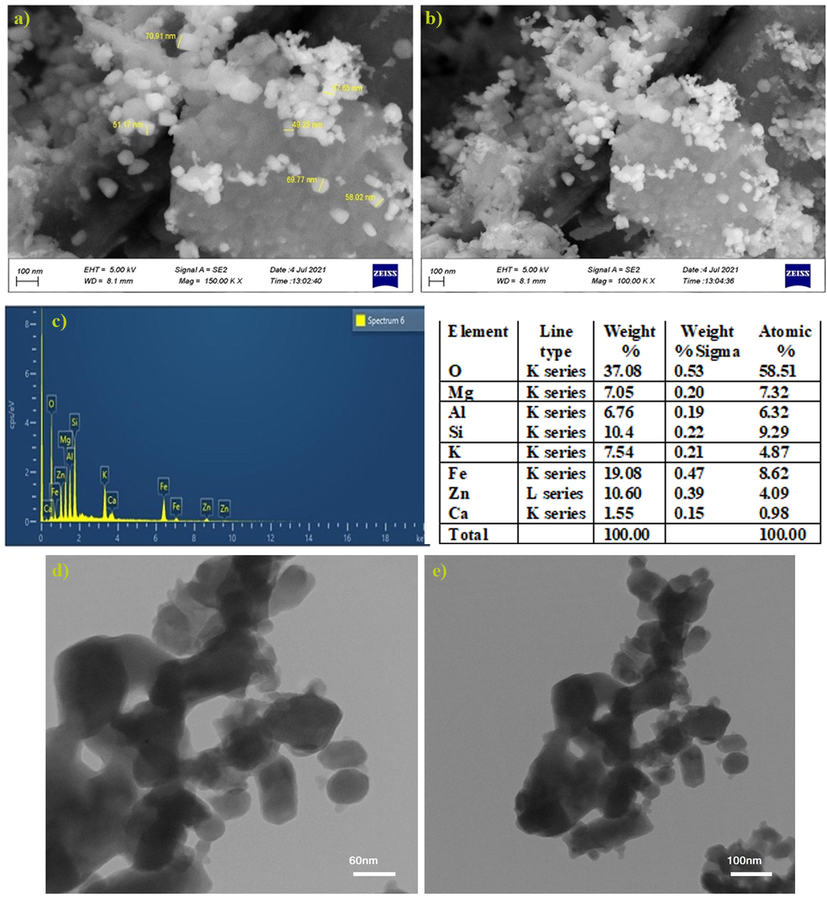
FE-SEM image (a and b), elemental composition from EDX (b), and TEM images (d and f).
In order to compare the size, morphology and uniformity of distribution of RDZRONCs nanoparticles, their TEM image was prepared. Electron microscope model LEO912-AB manufactured by LEO company was used to determine the shape and size of RDZRONCs nanoparticles. For Transmission Electron Microscope (TEM) analysis, first the grid surface was covered with a thin layer of Form Var and a drop of the sample was placed on it. After drying the sample, its image was prepared. As can be seen in Fig. 3 (d,f), the particles were mainly spherical and their diameter was in the range of 40–50 nm. Also, in some areas, they are piled up or scattered together.
3.3 Study of the electrode surface
CV and EIS techniques were used to evaluate the RDZRONCs/CPE surface. To compare the active surface area of the CPE and the RDZRONCs/CPE, the actual surface area of each electrode was obtained using the Randles Sevik equation:
Ipa, n, A, D, ν, C0 are the peak anode current, number of electrons transferred, electrode surface area, diffusion coefficient, scan rate, and concentration of K3Fe(CN)6, respectively. For this purpose, CVs were obtained at different scan rates for each electrode in 0.1 M KCl solution containing 1 mM K3Fe(CN)6 at different scan rates. Then, using the slope of the Ipa-ν1/2 curve and considering that the values of n and D for K3Fe(CN)6 are equal to 1 and 7.6 × 10⁻⁶, respectively, the surface area for the CPE is equal to 0.032, and for RDZRONCs/CPE equal to 0.072. Therefore, the surface area of RDZRONCs/CPE is 2.25 times the surface area of the CPE, that it is due to the large specific surface area of the RDZRONCs.
EIS is one of the most reliable techniques for examining the electrode surface based on the resistance to electron transfer at the surface. For this purpose, the Nyquist curves for the CPE, RO nanoclay/CPE, and the RDZRONCs/CPE for 1 mM Fe2+/Fe3+ redox in 0.1 M KCl solution were obtained (Fig. 4, left side). In the Nyquist curve, the value of Zre, on the x-axis, represents the resistance to electron transfer, Rct, at the electrode surface. Higher Rct indicates slower electron transfer resulting in less current in voltammetric techniques, lower Rct, indicates faster electron transfer, therefore, more current is observed in voltammetric techniques. Based on Fig. 4 and using the equivalent circuit (Pavel et al., 2005) to fit the Nyquist curve data (insets of Fig. 4), the Rct value for the CPE was 7.02 kΩ, for the RO nanoclay/CPE 3.64 kΩ and for the RDZRONCs/CPE was 1.54 kΩ. These results indicate that the electrical conductivity of the green synthesized RDZRONCs is very good and facilitate electron transfer at the electrode surface.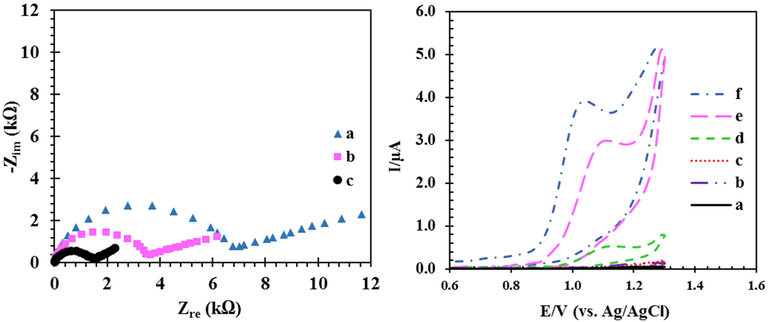
Left: Nyquist diagram CPE (a), RO nanoclay/CPE (b), and RDZRONCs/CPE (c) and inset is equivalent circuit fitted with impedance data, at the solution containing 1 mM of Fe2+/Fe3+ redox and 0.1 M KCl, right: CVs for CPE, RO nanoclay/CPE and RDZRONCs/CPE, (a-c) in buffer solution, (d-f) buffer solution with 5-FU. Conditions: 100 µM 5-FU, 0.1 M PBS at pH 8.
3.4 Electrochemical response of 5-FU on the electrode surface by CV technique
Cyclic voltammograms of the CPE, RO nanoclay/CPE, and RDZRONCs/CPE in the absence and presence of the drug were evaluated to assess the electrocatalytic properties of RDZRONCs/CPE (Fig. 4, right side). A comparison of the CVs of curve (c) and curve (d) in Fig. 4 shows that the electrochemical response of 5-FU at the CPE surface (curve (d)) appeared at a potential of 1.11 V with Ipa = 0.271 μA, at the RO nanoclay/CPE surface (curve (e)) appeared at a potential of 1.08 V with Ipa = 0.894 μA. In contrast, for RDZRONCs/CPE (curve (f)) the 5-FU electrochemical signal is observed at a potential of 1.03 V with Ipa = 1.282 μA. Based on these results, the peak potential of 5-FU in the RO nanoclay/CPE and RDZRONCs/CPE shifts 30 and 80 mV to a more negative potential than the CPE, respectively. As a result, the RO nanoclay and RDZRONCs have catalytic properties for 5-FU oxidation. On the other hand, the peak current oxidation of 5-FU for the RO nanoclay/CPE and RDZRONCs/CPE are 3.29 and 4.73 times that of the CPE due to the increased effective surface area of the electrode in the presence of RO nanoclay and green synthesized RDZRONCs. Therefore, RDZRONCs increase the measurement sensitivity of 5-FU due to their high electrical conductivity and catalytic properties.
3.5 Optimization of chemical and instrumental parameters
Chemical and instrumental parameters such as the amount of modifier in the electrode fabrication, the type of electrolyte (buffer), the pH value of the solution, and instrumental parameters in the DPV technique, were optimized to obtain the maximum current.
3.5.1 Optimization of the amount of RDZRONCs
Based on the above discussion, RDZRONCs can enhance the current responses of 5-FU. The amount of RDZRONCs was impressive on Ip in DPV. Fig. 5 shows the effect of change in the amount of RDZRONCs on the enhancement of the voltammogram peak height of 5-FU. As shown, From 0.001 to 0.002 g of RDZRONCs 3 µA increase in peak oxidation current was observed, and from 0.002 to 0.003 g of RDZRONCs, the current increased slightly. However, from 0.003 to 0.004 g of modifier, 2 µA increase in peak oxidation current is visible. With an increase of more than 0.004 g of the modifier, the current has also decreased. Therefore, the electrode with 0.004 g of RDZRONCs was used for subsequent studies.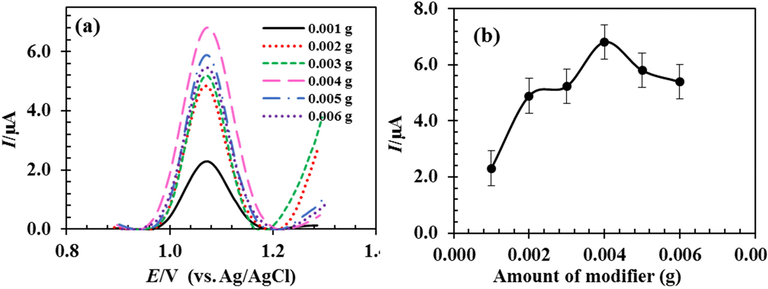
Effect of the amount of RDZRONCs on the peak current of 100 µM 5-FU.
3.5.2 Effect of pH
The pH of the supporting electrolyte is an essential parameter for the electro-oxidation of 5-FU on the RDZRONCs/CPE. Several buffers, such as ammonia, acetate, Britton Robinson, and phosphate, were used as the supporting electrolyte in the determination of the 5-FU solution using the DPV technique. A higher oxidation peak current was obtained for PBS. Thus, PBS was used as the supporting electrolyte in the continuing experiments. The effect of pH in the range of 4–10, I-pH diagram, and E-pH diagram for the PBS buffer as a suitable buffer was shown in Fig. 6 (a), Fig. 6 (b), and Fig. 6 (c), respectively. Based on Fig. 6 (a) and Fig. 6 (b), the maximum peak current of 5-FU is obtained at pH = 8.0. The maximum peak current depends on the form of protonation and deprotonation of 5-FU species in the electrochemical cell (Bukkitgar and Shetti, 2016; Hadi et al., 2018). In other words, in acidic pH, the protonated form of 5-FU is dominant, and in basic pH, the deprotonated form of 5-FU is dominant (Bukkitgar et al., 2015). The peak current is dependent on the structure of the analyte. Fig. 6 (c) shows that the oxidation potential of 5-FU tends to have negative potentials as the pH increases, and there is a linear relationship between Ep and pH, following the equation below.
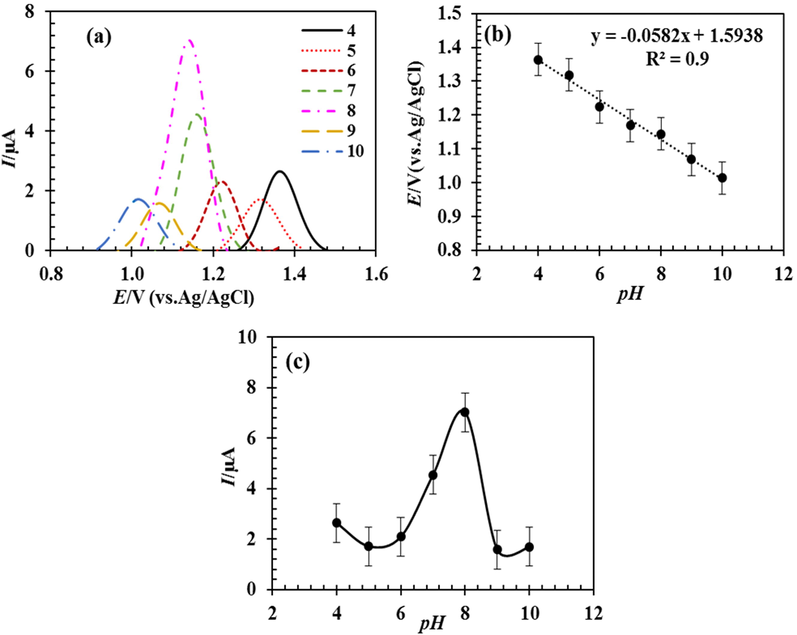
DPVs obtained by RDZRONCs/CPE in 0.1 M phosphate buffer with pHs of 4 to 10 containing 5 µM 5-FU (a), the effect of pH on the peak current of 5-FU (b), and the effect of pH on the peak oxidation potential of 5-FU (c).
The above result displays the participation of proton in the electrochemical reactions of 5-FU. According to the proposed mechanism for fluorouracil oxidation and the interventions of H+ ions, changing the pH changes the oxidation of the species so that by increasing the concentration of H+ ions and decreasing the pH, the species oxidation reaction takes place at more positive potentials. Given the slope of equation (2) for 5-FU, −58 mv/pH, it can be concluded that the ratio m/n is approximately 1. Therefore, the number of protons and electrons exchanged in the electrochemical reaction of 5-FU are equal to each other and are consistent with the results reported in the literature (Bukkitgar and Shetti, 2016; Hadi et al., 2018).
3.5.3 Optimization of instrumental parameters
Instrument variables, pulse height, and pulse width are modifiable factors in the program of the potential applied by the potentiostat–galvanostat device while recording the voltammograms. Optimizing the device variables due to the effect on the height of the current and the shape of the voltammograms can increase the sensitivity. To investigate the effect of pulse height on the sensitivity of the technique, solutions of 5 µM 5-FU in 0.1 M PBS at optimal pH were prepared. Then, by changing the pulse height potential in the range of 0.001 to 0.020, the resulting voltammograms were drawn. As a result, the optimum pulse height was obtained equal to 0.01 V. To obtain the optimal pulse width value, voltammograms were plotted for 5 µM 5-FU in 0.1 M PBS solution in the range of 1–100 ms. A comparison of the obtained voltammograms showed that the maximum output current of pulse width is 50 ms.
3.6 Investigation of the effect of potential scan rate on the electrochemical behavior of 5-FU
By examining the influence of potential scan rate, ν, on cyclic voltammograms, it is possible to investigate the penetration or absorption of the reaction of 5-FU on the surface of the RDZRONCs/CPE. According to the Randles-Sevik equation, equation (1), linearity relationship of Ip-ν1/2 indicates that the 5-FU oxidation process at RDZRONCs/CPE is under mass transfer control and the fluorouracil for oxidation penetrate to the electrodes. The Tafel equation is used for obtaining the α (electron transfer coefficient) parameter, based on the data of the I-E curves and then using the slope of the curve of the logIp,-Efrom the following.
According to Fig. 7 (c), the slope of the Tafel line is equal to 6.3245. By putting the values of R = 8.314 j mol−1 K−1, T = 298 K, and F = 96485C mol−1 and considering that the n for 5-FU is 2 (Bukkitgar and Shetti, 2016; Hadi et al., 2018), the value of α for 5-FU is 0.81. On the other hand, the results of Fig. 7 (a) show that with increasing scan rate, the peak potential value shifts to more positive values. The observation of this behavior can be attributed to the irreversibility of the oxidation process (Hadi et al., 2018; State et al., 2022). The relationship between log Ip and log υ is linear, and the slope of the resulting line is 0.62 (Fig. 7 (d)). If the value of the slope is close to 1, it indicates that the process is controlled by adsorption, and if the slope is close to 0.5, the process is controlled by diffusion (Laviron, 1979). Therefore, it was again concluded that the electrochemical process of 5-FU at RDZRONCs/CPE is diffusion controlled.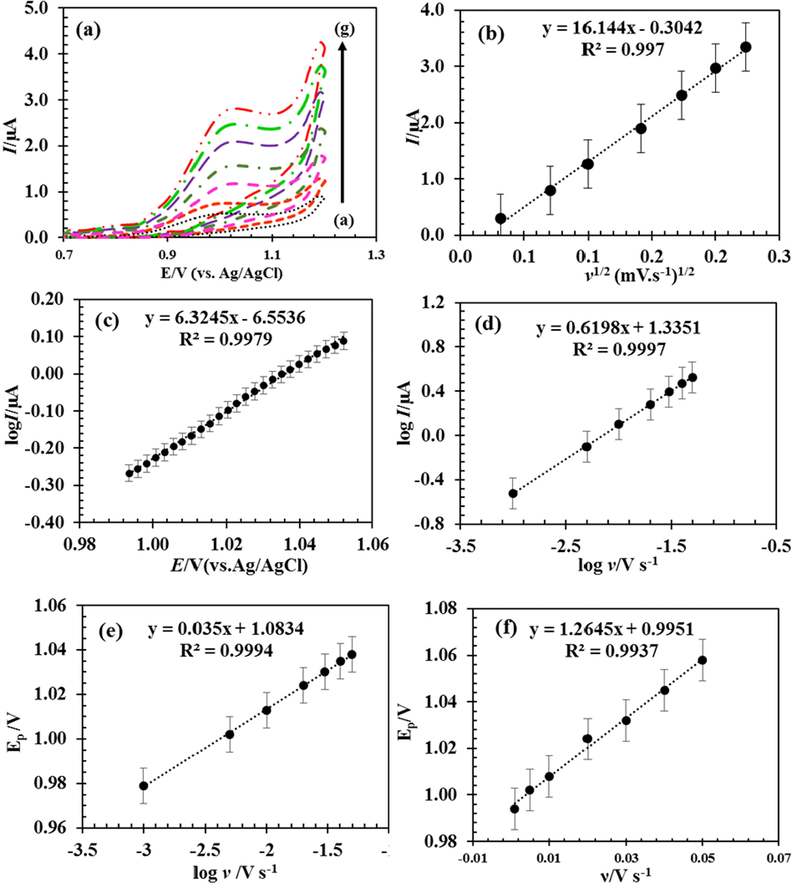
CVs obtained for 100 µM 5-FU in 0.1 M PBS at pH = 0.8 on the surface of RDZRONCs/CPE with scan rates of 1.0 to 50.0 mV s−1 (a), changes in the electrocatalytic current relative to the ν1/2 (b), and Tofel diagram obtained from the current–potential curve recorded at the 30 mV s−1 scan rate (c), dependence of log I on logν (d), relationship between Ep and logν (e), relationship between Ep and ν (f).
Pursuant to Laviron's theory (Ganduh et al., 2021), for an irreversible electrode process, the relationship between scan rate and peak potential, Ep, is expressed through equation (4).
In equation (4), E0, and k0 are formal potential (V), and the heterogeneous catalytic rate constant (s−1), respectively. Fig. 7 (e) shows that the relationship between Ep and log υ is linear. The value of nα is obtained using the slope of the resulting line equal to 1.69. The value of α can be calculated using equation (5).
In equation (5), Ep/2 is the potential at which the current is half the peak value. Considering that the value of Ep-Ep/2 is equal to 0.058 V, the value of α is equal to 0.82. Considering that the Ep-Ep/2 value is 0.058 V, the α value is equals 0.82. The value of α obtained from equations (4) and (5) is agrees with the value obtained from equation (3). Finally, by determining the value of α, the value of n was obtained 2.05≈2. The k0 value can be calculated from the intercept of the resulting line from the log ν-Ep graph (Fig. 7 (e). The value of E0 is obtained by using the graph obtained from Ep in relation to ν (Fig. 7 (f)) by extrapolating the resulting line to the vertical axis, ν = 0. Consequently, E0 and K0 were obtained as 0.995 and 2.2 × 10⁴ s−1, respectively.
3.7 Reaction mechanism
Since in section 3–6, the number of electrons was equal to 2, and in section 3.5.2, the number of protons and electrons were equal in the electrochemical reaction of 5-FU, therefore, the possible electrochemical reaction for 5-FU can be justified by Fig. 8. According to Fig. 8, first the π electron in the 5-FU ring is removed and component 1 is produced. But component 1 is very unstable and is quickly attacked by OH– ions and turns into component 2. Finally, by removing a proton and an electron, the final product is created. The oxidation of 5-FU is facilitated by increasing the electron density in the π bond of C⚌C. The presence of the electron-withdrawing group F in the fifth position of 5-FU molecule causes a decrease in the electron density due to its electron-withdrawing property, but on the other hand, the mesomeric effect of the F atom can increase the electron density. Considering that the mesomeric effect of the halogen atom plays a more important role, as a result, the presence of the F atom in the 5-FU molecule facilitates the oxidation of this molecule (Wang et al., 2012; Jasim et al., 2022; Mahdi et al., 2021; Mahdi et al., 2020; Aljeboree et al., 2020; Aljeboree et al., 2021).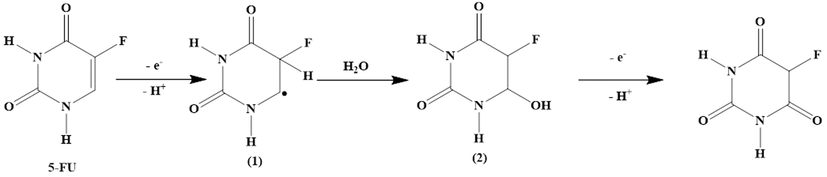
Possible mechanism of 5-FU oxidation reaction.
3.8 Investigation of oxidation of 5-FU by CA and CC methodes
To obtain the diffusion coefficient D for 5-FU, its oxidation by the RDZRONCs/CPE by CA technique has been studied. First, 5-FU chronoamperograms were obtained in different concentrations, and from them, Ip diagrams were drawn relative to t−1/2. Then, by plotting the slope of the graph curve I- t−1/2 in terms of different concentrations of 5- FU and using Cottrell’s equation, equation (6), D was calculated.
In this equation, D is the diffusion coefficient (cm2.s−1), C is the concentration of 5-FU (mol.cm−3), A is the surface area of the electrode (cm2), and n is the number of electrons participating in the reaction. According to Fig. 9 (a), Fig. 9 (b), and equation (6), D by CA technique was obtained 3.8 × 10⁻⁵ cm2.s−1. So, first, chronocoulogram diagrams were drawn for different concentrations of 5-FU. Then Q-t1/2 graphs were drawn from the resulting chronocoulogram graphs. Bby plotting the slope of the lines obtained from the Q-t1/2 graphs relative to the concentration, the value of D was obtained using equation (7).
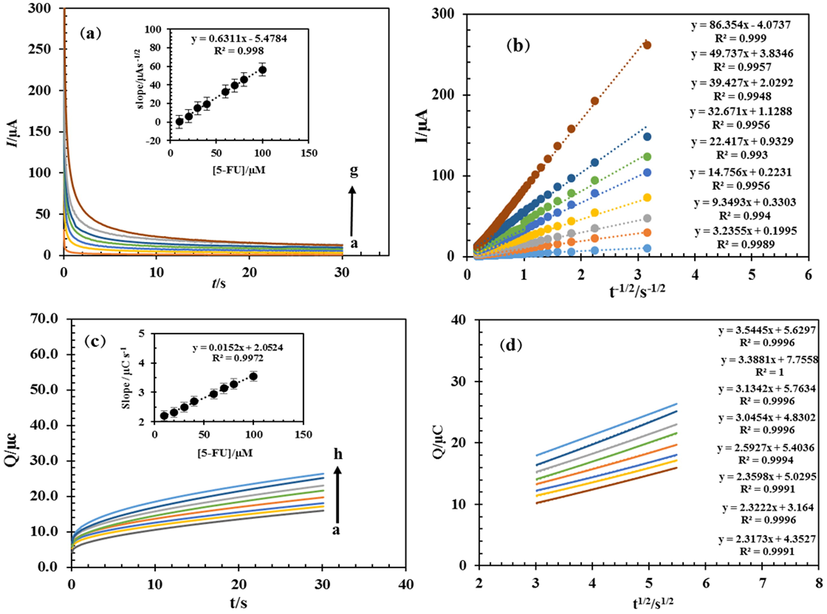
Chronoamperograms obtained from solutions with concentrations of 10, 20, 30, 40, 60, 70, 80 and 100 μM 5-FU in 0.1 M PBS solution with pH = 8.0 (a), diagram I-t−1/2 for different concentrations of 5-FU,(inset of a) Slope of I-t−1/2diagram in terms of 5-FU concentration (b), chronocoulograms obtained from solutions with concentrations of 10, 20, 30, 40, 60, 70, 80 and 100 μM 5-FU in 0.1 M PBS solution with pH = 8.0 (c), and diagram Q-t1/2 for different concentrations of 5-FU,(inset of c) Slope of Q-t1/2 diagram in terms of 5-FU concentration (d).
According to equation (7), D was obtained 3.8 × 10⁻⁵ cm2.s−1 by the CC technique, which is in good agreement with the value obtained by the CA technique.
3.9 Calibration curve and detection limit
Because the differential pulse voltammetry technique has a higher current sensitivity than cyclic voltammetry, this technique is used to estimate the detection limit. After optimizing the test conditions and obtaining the most appropriate electrochemical response for the RDZRONCs/CPE to 5-FU using DPV obtained for different concentrations of 5-FU, the calibration curve was drawn (Fig. 10). Fig. 10 (a)-(p) shows that the variations of the measured current are linear in terms of 5-FU concentration in the range of 0.05 to 140 μM. After drawing the calibration curve and obtaining the line equation, it is possible to obtain the detection limit of the technique with the equation DL = 3Sb/m (Killedar et al., 2021; Shetti et al., 2020). In this equation, Sb and m are the standard deviations of the blank and the slope of the line of the calibration curve, respectively. The detection limit was calculated to be 0.0016 µM. Table 2 compares the detection limit and the linear range obtained from this technique with the values reported in some of the articles. By comparing the results of this technique with the previously reported techniques, it can be seen that the detection limit of this technique is better than some reports, and in some cases, the linear range of the proposed technique is wider.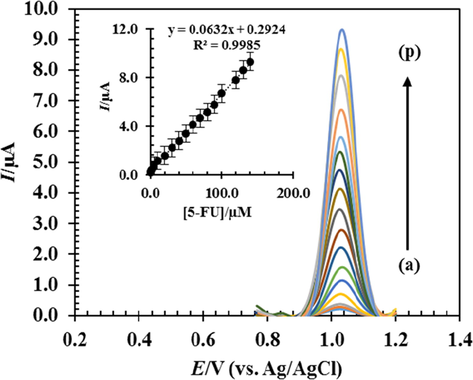
DPVs in 0.1 M PBS with RDZRONCs/CPE at pH = 0.8, with concentrations of 0.1, 0.5, 1, 5, 10, 20, 30, 40, 50, 60, 70, 80, 90, 100, 120 and 140 μM 5-FU and inset; current changes measured in terms of 5-FU concentration.
Electrode type
Determination method
Dynamic range
Detection limit
Ref.
GQDs-PANI/ZnO-NCs/GCE1
DPV
0.1–50.0 μM
0.023 μM
(Bukkitgar and Shetti, 2016)
PANINTs @ AgNPs PGE2
DPV
1.0–300.0 µM
0.060 µM
(Bojko et al., 2020)
GC/P(BCP)/dsDNA 3
DPV
1.0–8.5 and 8.5–50 mg/L
0.31 mg/L
(Bukkitgar and Shetti, 2016)
CPE/AgNPs-PFR4
SWV
90.0–300.0 μM
10.7 μM
(Emamian et al., 2020)
Pr:Er/CPE5
SWV
0.01–50.0 μM
0.00098 µM
(Ganesan et al., 2021)
GNP-MWCNT-Chit/GCE6
DPV
0.03–10.0 μM
0.020 µM
(Hatamluyi et al., 2019)
Glucose modified CPE
DPV
0.1–40 µM
0.0051 µM
(Wang et al., 2012)
CPE
DPV
0.1–40.0 μM
0.012 µM
(Bukkitgar and Shetti, 2016)
MTB7 modified CPE
DPV
0.1–40.0 µM
0.0020 µM
(Hadi et al., 2018)
RDZRONCs/CPE
DPV
0.05–140 μM
0.0016 μM
This work
3.10 Stability, repeatability, and reproducibility of RDZRONCs/CPE
Voltamograms of solution 10 µM of 5-FU were obtained with RDZRONCs/CPE for 50 consecutive days. The results showed that after this period, the response current of the electrode changes to 98.2 % of its initial value. Therefore, the desired electrode has good relative stability. To evaluate the accuracy of the technique, DPVs for 10 µM of 5-FU under optimal conditions were recorded 15 times. The RSD of the resulting currents was 1.4 %. The results indicate that the proposed technique for measuring 5-FU has good accuracy. To evaluate the reproducibility of the technique, 5 electrodes with the optimal amount of RDZRONCs were prepared, and then DPVs of 10 μM 5-FU were recorded under optimal conditions for each of the electrodes. The RSD value was 2.7 %.
3.11 Investigate the effect of interferences
In this study, the effect of some interfering species, which are often present in biological systems and can interfere with the measurement, has been studied. The study is that if the current from the presence of the interfering species is less than 5 % different from the peak current of the drug in the absence of the interferences, such interference will not interfere with the measurement of the drug. However, if this ratio is more than 5 %, it will interfere with the measurement of the drug. Table 3 shows the interference effects of various species on the determination of 5-FU. To investigate the interferences in the measurement of 5-FU, a 10 μM solution of 5-FU in 0.1 M PBS with pH = 8.0 was used under optimal conditions. The results show that most of the studied species will not interfere with measuring 5-FU. Therefore, it can be concluded that the electrode modified with RDZRONCs has good selectivity, and this electrode can be easily used to measure 5-FU in real samples.
Species
The molar ratio of interfernces species to concentration of 5-FU
Signal change (%)
Na+
1000
0.65
K+
0.44
Mg2+
0.89
Ca2+
−0.97
NO3–
0.75
CO32–
−1.09
Cl-
0.73
Sucrose
900
1.32
Ascorbic acid
850
−1.65
l-Glutamine
700
1.85
glycine
1.45
Acetaminophen
600
0.52
dopamine
−1.84
epinephrine
−2.93
Oxalate
500
1.72
Fructose
450
1.44
sucrose
−2.51
glucose
2.89
Citric acid
300
−1.98
Uric acid
2.07
3.12 Measurement of 5-FU in real samples by standard addition technique
To evaluate the efficiency of the technique, after drawing the standard curve, the amount of 5-FU in the 0.250 mg/0.5 ml fluorouracil ampoule was measured by the standard addition technique. For this purpose, 10 ml of a solution with a concentration of 30 μM 5-FU in PBS buffer with pH = 8.0 was prepared, DPV was recorded, and its current was measured. Then, specific volumes of the standard solution of 5-FU were added to the drug solution each time, and DPVs were recorded. After extracting the results of these voltammograms, the standard addition curve was drawn. The measurements were repeated 4 times, and the confidence limits for the 97 % confidence level were calculated. The results are given in Table 4. The effect of physiological tissue on real samples was also evaluated with the standard addition technique. The results of these studies are also presented in Table 4. According Table 4, the complex composition of real samples has little effect on 5-FU recovery.
Sample
5-FU spiked (µM)
5-FU in the sample (µM)
5-FU Founda (µM)
Recoveryb (%)
5-FU injection 250 mg/5 ml
–
30
29.8 ± 0.33
99.33
10
40
39.7 ± 0.51
99.25
20
50
49.5 ± 0.65
99.00
30
60
60.2 ± 0.87
100.33
Human serum
–
–
Not detected
–
10
10
9.92 ± 0.22
99.20
20
20
19.83 ± 0.40
99.15
30
30
29.80 ± 0.44
98.80
40
40
40.08 ± 0.67
100.20
Urine sample
–
–
Not detected
–
20
20
20.78 ± 0.96
103.9
30
30
31.08 ± 1.23
103.6
40
40
39.04 ± 1.04
97.6
4 Conclusions
In this study, a new nanocomposite of RDZRONCs was synthesized using extract A and identified by different methods of XRD and Micro-PIXE. Then, RDZRONCs nanocomposite was used as a modifier in making carbon paste electrode to measure 5-FU. Examining the surface of modified and unmodified electrodes in 1 mM Fe2+/Fe3+ redox solution in 0.1 M KCl by CV method showed a 2.5 times increase in the surface area of RDZRONCs/CPE compared to CPE. In the EIS method, a 4.5 times reduction in charge transfer resistance was observed for RDZRONCs/CPE compared to CPE. Comparison of the peak oxidation of 5-FU on the surface of the electrodes in the CV method showed a 4.73-fold increase in the peak current and 80 mV displacement of the potential for RDZRONCs/CPE compared to CPE. These results indicate the excellent electrical conductivity of the nanocomposite and its catalytic properties. The highest peak current of 5-FU was observed at pH = 8. By examining the effect of the scanning rate on the CV peak, it was shown that the electrochemical reaction between 5-FU and the electrode surface is controlled by the diffusion process. Also, in this study, α = 0.82, n = 2, and k0 = 2.2 × 10⁴ s−1 were obtained. This technique has other advantages such as low detection limit, high repeatability, good selectivity, cheapness and availability of materials and equipment, as well as time-consuming testing. Given the advantages mentioned, this technique can be well used to measure 5-FU in real or pharmaceutical samples.
CRediT authorship contribution statement
Javad Ebrahimian: Writing – original draft, Writing – review & editing, Conceptualization, Supervision, Project administration, Visualization. Maryam Khayatkashani: Writing – review & editing, Writing – original draft, Conceptualization, Methodology, Supervision, Project administration, Data curation. Nasrin Soltani: Writing – review & editing, Writing – original draft, Conceptualization, Methodology, Supervision, Project administration, Data curation, Validation, Resources, Visualization, Funding acquisition. Halah T. Mohammed: Investigation, Software. Nahid Tavakkoli: Formal analysis, Investigation. Mina Jafari: Investigation, Software. Masoud Salavati-Niasari: Writing – review & editing, Writing – original draft, Conceptualization, Methodology, Supervision, Project administration, Data curation, Validation, Resources, Visualization, Funding acquisition.
Acknowledgment
The authors would like to thank Talae Sabz Tuba Pharmaceutical Research Institute and Payame Noor University for their financial support and necessary cooperation in completing this research. Authors are grateful to the the University of Kashan for supporting this work by Grant No (159271/NS5).
Declaration of Competing Interest
The authors declare that they have no known competing financial interests or personal relationships that could have appeared to influence the work reported in this paper.
References
- Adsorption of pollutants by using low-cost (Environment-Friendly): equilibrium, kinetics and thermodynamic studies: a review. Systemat. Rev. Pharm.. 2020;11(12):1988-1997.
- [CrossRef] [Google Scholar]
- Synthesis, characterization of p(Ch/aa-co-am) and adsorptive removal of pb(ii) ions from aqueous solution: Thermodynamic study. NeuroQuantology. 2021;19(7):137-143.
- [CrossRef] [Google Scholar]
- A novel electrochemical sensor based on magnetic Co3O4 nanoparticles/carbon recycled from waste sponges for sensitive determination of anticancer drug ruxolitinib. Sensors Actuators B Chem.. 2022;367:132127
- [CrossRef] [Google Scholar]
- Porphyran-capped silver nanoparticles as a promising antibacterial agent and electrode modifier for 5-fluorouracil electroanalysis. Carbohydr. Res.. 2020;498:108193
- [CrossRef] [Google Scholar]
- Pharmacological effects of Rosa damascena. Iran. J. Basic Med. Sci.. 2011;14:295-307.
- [Google Scholar]
- Electrochemical behavior of anticancer drug 5-fluorouracil at carbon paste electrode and its analytical application. J. Anal. Sci. Technol.. 2016;7:1-9.
- [CrossRef] [Google Scholar]
- Electrochemical sensor for the determination of anticancer drug 5-fluorouracil at glucose modified electrode. ChemistrySelect. 2016;1:771-777.
- [Google Scholar]
- Electrochemical behavior of an anticancer drug 5-fluorouracil at methylene blue modified carbon paste electrode. Mater. Sci. Eng. C.. 2016;65:262-268.
- [CrossRef] [Google Scholar]
- Electro-sensing base for mefenamic acid on a 5% barium-doped zinc oxide nanoparticle modified electrode and its analytical application. RSC Adv.. 2015;5:104891-104899.
- [CrossRef] [Google Scholar]
- Novel ruthenium doped TiO2/reduced graphene oxide hybrid as highly selective sensor for the determination of ambroxol. J. Mol. Liq.. 2020;300:112368
- [CrossRef] [Google Scholar]
- H. Chopra, S. Bibi, I. Singh, M.M. Hasan, M.S. Khan, Q. Yousafi, A.A. Baig, M.M. Rahman, F. Islam, T. Bin Emran, S. Cavalu, Green Metallic Nanoparticles: Biosynthesis to Applications, Front. Bioeng. Biotechnol. 10 (2022) 548. doi:10.3389/fbioe.2022.874742
- Versatile eco-friendly electrochemical sensor based on chromium-doped zinc oxide nanoparticles for determination of safinamide aided by green assessment criteria. Microchem. J.. 2022;182:107900
- [CrossRef] [Google Scholar]
- A sensitive sensor for nano-molar detection of 5-fluorouracil by modifying a paste sensor with graphene quantum dots and an ionic liquid. J. Nanostruct.. 2020;10:230-238.
- [CrossRef] [Google Scholar]
- Electrochemical determination of anticancer drug Bendamustine and its interaction with double strand DNA in the absence and presence of quercetin. Colloids Surf. B Biointerfaces. 2021;205:111884
- [CrossRef] [Google Scholar]
- Selective spectrophotometric determination of 4-amino antipyrine antibiotics in pure forms and their pharmaceutical formulations. Int. J. Drug Deliv. Technol.. 2021;11(2):371-375.
- [CrossRef] [Google Scholar]
- Synthesis of nitrogen-doped carbon quantum dots@Fe2O3/multiwall carbon nanotubes ternary nanocomposite for the simultaneous electrochemical detection of 5-fluorouracil, uric acid, and xanthine. J. Mol. Liq.. 2021;331:115768
- [CrossRef] [Google Scholar]
- Electrochemical monitoring of carbamazepine in biological fluids by a glassy carbon electrode modified with CuO/ZnFe2O4/rGO nanocomposite. Surf. Interfaces. 2022;30:101943
- [CrossRef] [Google Scholar]
- Graphene oxides/multi-walled carbon nanotubes hybrid-modified carbon electrodes for fast and sensitive voltammetric determination of the anticancer drug 5-fluorouracil in spiked human plasma samples. Chem. Pap.. 2018;72:431-439.
- [CrossRef] [Google Scholar]
- An efficient electrochemical sensor based on CeVO4-CuWO4 nanocomposite for methyldopa. Mater. Res. Express. 2021;8:085001
- [CrossRef] [Google Scholar]
- B. Hatamluyi, Z. Es’haghi, F. Modarres Zahed, M. Darroudi, A novel electrochemical sensor based on GQDs-PANI/ZnO-NCs modified glassy carbon electrode for simultaneous determination of Irinotecan and 5-Fluorouracil in biological samples, Sensors Actuators B Chem. 286 (2019) 540–549. doi:https://doi.org/10.1016/j.snb.2019.02.017.
- Electrochemical behavior of 5-fluorouracil on a glassy carbon electrode modified with bromothymol blue and multi-walled carbon nanotubes. Anal. Methods. 2013;5:2470-2476.
- [CrossRef] [Google Scholar]
- Effective adsorptive removal of riboflavin (RF) over activated carbon. AIP Conf. Proc.. 2022;2386:030030
- [CrossRef] [Google Scholar]
- Spectrofluorimetric determination of 5-fluorouracil by fluorescence quenching of 9-anthracenecarboxylic acid, Spectrochim. Acta Part A Mol. Biomol. Spectrosc.. 2010;77:82-86.
- [CrossRef] [Google Scholar]
- Novel graphene-nanoclay hybrid electrodes for electrochemical determination of theophylline. Microchem. J.. 2021;165:106115
- [CrossRef] [Google Scholar]
- Fabrication of nanoclay-modified electrodes and their use as an effective electrochemical sensor for biomedical applications. J. Mol. Liq.. 2022;351:118583
- [CrossRef] [Google Scholar]
- A sensitive electrochemical DNA biosensor for antineoplastic drug 5-fluorouracil based on glassy carbon electrode modified with poly(bromocresol purple) Talanta. 2015;144:793-800.
- [CrossRef] [Google Scholar]
- Highly sensitive method for the determination of 5-fluorouracil in biological samples in the presence of 2’-deoxy-5-fluorouridine by gas chromatography—mass spectrometry. J. Chromatogr. B Biomed. Sci. Appl.. 1991;564:137-145.
- [CrossRef] [Google Scholar]
- K.K. Kumar, D. M, P.S. Kumar, R.S. Babu, S.S. Narayanan, Green synthesis of curcumin-silver nanoparticle and its modified electrode assisted amperometric sensor for the determination of paracetamol, Chemosphere. 303 (2022) 134994. doi:https://doi.org/10.1016/j.chemosphere.2022.134994
- General expression of the linear potential sweep voltammogram in the case of diffusionless electrochemical systems. J. Electroanal. Chem. Interfacial Electrochem.. 1979;101:19-28.
- [CrossRef] [Google Scholar]
- Upcycling fruit peel waste into a green reductant to reduce graphene oxide for fabricating an electrochemical sensing platform for sulfamethoxazole determination in aquatic environments. Sci. Total Environ.. 2022;812:152273
- [CrossRef] [Google Scholar]
- Simultaneous determination of the novel anti-tumor candidate drug MDH-7 and 5-fluorouracil in rat plasma by LC-MS/MS: Application to pharmacokinetic interactions. J. Chromatogr. B. 2018;1095:235-240.
- [CrossRef] [Google Scholar]
- Porphyran-capped gold nanoparticles modified carbon paste electrode: a simple and efficient electrochemical sensor for the sensitive determination of 5-fluorouracil. Appl. Surf. Sci.. 2018;427:742-753.
- [CrossRef] [Google Scholar]
- 5-Fluorouracil: mechanisms of action and clinical strategies. Nat. Rev. Cancer.. 2003;3:330-338.
- [CrossRef] [Google Scholar]
- Determination of 5-fluorouracil in microvolumes of human plasma by solvent extraction and high-performance liquid chromatography. J. Chromatogr. B Biomed. Sci. Appl.. 1999;735:293-297.
- [CrossRef] [Google Scholar]
- Synthesis and anticancer activity evaluation of novel ligand 2- [2 - (5-Chloro carboxy phenyl) Azo] 1-Methyl Imidazole (1-Mecpai) with some metal complexes. Systemat. Rev. Pharm.. 2020;11(12):1979-1987.
- [CrossRef] [Google Scholar]
- Synthesis, characterization and adsorption studies of a graphene oxide/polyacrylic acid nanocomposite hydrogel. NeuroQuantology. 2021;19(9):46-54.
- [CrossRef] [Google Scholar]
- Improved pechini sol-gel fabrication of Li2B4O7/NiO/Ni3(BO3)2 nanocomposites to advanced photocatalytic performance. Arab. J. Chem.. 2022;15(5):103768
- [CrossRef] [Google Scholar]
- S. Manavalan, P. Veerakumar, S.M. Chen, K.C. Lin, Three-dimensional zinc oxide nanostars anchored on graphene oxide for voltammetric determination of methyl parathion, Microchim. Acta 2019 1871. 187 (2019) 1–13. doi:10.1007/S00604-019-4031-3.
- Analysis of red and yellow ochre samples from Clearwell Caves and Çatalhöyük by vibrational spectroscopy and other techniques. Spectrochim. Acta - Part A Mol. Biomol. Spectrosc.. 2004;60:1179-1188.
- [CrossRef] [Google Scholar]
- Temperature-reversible switched antineoplastic drug 5-fluorouracil electrochemical sensor based on adaptable thermo-sensitive microgel encapsulated PEDOT. Sensors Actuators B Chem.. 2020;304:127361
- [CrossRef] [Google Scholar]
- A novel nanocomposite electrochemical sensor based on green synthesis of reduced graphene oxide/gold nanoparticles modified screen printed electrode for determination of tryptophan using response surface methodology approach. Microchem. J.. 2020;154:104634
- [CrossRef] [Google Scholar]
- Synthesis of Pt-SWCNTS conductive nanocomposite by microwave heated polyol strategy; application for amplification of 5-fluorouracil anticancer drug electrochemical sensor. Anal. Bioanal. Electrochem.. 2020;12:959-969.
- [Google Scholar]
- Electroanalytical method for the determination of 5-fluorouracil using a reduced graphene oxide/chitosan modified sensor. RSC Adv.. 2015;5:34292-34301.
- [CrossRef] [Google Scholar]
- Raman, surface enhanced raman spectroscopy, and DFT calculations: a powerful approach for the identification and characterization of 5-fluorouracil anticarcinogenic drug species. J. Phys. Chem. A. 2005;109:9945-9952.
- [CrossRef] [Google Scholar]
- Determination of 5-fluorouracil and 5-fluoro-2′-deoxyuridine-5′-monophosphate in pancreatic cancer cell line and other biological materials using capillary electrophoresis. J. Chromatogr. A. 2001;916:215-224.
- [CrossRef] [Google Scholar]
- Materials for wearable sensors, Wearable Phys. Chem. Biol. Sensors Fundam. Mater. Appl. 2022:5-40.
- [CrossRef] [Google Scholar]
- A modified sensitive carbon paste electrode for 5-fluorouracil based using a composite of praseodymium erbium tungstate. Microchem. J.. 2020;154:104654
- [CrossRef] [Google Scholar]
- Nanoscale microreactor-encapsulation of 18-membered decaaza macrocycle nickel(II) complexes. Inorg. Chem. Commun.. 2005;8(2):174-177.
- [CrossRef] [Google Scholar]
- Host (nanocavity of zeolite-Y)–guest (tetraaza[14]annulene copper(II) complexes) nanocomposite materials: synthesis, characterization and liquid phase oxidation of benzyl alcohol. J. Mol. Catal. A Chem.. 2006;245(1–2):192-199.
- [CrossRef] [Google Scholar]
- Flexible ligand synthesis, characterization and catalytic oxidation of cyclohexane with host (nanocavity of zeolite-Y)/guest (Mn(II), Co(II), Ni(II) and Cu(II) complexes of tetrahydro-salophen) nanocomposite materials. Micropor. Mesopor. Mater.. 2008;116(1–3):77-85.
- [CrossRef] [Google Scholar]
- Electrochemical behavior of c-type cytochromes at clay-modified carbon electrodes: a model for the interaction between proteins and soils. J. Electroanal. Chem.. 2000;493:37-49.
- [CrossRef] [Google Scholar]
- Biopolymer stabilized nanogold particles on carbon nanotube support as sensing platform for electrochemical detection of 5-fluorouracil in-vitro. Electrochim. Acta. 2015;178:608-616.
- [CrossRef] [Google Scholar]
- Hf-doped tungsten oxide nanorods as electrode materials for electrochemical detection of paracetamol and salbutamol. ACS Appl. Nano Mater.. 2022;5:1263-1275.
- [CrossRef] [Google Scholar]
- A. Sherlin V, X.B. Joseph, S.-F. Wang, J.N. Baby, M. George, Natural deep eutectic solvent assisted synthesis of FeMnO3 entrapped functionalized carbon nanofiber composite: An electrochemical detection of nimesulide, J. Mol. Liq. 367 (2022) 120421. doi:https://doi.org/10.1016/j.molliq.2022.120421
- A novel biosensor based on graphene oxide-nanoclay hybrid electrode for the detection of Theophylline for healthcare applications. Microchem. J.. 2019;149:103985
- [CrossRef] [Google Scholar]
- Novel nanoclay-based electrochemical sensor for highly efficient electrochemical sensing nimesulide. J. Phys. Chem. Solids. 2020;137:109210
- [CrossRef] [Google Scholar]
- Sensitive sensor based on TiO2NPs nano-composite for the rapid analysis of Zolpidem, a psychoactive drug with cancer-causing potential. Mater. Today Commun.. 2021;26:101945
- [CrossRef] [Google Scholar]
- R.G. State, J. (Koos) F. van Staden, R.N. State, F. Papa, Rapid and sensitive electrochemical determination of tartrazine in commercial food samples using IL/AuTiO2/GO composite modified carbon paste electrode, Food Chem. 385 (2022) 132616. doi:10.1016/J.FOODCHEM.2022.132616
- Palladium and silver nanoparticles embedded on zinc oxide nanostars for photocatalytic degradation of pesticides and herbicides. Chem. Eng. J.. 2021;410:128434
- [CrossRef] [Google Scholar]
- Zinc and sulfur codoped iron oxide nanocubes anchored on carbon nanotubes for the detection of antitubercular drug isoniazid. ACS Appl. Nano Mater.. 2021;4:4562-4575.
- [CrossRef] [Google Scholar]
- S. Wang, S. Fu, H. %J S.L. Ding, Determination of 5-fluorouracil using disposable gold nanoparticles modified screen-printed electrode, 10 (2012) 974–978
- Simultaneous determination of doxifluridine and 5-fluorouracil in monkey serum by high performance liquid chromatography with tandem mass spectrometry. J. Chromatogr. B. 2008;875:487-492.
- [CrossRef] [Google Scholar]
- Silver nanoparticles decorated polyaniline nanocomposite based electrochemical sensor for the determination of anticancer drug 5-fluorouracil. J. Pharm. Biomed. Anal.. 2018;161:12-19.
- [CrossRef] [Google Scholar]
- Manganese-doped ZnSe quantum dots as a probe for time-resolved fluorescence detection of 5-fluorouracil. Anal. Chem.. 2011;83:9076-9081.
- [CrossRef] [Google Scholar]
- A novel sensing platform for electrochemical detection of metronidazole antibiotic based on green-synthesized magnetic Fe3O4 nanoparticles. Environ. Res.. 2023;216:114643
- [CrossRef] [Google Scholar]


