

Translate this page into:
Selenium content in selected foods from the Saudi Arabia market and estimation of the daily intake
-
Received: ,
Accepted: ,
This article was originally published by Elsevier and was migrated to Scientific Scholar after the change of Publisher.
Abstract
This study was conducted to create a selenium database for the representative food items in Saudi diet and to estimate the dietary selenium intake of Saudi Arabians. Three samples for each food item selected were purchased from the markets. Each pooled sample was analyzed in triplicate by ICP–MS after thorough homogenization. The rich sources of selenium were meats (0.216–0.658 μg/g), eggs (0.226 μg/g) and cereals and cereals products (0.043–0.165 μg/g). Vegetables and fruits contained trace amounts of selenium (0.001–0.067 μg/g). The major food sources of selenium intake were cereals and cereals products (30.2%), legumes (24.7%) and meats (20%). The daily intake of Se was calculated taking into account the concentration of this element in the edible part and the daily consumption data which were derived from two sources, (a) the food balance sheet of KSA given by Food and Agriculture Organization (FAO) and (b) from questionnaires distributed among 200 families in Jeddah. The results showed that the daily intake of Se according to the two sources is 75.00–121.65 μg/person/day.
Keywords
Selenium
Determination
Food
ICP–MS

1 Introduction
The trace mineral selenium (Se) is an essential nutrient of fundamental importance to human health, but it is required only in small amounts (Thomson, 2004). Selenium is also toxic and, therefore, could cause selenium poisoning in humans and animals when intake exceeds the safe and adequate level (Hartikainen, 2005). Selenium is incorporated into proteins to make selenoproteins (Fragra, 2005), and several selenoproteins defend against oxidative stress (Goldhaber, 2003). Selenium deficiency can lead to heart disease, hypothyroidism and a weakened immune system (Combs, 2000; Ellis and Salt, 2003). Keshan disease and Kashin–Beck disease were found in China where the selenium content was very low in the soil (Cheng and Qian, 1990; Yang et al., 1993), while selenium has toxic effects in high amounts (Pappa et al., 2006). Chronic toxicity of selenium in humans results in selenosis, characterized by hair loss and nail brittleness, gastrointestinal problems, skin rash, ‘‘garlic-breath” odor and nervous system abnormalities (Yang et al., 1983; Yang and Zhou, 1994).
The dietary intake of selenium depends on its concentration in food and the amount of food consumed (Pappa et al., 2006). The selenium content of food varies depending on the content of the element in the soil where the animal was raised or the plant was grown (IOM, 1998; Uden et al., 2004; Barclay et al., 1995). Food is the main source of selenium for humans. In particular, meat and seafood are key sources, because animals require selenium, unlike plants (Klapec et al., 2004; Sirichakwal et al., 2005). The dietary intake of selenium varies considerably across populations around the world because of the large variability of the selenium content of foods (McNaughton and Marks, 2002). Therefore, it is necessary to monitor the selenium content in representative and widely consumed foods in each country.
Precise determination of selenium content in the food is quite important because there is a narrow margin of safety between adequate amount and overconsumption. To analyze trace selenium, there are various methods currently available (Foster and Sumar, 1995) including neutron activation analysis (Slejkovec et al., 2000), atomic fluorescence spectrometry (Pappa et al., 2006; Semenova et al., 2003; Tinggi et al., 1992), atomic absorption spectrometry (AAS) using either electrothermal atomization (Hussein and Bruggeman, 1999) or hydride generation method (Tinggi et al., 1992; Mindak and Dolan, 1999), and inductively coupled plasma spectrometry (ICP) (Kim et al., 1990; Masson et al., 2005; Featherstone et al., 2004) and ICP/mass spectrometry (MS) (Park and Kim, 2001). For this study, ICP–MS for the analysis of selenium has been optimized and applied because of the low detection limit and high efficiency.
In spite of many concerns about selenium intake, the data for the selenium in foods is very limited in Kingdom of Saudi Arabia. Therefore this study was carried out to produce a finite food selenium and to assess the dietary intake of selenium for the Saudi Arabian population in a limited manner based on the data from the food balance sheet of KSA given by Food and Agriculture Organization (FAO) and from questionnaire.
2 Experimental
2.1 Materials and methods
2.1.1 Food lists
Samples from local foodstuff of Saudi Arabia (KSA) were collected during January–February 2009.
Three kilograms of each fresh sample were collected from market in Jeddah in polyethylene container to avoid contamination.
The groups of food stuff studied are:
Cereals and Cereals products:
Wheat–Rice–Maize–Barley–Macaroni–Cookies–Cakes–Bread.
Legumes:
Broad Beans–Chick pea–Cowpea–Fenugreek seeds–Lentils–Peas garden.
Leafy vegetables:
Jews mallow–Spinach–Garden rocket–Lettuce–Parsley–Cabbage–Mint–Sweet basil.
Non-leafy vegetables:
Squash–Okra–Green pepper sweet–Eggplant (Black)–String beans–Cucumber–Cauliflower–Onions–Radish.
Tubers:
Potatoes–Sweet potatoes–Carrots.
Fruits:
Fresh dates–Dried dates–Oranges–Apples–Bananas–Grapes–Figs–Tomatoes–Mandarin–Pumpkin–Melon sweet–Mango.
Meats:
Chicken–Lamp–Beef–Camel–Fish.
Eggs:
Chicken eggs.
Fats and oils:
Butter–Corn oil–Margarine–Olive oil.
Milk and products dairy:
Cow milk powder–Cheddar cheese–Salted cheese–Sweet cheese–White cheese–Cream.
Nuts:
Almonds–Coconut–Hazel nuts–Peanut–Pine nuts–Pistachio nuts.
2.1.2 Sampling and preparation
For processed foods, those brands commanding a high share of the domestic market were purchased. Three samples for each food item were purchased from January to February 2009.
The samples were dried at 100 °C till constant weight and ground with special mills, with provision to prevent contamination (wearing parts made of aluminum and titanium), into a homogenous matter. A 150 g of the sample has been taken and stored in air-tight polyethylene bottles at −18 °C until analysis.
2.1.3 Chemical analysis
2.1.3.1 Apparatus and reagents
Double deionized distilled water of high quality used and all reagents were of analytical grade from (BDH). Measurements were done against metal standard solution specpure from Alfa–Aesar–Ubichem, England. All the vessels were washed with 10% (v/v) HNO3 and rinsed with deionized distilled water before use.
2.1.3.2 ICP–MS analysis
A portion (10 g) of finely ground sample was weighed precisely into a beaker and digested with 40 ml of nitric acid for 4 h by heating (150 °C) on a hot plate (PC-351, Corning Incorporated Life Sciences, Lowell, MA, USA). The same pretreatment procedure was repeated until the darkness of solution disappeared. After cooling, the digested solution was diluted with deionized distilled water and transferred to a 50-ml volumetric flask. The diluted solution was filtered through a filter paper into a plastic tube designed for the auto sampler of Agilent 4500 Series ICP–MS (Agilent, Palo Alto, CA, USA) that was used for the analysis of selenium content. Selenium concentrations of the samples were calculated from the regression line (r2 = 0.9998) obtained using selenium standard solution.
2.1.3.3 Estimation of dietary selenium intake
The selenium intake per person per day was estimated by the food balance sheet of KSA given by Food and Agriculture Organization (FAO) and from questionnaire which was distributed among two hundred families in Jeddah. The answer on the quantities of food they consumed indigently of financial situation were collected and the mean values were calculated.
3 Results
The number of selected food items in each food group was as follows: cereals and cereals products (n = 8), legumes (n = 6), leafy vegetables (n = 8), non-leafy vegetables (n = 9), tubers (n = 3), fruits (n = 12), meats (n = 5), eggs (n = 1), fats and oils (n = 4), milk and products dairy (n = 6) and nuts (n = 6).
An analytical quality assurance test was performed. Then, the results obtained were compared with the results obtained from the standard reference material and they were satisfactory (recovery: 101.5%). The instrumental quantitative detection limit of selenium was 0.3 ng. Selenium content in various foods is shown in Table 1. The highest values were found in meats (0.216–0.658 μg/g), eggs (0.226 μg/g), and cereals and cereals products (0.043–0.165 μg/g). Legumes (0.220–0.045 μg/g), fruits (0.004–0.032 μg/g), vegetables (0.001–0.067 μg/g), tubers (0.001–0002 μg/g), fats and oils (0.002–0.007 μg/g), milk and dairy products (0.024–0.039 μg/g) and nuts (0.015–0.145 μg/g) contained very low levels of selenium.
| No. | Kind of food | Sample | Concentration (μg/g ± S.D.) |
|---|---|---|---|
| 1 | Cereals and cereals products | Wheat | 0.165 ± 0.0012 |
| 2 | Rice | 0.072 ± 0.0004 | |
| 3 | Maize | 0.110 ± 0.0085 | |
| 4 | Barley | 0.069 ± 0.0029 | |
| 5 | Macaroni | 0.043 ± 0.0013 | |
| 6 | Cookies | 0.124 ± 0.0242 | |
| 7 | Cakes | 0.108 ± 0.0512 | |
| 8 | Bread | 0.052 ± 0.0041 | |
| 9 | Legumes | Broad beans | 0.031 ± 0.0056 |
| 10 | Chick pea | 0.029 ± 0.0044 | |
| 11 | Cowpea | 0.045 ± 0.0092 | |
| 12 | Fenugreek seeds | 0.022 ± 0.0029 | |
| 13 | Lentils | 0.076 ± 0.0043 | |
| 14 | Peas garden | 0.037 ± 0.0091 | |
| 15 | Leafy vegetables | Jew’s mallow | 0.011 ± 0.0032 |
| 16 | Spinach | 0.007 ± 0.0002 | |
| 17 | Garden rocket | 0.006 ± 0.0008 | |
| 18 | Lettuce | 0.010 ± 0.0042 | |
| 19 | Parsley curly | 0.007 ± 0.0005 | |
| 20 | Cabbage | 0.009 ± 0.0002 | |
| 21 | Mint | 0.014 ± 0.0027 | |
| 22 | Sweet basil | 0.011 ± 0.0019 | |
| 23 | Non-leafy vegetables | Squash | 0.032 ± 0.0023 |
| 24 | Okra | 0.027 ± 0.0018 | |
| 25 | Green pepper sweet | 0.052 ± 0.0016 | |
| 26 | Eggplant (black) | 0.067 ± 0.0024 | |
| 27 | String beans | 0.034 ± 0.0029 | |
| 28 | Cucumber | 0.021 ± 0.0007 | |
| 29 | Cauliflower | 0.025 ± 0.0009 | |
| 30 | Onions | 0.043 ± 0.0022 | |
| 31 | Radish | 0.033 ± 0.0013 | |
| 32 | Tubers | Potatoes white | 0.001 ± 0.0003 |
| 33 | Sweet potatoes | 0.001 ± 0.0002 | |
| 34 | Carrots | 0.002 ± 0.0004 | |
| 35 | Fruits | Fresh dates | 0.022 ± 0.0072 |
| 36 | Dates dried | 0.030 ± 0.0021 | |
| 37 | Oranges | 0.028 ± 0.0017 | |
| 38 | Apples | 0.011 ± 0.0044 | |
| 39 | Bananas | 0.024 ± 0.0019 | |
| 40 | Grapes | 0.023 ± 0.0026 | |
| 41 | Figs | 0.032 ± 0.0009 | |
| 42 | Tomatoes | 0.015 ± 0.0006 | |
| 43 | Mandarin | 0.009 ± 0.0001 | |
| 44 | Pumpkin | 0.012 ± 0.0011 | |
| 45 | Melon sweet | 0.004 ± 0.0008 | |
| 46 | Mango | 0.005 ± 0.0002 | |
| 47 | Meats | Chicken | 0.353 ± 0.0074 |
| 48 | Lamp | 0.425 ± 0.0053 | |
| 49 | Beef | 0.390 ± 0.0081 | |
| 50 | Camel | 0.216 ± 0.0029 | |
| 51 | Fish | 0.658 ± 0.0063 | |
| 52 | Eggs | Chicken eggs | 0.226 ± 0.0035 |
| 53 | Fats and oils | Butter | 0.005 ± 0.0002 |
| 54 | Corn oil | 0.007 ± 0.0002 | |
| 55 | Margarine | 0.002 ± 0.0005 | |
| 56 | Olive oil | 0.002 ± 0.0003 | |
| 57 | Milk and dairy products | Cow milk powder | 0.039 ± 0.0024 |
| 58 | Cheddar cheese | 0.033 ± 0.0027 | |
| 59 | Cheese salted | 0.035 ± 0.0032 | |
| 60 | Cheese sweet | 0.030 ± 0.0008 | |
| 61 | Cheese white | 0.031 ± 0.0017 | |
| 62 | Cream | 0.024 ± 0.0043 | |
| 63 | Nuts | Almonds | 0.015 ± 0.0019 |
| 64 | Coconut | 0.093 ± 0.0021 | |
| 65 | Hazel nuts | 0.047 ± 0.0028 | |
| 66 | Peanut | 0.145 ± 0.0063 | |
| 67 | Pine nuts | 0.102 ± 0.0082 | |
| 68 | Pistachio nuts | 0.036 ± 0.0017 | |
Considering the amount of food consumed, the major food sources of selenium intake for Saudi were cereals and cereals products (30.2%), legumes (24.7%), meats (20.3%), milk and dairy products (9.2%), eggs (6.9%), non-leafy vegetables (3.4%), leafy vegetables (2.8%), Fruits (1.2%), tubers (0.5%), fats and oils (0.5%) and nuts (0.3%) as shown in (Fig. 1). The selenium intake of the Saudi Arabia population was estimated by multiplying the mean intake of each food item by the selenium content in each food.
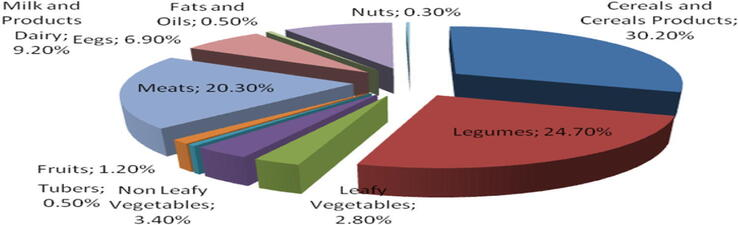
- The contribution of food group on selenium intake of Saudi Arabian (% of total estimated selenium intake).
As a result, the estimated selenium intake of Saudi Arabia was 121.65 μg/person/day by using food balance sheet of KSA FAO (1994–1996) The results which are shown in Table 2 reflect the Se daily intake according to the food balance of KSA shown by FAO and 75.00 μg/person/day by using questionnaire data as shown in Table 3. Results obtained were similar to the values reported for Netherlands, Japan, China, USA and Australia as seen in Table 4 which shows the estimated amounts of daily dietary selenium intakes in other countries.
| No. | Sample | Daily consumption of food (g) | Daily intake of Se (μg/person/day) |
|---|---|---|---|
| 1 | Chicken meat | 78.10 | 27.579 |
| 2 | Lamb meat | 20.80 | 8.840 |
| 3 | Beef meat | 11.80 | 4.602 |
| 4 | Camel meat | 6.50 | 1.404 |
| 5 | Fish meat | 17.80 | 11.712 |
| 6 | Vegetables | 289.50 | 6.948 |
| 7 | Potatoes | 47.60 | 0.048 |
| 8 | Carrots | 0.26 | 0.005 |
| 9 | Mandarins | 56.00 | 0.504 |
| 10 | Dry dates | 74.70 | 2.241 |
| 11 | Pumpkin | 16.40 | 0.197 |
| 12 | Tomatoes | 82.50 | 1.238 |
| 13 | Wheat | 332.00 | 54.780 |
| 14 | White cheese | 50.00 | 1.550 |
| Sum | 121.648 |
| No. | Kind of food | Daily consumption of food (g) | Daily intake of Se (μg/person/day) |
|---|---|---|---|
| 1 | Cereals and cereals products | 78.10 | 27.579 |
| 2 | Legumes | 20.80 | 8.840 |
| 3 | Leafy vegetables | 11.80 | 4.602 |
| 4 | Non-leafy vegetables | 6.50 | 1.404 |
| 5 | Tubers | 17.80 | 11.712 |
| 6 | Fruits | 289.50 | 6.948 |
| 7 | Meats | 47.60 | 0.048 |
| 8 | Eggs | 0.26 | 0.005 |
| 9 | Fats and oils | 56.00 | 0.504 |
| 10 | Milk and dairy products | 74.70 | 2.241 |
| 11 | Nuts | 16.40 | 0.197 |
| Sum | 75.00 | ||
| No. | Country | Se intake (μg/day) | References |
|---|---|---|---|
| 1 | Netherlands | 72 | Van Dokkum et al. (1989) |
| 2 | Sweden | 44 | Becker and Kumpulainen (1991) |
| 3 | Canada | 113–224 | Health Canada (1992) |
| 4 | Italy | 51 | Amodio-Cocchieri et al. (1995) |
| 5 | Japan | 129 | Hirai et al. (1996) |
| 6 | Egypt | 49 | Hussein and Bruggeman (1999) |
| 7 | UK | 29–39 | Food Standards Agency (2008) |
| 8 | China | 69 | Zang et al. (2001) |
| 9 | USA | 114 | Department of Health and Human Services (2002) |
| 10 | Australia | 58–85 | Food Standards Australia and Zealand (2003) |
| 11 | Greece | 39 | Pappa et al. (2006) |
| 12 | Korea | 57.5 | Choi et al. (2009) |
| 13 | Saudi Arabia | 75–122 | This study |
4 Discussion
The food and nutrition database is quite important for an accurate evaluation of nutrient intake from dietary intake surveys. Therefore, the selenium content database of the foods frequently consumed by Saudi people was developed for the estimation of selenium intake by them. Most animal foods such as fish, meats, and eggs have a high selenium content, which has previously been reported (Sirichakwal et al., 2005). On the other hand, vegetables and fruits are assumed to contain very low level of selenium unlike foods of animal origin, because selenium is not an essential element for the growth of plants as it is for animals (Klapec et al., 2004). Our data are similar to those of an Australian study, which reported selenium levels of 0.63 μg/g in fish and 0.38 μg/g in meats (McNaughton and Marks, 2002). Also similar to the reported study by Korean, which reported selenium levels of 0.448–0.788 μg/g in fish, 0.169–0.324 μg/g in meats, 0.267 μg/g in eggs, 0.043–0.216 μg/g in cereals, 0.006–0.052 μg/g in vegetables, 0.003–0.028 μg/g in fruits, 0.008 μg/g in fats and oils and 0.013–0.146 μg/g in nuts (Choi et al., 2009).
According to the database of the United States Department of Agriculture National Nutrient, foods with the high content of selenium are Brazil nuts (19.2 μg/g), wheat flour (0.71 μg/g) and barley (0.38 μg/g). Due to the presence of many types of food with higher selenium content in the United States than in Saudi Arabia, the selenium intake of the Americans is considered higher than that of Saudi Arabia. Recently, efforts have been made to increase the selenium content of plants by adding selenium to the soil; selenium-fortified food products can be found on Saudi Arabia markets.
In this study it was found that, the major food source of selenium intake in the Saudi Arabia diet was cereals and cereals products (30.2%) followed by legumes (24.7%) and meats (20.3%) (Fig. 1), because these groups are consumed in a very large amount by the Saudi.
Other studies have also reported that the major contributors to selenium intake are cereals and bakery products followed by fish and shellfish, meats and meat products, and dairy products (Gonzalez et al., 2006). Moreover, it has been pointed out in some reports that the heavy metals in fish interact with selenium, resulting in low bioavailability (Robinson and Tomson, 1983). Therefore, further study is necessary to consider the bioavailability of selenium in foods to correctly determine the bioavailable selenium intake value.
The estimated selenium intake of Saudi in this study was 75–122 μg/person/day, and this level was quite close to the recommended intake (72 μg/person/day, Van Dokkum et al., 1989), and 58–85 μg/person/day (Food Standards Australia and Zealand, 2003). More detailed estimation of selenium intake by merging selenium content data with individuals’ food intake data would be necessary to develop a nutrition program tailored for the particular needs of specific group. This was not attempted because it goes beyond the scope of this study.
Comparing to the cases of other countries, the selenium intake of Saudi falls in the middle of ranges reported and is considerably lower than that of the Canadian and Japanese and higher than Greece, Korea, UK, Egypt, Italy and Sweden (Table 4). Before comparing the intake levels among different countries, it is necessary to reach a consensus on the issues such as standard principles or criteria for matching of food items of different countries.
5 Conclusions
By analyzing the selenium content in representative food items in Saudi Arabia, a selenium database was made on a limited scale. The food balance sheet of KSA given by Food and Agriculture Organization (FAO) were utilized to select foods for analysis. Wheat, meat and vegetables turned out to be the major sources of selenium for Saudi.


