

Translate this page into:
Significance of transparent exopolymer particles derived from aquatic algae in membrane fouling
⁎Corresponding author at: State Key Laboratory of Separation Membranes and Membrane Processes, Tianjin Polytechnic University, 300387, China. mashi7822@163.com (Liang Wang)
-
Received: ,
Accepted: ,
This article was originally published by Elsevier and was migrated to Scientific Scholar after the change of Publisher.
Peer review under responsibility of King Saud University.
Abstract
In recent years, Transparent exopolymer particles(TEPs) have been identified as significant contributors to membrane surface biofouling. Reported research on the effect of TEPs on membrane fouling has mainly focused on algae-derived TEPs in the ocean, and very limited investigations have been conducted on those in freshwater systems. In this study, we investigated the characteristics of TEPs derived from Microcystis aeruginosa and their influence on membrane fouling in an ultrafiltration (UF) system. The results indicated that bound TEPs could lead to more serious membrane fouling while free TEPs caused more serious irreversible membrane fouling. Further studies showed that in free TEP solutions, small-sized colloidal TEPs (c-TEPs) rather than large-sized particle TEPs (p-TEPs) showed a significantly positive correlation with irreversible membrane fouling. The presence of Ca2+ ions in influent water can reduce membrane fouling to some extent since a low concentration of Ca2+ ions (1 mM) can lead to the transformation of most free TEPs from the colloidal to particulate state. Both acidic and alkaline environments of free TEP solutions result in more serious membrane fouling compared to a neutral environment of free TEP solution. The negative impact of the acidic environment on membrane fouling was more significant than that of the alkaline environment. The abovementioned results show that when using a UF system to filter water with high algal content, greater attention should be paid to free TEPs, especially those in the colloidal state, because they can cause serious, irreversible membrane fouling.
Keywords
Ultrafiltration (UF)
Membrane fouling
TEPs
Algae
Drinking water

1 Introduction
Ultrafiltration (UF) is widely applied in drinking water treatment plants but the proliferation of algae producing a lot of organic matter causes serious membrane fouling in UF systems (Wan et al., 2019). TEPs are typical organic matters in algae, contributing greatly to membrane biofouling in water treatment systems (Nagaraj et al., 2018). They are a class of extracellular polymeric substances secreted by phytoplankton and bacteria that can be stained by Alcian blue, and their main component is acidic polysaccharide (Lee et al., 2015). However, owing to their function of adsorbing and condensing other organisms and organic substances, TEPs are also contaminated with other organic substances such as proteins (Berman and Viner-Mozzini, 2001, Passow, 2002). The results of on-site monitoring indicate that the concentration of TEPs is usually associated with algal blooms. Therefore, during algal bloom outbreaks, the proliferation of algae leads to significant increases in TEP concentration (Huang et al., 2016). In general, TEPs can be classified as bound TEPs or free TEPs based on whether or not the particles attach to algae cells. In other words, free TEPs exist in solution but bound TEPs bind to algae cells (Bar-Zeev et al., 2015, Villacorte et al., 2015). TEPs can also be classified as colloidal TEPs (c-TEPs, 0.05–0.4 μm) or particulate TEPs (p-TEP, >0.4 μm) according to their size, and one form transforms into the other under certain conditions (Villacorte et al., 2009).
Lee et al. used a model wastewater based on the secondary effluent quality of Californian wastewater treatment plants and determined that TEPs played an extremely important role in the initial stage of reverse osmosis membrane fouling (Lee et al., 2015). This is because TEPs are highly viscous materials with viscosity generally greater than 0.1 Pa∙s. Logan et al. also estimated that the viscosity of TEPs in seawater was as high as 0.21 Pa∙s (Logan et al., 1995). TEPs are about 2–4 orders of magnitude stickier than phytoplankton or mineral particles, have a high probability of attachment upon collision, and are likely to play an important role in particle aggregation in open water (Mari and Dam, 2004, Verdugo et al., 2004, Villacorte et al., 2017). The high viscosity of TEPs in membrane bioreactors makes them easy to adhere to the UF membranes (Dhakal et al., 2018). Once the TEPs are fixed to the membrane, they become a scaffold between the organism and membrane, forming a stable 3D structure and rendering the entire biofilm firmer (Lin et al., 2019). At the same time, TEPs have high carbon, nitrogen, and phosphorus contents, and an average carbon to nitrogen ratio of 26, which provide ideal attachment surface, refuge, and adequate nutrients for the growth of algae (Passow, 2002). The algae then begin to proliferate and aggregate, eventually leading to membrane biofouling (Passow, 2002, Van Nevel et al., 2012, Villacorte et al., 2017). It can be seen that the presence of TEPs makes it difficult to clean and control a fouled UF membrane, thereby seriously reducing its service life (Berman et al., 2011, Discart et al., 2013, Villacorte et al., 2015). However, there are few reports on the effects of TEP types on UF membrane fouling during algal bloom outbreaks in drinking water treatment and the changes in the membrane fouling potential of TEPs owing to the transformation from one TEP type to another caused by environmental conditions.
The objective of this study was to investigate the effects of the different types of TEPs derived from freshwater algae on UF membrane fouling, especially irreversible membrane fouling. The correlations between the different types of TEPs and irreversible membrane fouling were analyzed. The influences of Ca2+ ion concentration and pH on the transformation of the different types of TEPs and on the membrane fouling potential of influent water were investigated.
2 Materials and methods
2.1 Selection and culture of algae
Microcystis aeruginosa (No. HB905) purchased from Freshwater Algae Culture Collection at the Institute of Hydrobiology (FACHB – collection) was used to obtain the TEP solution. The BG-11 culture was used for the cultivation of algae cells. A biochemical incubator was used to simulate the growth environment of algae. The culture temperature was set at 25 ± 0.5 °C and an illumination intensity of 2000 lux was provided with a regular regimen of alternating light and darkness (12 h of light and 12 h of darkness).
2.2 TEP extraction and analysis
Centrifugation is a common method to obtain good separation of bacteria and medium in biotechnology. To separate TEP from M. aeruginosa solution, the culture solution was centrifuged at 10,000 rpm for 15 min, and the algae cells and medium were separated after incubation. After centrifugation, the TEPs in the supernatant were free TEPs while those in the sediment were bound TEPs (Nguyen Thi et al., 2017).
The TEPs were measured using a dye binding spectrophotometric assay developed by Passow and Alldredge (Passow and Alldredge, 1995). A certain volume of the supernatant was filtered to intercept TEPs on polycarbonate membranes of different pore sizes (0.05 μm or 0.4 μm) at 0.2 bar. It was then stained with 1 mL of Alcian blue dye, pre-filtered with a 0.2 μm membrane for 5 s and then filtered using 1 mL of deionized water. After the filtration was completed, the polycarbonate membrane was soaked in 80% H2SO4 for 2 h (Berman et al., 2011, Nguyen Thi et al., 2017). The absorbance of Alcian blue by the H2SO4 solution was measured using an ultraviolet spectrophotometer at a wavelength of 786 nm. A standard curve was prepared using xanthan gum as a substitute for TEPs, and the TEP concentration was calculated according to the standard curve (Fatibello et al., 2004).
2.3 Filtration test and membrane fouling analysis
2.3.1 Filtration tests
The UF membrane used in this study was a hollow fiber membrane of polyvinylidene fluoride (PVDF) with a molecular weight cut-off of 150 kDa and was provided by Motimo Membrane Inc. (Tianjin, China). A self-made membrane module with an effective filtration area of 10.367 cm2 was used in our experiment. Membrane filtration was carried out at constant flux (70 L/m2·h). A peristaltic pump was used to pump the influent water into the membrane reactor, whose effective volume was 1 L. During the operation, a U-type pressure manometer was used to record the transmembrane pressure (TMP) values. The hydraulic backwash flow rate was twice that of the influent water, and the backwash time was 1 min.
2.3.2 Measurement of membrane resistance
Kimura divided membrane resistance into four parts: total filtration resistance (Rt), intrinsic membrane resistance (Rm), reversible resistance (Rr), and irreversible resistance (Rir) (Drikas et al., 2009). Each part of the membrane resistance is calculated according to Darcy’s law as follows (Bai et al., 2013, Kimura et al., 2004):
2.4 Analytical methods
2.4.1 Determination of zeta potential and particle size
A laser particle size analyzer (ZetaSizer Nano-ZS90, Malvern) was used to measure the zeta potential and particle size of the water sample. The zeta potential can reflect the charge properties of organic matters, which can affect the interaction between pollutants and membrane surface. The particle size measuring range of the instrument was 1 nm–10 µm. A total of 3 mL of the water sample was used for each measurement. All measurements were repeated thrice and the results were averaged.
2.4.2 Confocal laser scanning microscopy
Confocal laser scanning microscopy (CLSM) is the latest technology being employed to detect bioluminescent signals. It is not only widely used for the qualitative and quantitative determination of fluorescence but also for live cell dynamic fluorescence detection, tissue cell tomography, 3D image reconstruction, and confocal image analysis (Park and Kim, 2019, Ruprecht et al., 2019, Tran et al., 2019). In this experiment, a confocal microscope (SP8, Leica, Germany) was used to observe the distributions of proteins and polysaccharides on the surface of the PVDF membrane. The fluorescent probes in this study were provided by Invitrogen, USA. During sample preparation, the fouled membrane was first stained with 0.1 mg/mL Concanavalin A (Con A) for about 30–45 min, then washed with phosphate buffer saline (PBS) thrice. Next, the membrane was transferred to 20 μm Alexa Fluor succinimidyl ester (AF 488) for 45–60 min and again washed with PBS thrice. The process of dyeing required protection from light (see Table 1).
Fluorescent probes
Excitation wavelengths/nm
Emission wavelengths/nm
Polysaccharides
Con A
543
545–600
Proteins
AF 488
488
505–530
3 Results and discussion
3.1 Effect of TEP types on membrane fouling
To investigate the effects of the two types of TEPs on UF membrane fouling, a series of filtration tests was carried out using free TEP and bound TEP solutions as influent water. The results are shown in Fig. 1. At a low concentration (1.0 mg Xeq L−1), the difference between the normalized TMPs caused by the bound and free TEP solutions was less pronounced, although the normalized TMP increased faster when bound TEP solution was used as the influent. However, as the influent TEP concentration increased, the normalized TMP caused by the bound TEP solution increased significantly faster and reached the maximum level sooner when compared with that caused by the free TEP solution. This may be because the high viscosity of TEPs allows them to immobilize algae cells on the membrane surface like glue when the bound TEP solution is filtered. The thickness of the filter cake layer formed on the membrane surface by the algae cells together with the TEPs is greater than the thickness of the filter cake layer formed by the free TEPs alone, thus resulting in higher filtration resistance.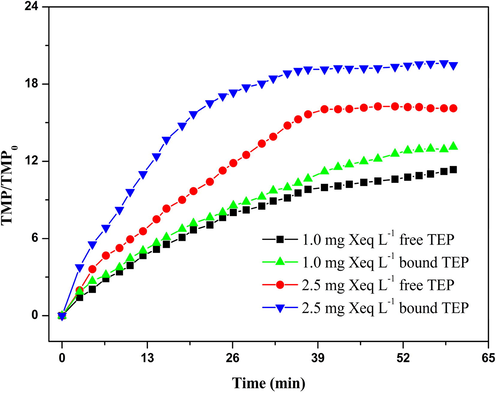
Membrane fouling caused by free and bound TEPs.
At the end of filtration, the flux recovery rates and membrane filtration resistance composition were analyzed (Fig. 2). The results in Fig. 2b suggested that at TEP concentrations of 1.0 mg Xeq L−1 and 2.5 mg Xeq L−1, the Rr (reversible resistance) values caused by the bound TEP solutions are 10.80% and 15.16%, respectively, higher than those caused by the free TEP solutions, indicating that at the same concentration, bound TEPs can lead to more serious reversible membrane fouling than free TEPs.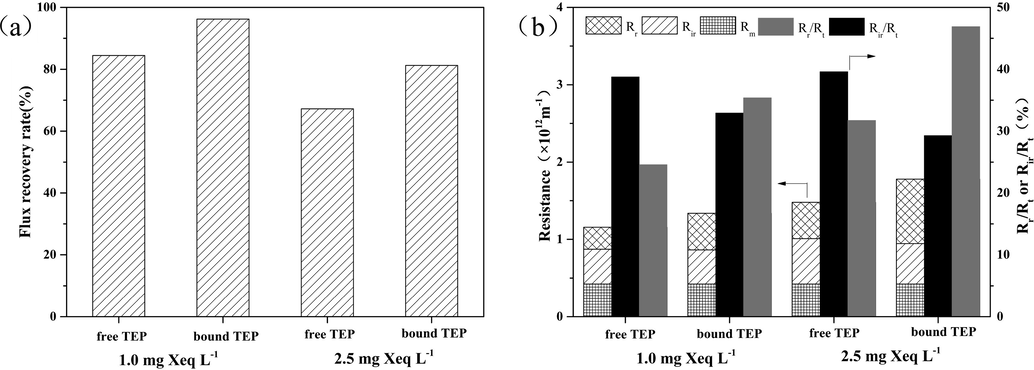
Comparison of irreversible membrane fouling caused by free TEPs and bound TEPs: (a) resistance composition at the end of filtration; (b) flux recovery rates after hydraulic backwash.
However, at a concentration of 1.0 mg Xeq L−1, the Rir (irreversible resistance) values of the bound TEP and free TEP solutions accounted for 32.93% and 38.78%, respectively, of their total resistances. At a concentration of 2.5 mg Xeq L−1, the Rir values caused by the bound TEP and free TEP solutions accounted for 29.29% and 39.60%, respectively, of their total resistances. This indicated that at the same concentration, free TEPs caused more serious irreversible membrane fouling than that caused by bound TEPs. The values of flux recovery rates after backwashing also confirmed this conclusion. As shown in Fig. 2a, the flux recovery rate of the UF membrane contaminated by free TEP solution was 11.76% lower than that of bound TEP solution at a concentration of 1.0 mg Xeq L−1 TEPs, and was 14.03% lower than that of bound TEP solution at 2.5 mg Xeq L−1 TEP concentration. The results also demonstrated that the irreversible membrane fouling caused by free TEPs was more serious compared to bound TEPs.
Free TEP and bound TEP solutions of five different concentrations were selected as the influents in the UF experiments, at the end of which the corresponding values of Rir were tested and calculated. The correlation between TEP concentration and the corresponding Rir value was analyzed in the case of both free and bound TEPs (Fig. 3). A comparatively weaker correlation between bound TEP and Rir was obtained. In contrast, a significantly positive correlation between free TEP and Rir was found, and the corresponding value of R2 was as high as 0.9974. This further confirmed that free TEP was the main factor leading to the irreversible fouling of algal-polluted membranes in the treatment of water with high algal content. The bound TEPs were tightly bound to the algae cells (Leterme et al., 2016), and the M. aeruginosa cells are subglobose with diameters in the range 2–8 μm (Hadjoudja et al., 2010, Wilson et al., 2006), which are much larger than those of the membrane pores. As a result, while filtering algal water with a UF membrane, it was almost impossible for the bound TEPs to enter the membrane pores and they were instead trapped on the membrane surface and formed a cake layer. Compared with bound TEPs, free TEPs had no carrier and were easily deformed as a result of filter pressure; some free TEPs larger than the membrane pores were deformed and squeezed into the membrane pores causing their blockage (Linares et al., 2012, Meng et al., 2013). It was very difficult to backwash these parts of TEPs and this caused severe irreversible membrane fouling. In contrast, the cake layer formed by bound TEPs could be more easily removed by backwashing than that formed by free TEPs, leading to lower irreversible membrane fouling by bound TEPs than by free TEPs.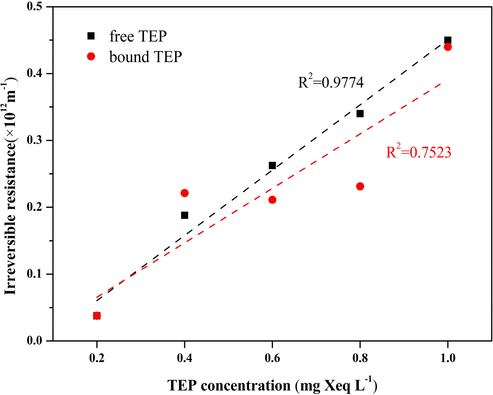
Linear relationship between TEP concentration and irreversible resistance.
3.2 Analysis of irreversible components of membrane surface foulants by CLSM
Free and bound TEP solutions, each with a concentration of 1.2 mg Xeq L−1, were used as the influents for the UF experiments. After 90 min of continuous filtration, the process was stopped and hydraulic backwash was applied. After backwashing, the membrane samples were withdrawn and dyed according to Section 2.4.2. To obtain the cross-section of the membrane, it was submerged into liquid nitrogen and fractured. The distribution of irreversible membrane foulants in the cross-section of the membrane was observed by CLSM, and the images are shown in Fig. 4. Since the main components of TEPs are acidic polysaccharides and proteins (Passow and Alldredge, 1995), their distributions in the cross-section of the membrane, as observed by CLSM, directly reflect the distributions of the TEP components. Fig. 4a and b reflect the composite distributions of polysaccharides and proteins in the membrane cross-section caused by the free TEPs and bound TEPs, respectively. Fig. 4c and d are the single-component distributions of polysaccharides, and Fig. 4e and f are the single-component distributions of proteins. Comparing Fig. 4a, c, and e with Fig. 4b, d, and f, respectively, it can be seen that the accumulation of polysaccharides and proteins in the membrane section contaminated with free TEPs is much higher than that in the membrane contaminated with bound TEPs. As the main component of TEPs, polysaccharides were found to be distributed across the entire cross-section of the membrane regardless of the type of TEP solution used as influent water. In the case of the membrane contaminated with free TEPs, the distribution of proteins in the membrane cross-section was similar to that of polysaccharides and occurred throughout the membrane section. However, in the case of the membrane contaminated with bound TEPs, proteins were distributed mainly in the sponge layer of the membrane section, and their accumulation was much lower than that in the membrane contaminated with free TEPs. Therefore, the fluorescence intensity and distribution in Fig. 4 demonstrated that the irreversible membrane fouling caused by free TEPs was more serious than that caused by bound TEPs.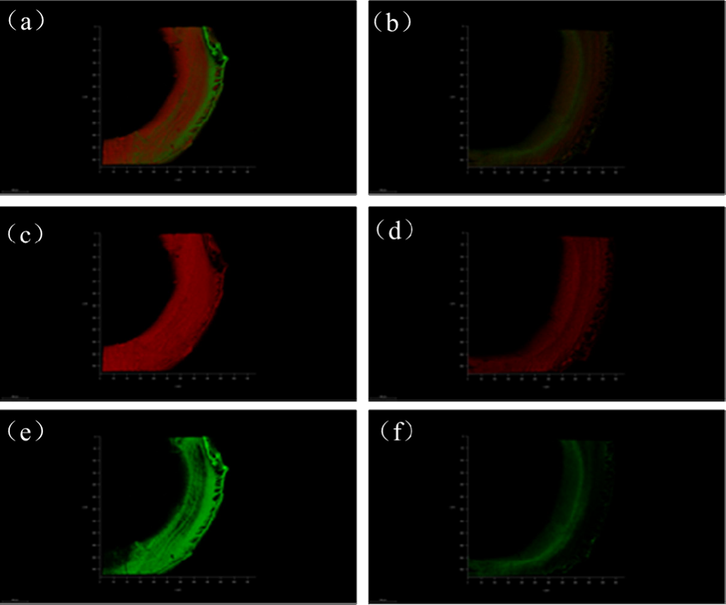
Accumulation and distribution of TEP components in membrane cross-section: (a), (c), and (e) UF membranes contaminated with free TEPs; and (b), (d), and (f) UF membranes contaminated with bound TEPs. Red for polysaccharide and green for protein.
3.3 Effect of Ca2+ ions on membrane fouling potential of free TEP solution
Studies have shown that the presence of Ca2+ ions in water may affect the morphology of free TEPs (Meng et al., 2015). In this study, Ca2+ ions in different concentrations were added to the free TEP solutions to carry out the UF experiments. As shown in Fig. 5, with increase in Ca2+ ion concentration in the influent water, the increase in normalized TMP gradually slowed. This indicated that the presence of Ca2+ ions alleviated the membrane fouling caused by free TEPs. This was attributed to the increase in the sizes of free TEPs caused by the addition of Ca2+ ions, whose presence can enhance the aggregation of colloids (Schäfer et al., 2000). The influence of Ca2+ ion concentration on the filtration resistance composition caused by free TEPs was analyzed (Fig. 5b). As the concentration of Ca2+ ions increased, the values of Rt, Rr, and Rir decreased. Following the addition of 1 mM Ca2+ ions, the values of Rt, Rr, and Rir decreased by 17.3%, 16.6%, and 15.6%, respectively, compared with the values obtained in the case of free TEPs without Ca2+ ions. Following the addition of 2 mM Ca2+ ions, the values of Rt, Rr, and Rir decreased by 19.2%, 24.2%, and 16.1%, respectively. Following the addition of 5 mM Ca2+ ions, the values of Rt, Rr, and Rir decreased by 22.3%, 26.2%, and 18.4%, respectively. This further proves that the presence of Ca2+ ions in water has a slowing effect on membrane fouling, and as the concentration of Ca2+ ions increases, the values of Rt, Rr, and Rir decrease, but the declining trend gradually decelerates.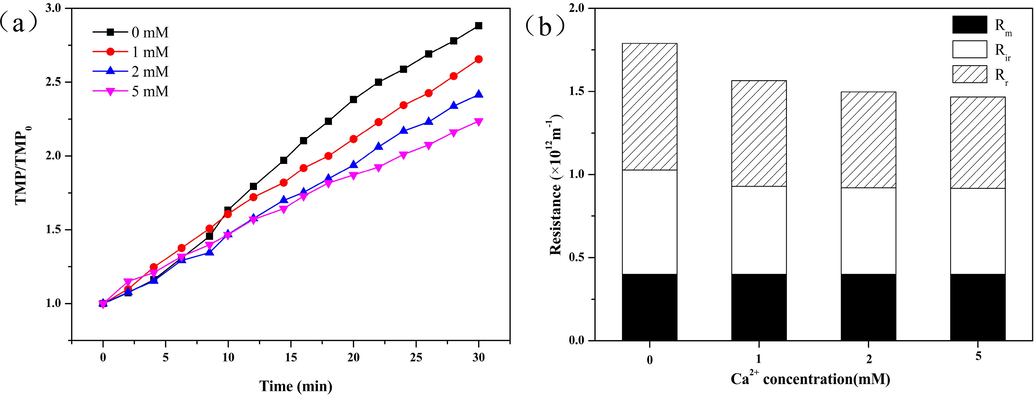
Influence of Ca2+ ion concentration on membrane fouling behavior of free TEPs: (a) TMP curves at different Ca2+ ion concentrations; and (b) Resistance composition at different Ca2+ ion concentrations. The concentration of TEP in the influent is 1.2 mg Xeq L−1.
To investigate the effect of Ca2+ ions on the particle size distribution of TEPs, Ca2+ ions in different concentrations were added to the free TEP solution, and the c-TEP and p-TEP concentrations of the solution were determined from the intercepts of the membrane staining-concentrated H2SO4 elution method. As shown in Fig. 6a, as the concentration of Ca2+ ions added increased, the concentration of c-TEPs in the free TEP solution decreased continuously, and the concentration of p-TEPs increased accordingly. The TEPs changed from colloidal to particulate state. The result indicated that the TEPs became larger, which may be owing to the aggregation characteristics of Ca2+ (Meng et al., 2015). However, when the Ca2+ ion dosage was higher than 2 mM, the decrease in c-TEP concentration as well as the corresponding increase in p-TEP concentration tended to taper off. This indicated that a low concentration of Ca2+ ions could lead to the transformation of c-TEPs into p-TEPs.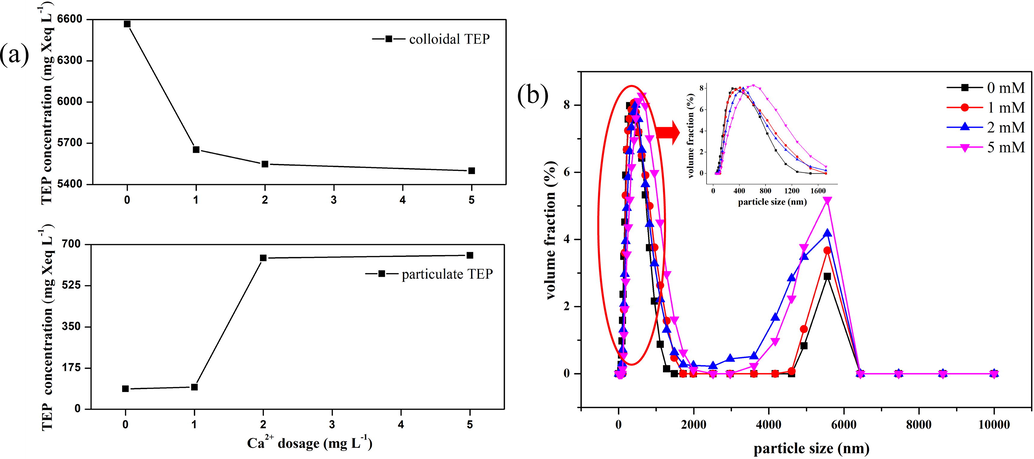
Effect of Ca2+ ion concentration on size of free TEPs: (a) Effect of Ca2+ ions on transformation of c-TEPs to p-TEPs, and (b) Effect of Ca2+ addition on size distribution of free TEPs.
The size distributions of free TEPs before and after Ca2+ ion addition were further analyzed, and the results are shown in Fig. 6b. In the absence of Ca2 + ions, the size distribution of free TEPs exhibited concentrations in the ranges 0.3–0.4 μm and 5–6 μm. After the addition of Ca2+ ions, the size distribution of small TEPs (0.3–0.4 μm) shifted to that of larger particles, and the median particle size in this interval increased. In particular, when 5 mM Ca2+ ions were added, the median particle size increased from 0.3 μm to 0.6 μm. In contrast, the addition of Ca2+ ions did not significantly offset the median particle size of TEPs with large size intervals (5–6 μm) but significantly increased their volume fraction. Especially, when the concentration of Ca2+ ions added was increased to 5 mM, the abundance of TEPs larger than 4 μm in diameter increased significantly. The change in TEP particle size distribution proved that the addition of Ca2+ ions did cause the aggregation of TEPs. It can be seen from the results of Fig. 6b that in the case of the small-sized TEP portion, when Ca2+ ions are not added, the median diameter of the free TEPs is 307.31 nm, and this increases to 410.40 nm after the addition of 1 mM Ca2+ ions. This means that when Ca2+ ions are not added, the small-sized TEP section is mainly distributed around 0.3 μm, which belongs to the c-TEPs. After the addition of 1 mM Ca2+ ions, the particle size distribution of the small-sized TEP section increases to 0.4 μm, indicating its conversion into p-TEPs. At the same time, the change in the particle size distribution curve also indicates that the addition of 1 mM Ca2+ ions completes the conversion of most c-TEPs to p-TEPs. The particle size distribution also indicates that the addition of 1 mM Ca2+ ions can lead to the transformation of most TEPs from colloidal state to particulate state, and with increase in Ca2+ ion concentration, the TEP fractions in the range 0.4–6 μm increases significantly. The results are consistent with the previous conclusion.
To clarify the mechanism of membrane fouling after the addition of Ca2+ ions, UF experiments were carried out with free TEP solutions of different concentrations as influents, and the c-TEPs and p-TEPs in the influents were quantitatively analyzed. Fig. 7 presents the correlations between the c-TEP/p-TEP concentrations and the corresponding Rir values. The linear correlation coefficients between the c-TEP/p-TEP concentrations and their corresponding Rir values are 0.9996 and −0.6576, respectively, which means that there is a significantly positive correlation between c-TEP concentration and irreversible pollution; the larger the proportion of c-TEPs in free TEPs, the more serious is the irreversible membrane fouling. There is a negative correlation between p-TEP concentration and irreversible membrane fouling, indicating that the larger the proportion of p-TEPs in free TEPs, the more beneficial it is to mitigate irreversible membrane fouling. This is because the size of the membrane pores in a UF system is similar to that of c-TEPs, which are more likely to block the membrane pores, while p-TEPs are more inclined than c-TEPs to adhere to the surface of the UF membrane, forming the filter cake layer, which makes it easier to remove them by backwashing.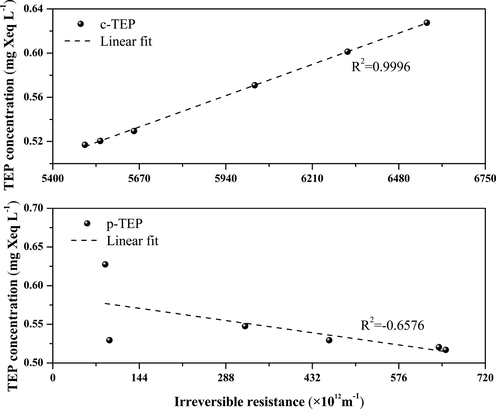
Correlation analysis of free TEP concentration with irreversible membrane fouling.
Thus, it can be seen that the addition of Ca2+ ions to the free TEP solution can alleviate membrane fouling because the presence of Ca2+ ions causes the aggregation of c-TEPs and their transformation to p-TEPs, leading to the reduction in the concentration of c-TEPs, which are the main cause of irreversible algal fouling, and thus reducing membrane fouling. However, with increase in Ca2+ ion concentration, the reduction in membrane fouling is no longer obvious, i.e., there is no significant difference between the additions of 1 mM Ca2+ ions and 2 mM or 5 mM Ca2+ ions in reducing membrane fouling. This is because most c-TEPs have been transformed into p-TEPs after the addition of 1 mM Ca2+, and the total amount of p-TEPs does not change significantly with further addition of Ca2+ ions. Therefore, with increase in Ca2+ ion concentration, the degree of reduction in membrane fouling is no longer significantly increased.
3.4 Effect of pH of free TEP solution on membrane fouling potential
To investigate the influence of pH on the membrane fouling potential of free TEP solution, acidic (pH = 4.15), alkaline (pH = 9.85), and neutral solutions (pH = 7.75) of free TEPs were used as influent water in the filtration experiments. The normalized TMP curves are shown in Fig. 8a. The results suggest that both acidic and alkaline environments significantly aggravate membrane fouling, but the degree of membrane fouling caused by free TEPs under alkaline conditions is significantly lower than that under acidic conditions. Fig. 8b shows the effect of pH on the change in the particle size of free TEPs. In an acidic environment, the particle size of TEPs increases significantly, and the average particle size increases by 27.3% over that in the neutral condition. According to the previous conclusions, the increase in the particle size of free TEPs is beneficial to the retardation of membrane fouling. On the other hand, the absolute values of the zeta potentials of both free TEPs and the UF membrane surface significantly decrease under acidic conditions (Table 2), resulting in a significant decline of 41.7% in the repulsive force between the membrane surface and TEPs when compared with that under neutral conditions. The decline in repulsion makes it easier for the free TEPs to adhere to the membrane and aggravate membrane fouling. At the same time, this significant reduction in repulsive forces also offsets to some extent the positive impact of the larger TEP size on the reduction in membrane fouling. Finally, the membrane fouling caused by TEPs under acidic conditions is significantly intensified.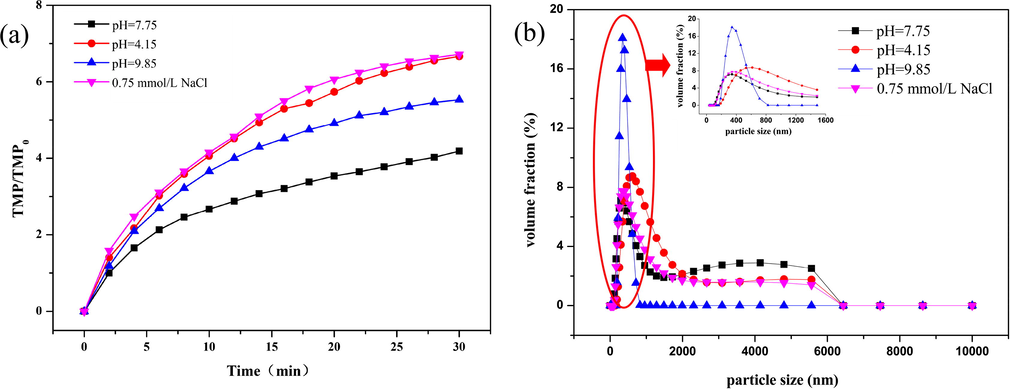
(a) Effect of pH on membrane fouling potential of free TEPs, and (b) Size distribution of free TEPs.
pH
Zeta potential (mV)
Particle size (nm)
TEP
UF membrane
TEP
7.75
−14.5
−79.19
451
TEP + HCl
4.15
−8.7
−46.41
574
TEP + NaOH
9.85
−16.1
−95.29
345
Under alkaline conditions, the absolute value of TEP charge increases (Table 2), repulsive force between TEPs increases, and the particles tends to disperse and do not gather easily. Although the median particle size of the TEPs remains unchanged, the average particle size decreases by 23.5% compared with that under neutral conditions. The TEPs are more concentrated in the median particle size of about 345 nm, which means that the c-TEP content of the solution increases under alkaline conditions, which may be the reason that alkaline TEP solution aggravates membrane fouling more than neutral TEP solution does. It should be noted that the alkaline TEP solution in this experiment was obtained by adding NaOH. Meng et al. found that adding Na2+ ions to a sodium alginate solution would affect TEP aggregation and reduce the size of TEPs (Meng and Liu, 2016). To further clarify the reasons leading to the reduction in TEP size, Na2+ (NaCl) equivalent to those in the alkaline TEP solution were added to the neutral TEP solution and the change in TEP particle size distribution was measured. The results showed that the addition of Na2+ ions did not cause significant change in TEP particle size in the case of algae-derived TEPs. Therefore, the reduction in TEP particle size in the alkaline environment can be mainly attributed to the electrostatic interaction between the TEP fractions caused by hydroxide.
On the other hand, the absolute value of charge on the UF membrane surface increased significantly under the alkaline condition, and the electrostatic repulsion between the membrane surface and TEP increased by 22.4% over that under the neutral condition. The increase in electrostatic repulsion is theoretically beneficial to reduction in membrane fouling (Meng and Liu, 2013). Therefore, the combined influences of electrostatic interaction and particle size change cause TEPs in an alkaline environment to aggravate membrane fouling more than those in a neutral environment but cause less membrane fouling than those in an acidic environment. It also indicates that the influence of the pH-induced zeta potential change on the membrane fouling potential of free TEPs appears to be greater than that of the particle size change of TEPs.
4 Conclusion
In this study, we investigated the effects of the different forms of TEPs on UF membrane fouling were analyzed, and the transformation from one form of TEP to another caused by Ca2+ ion addition and different pH environments and the corresponding membrane fouling potentials. The main conclusions are summarized as follows:
-
At a given concentration, bound TEPs can lead to more serious membrane fouling than that caused by free TEPs, but the latter cause more serious irreversible membrane fouling than the former.
-
The presence of Ca2+ ions in water can reduce membrane fouling to some extent, and the addition of 1 mM Ca2+ ions can lead to the transformation of most free TEPs from the colloidal to particulate state.
-
In free TEP solution, c-TEP concentration, rather than p-TEP concentration, shows a significantly positive correlation with irreversible membrane fouling.
-
Both alkaline and acidic environments of TEP solution can lead to more serious membrane fouling compared with the neutral environment, and the negative effects are more pronounced in an alkaline environment.
-
The influence of pH-induced zeta potential change on the membrane fouling potential of free TEPs appears to be greater than that of the particle size change of TEPs.
Acknowledgements
This work was financially supported by the National Natural Science Foundation of China (51678408, 51638011), the National Key Research and Development Program of China(2016YFC0400506), Natural Science Foundation of Tianjin of China (17JCQNJC07900), Tianjin Municipal Education Commission Research Plan Projects (TJPU2k20170112), and the China Scholarship Council (No. 201808120033).
Declaration of Competing Interest
The authors declared that there is no conflict of interest.
References
- Membrane fouling during ultrafiltration (UF) of surface water: effects of sludge discharge interval (SDI) Desalination. 2013;319:18-24.
- [Google Scholar]
- Transparent exopolymer particles: from aquatic environments and engineered systems to membrane biofouling. Environ. Sci. Technol.. 2015;49:691-707.
- [Google Scholar]
- Transparent exopolymer particles (TEP): a critical factor in aquatic biofilm initiation and fouling on filtration membranes. Desalination. 2011;276:184-190.
- [Google Scholar]
- Abundance and characteristics of polysaccharide and proteinaceous particles in Lake Kinneret. Aquat. Microb. Ecol.. 2001;24:255-264.
- [Google Scholar]
- Fouling of ultrafiltration membranes by organic matter generated by marine algal species. J. Membr. Sci.. 2018;555:418-428.
- [Google Scholar]
- Role of transparent exopolymeric particles in membrane fouling: chlorella vulgaris broth filtration. Bioresour. Technol.. 2013;129:18-25.
- [Google Scholar]
- Removal of MIB and geosmin using granular activated carbon with and without MIEX pre-treatment. Water Res.. 2009;43:5151-5159.
- [Google Scholar]
- A rapid spectrophotometric method for the determination of transparent exopolymer particles (TEP) in freshwater. Talanta. 2004;62:81-85.
- [Google Scholar]
- Cell surface characterisation of Microcystis aeruginosa and Chlorella vulgaris. J. Colloid Interface Sci.. 2010;342:293-299.
- [Google Scholar]
- Abundance, characteristics, and size spectra of transparent exopolymer particles and Coomassie stainable particles during spring in a large shallow lake, Taihu, China. J. Great Lakes Res.. 2016;42:455-463.
- [Google Scholar]
- Irreversible membrane fouling during ultrafiltration of surface water. Water Res.. 2004;38:3431-3441.
- [Google Scholar]
- Role of transparent exopolymer particles (TEP) in initial bacterial deposition and biofilm formation on reverse osmosis (RO) membrane. J. Membr. Sci.. 2015;494:25-31.
- [Google Scholar]
- The impact of diatoms on the biofouling of seawater reverse osmosis membranes in a model cross-flow system. Desalination. 2016;392:8-13.
- [Google Scholar]
- Effects of high turbidity seawater on removal of boron and transparent exopolymer particles by chemical oxo-precipitation. J. Taiwan Inst. Chem. Eng.. 2019;94:109-118.
- [Google Scholar]
- NOM and TEP fouling of a forward osmosis (FO) membrane: Foulant identification and cleaning. J. Membr. Sci.. 2012;421:217-224.
- [Google Scholar]
- Rapid formation and sedimentation of large aggregates is predictable from coagulation rates (half-lives) of transparent exopolymer particles (TEP) Deep Sea Res. Part II. 1995;42:203-214.
- [Google Scholar]
- Production, concentration, and isolation of transparent exopolymeric particles using paramagnetic functionalized microspheres. Limnol. Oceanogr.-Methods. 2004;2:13-24.
- [Google Scholar]
- New insights into transparent exopolymer particles (TEP) formation from precursor materials at various Na+/Ca2+ ratios. Sci. Rep.. 2016;6:19747.
- [Google Scholar]
- Transparent exopolymer particles (TEP) and their potential effect on membrane biofouling. Appl. Microbiol. Biotechnol.. 2013;97:5705-5710.
- [Google Scholar]
- Ultrafiltration behaviors of alginate blocks at various calcium concentrations. Water Res.. 2015;83:248-257.
- [Google Scholar]
- Alginate block fractions and their effects on membrane fouling. Water Res.. 2013;47:6618-6627.
- [Google Scholar]
- Review – Bacteria and their extracellular polymeric substances causing biofouling on seawater reverse osmosis desalination membranes. J. Environ. Manage.. 2018;223:586-599.
- [Google Scholar]
- Visualization and quantification of transparent exopolymer particles (TEP) in freshwater using an auto-imaging approach. Environ. Sci. Pollut. Res.. 2017;24:17358-17372.
- [Google Scholar]
- In vitro anti-inflammatory efficacy of Bambusae Caulis in Taeniam extract loaded in monoolein cubosomes. J. Ind. Eng. Chem.. 2019;77:189-197.
- [Google Scholar]
- Transparent exopolymer particles (TEP) in aquatic environments. Prog. Oceanogr.. 2002;55:287-333.
- [Google Scholar]
- A dye-binding assay for the spectrophotometric measurement of transparent exopolymer particles (TEP) Limnol. Oceanogr.. 1995;40:1326-1335.
- [Google Scholar]
- Improved identification of DNA double strand breaks:-H2AX-epitope visualization by confocal microscopy and 3D reconstructed images. Radiat. Environ. Biophys.. 2019;58:295-302.
- [Google Scholar]
- Microfiltration of colloids and natural organic matter. J. Membr. Sci.. 2000;171:151-172.
- [Google Scholar]
- Ex situ and in situ investigation of protein/exopolysaccharide complex in Porphyridium cruentum biomass resuspension. Algal Res. – Biomass Biofuels Bioprod.. 2019;41:10.
- [Google Scholar]
- Transparent exopolymer particle removal in different drinking water production centers. Water Res.. 2012;46:3603-3611.
- [Google Scholar]
- The oceanic gel phase: a bridge in the DOM-POM continuum. Mar. Chem.. 2004;92:67-85.
- [Google Scholar]
- Biofouling in capillary and spiral wound membranes facilitated by marine algal bloom. Desalination. 2017;424:74-84.
- [Google Scholar]
- Characterisation of algal organic matter produced by bloom-forming marine and freshwater algae. Water Res.. 2015;73:216-230.
- [Google Scholar]
- The fate of Transparent Exopolymer Particles (TEP) in integrated membrane systems: removal through pre-treatment processes and deposition on reverse osmosis membranes. Water Res.. 2009;43:5039-5052.
- [Google Scholar]
- Comparative study on the pretreatment of algae-laden water by UV/persulfate, UV/chlorine, and UV/H2O2: Variation of characteristics and alleviation of ultrafiltration membrane fouling. Water Res.. 2019;158:213-226.
- [Google Scholar]
- Intraspecific variation in growth and morphology of the bloom-forming cyanobacterium Microcystis aeruginosa. Appl. Environ. Microbiol.. 2006;72:7386-7389.
- [Google Scholar]


