

Translate this page into:
Silica, alumina and aluminosilicates as solid stationary phases in gas chromatography
⁎Corresponding author at: Egyptian Petroleum Research Institute, Nasr City, Cairo, Egypt. Tel.: +966 557468028. aynaggar361@yahoo.com (A.Y. El-Naggar)
-
Received: ,
Accepted: ,
This article was originally published by Elsevier and was migrated to Scientific Scholar after the change of Publisher.
Peer review under responsibility of King Saud University.
Abstract
Silica, alumina and Aluminosilicates of different Si/Al ratios were prepared by conventional precipitation or co-precipitation methods and then subjected to thermal treatment at 800 °C. The parent and thermally treated materials were characterized by means of FTIR, SEM and thermal analysis (DTA and TGA) in order to elucidate the main structural properties. Surface textural characteristics were investigated by means of nitrogen adsorption–desorption isotherms at −196 °C. Pore size distribution curves indicated the presence of mesopores (10–150 Å) exhibiting maxima at 35 Å. The maxima were shifted toward higher values by increasing the alumina content. Thermodynamic parameters, ΔH, ΔG and ΔS, were determined by means of inverse gas chromatography using n-hexane as a probe. The untreated and thermally treated materials were tested as solid stationary phases in gas chromatography. The separation efficiency of various non polar and polar compounds was explained in terms of surface texture and thermodynamic parameters.
Keywords
Silica–alumina
Thermal treatment
Gas chromatography

1 Introduction
Numerous scientific publications mention the use of silica or alumina as stationary phase in gas chromatography (Halpaap, 1973; Kiselev, 1970; Mikhail et al., 1979). Silica and alumina offer surface properties covering wide range of acidity, surface reactivity and pore structure (Mikhail et al., 1979; El-fadly et al., 1997; Faramawy et al., 1997). Silica gel is an amorphous form of SiO2 with a very porous structure and the surface of the hydrated silica is covered with hydroxyl groups which are attached to silicon atoms, and these surface hydroxyls may be classified into free and bound hydroxyl groups (Iller, 1979; Synderm and Ward, 1966). The activity of alumina is affected by two main factors, namely the chemical nature of the surface, which involves the number of hydroxyl groups and acid sites on the surface, as well as the texture of the solid, and the availability of various reactants to reach an active site which depends on the pore sizes and their distribution (Mikhail et al., 1979). These packing materials are characterized by the high selectivity, thermal stability and resistance to different external factors (Cagniant, 1992; Pool and Pool, 1992; Rykowska and Wasiak, 2000). The thermodynamic parameters of these packings form a good base to study interactions between solid stationary phases and the adsorbate molecules (El-Naggar and Turky, 2001; El-Naggar, 2006; Voelkel, 2009).
The presented work is devoted to different silica–alumina ratios and both their thermal treatment and their polymer coated. Such solid samples may be used as packings in gas chromatography. These modifications offer the additional advantages of improving separation and increasing peak capacity. The effect of different ratios of silica–alumina and the correlations between the types of modification and the surface characteristics (e.g., surface area, pore volume and pore radii) and gas chromatographic separation are studied in order to select the adequate stationary phase to elute the components of the mixture.
2 Experimental
2.1 Preparation of solid phases
The reagents used for the preparation are: Aluminium sulfate Al2(SO4)3–16H2O (Adwic), Sodium silicate (water glass; Winlab), Hydrochloric acid (Adwic) and Ammonium hydroxide (Adwic).
2.1.1 Preparation of alumina
Aluminium hydroxide was precipitated from 500 ml of 0.4 M aluminium sulfate using ammonium hydroxide (pH 12) as a precipitant. The hydroxide gel was then left to age overnight then freed from sulfate ions by decantation and washing several times with deionized water till the filtrate was sulfate free. Filtration was carried out using centered glass G-4. The filtrate was then dried at 110 °C to a constant weight. The produced pieces were crushed and sieved using sieves between (0.4–0.16 mm); the resulting sample mesh size was 35–80 mesh. The obtained solid was calcined at 250 °C.
2.1.2 Preparation of silica
Mesoporous silica was obtained from a solution of water glass containing ∼27 wt% sodium silicate using concentrated HCl as precipitating agent. Silicic acid was precipitated at pH ∼4. The precipitate was aged for 24 h, filtered and dried at 110 °C overnight. The solid obtained was washed with deionized water several times till the filtrate was chloride ion free. Then, silica gel was dried, crushed and sieved as mentioned above. The obtained silica gel was calcined at 250 °C.
2.1.3 Preparation of different silica–alumina ratios
The silica gel–alumina ratios were precipitated by the addition of aluminium sulfate solution (0.4 M) to sodium silicate solution (27 wt% Na2O–SiO2). Then, a complete precipitation was achieved using concentrated HCl as a precipitant. The precipitate was aged, filtered, washed and dried according to the procedure mentioned in the case of silica preparation. Also, the obtained solids were crushed, sieved and calcined in a similar manner. In this context, five solids of silica–alumina ratios were prepared using the same technique but with different weights of the raw materials aluminium sulfate and sodium silicate as given in Table 1.
% Silica expected
Parent solids
Thermally treated solids
Gravimetric analysis
% of Silica
% of Alumina
100% Alumina
Al
Al-T
—
100
10% Silica
AlSi(8)
AlSi(8)-T
8.0
92.0
30% Silica
AlSi(26)
AlSi(26)-T
26.0
74.0
50% Silica
AlSi(39)
AlSi(39)-T
39.0
61.0
70% Silica
AlSi(57)
AlSi(57)T
57.0
43.0
90% Silica
AlSi(77)
AlSi(77)-T
77.0
23.0
100% Silica
Si
Si-T
100
—
The hydro silica–alumina gel was precipitated by the same addition of sodium silicate to aluminium sulfate in the case of silica–alumina containing relative high alumina concentrations. Then, a complete precipitation was achieved using concentrated ammonium hydroxide solution (pH 12) as a precipitant. The precipitate was aged, filtered, washed and dried according to the procedure mentioned in the case of alumina preparation. Also, the obtained solids were crushed, sieved and calcined in a similar manner.
The precipitation of silica–alumina ratios, following the procedures mentioned above, could be different than those cited in the literature (de Boer, 1971; Yao et al., 2002). The obtained solids could exhibit some characteristics and textural properties which could be different than those of conventional silica, alumina or silica–alumina. This may reflect on their behaviors as solid stationary phases in gas chromatographic applications.
2.2 Methods of modification
2.2.1 Thermal Treatment
The above mentioned prepared samples were calcined in a muffle furnace at 800 °C for 18 h.
2.2.2 Coating with polyethylene glycol
The parent silica–alumina samples, when used as solid support, were coated with polyethylene glycol (Carbowax 20 M) as liquid stationary phase (El-Naggar and Turky, 2001; Aue et al., 1973). The parent samples were coated with layer thickness 25% (w/w) by a conventional technique of rotary evaporation. The polymer was dissolved in a suitable solvent (chloroform) and deposited on each parent sample by slow evaporation of the solvent with gentle stirring and heating in a rotary evaporation until complete evaporation of the chloroform. The coated samples were dried at 120 °C for 24 h. The coated samples were packed with the aid of a mechanical vibrator into stainless steel columns. The packed column was activated at moderate temperature (120–170 °C) in a stream of nitrogen according to the maximum recommended temperature of the used polymer.
2.3 Characterization of solid materials
2.3.1 Gravimetric analysis
Silica content in the samples was determined gravimetrically via dissolution of SiO2 in HF (Vogel, 1961).
2.3.2 Thermal analysis
Thermal analysis including themogravimetric analysis (TGA) and differential thermal analysis (DTA) of the studied samples, were carried out using Scimadzu apparatus with detector type Scimadzu TGA-50H (for TGA) and Schimadzu DTA-50H (for DTA). The instrument settings were as follows:
Cell
Platinum
Atmosphere
Nitrogen
Rate Flow
20.00 [ml/min
Temperature
From ambient to1200.0 °C
Heating Rate
10 °C/min
2.3.3 Scanning electron microscope (SEM)
SEM micrographs were carried out using equipment of JEOL (Japan) model JSM-5500. The samples were examined after gold plating was carried out. The magnification range was from 650 to 20,000.
2.3.4 Fourier transform infrared spectroscopy (FTIR)
The infrared spectra were obtained using FTIR-Perkin Elmer (USA)-Spectrum-I, Supplied with Selector Diffuse Reflectance (Specac) and Environmental Chamber (Specac). The samples were examined under vacuum at 150 °C for parent and thermally treated samples. The sample percent with KBr was kept constant (5% wt/wt).
2.3.5 Surface textural characteristics
Surface textural characteristics including surface area (SBET), pore volume, pore radius and pore size distribution, were measured using nitrogen adsorption technique at low temperature. The instrument used was Quantachrome-Nova 2000. The gas used was nitrogen, and bath temperature was 77.35oK.
The adsorbent was first thoroughly out gassed at 200 °C for 3 h to 10−5 Torr. Specific surface area was measured through the application of the BET (Brunauer, Emmett, and Teller) equation (Brunauer et al., 1938) in its normal range of applicability. The porosity was detected by applying the BJH (Barret, Joyner, and Halenda) method (Barrett et al., 1951).
2.4 Gas chromatography
All parent, modified and coated samples were tested in gas chromatography to evaluate their efficiency when used as a solid stationary phases. The gas chromatograph used was Agilent 6890+ (England) equipped with a flame ionization detector (FID). Temperature of both the detector and injector was maintained at 350 °C. Nitrogen was used as the mobile phase at optimum flow rate of 35 ml min−1.
The column used was a stainless steel tube of 2 m in length and 1/8 inch of internal diameter. The columns are first washed with dilute hydrochloric acid, then with deionized water and finally with acetone. The columns were then purged with dry air until complete dryness. The packing with the investigated samples inside the column was achieved under vacuum. The packed columns were activated at 300 °C for parent and thermally treated samples and at 200 °C for coated packed column under flow of nitrogen (30 ml min−1). The solutes used for chromatographic characterization were selected to cover the wide range of polarity such as natural gas, n-paraffin, aromatic hydrocarbons, n-alcohols and ketones as well as petroleum fraction (C6–C20). The polarity indices were assessed with respect to the reference non-polar column SE-30 (20% SE-30 on chromosorb W.A.W., 60–80 mesh).
2.5 Thermodynamic parameters (El-Naggar, 2006)
The thermodynamic parameters were measured from the retention chromatographic data obtained from the gas chromatography mentioned above as follows:-
n-hexane was injected at five different temperatures on the studied parent and modified stationary phases. The enthalpies ΔH were calculated from the relation between the logarithm of retention time and reciprocal of temperature. Accordingly, ΔH can be determined from the slope of this relation: where tm = retention time, R = linear velocity of zone, A = intestinal area of column, B = constant, F = gas velocity, and ΔH = The enthalpy.
The excess partial molar free energy of solution can be expressed as:- where T is the column temperature and Vg is the retention volume.
The entropy of solution can be calculated by knowing ΔH and ΔG from the relation: In this study, ΔH and ΔS are calculated at temperature 110 °C.
3 Results and Discussion
3.1 Gravimetric analysis
The prepared solids silica–alumina ratios were analyzed gravimetrically in order to elucidate their basic composition. The codes of abbreviations of the studied solids and the results of the analysis are given in Table 1. It is obvious that silica content is always lower than what is expected in the parent reaction mixture utilized in the preparation of the investigated solids, namely, aluminum sulfate and sodium silicate solutions. The decrease of silica content in the thermally pretreated samples as compared with the composition of the parent reaction mixture seemed to be dependent on the original silica precursor, ageing, and Al2O3 content in the reaction mixture.
The composition of the reaction mixture seemed to be critical toward the stability of hydrous gel which may be reflected on the silica content in the prepared silica–alumina samples.
3.2 Scanning electron microscopy
The objective of the analysis using SEM is to study the morphology of the silica–alumina samples. Fig. 1 shows the scanning electron micrograph, taken with a magnification order ranging from 650 to 20,000. The micrograph of alumina shows an amorphous phase containing different types of pores. These pores could cover a wide range of sizes. With respect to the silica sample, the micrograph indicates amorphous gel of non-porous material beside a slight porosity. For silica–alumina samples, it has been noticed that the porosity increases by increasing the alumina content.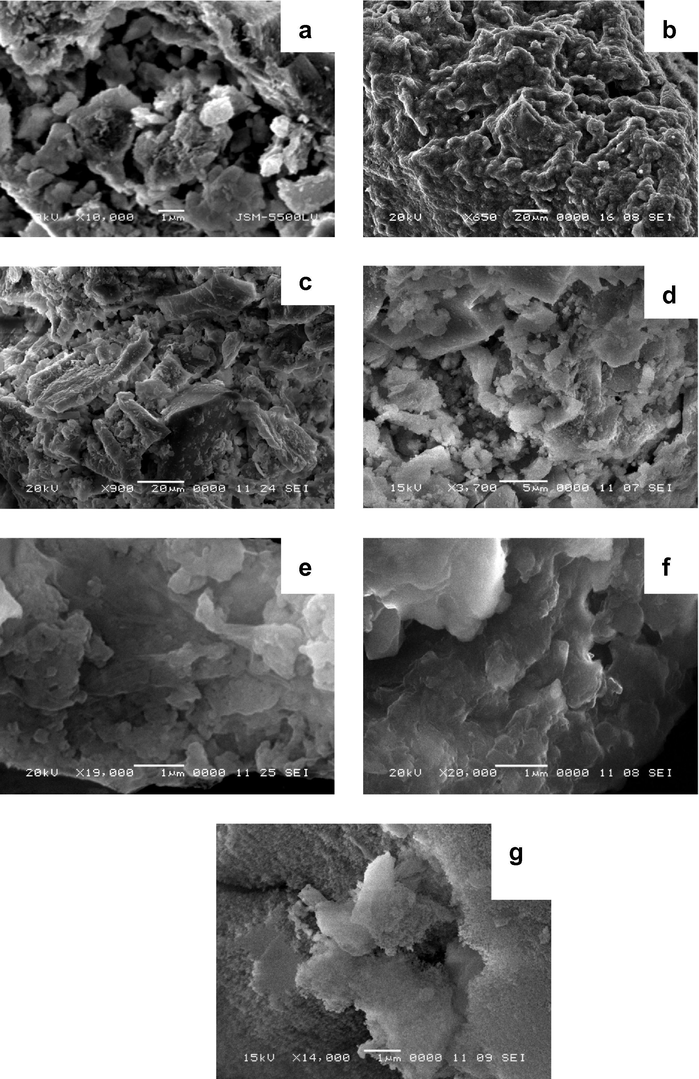
Scanning electron microscope micrographs for the parent samples namely: (a) Al; (b) AlSi(8); (c) AlSi(26); (d) AlSi(39); (e) AlSi(57); (f) AlSi(77); and (g) Si.
One may expect that the prepared samples give different surface textural properties which could reflect on their performance as solid stationary phases in gas chromatographic separation.
3.3 Fourier transform infrared (FTIR) spectroscopy Okkerse, 1970; Peri, 1965; Saravanan and Subramanian, 2005
The prepared, thermally treated and coated samples were subjected to FTIR spectroscopy. An example of spectra is shown in Fig. 2. Generally, the spectrum consists of two regions (hydroxyl group and structural regions). It was stated in the literature that the strength and abundance of the acidic surface OH groups play an important role on the adsorption properties of polar and non-polar solutes. Accordingly, we are reporting the changes that occurred in this region as a result of thermal treating and decreasing the silica content Fig. 3.![The spectra of parent [AlSi(39)], thermally treated [AlSi(39)-T], and polymer coated [AlSi(39)-P] samples.](/content/184/2016/9/1_suppl/img/10.1016_j.arabjc.2011.08.015-fig2.png)
The spectra of parent [AlSi(39)], thermally treated [AlSi(39)-T], and polymer coated [AlSi(39)-P] samples.
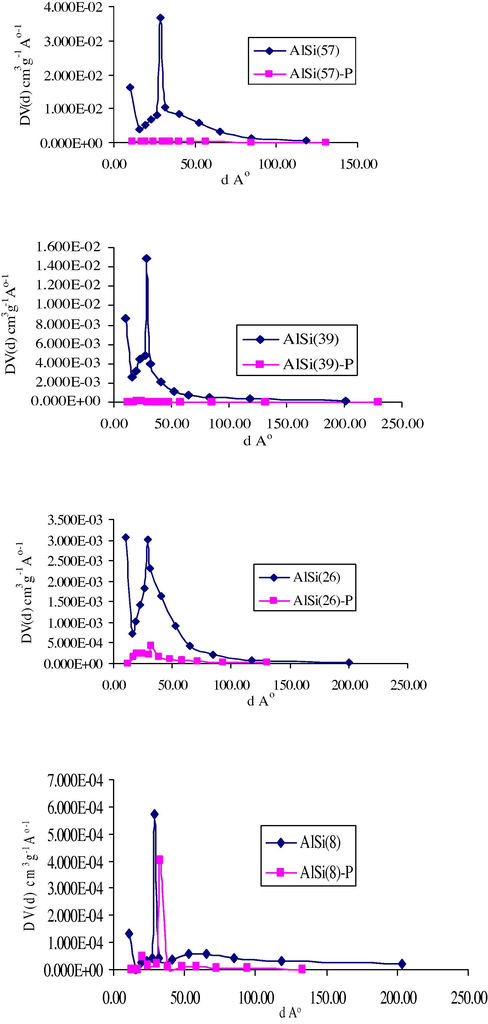
PSD for selected silica–alumina samples.
The spectrum of the coated silica–alumina sample exhibits additional peaks mainly at 1745 cm−1 assigned for polyethylene glycol.
3.4 Thermal analysis (DTA and TGA)
The parent samples were subjected to differential thermal analysis (DTA) and thermo-gravimetric analysis (TGA) to investigate changes that might occurr during thermal treatment. The temperature range adopted for this purpose was from ambient up to 1200 °C.
Generally, the all studied treated and untreated solid samples are stable at the working chromatographic temperature 300 °C except the coated ones at only 225 °C which is the maximum recommended temperature of the poly ethylene glycols. The DTA thermograms reveal endothermic peaks at 345 °C and 380 °C, which are due to dehydration of hydroxide. And any exothermic peaks are due to the solid phase change.
3.5 Surface textural properties
The adsorption–desorption isotherms of nitrogen at −196 °C obtained on the treated and untreated silica–alumina samples, were of type IV isotherm according to Brunaure et al. classification (Brunauer et al., 1940). The observed hysteresis of the isotherm for all samples indicates the mesoporosity character. It was observed that, in some cases the internal area in the hyteresis is opened, this may be due to swelling of the adsorbent in the course of adsorption (Sing, 2001). The adsorption data are summarized in Tables 2–4, the Results including surface area (S), pore volume (Vp), pore radius (
) and BET-C constant estimated from the saturation values of adsorption isotherms.
Sample ID
Vp (cm3 g−1)
SBET(m2 g−1)
(Ao)
BET-C
Al
0.033
19.814
33.310
61.306
AlSi(8)
0.011
3.736
58.893
144.457
AlSi(26)
0.089
76.283
23.334
81.857
AlSi(39)
0.194
182.125
21.304
80.000
AlSi(57)
0.476
401.009
23.740
109.000
AlSi(77)
0.155
118.455
26.170
92.250
Si
0.064
12.302
104.050
145.490
Sample ID
Vp (cm3 g−1)
SBET (m2 g−1)
(Ao)
BET-C
Al-T
0.184
88.841
41.422
164.000
AlSi(8)-T
0.204
85.706
47.605
255.000
AlSi(26)-T
0.167
109.275
30.565
100.000
AlSi(39)-T
0.160
117.185
27.307
62.167
AlSi(57)T
0.194
163.097
23.790
67.000
AlSi(77)-T
0.100
39.379
50.789
158.149
Si-T
0.005
5.125
19.510
4.211
Sample ID
Vp (cm3 g−1)
SBET (m2 g−1)
(Ao)
BET-C
Al-P
0.004
2.846
28.109
5.644
AlSi(8)-P
0.001
0.681
29.379
3.332
AlSi(26)-P
0.010
8.458
23.647
4.016
AlSi(39)-P
0.032
2.261
283.088
5.896
AlSi(57)-P
0.034
12.743
53.100
26.589
AlSi(77)-P
0.311
55.895
111.280
87.545
Si–P
0.006
4.434
27.067
4.082
From the results, the surface areas and pore volume of alumina and silica are much lower than those of the silica–alumina solids. Moreover, the sample containing 57 wt% SiO2 exhibits the maximum values of surface area and pore volume. The major phase of this solid is porous silica–alumina. In contrast, the other silica–alumina samples contain a considerable portion of either free alumina or free silica. In conclusion, the combination of alumina and silica forming silica–alumina, upon precipitation and heat treatment, improves the surface textural properties as a porous solid support.
For thermally treated samples, alumina and alumina-rich samples showed an increase of surface area and pore volume. This is due to the dehydration of aluminium hydroxide and dehydrated alumina during calcinations. This leads to the formation of a well known porous alumina solid. For silica and silica-rich sample, the surface area and pore volume decrease after thermal treatment. This may due to deformation of polymeric structure of silica via removing of hydroxyl groups. It was stated in the literature that the removal of hydroxyl group from the surface of silica leads to a decrease in the adsorption, and the surface acquires more hydrophobic properties (Cooper, 1989).
Parent silica exhibits highest pore radius and BET-C constant than parent alumina and parent silica–alumina solids. In contrast, the thermally treated silica and polymer coated silica samples exhibit lowest value of both pore radius and BET-C constant than the other thermally treated and polymer coated solid samples may be due to treatment techniques.
In a rough approximation, the percentage of pore volume occupied by polymer, α%, could be derived from the pore volumes of coated samples and the corresponding solid support (Vp1 and Vp2, respectively) according to the following equation:
The values of α% are also given in Table 5. It can be noticed that most of the volume of pores are occupied by the polymer. This could be explained based on the mechanism of the coating process and the allowed surface of the monolayer coverage. In this context, one can point out that the most of solid support, exceptionally AlSi(57) gave small values of surface area. Accordingly, the amount of polymer consumed for surface coverage is relatively lower than that used for the pore filling. The load percentage used for the polymer coating was kept constant, viz., 25 wt%, for the studied solid support. In some cases having very low surface areas, it can be expected that multilayer or aggregates polymeric structure may be formed in their surface texture.
Sample ID
Vp2parent
Vp1coated
α%
Al
0.0326
0.004
87.730
SiAl(8)
0.0111
0.001
90.909
SiAl(26)
0.0890
0.010
88.764
SiAl(39)
0.1942
0.032
83.934
SiAl(57)
0.4758
0.034
92.854
SiAl(77)
0.1549
0.311
High percent
Si
0.0636
0.006
90.566
For pore Size analysis (Barrett et al., 1951), the distribution curves of some selected solids and their modifications are given in Fig. 5. For the parent solids, the curves indicate the presence of mesopores having pore diameters in the range of 10–150 Å exhibiting maxima at ∼30 Å. This indicates that most of the surface is located in the mesopores region. Upon calcinations, the maxima are shifted to higher value ∼35 Å. Moreover, this shift increases by increasing the alumina content. For the coated samples, the distribution curves indicate that most of the pores are occupied by the polymer.
3.6 Chromatographic characterizations
3.6.1 Thermodynamic parameters
Data, presented in Tables 6–8, indicate that the thermodynamic parameters (ΔH and ΔG) for Al and Al-T solids have higher negative values than those of Si and Si-T solids. This may be due to the higher surface area of both Al and Al-T, which may reflect on greater interaction between the adsorbate (n-hexane) and the surface of both the solids (Barrett et al., 1951).
Stationary Phase
−ΔH (Kcal mol−1)
−ΔG (Kcal mol−1)
ΔS (cal mol−1 deg−1)
Al
6.947
5.988
−1.869
AlSi(8)
5.027
5.553
1.111
AlSi (26)
6.285
6.519
0.495
AlSi (39)
8.451
8.428
−3.944
AlSi (57)
8.445
7.279
−2.465
AlSi (77)
4.920
5.544
1.321
Si
0.684
2.164
3.128
Stationary Phase
−ΔH (Kcal mol−1)
−ΔG (Kcal mol−1)
ΔS (cal mol−1 deg−1)
Al-T
8.108
7.518
−1.186
AlSi(8)-T
8.118
6.837
−2.571
AlSi(26)-T
8.003
6.485
−3.209
AlSi(39)-T
7.114
6.114
−2.115
AlSi(57)-T
8.725
7.085
−3.465
AlSi(77)-T
2.774
5.471
5.702
Si-T
0.788
4.097
7.822
Stationary Phase
−ΔH (Kcal mol−1)
−ΔG (Kcal mol−1)
ΔS (cal mol−1 deg−1)
Al P
1.385
4.024
7.075
AlSi(8)-P
1.306
3.211
5.249
AlSi(26)-P
1.387
4.037
7.104
AlSi(39)-P
1.068
1.935
2.323
AlSi(57)-P
8.779
5.394
−9.075
AlSi(77)-P
4.987
5.133
0.391
Si–P
1.865
3.514
4.419
Silica solids, either untreated or thermally treated (Si or Si-T), exhibited good separation of n-paraffins. For the alumina solids (Al and Al-T), the untreated solid shows a bad gas chromatographic separation. In contrast, the thermally treated alumina as solid stationary phase separated n-paraffins. With respect to the coated solids (Al–P and Si–P) showed the bad separation of n-paraffins. This is due to deposition of polymer macromolecules as multi-layer and aggregates on the surface of alumina and silica.
It was found that ΔS has negative values for Al and positive values for Si, which indicate that the adsorption produces a more ordered system on Al solid surface . In conclusion, Si stationary phase is preferred than Al stationary phase in the separation of paraffinic mixture.
For silica–alumina samples, it was observed that the AlSi(57), AlSi(57)-T, and AlSi(57)-P solid samples gave higher values of (ΔH and ΔS) than those of the other silica–alumina samples indicating the high reactivity of the surface of these solid stationary phases. This is in agreement with the data obtained from the N2-adsorption measurements which indicate that AlSi(57) has the highest surface area and pore volume.
Thermal treatment of the studied silica, alumina and silica–alumina samples was preferred as a modification technique compared with the parent and the coated samples. This leads to short time of gas chromatographic separation of paraffinic hydrocarbons as shown in Figs. 4 and 5. It was observed that the silica–alumina solids, except AlSi(8), showed a better separation than alumina and silica. Separation was improved when these samples are thermally treated. In this context, one should refer to the pore structural characteristics of the silica–alumina solids. It was mentioned that silica–alumina have much better porosity than silica and alumina. Moreover, the pore size distribution curves indicated that the pore diameter has been shifted to a larger range upon thermal treatment.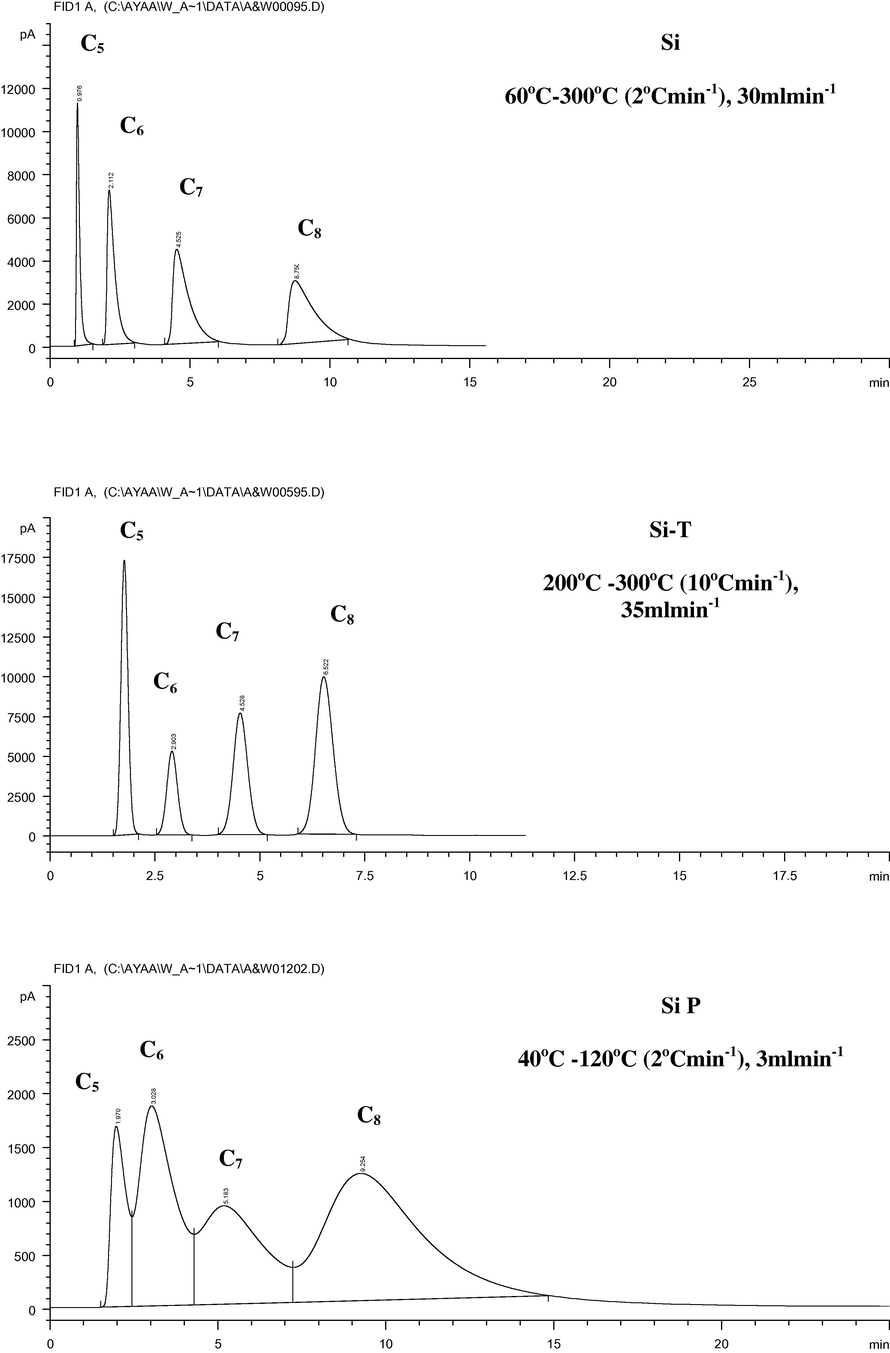
Gas chromatographic separation of paraffins using the parent and modified silica samples at the optimum conditions.
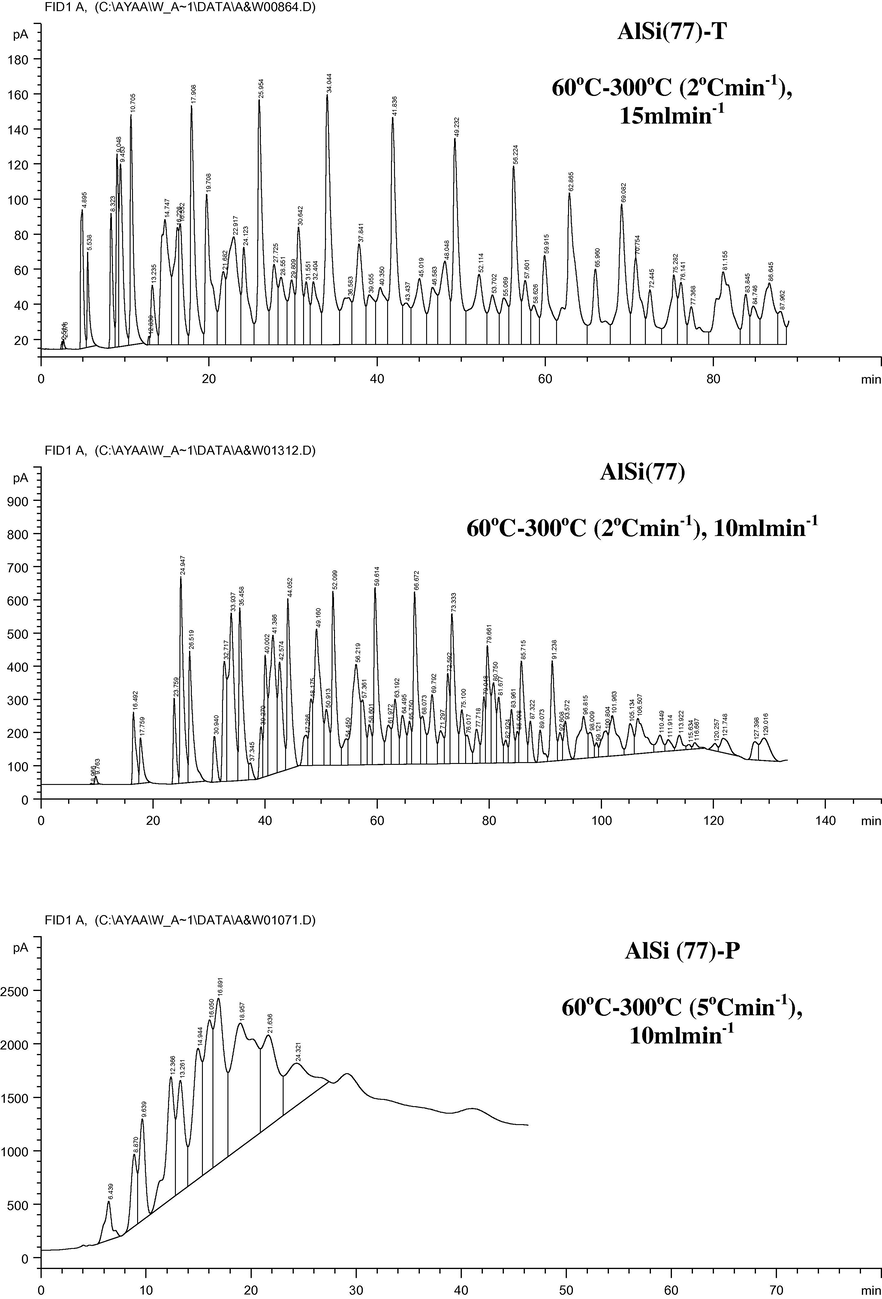
Gas chromatographic separation of mixture of petroleum saturated compound (C6+) using the parent and modified AlSi (77) samples at the optimum conditions.
From the result obtained, it may be expected that AlSi(77) and Si solids AlSi(77)-T and Si-T solids are selectively able to separate a mixture of aromatic compounds and ketones or a mixture of aromatic compounds and fused nitrogen compounds. However, high efficiency of separation could be obtained by using the stationary phase AlSi(77)-T.
4 Conclusions
1-SEM micrographs showed an amorphous phase of alumina containing different types of pores and amorphous gel of non-porous material of silica. For silica–alumina samples, it was noticed that the porosity increased by increasing the alumina content.
The all studied treated and untreated solid samples are stable at the working chromatographic temperature 300 °C except the coated ones at only 225 °C which is the maximum recommended temperature of the poly ethylene glycols.
Surface area and pore volume of alumina and silica were much lower than those of the silica–alumina solids reaching the maximum for AlSi(57). The combination of alumina and silica forming silica–alumina, upon precipitation and heat treatment, improves the surface textural properties as a porous solid support.
4-Results of α% and surface area indicated that the amount of polymer consumed for surface coverage is relatively lower than that used for the pore filling. It can be concluded that multilayer or aggregates polymeric structure may be formed in the surface texture of the coated samples.
5-Pore size distribution analysis of the parent solids showed the presence of mesopores having pore diameters in the range of 10–150 Å exhibiting maxima at ∼30 Å. Upon calcinations, the maxima were shifted to higher value ∼35 Å. Moreover, this shift increased by increasing the alumina content. For the coated samples, the distribution curves indicate that the most of pores are occupied by polymer. This could be confirmed from the other assessed surface textural parameters.
6-Thermodynamic parameters indicated that thermal treatment of the studied silica, alumina and silica–alumina samples was preferred as a modification technique compared with the parent and the coated samples tacking lower duration of gas chromatographic separation of paraffinic hydrocarbons. This is due to the enhancement of mesoporosity by thermal treatment adopted at 800 °C.
References
- J. Chromatogr.. 1973;77:299.
- J. Am. Chem. Soc.. 1951;73:373.
- Anal. Chem.. 1989;61:41.
- J. Am. Chem. Soc.. 1938;60:309.
- J. Am. Chem. Soc.. 1940;62:1724.
- Cagniant D., ed. Complexation chromatography. New York: Marcel Dekker; 1992.
- Faraday Discuss.. 1971;52
- Sep. Sci. Technol.. 1997;32(18):2993-3005.
- Pet. Sci. Technol.. 2006;24:753-767.
- J. Appl. J. Appl. Polym. Sci.. 2001;82:1709-1717.
- Surf. coating technol.. 1997;90:53-63.
- J. Chromatogr.. 1973;78:63.
- The Chemistry of Silica Solubility Polymerization Colloid and Surface Properties and Biochemistry. John Wiley & Sons Inc.; 1979. Chapter 6
- Ibid.. 1970;49:84.
- J. Colloid Interf. Sci.. 1979;70(3):467-474.
- Porous Silica. In: Linsen B.G., ed. Physical and Chemical Aspects of adsorbent and Catalysts. New York, London: Acadamic; 1970. p. :251.
- [Google Scholar]
- J. Phys. Chem.. 1965;69:220.
- Chromatography Today. Amsterdam: Elsevier; 1992.
- Chromatographia. 2000;51:623.
- J. Colloid and Interface Sci.. 2005;284(2):363.
- Colloids Surf. A. 2001;3:187-188.
- J. Phys. Chem.. 1966;70 12:3941-3952.
- Voelkel, A., Strzemiecka, B., Adamska, K., Milczewska, K. Chromatogr. J., A 1216 P.1551 (2009).
- A Text Book of Quantitative Inorganic AnalysisIncluding Elementary Instrumental Analysis (3rd ed.). London: Longman Group Limited; 1961.
- Chem. Mater.. 2002;14:122.


