

Translate this page into:
Simultaneous determination of Hg(II) and Cu(II) in water samples using fluorescence quenching sensor of N-doped and N,K co-doped graphene quantum dots
⁎Corresponding authors. klameta.cash@modyuniversity.ac.in (Keshav Lalit Ameta), sakcha2@kku.ac.th (Saksit Chanthai)
-
Received: ,
Accepted: ,
This article was originally published by Elsevier and was migrated to Scientific Scholar after the change of Publisher.
Abstract
The present study was aimed to use of N doped graphene quantum dots (N-GQDs) and N,K co-doped graphene quantum dots (N,K-GQDs) as a fluorescence quenching sensor to determine both mercury and copper in water sample, simultaneously using simple fluorescence protocol. Each of N-GQDs or N,K-GQDs was optimized separately with 1–5% (w/v) HNO3 or KNO3, respectively, and their quantum yields were determined and compared. It was found that N-GQDs, obtained from 3% (w/v) HNO3 doped resulted higher fluorescence intensity at the maximum excitation and emission wavelengths of 370 and 460 nm, respectively, with higher quantum yield (QY = 83.42%) compared with that of undoped GQDs (QY = 16.35%). While N,K-GQDs obtained from 5%(w/v) KNO3 gave somewhat different fluorescence spectrum, but still had the same maximum excitation and emission wavelengths with rather highest QY (94.07%). However, it is interesting that detection sensitivity expressed as slope of their calibration curve (y = 5.43x − 19.48; r2 = 0.9971) of the N-GQDs is rather higher than that (y = 1.29x + 17.66; r2 = 0.9977) of the N,K-GQDs for Hg2+ fluorescence quenching sensor, and the fluorescence intensity of N-GQDs had better selectively quenching effect only by both Hg2+ and Cu2+. Thus, their quenching effects were selected to develop the fluorescence turn-off sensor for trace level of both metal ions in real water samples. For method validation, the N-GQDs exhibited high sensitivity to detect both Hg2+ and Cu2+ with wide linear ranges of 20–100 μM and 100–500 μM, respectively. Limit of detection (LOD) and limit of quantitation (LOQ) were 0.42 μM & 1.41 μM for Hg2+ and 13.19 μM & 43.97 μM for Cu2+, respectively, with their precision expressed as an intra-day and an inter-day analysis of 6.98% & 11.35% for Hg2+ and 11.78% & 9.43% for Cu2+, respectively. Also the study of matrix analysis of the water samples (drinking water and tap water), was carried out using N-GQDs and N,K-GQDs resulted good percentage recoveries in comparison with those using undoped GQDs under the same optimum conditions.
Keywords
Graphene quantum dots
N doped GQDs
N,K co-doped GQDs
Fluorescence quenching sensor
Copper (II)
Mercury (II)

1 Introduction
The contamination of heavy metal ions has long been becoming one of the most serious problems in the water quality because of the increasing industrial and agricultural activities as well as the improper release of the metal ions into water resources (Anh et al., 2017; Qi et al., 2017, 2018). Water quality has thus become an issue of vital importance which is the essential resource that has been threatened by pollution. Among the toxic metal ions, mercury ion (Hg2+) can be accumulated in vital organs throughout the food chain and cause severe damage to the brain, nervous system, kidney (Chaiyo et al., 2014; ), heart and endocrine system. It is the most common and stable form of mercury pollution. Besides natural accumulation of Hg2+, its organo species like methyl Hg is also much available and need to be removed from water and fish samples using specific adsorbents under optimum experimental design prior to determination (Tuzen et al., 2009a,b; Saleh et al., 2017; Saleh et al., 2018). At the same time, copper ion (Cu2+) can also be harmful, causing irritation of nose and throat, nausea, vomiting and diarrhea (Shoaee et al., 2012; Niazi et al., 2015) when the copper content existing too high. Recently, such nanofluid bahavior of copper oxide nanoparticles was extensively studied and applied for heat transfer enhancement (Li et al., 2019; Sheikholeslami et al., 2019; Ma et al., 2019). Leaking of Cu2+ to contaminate in environmental samples is unavoidably a case study. Therefore, it is rather important to develop a simple, fast and convenient method for simultaneous detection of mercury and copper in such water samples, especially at ultra-trace level analysis.
At present, several methods have been applied for both mercury and copper determination by sophisticated instruments including AAS, ICP-AES, ICP-MS, SERS, GC and LC. However, these methods have a greater cost, higher sample volume requirements and instrumentation complexity limiting. Therefore, this study focuses on the determination of mercury and copper in water sample detecting by simple fluorescence technique. Fluorescence probes working as an effective method to detect the metal ions have been of interest in recent years, which have their advantages much more than those instrumental techniques, giving such as higher sensitivity, specificity, fast response and simple technical procedure (Meng et al., 2018).
More recently besides gold nanoparticles have been used as colorimetric sensor for metal ions detection (Lou et al., 2011), many novel types of fluorescence carbon nanomaterial, graphene quantum dots (GQDs) and/or specific molecular imprinting-based sensors have much been attracted and played more attention (Ding et al., 2016; Yu et al., 2017; Qi et al., 2017; Qi et al., 2018; Q. Yang et al ., 2018; Wang et al., 2018a). However, GQDs possess large surface area, small diameter, fine surface grafting using π-π conjugated network or surface functional groups and other special physical properties (Tetsuka et al., 2012; Wang et al., 2014; Wang and Hu, 2014; Zhu et al., 2012). Its chemical structure contains the carboxyl and hydroxyl groups at their edge enable them to display an excellent water solubility and suitability for successive functionalization with various organic, inorganic, polymeric or biological species (Shen et al., 2011; Shen et al., 2012). GQDs can be tuned by doping elements to increase optical, surface activities and electrical properties of the doped GQDs. Nitrogen atom has been widely used as a dopant as it has a comparable atomic size and five valence electrons to bond carbon atom (Xue et al., 2018). Potassium, K doped GQDs also forms a stable dispersion in water with good crystallinity and uniform diameters (Qian et al., 2016). They show distinctive optical properties comparing with the undoped GQDs.
In this research study, a simple and low-cost synthetic strategy to prepare either N-GQDs or N,K-GQDs by one-pot fusion of solid citric acid with appropriate amounts of concentrate nitric acid or solid potassium nitrate, respectively was carried out. The obtained N-GQDs and N, K-GQDs showed strong fluorescence intensity and high quantum yield (QY) compared with the undoped GQDs. In the presence of Hg2+ and Cu2+, the fluorescence intensity of both N-GQDs and N, K-GQDs decreases linearly by their quenching mechanism. The interactions between Hg2+ or Cu2+ and the N-GQDs or N,K-GQDs lead to an electron or an energy transfer from negative charge on the N-GQDs or N, K-GQDs surface to the metal ions. This is thus aimed of using the fluorescence quenching sensor for simultaneous determination of mercury and copper ions with different sensitivity ranges. In addition, the developed analytical method was validated and expressed as their recovery study on applying for both mercury and copper determination in real water samples.
2 Materials and methods
2.1 Chemicals and materials
All the chemicals used were of analytical grade. Citric acid and sodium hydroxide used were from Carlo Erba (Italy). All of selected mineral acids, potassium nitrate, sodium nitrate and sodium acetate were obtained from QRec (New Zealand). Mercury nitrate and copper nitrate trihydrate were purchased from Sigma-Aldrich (Germany). Acetic acid was from Merck (Germany). Potassium dihydrogen phosphate and dipotassium hydrogen phosphate were from LOBA (India). Paraffin oil was brought from Ajex Finechem (Australia). Deionized water (Simplicity Water Purification System, Model Simplicity 185, Millipore, U.S.A.) was used throughout the experiments.
2.2 Instruments and apparatus
Spectrofluorophotometer (Shimadzu RF-5301PC, Japan) with excitation and emission slit widths of 3 nm was mainly used. pH meter (Model Proline B21, Becthai Equipment & Chemical, Thailand), analytical balance (Model BSA224S-CW, Scientific Promotion, Thailand), quartz cell with 1-cm path length (Fisher Scientific, U.S.A.) were also used. Round bottom flask (Pyrex®, England) and hot plate with a magnetic stirrer in association with paraffin oil bath were set for the citric acid pyrolysis.
2.3 Synthesis and characterization of GQDs and N-GQDs & N, K-GQDs
Graphene quantum dots were prepared by citric acid pyrolysis (Dong et al., 2012). Briefly, 2.0 g citric acid (QRec™, New Zealand) was transferred into a 100 mL round bottom flask which was heated to 250 °C in an oil bath for about 5 min. Citric acid was liquated and its color was changed rapidly to yellow. This liquid was then dissolved by dropwise addition of 100 mL 0.25 M NaOH (QRec™, New Zealand) with continuous stirring for 30 min. The obtained GQDs solution was stored at 4 °C before use. For N-GQDs or N,K doped GQDs synthesis, the GQDs, as also prepared via citric acid pyrolysis, were simultaneously treated with 1–5% (w/v) nitric acid (QRec™, New Zealand) or 1–5% (w/v) potassium nitrate (QRec™, New Zealand) to find the suitable amount of N or N,K doping condition; starting with 2.0 g of citric acid and 1% (w/v) nitric acid or 1% (w/v) potassium nitrate was transferred into a 100 mL round bottom flask, which was heated to 250 °C in an oil bath for about 5 min and then each of the two mixture solutions was dissolved in 100 mL 0.25 M NaOH solution as mentioned above. The as-prepared N-GQDs and N,K-GQDs solution were also stored at 4 °C before use.
2.4 Quantum yield measurement
Determination of the fluorescence quantum yield (QY) of undoped GQDs, N-GQDs and N,K-GQDs was carried out by comparing with standard solution of quinine sulfate (QY = 0.54 at 360 nm) used as a reference compound. The quantum yield is calculated using the slope of the regression line generated by plotting the integrated fluorescence intensity at the emission wavelength of 460 nm against with its absorbance at 370 nm for multiple concentrations of each of undoped GQDs, N-GQDs and N,K-GQDs, and quinine sulfate solutions. The QY was calculated by the following equation (Amini et al., 2017): where, Q is the quantum yield, m is the slope of the mentioned regression line, n is refractive index that assuming equal to 1.33 for both solution and the subscript R refers to quinine sulfate solution.
2.5 Selective fluorescence quenching detection of Hg2+ and Cu2+ using N-GQDs & N,K-GQDs
For these following experiments, about 100 mg/L of each GQDs, N-GQDs or N,K-GQDs solution and 0.1 M phosphate buffer solution pH 7 were mixed well in a 10 mL volumetric flask. Then various concentrations of each of Hg2+ and Cu2+ were added into an aliquot of each of undoped GDQs, N-GQDs or N,K-GQDs solution (10 mL final volume). These Hg2+ and Cu2+ quenching fluorescence spectra of each of the undoped GQDs, N-GQDs or N,K-GQDs solution were recorded immediately at λex/λem 370/460 nm. Then, the spectral measurements were used to plot the quenching external calibration curve for both Hg2+ and Cu2+ with different concentration ranges.
2.6 Recovery study of real water samples
To evaluate the undoped GQDs, N-GQDs and N,K-GQDs based fluorescence quenching sensor for Hg2+ and Cu2+ detection simultaneously in an artificial solution, the applicability of the proposed method for real water samples including drinking water and tap water was carried out. Tap water samples were collected with polyethylene bottle from Khon Kaen area and were analyzed without any pretreatment. All water samples were filtered through Whatman filter paper No.42 and then adjusted to pH 7 with 0.1 M phosphate buffer. In this procedure, 1 mL of the water sample and 0.5 mL of undoped GQDs, N-GQDs or N,K-GQDs (100 mg/L) solution were transferred into 10.0 mL volumetric flask. Then, each of the sample mixture was spiked with three concentration levels of standard solution of Hg2+ (20.0, 50.0 and 100.0 µM) and standard solution of Cu2+ (100.0, 300.0 and 500.0 µM).
2.7 Statistical analysis
Regarding statistical data analysis in an analytical method validation, statistics for those experimental results obtained at least in triplicate include mean, standard deviation, confidence intervals, and linear regression. Data analysis and their curve fitting using all registered statistical packages as such common Excel 2016 is reported.
3 Results and discussion
3.1 FT-IR characterization of the undoped GQDs, N-GQDs & N,K-GQDs
The FTIR spectra of undoped GQDs, N-GQDs and N,K-GQDs are shown in Fig. 1(a)–(c). From the vibration spectrum of undoped GQDs (Fig. 1(a)), the absorption peaks at 3436, 2950, 1576 and 1080 cm−1 were observed, indicating the vibration modes of hydroxyl stretching, C—H stretching, C⚌C stretching of polycyclic aromatic hydrocarbons (Wang et al., 2014), C—O in COH/COC (epoxy) groups (Wang et al., 2009), respectively. These results confirm the undoped GQDs successfully synthesized by citric acid pyrolysis. The FTIR spectrum of N-GQDs is shown in Fig. 1(b), with the broad band at 3000 – 3500 cm−1 corresponding to the stretching vibrations of O-H and N-H (Kaur et al., 2017; Mondal et al., 2018). The absorption peaks at ∼1700, 1585 and 1218 cm−1 indicate C⚌C, C⚌O and C—O—C stretching vibrations, respectively. Surprisingly, the IR spectrum peak at ∼1400 cm−1 was from the vibration mode of C-NH, indicating that the successful doped of nitrogen atom onto the surface of GQDs (Ju and Chen, 2014; C. Zhang et al., 2016). Furthermore, Fig. 1(c) shows an additional peak at 1777 cm−1 for the N,K-GQDs, which is probably resulted from potassium related bonding (Qian et al., 2016; Ain et al., 2016). Therefore, these FTIR spectra can be commonly used to confirm their chemical structures of the as-prepared N-GQDs and N,K-doped GQDs.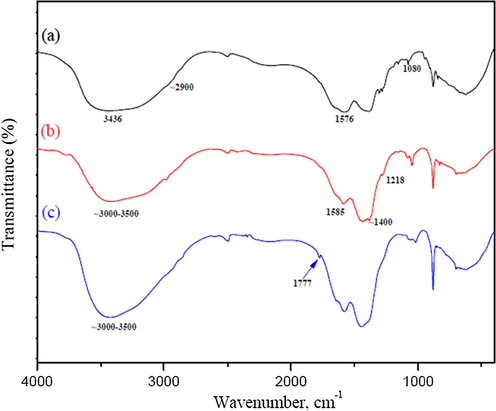
FT-IR Spectra of (a) GQDs, (b) N-GQDs and (c) N,K-GQDs.
3.2 Effect of mineral acids on GQDs yield
For preliminary study, fluorescence spectra of both undoped GQDs and GQDs doped with some mineral acids are shown in Fig. 2. Their absorption spectra were found around 370 nm. When the mineral acids were thermally degraded and decorated into the defaulted surface structure of the GQDs by pyrolysis situation, their emission spectra appeared nearly around 460 nm with either an enhanced or quenched fluorescence process. Thus confirming that the mineral acids doping in the GQDs was successfully obtained and such GQDs doped with nitric acid (HNO3) was chosen as the starting material because of much higher fluorescence intensity. The enhancing fluorescence emission of GQDs doped with HNO3 possibly resulted from the N-doping induced modification of the chemical and electronic characteristics of the GQDs (Liu et al., 2018; Cai et al., 2014; Wang and Fan, 2018).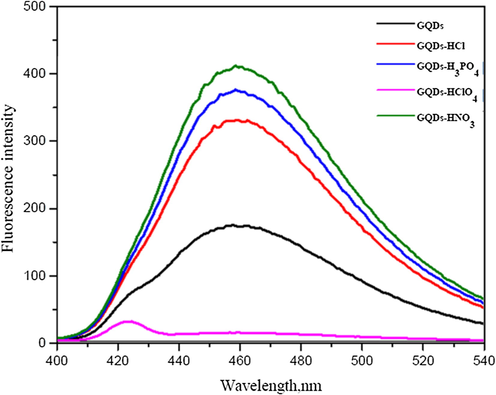
Fluorescence spectra of GQDs (black) and 1%(w/v) each of some mineral acids doped with GQDs (nitric acid/GQDs – green; phosphoric acid/GQDs – blue; hydrochloric acid/GQDs – red; perchloric acid/GQDs – violet).
3.3 Quenching effect of metal ions on the fluorescence intensity of N-GQDs
The effect of some metal ions including Ag+, Na+, Hg+, Cu2+, Pb2+, Mn2+, Mg2+, Fe2+, Fe3+ and Al3+ ions on the fluorescence intensity of the N-GQDs was tested. The fluorescence intensity and the normalized fluorescence intensity of N-GQDs solution showed the quenching effect with adding Hg2+ (Fig. 3(a)) and Cu2+ (Fig. 3(b)). Hg2+ can interact with negative charge on the surface of N-GQDs because of their electrostatic interactions on the quenching process. Some metal ions such as Cu2+ can also interact with negative charge on the surface of N-GQDs but their ion bindings are somewhat weak and its binding affinity is not much as strong as that of the Hg2+ (Li et al., 2015). Therefore, the quenching process of Cu2+ would be weaker than that of Hg2+. The quenching processes of both Hg2+ and Cu2+ on the surface of N-GQDs are considerably due to facilitating non-radiative electron/hole recombination annihilation through an effective electron transfer (Huang et al., 2013; Liu et al., 2016; He et al., 2016). The electron transfers from the excited state of N-GQDs to an empty d-orbital of the metal ion lead to the fluorescence quenching effect of the N-GQDs.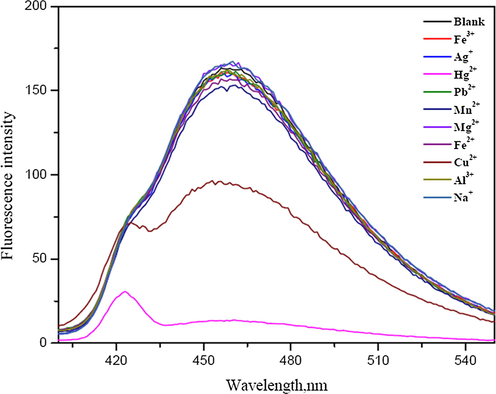
Fluorescence spectra of 1%(w/v) HNO3 doped GQDs in the presence of various metal ions
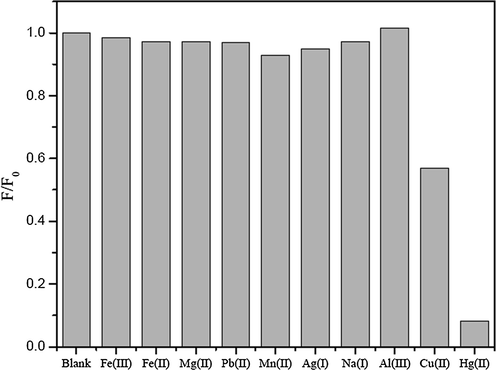
Normalized fluorescence intensities of 1%(w/v) HNO3 doped GQDs in the presence of various metal ions
3.4 Selective detection of Hg2+ and Cu2+ using N-GQDs
The fluorescence intensities of N-GQDs increased with the increase in HNO3 concentration (Fig. 4). The enhancement of florescence intensity would be due to the emissive traps of the nitrogen doped on the surface of GQDs. The nitrogen atom is comparable in an atomic size to the carbon atom and their effects turn on the electronic nature of GQDs due to difference in an electronegativity between C and N that appears large enough to result in significant charge transfer in the C-N composites (Chen et al., 2017). Therefore, the chemical doping of nitrogen atom into the framework of GQDs would directly be attributed. Figs. 5 and 6 show such calibration curves plotting between Fo − F and concentrations of Hg2+ and Cu2+ (µM) using GQDs doped with 1 to 5% (w/v) of HNO3. It was shown that their slopes between 20–200 µM of Hg2+ and slopes between 100–500 µM of Cu2+ were found linearly increasing with the percentage of nitric acid used, of which their calibration curves of GQDs doped with 3% and 5% (w/v) nitric acid gave higher sensitivity to detect both Hg2+ and Cu2+, respectively.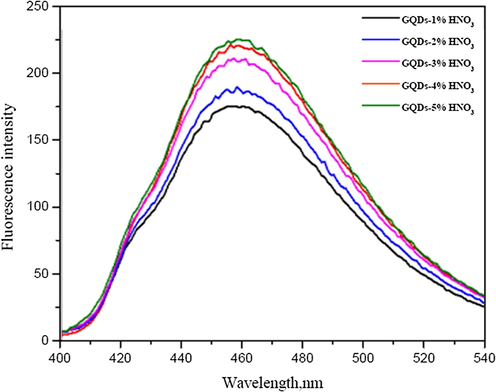
Fluorescence spectra of GQDs and 1–5% (w/v) HNO3 doped GQDs
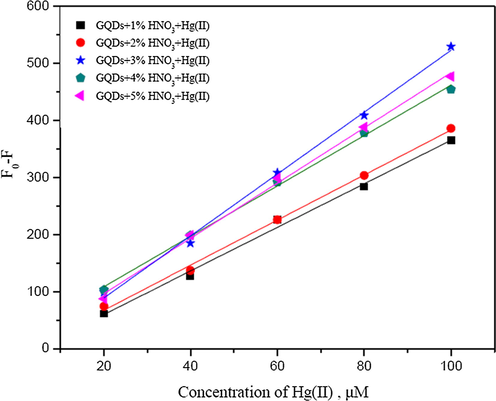
Calibration curves plotting between Fo − F and concentrations of Hg2+ (µM) using GQDs doped with 1–5% (w/v) HNO3
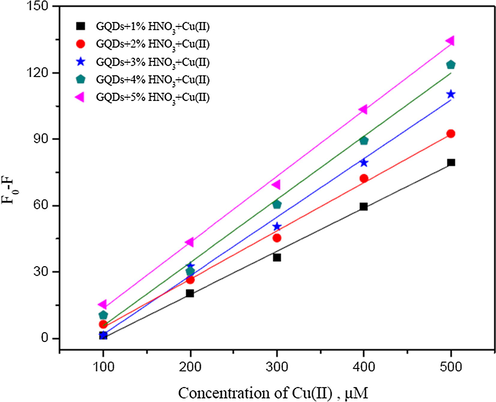
Calibration curves plotting between Fo − F and concentrations of Cu2+ (µM) using GQDs doped with 1–5% (w/v) HNO3
Fig. 7 shows the fluorescence spectra of GQDs doped with potassium nitrate. The results showed the fluorescence spectrum is rather difference in shape from that of the N-GQDs, and their intensities also increased with the increase in KNO3 concentrations. So, GQDs doped with this nitrate salt may has distinct chemical structure, the so-called N,K-GQDs form. The enhancement of their florescence intensity would due to attribution in between π and π* orbital of the N,K-GQDs (C. Zhang et al., 2016; Ain et al., 2016). The change in energy structure would therefore lead to the change in their optical properties as well.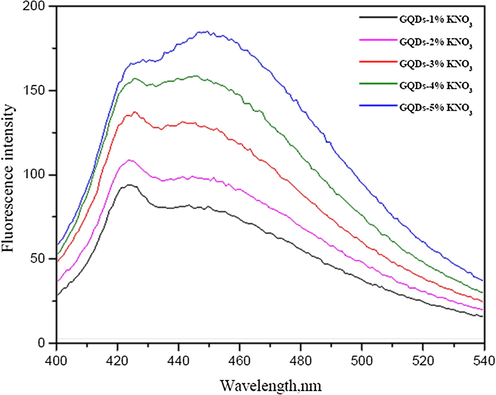
Fluorescence spectra of GQDs and 1–5% (w/v) KNO3 doped GQDs
Also, the N,K-GQDs can be used to detect both Hg2+ and Cu2+ as shown in Figs. 8 and 9. The calibration curves show that their slopes between 20–200 µM for Hg2+ and 100–500 µM for Cu2+ increase with increasing the percentage of potassium nitrate, of which the calibration curve of GQDs doped with 5% (w/v) KNO3 give higher sensitivity to detect both of Hg2+ and Cu2+.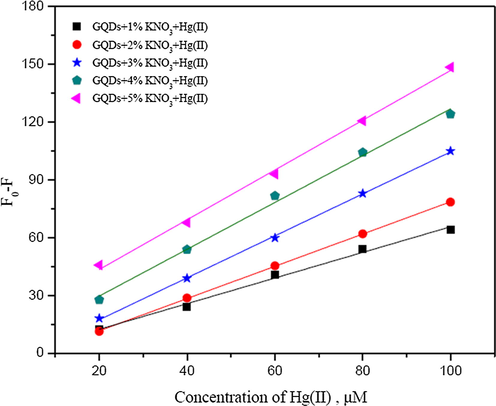
Calibration curves plotting between Fo − F and concentrations of Hg2+ (µM) using GQDs doped with 1–5% (w/v) KNO3
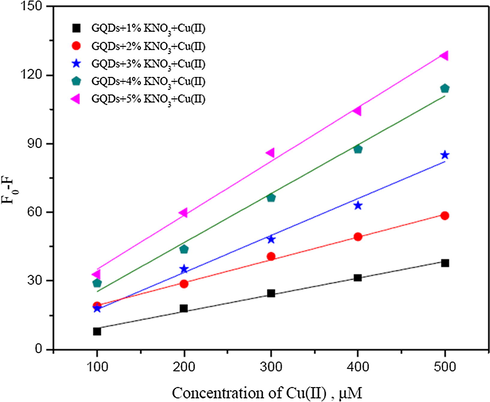
Calibration curves plotting between Fo − F and concentrations of Cu2+ (µM) using GQDs doped with 1–5% (w/v) KNO3
The strong fluorescence intensity of N-GQDs and N,K-GQDs was also investigated by using quinine sulfate solution as a reference case. The quantum yields of different doping materials are compiled in Table 1. The fluorescence quantum yields of the obtained N-GQDs and N,K-GQDs was found to be 83.42% and 94.07%, respectively, which they were higher than that of the undoped GQDs and quinine sulfate, so the doping N and K on the surface of GQDs gave significant enhancement of the fluorescence quantum yields of the GQDs (Yan et al., 2016).
Material/chemical
Quantum yield (%)
Undoped GQDs
16.35
N-GQDs from 3% (w/v) HNO3 doped
83.42
N,K-GQDs from 5% (w/v) KNO3 doped
94.07
Quinine sulfate
54.00
Comparison of detection sensitivity for Hg2+ and Cu2+ in terms of their slopes of its calibration curves using the undoped GQDs, N-GQDs and N,K-GQDs as fluorescence quenching sensor is shown in Table 2. Thus, quantitative analysis of both Hg2+ and Cu2+ was validated and their analytical parameters were listed in Table 3. The fluorescence intensity of the optimal N-GQDs decreased with an increasing in concentrations from 20 to 100 µM of Hg2+ and 100 to 500 µM of Cu2+. Both limit of detection (LOD) and limit of quantitation (LOQ) of the proposed florescence quenching sensor were 0.42 μM & 1.41 μM for Hg2+, and 13.2 μM & 44.0 μM for Cu2+, respectively. The intra-day precision and inter-day precision expressed as the percentage of RSDs were 6.98 and 11.35 for Hg2+, and 11.78 and 9.43 for Cu2+, respectively, derived from the detection of the solution model of 40.0 μM Hg2+and 300.0 μM Cu2+. These results suggest that the proposed method exhibits a very good repeatability and is therefore acceptable for simultaneous determination of Hg2+ and Cu2+ with different sensitivity ranges in the same sample solution.
Material
20–100 µM Hg2+
100–500 µM Cu2+
Undoped GQDs
y = 1.43x + 8.66; r2 = 0.9982
y = 0.18x − 20.72; r2 = 0.9841
N-GQDs
y = 5.43x − 19.48; r2 = 0.9971
y = 0.30x − 16.24; r2 = 0.9977
N,K-GQDs
y = 1.29x + 17.66; r2 = 0.9977
y = 1.18x + 11.49; r2 = 0.9958
Metal ion
Calibration curve* (µM)
r2
LOD (µM)
LOQ (µM)
Intra-day analysis (%)
Inter-day analysis (%)
Hg2+
20–100
0.9949
0.42
1.41
6.98
11.35
Cu2+
100–500
0.9727
13.2
44.0
11.78
9.43
The proposed protocol was applied for Hg2+ and Cu2+ determination in drinking water and tap water samples. From the results (Tables 4–6), their recoveries of the spiked Hg2+ and Cu2+ by using undoped GQDs were obtained in the ranges of 96.75 ± 2.88 − 104.95 ± 6.01% and 96.38 ± 6.18 − 106.30 ± 7.06%, respectively. The recoveries when using N-GQDs were found in the ranges of 99.00 ± 1.29 − 101.25 ± 1.66% for Hg2+ and 99.06 ± 2.06 − 101.73 ± 0.65% for Cu2+, while the recoveries obtained from using N,K-GQDs were also in the ranges of 95.75 ± 7.11 − 102.75 ± 2.39% for Hg2+ and 97.32 ± 7.17 − 101.10 ± 5.55% for Cu2+. This method evaluation is very satisfactorily attributed in terms of an analytical accuracy of the trace metal detection. However, comparison of different fluorescence sensing considered as LOD for Hg2+ and Cu2+ detection is complied. Even though its sensitivity of N-GQDs probe for Hg2+ detection is a little bit higher when compared with other literatures, it might be due to differences in optimum conditions used under specific detection studied. In such case of Cu2+ detection using N-GQDs sensing probe it is still limited. Therefore, this study is aimed to report the use of N-GQDs as fluorescence sensing probe for simultaneous detection of both Hg2+ and Cu2+ existing in the same sample solution with different sensitivity range as mentioned above. It is concluded that the proposed method can be successfully applied to real water samples including drinking water and tap water Table 7.
Water sample
Hg2+
Cu2+
Added (µM)
Found (µM)
Recovery (%) ± SD
Added (µM)
Found (µM)
Recovery (%) ± SD
Drinking water 1
20.00
20.11
102.75 ± 4.25
100.00
100.13
102.05 ± 2.98
60.00
60.04
100.16 ± 3.21
300.00
300.06
100.31 ± 3.78
100.00
99.85
99.25 ± 5.74
500.00
499.13
97.26 ± 4.41
Drinking water 2
20.00
20.09
101.45 ± 5.05
100.00
100.06
100.94 ± 4.00
60.00
60.08
100.66 ± 2.25
300.00
300.08
100.41 ± 6.74
100.00
100.10
100.50 ± 2.59
500.00
500.12
100.38 ± 2.50
Drinking water 3
20.00
19.64
98.50 ± 4.55
100.00
99.87
97.95 ± 4.18
60.00
59.99
99.91 ± 2.64
300.00
299.94
100.73 ± 4.35
100.00
100.23
101.15 ± 3.30
500.00
500.21
100.66 ± 2.24
Tap water 1
20.00
19.87
96.75 ± 2.88
100.00
100.40
106.30 ± 7.06
60.00
59.98
99.83 ± 3.17
300.00
300.02
100.10 ± 4.95
100.00
100.71
103.55 ± 5.11
500.00
499.96
99.87 ± 4.84
Tap water 2
20.00
19.90
97.50 ± 7.05
100.00
99.62
96.38 ± 6.18
60.00
60.03
100.25 ± 7.87
300.00
299.96
100.26 ± 6.35
100.00
100.99
104.95 ± 6.01
500.00
500.54
101.10 ± 3.58
Water sample
Hg2+
Cu2+
Added (µM)
Found (µM)
Recovery (%) ± SD
Added (µM)
Found (µM)
Recovery (%) ± SD
Drinking water 1
20.00
20.01
100.25 ± 1.11
100.00
99.99
99.84 ± 1.56
60.00
60.05
100.41 ± 0.78
300.00
300.03
100.16 ± 0.54
100.00
100.10
100.50 ± 0.59
500.00
500.02
100.06 ± 1.22
Drinking water 2
20.00
20.04
101.00 ± 1.02
100.00
100.04
100.63 ± 1.34
60.00
60.10
100.00 ± 0.96
300.00
300.45
101.57 ± 0.89
100.00
100.01
100.05 ± 0.68
500.00
500.01
100.03 ± 1.19
Drinking water 3
20.00
10.99
99.75 ± 1.01
100.00
100.05
100.78 ± 0.97
60.00
60.00
100.00 ± 0.47
300.00
300.33
101.73 ± 0.65
100.00
100.04
100.20 ± 0.97
500.00
500.06
100.19 ± 1.01
Tap water 1
20.00
20.05
101.25 ± 1.66
100.00
100.08
99.06 ± 2.06
60.00
60.13
100.00 ± 0.98
300.00
299.95
100.41 ± 1.89
100.00
100.22
101.10 ± 1.03
500.00
499.95
99.84 ± 0.99
Tap water 2
20.00
19.96
99.00 ± 1.29
100.00
99.97
99.52 ± 1.11
60.00
60.11
100.92 ± 1.03
300.00
300.05
100.26 ± 2.78
100.00
100.12
100.60 ± 0.89
500.00
500.23
100.72 ± 2.87
Water sample
Hg2+
Cu2+
Added (µM)
Found (µM)
Recovery (%) ± SD
Added (µM)
Found (µM)
Recovery (%) ± SD
Drinking water 1
20.00
20.11
102.75 ± 2.39
100.00
100.07
101.10 ± 5.55
60.00
60.08
100.67 ± 4.87
300.00
300.08
100.42 ± 2.98
100.00
99.86
99.30 ± 6.02
500.00
499.41
98.14 ± 3.89
Drinking water 2
20.00
20.08
102.00 ± 5.11
100.00
100.04
100.63 ± 5.12
60.00
60.02
100.17 ± 2.88
300.00
300.05
100.26 ± 3.58
100.00
100.21
101.05 ± 2.91
500.00
500.07
100.22 ± 7.41
Drinking water 3
20.00
9.89
97.25 ± 6.55
100.00
99.97
99.06 ± 3.58
60.00
60.01
100.08 ± 4.51
300.00
300.04
100.21 ± 2.98
100.00
100.12
100.60 ± 4.37
500.00
500.14
100.44 ± 4.97
Tap water 1
20.00
9.83
95.75 ± 7.11
100.00
99.83
97.32 ± 7.17
60.00
59.96
99.67 ± 6.34
300.00
300.05
100.26 ± 6.62
100.00
100.48
102.40 ± 5.01
500.00
500.14
100.44 ± 5.11
Tap water 2
20.00
19.85
96.25 ± 6.47
100.00
99.86
97.80 ± 6.28
60.00
60.13
101.08 ± 6.40
300.00
300.11
100.58 ± 7.47
100.00
100.41
102.05 ± 4.12
500.00
500.26
100.82 ± 4.17
Material probe
Hg2+
Cu2+
Reference
GQDs
0.43 nM
–
Z. Li et al. (2015)
N-GQDs
1.3 nM
–
Z. Liu et al. (2016)
N-CQDs
1.48 nM
–
Y. Zhang et al. (2016)
N-GQDs
67.3 nM
–
Y. Yang et al. (2019)
N-GQDs
0.10 µM
–
Wang et al., 2018a
N-GQDs
0.42 µM
13.2 µM
This work
4 Conclusion
A simple and low-cost procedure for one-pot synthesis of N-GQDs and N,K-GQDs was emphasized and successfully developed using pyrolysis of solid citric acid with either concentrate nitric acid or potassium nitrate. The advantages of the proposed method were as following (1) both N-GQDs and N,K-GQDs show strong fluorescence intensity and give higher quantum yields compared with its undoped GQDs, (2) the N-GQDs and N,K-GQDs both give high sensitive and selective determination of Hg2+ and Cu2+, (3) their fluorescence intensity decreases linearly by quenching mechanism, and (4) the detection of Hg2+ and Cu2+ was achieved with fast response, wide linear range, rather lower detection limit and can be applied to real water samples without any matrix interference. The novelty of the N-GQDs or N,K-GQDs can easily be implied for routine analysis of simultaneous detection of the two metal ions under the selected optimal conditions with satisfactorily analytical figures of merit and, in-turn, would serve as a friendly eco-environmental green chemistry.
Conflict of Interest declaration
Authors have no conflict of interest.
Acknowledgements
The authors are thankful to the Materials Chemistry Research Center, Department of Chemistry and Center of Excellence for Innovation in Chemistry (PERCH-CIC), Khon Kaen University for financial support. Authors are also thankful to School of Sciences, Mody University of Science and Technology for providing necessary support to complete this study.
References
- A highly selective and sensitive “on-off-on” fluorescent probe for detecting Hg(II) Based on Au/N-doped carbon quantum dots. Sens. Actuators, B. 2018;255:657.
- [Google Scholar]
- Preconcentration and simultaneous spectrophotometric determination of copper and mercury by dispersive liquid–liquid microextraction and orthogonal signal correction–partial least squares. Arab. J. Chem.. 2015;8:706.
- [CrossRef] [Google Scholar]
- Microwave assisted one-pot synthesis of graphene quantum dots as highly sensitive fluorescent probes for detection of iron ions and pH value. Talanta. 2016;150:54.
- [CrossRef] [Google Scholar]
- Highly selective, rapid- functioning and sensitive fluorescent test paper based on graphene quantum dots for on-line detection of metal ions. Anal. Methods. 2018;10:1163.
- [CrossRef] [Google Scholar]
- A simple one-pot synthesis of highly fluorescent nitrogen-doped graphene quantum dots for the detection of Cr(VI) in aqueous media. RSC Adv.. 2014;4:52016.
- [CrossRef] [Google Scholar]
- Numeral study for nanofluid behavior inside a storage finned enclosure involving melting process. J. Mol. Liq. 2019:111939.
- [CrossRef] [Google Scholar]
- Potassium doping: tuning the optical properties of graphene quantum dots. AIP Adv.. 2016;6(7):075116.
- [CrossRef] [Google Scholar]
- The electron-transfer based interaction between transition metal ions and photoluminescent graphene quantum dots (GQDs): a platform for metal ion sensing. Talanta. 2013;117:152-157.
- [CrossRef] [Google Scholar]
- Simultaneous preconcentration of copper and mercury in water samples by cloud point extraction and their determination by inductively coupled plasma atomic emission spectrometry. Spectrochim. Acta Part A Mol. Biomol. Spectrosc.. 2012;98:70.
- [CrossRef] [Google Scholar]
- Optically tunable amino-functionalized graphene quantum dots. Adv. Mater.. 2012;24(39):5333-5338.
- [CrossRef] [Google Scholar]
- Graphene oxide doped polyaniline for supercapacitors. Electrochem. Commun.. 2009;11:1158.
- [CrossRef] [Google Scholar]
- Carbon dots-based fluorescent probe for “off-on” sensing of Hg(II) and I–. Biosens. Bioelectron.. 2016;79:531.
- [CrossRef] [Google Scholar]
- Synthesis of highly fluorescent nitrogen-doped graphene quantum dots for sensitive, label-free detection of Fe (III) in aqueous media. Biosens. Bioelectron.. 2014;58:219-225.
- [CrossRef] [Google Scholar]
- Three-dimensional paper-based microfluidic chip device for multiplexed fluorescence detection of Cu2+ and Hg2+ ions based on ion imprinting technology. Sens. Actuators, B. 2017;251:224-233.
- [CrossRef] [Google Scholar]
- Rotational paper-based microfluidic-chip device for multiplexed and simultaneous fluorescence detection of phenolic pollutants based on a molecular-imprinting technique. Anal. Chem.. 2018;90:11827.
- [CrossRef] [Google Scholar]
- Facile preparation and upconversion luminescence of graphene quantum dots. Chem. Commun.. 2011;47(9):2580-2582.
- [CrossRef] [Google Scholar]
- One-pot hydrothermal synthesis of graphenequantum dots surface-passivated by polyethylene glycol and their photoelectric conversion under near-infrared light. New J. Chem.. 2012;36(1):97-101.
- [CrossRef] [Google Scholar]
- One-pot synthesis of quantum dots-based molecular imprinting nanosensor for highly selsctive and sensitive fluorescence detection of 4-nitrophenol in environmental waters. Environ. Sci. Nano. 2017;4:493.
- [CrossRef] [Google Scholar]
- Electrolyzing synthesis of boron- doped graphene quantum dots for fluorescence determination of Fe3+ ions in water samples. Talanta. 2017;164:100.
- [CrossRef] [Google Scholar]
- Functionalized graphene quantum dots as a fluorescent “off–on” nanosensor for detection of mercury and ethyl xanthate. Res. Chem. Intermed.. 2017;43:7457.
- [CrossRef] [Google Scholar]
- A fluorescent probe based on nitrogen doped graphene quantum dots for turn off sensing of explosive and detrimental water pollutant, TNP in aqueous medium. Spectrochim. Acta Part A Mol. Biomol. Spectrosc.. 2017;180:37-43.
- [CrossRef] [Google Scholar]
- Application of nano-refrigerant for boiling heat transfer enhancement employing an experimental study. Inter. J. Heat Mass Transf.. 2019;141:974.
- [Google Scholar]
- Mercury(II) and mercury speciation on Streptococcus pyogenes loaded Dowex Optipore SD-2. J. Hazard. Mat.. 2009;169(1–3):345.
- [CrossRef] [Google Scholar]
- Mercury(II) and methyl mercury determinations in water and fish samples by using solid phase extraction and cold vapour atomic absorption spectrometry combination. Food Chem. Toxic.. 2009;47:1648.
- [CrossRef] [Google Scholar]
- Highly sensitive and selective detection of mercury ions using N, S-codoped graphene quantum dots and its paper strip based sensing application in wastewater. Sens. Actuators, B. 2017;252:1169.
- [CrossRef] [Google Scholar]
- Tuning the emission energy of chemically doped graphene quantum dots. Nanomaterials. 2016;6:198.
- [CrossRef] [Google Scholar]
- Strategies of molecular imprinting-based fluorescence sensors for chemical and biological analysis. Biosen. Bioelectron.. 2018;112:54.
- [CrossRef] [Google Scholar]
- Highly sensitive determination of mercury using copper enhancer by diamond electrode coupled with sequential injection-anodic stripping voltammetry. Anal. Chim. Acta. 2014;852:55.
- [CrossRef] [Google Scholar]
- Control the size and surface chemistry of graphene for the rising fluorescent materials. Chem. Commun.. 2012;48:4527.
- [CrossRef] [Google Scholar]
- Optimization of parameters with experimental design for the adsorption of mercury using polyethylenimine modified-activated carbon. J. Environ. Chem. Eng.. 2017;5(1):1079.
- [CrossRef] [Google Scholar]
- Polyamide magnetic palygorskite for the simultaneous removal of Hg(II) and methyl mercury; with factorial design analysis. J. Environ. Manage.. 2018;211:323.
- [CrossRef] [Google Scholar]
- Blue-to-red colorimetric sensing strategy for Hg2+ and Ag+ via redox-regulated surface chemistry of gold nanoparticles. ACS Appl. Mat Interf.. 2011;3:1568.
- [CrossRef] [Google Scholar]
- Nitrogen, sulphur co-doped graphene quantum dot: an excellent sensor for nitroexplosives. Sens. Actuators, B. 2018;257:586.
- [CrossRef] [Google Scholar]
- A novel label-free fluorescent sensor for highly sensitive detection of bleomycin based on nitrogen-doped graphene quantum dots. Anal. Chim. Acta. 2018;1028:45.
- [CrossRef] [Google Scholar]
- Solidification inside a clean energy storage unit utilizing phase change material with copper oxide nanoparticles. J. Cleaner Prod. 2019:118888.
- [CrossRef] [Google Scholar]
- Multifunctional graphene quantum dots for simultaneous targeted cellular imaging and drug delivery. Colloids Surf. B. 2014;122:638.
- [CrossRef] [Google Scholar]
- One-pot synthesis of N-doped graphene quantum dots as highly sensitive fluorescent sensor for detection of mercury ions water solutions. Mater. Res. Express. 2019;6:095615.
- [CrossRef] [Google Scholar]
- Nanomaterial-based optical sensors for mercury ions. TrAC, Trends Anal. Chem.. 2016;82:175.
- [CrossRef] [Google Scholar]
- Blue luminescent graphene quantum dots and graphene oxide prepared by tuning the carbonization degree of citric acid. Carbon. 2012;50:4738.
- [CrossRef] [Google Scholar]
- Carbon quantum dots: synthesis, properties and applications. J. Mater. Chem. C. 2014;2:6921.
- [CrossRef] [Google Scholar]
- Fluorescence probes for “off-on” highly sensitive detection of Hg2+ and L-cysteine based on nitrogen-doped carbon dots. Talanta. 2016;152:288.
- [Google Scholar]
- A rapid and label-free dual detection of Hg (II) and cysteine with the use of fluorescence switching of graphene quantum dots. Sens. Actuators, B. 2015;207:490.
- [CrossRef] [Google Scholar]
- Cysteine detection using a high-fluorescence sensor based on a nitrogen-doped graphene quantum dot–mercury(II) system. J. Lumin.. 2016;175:129.
- [CrossRef] [Google Scholar]
- Cu2+ modulated nitrogen-doped grapheme quantum dots as a turn-off/on fluorescence sensor for the selective detection of histidine in biological fluid. Spectrochim. Acta Part A Mol. Biomol. Spectrosc.. 2018;189:195.
- [Google Scholar]
- A Green and lower-temperature synthesis of two-color fluorescent nitrogen doped graphene quantum dots. Dyes. Pigments.. 2018;156:379.
- [CrossRef] [Google Scholar]
- A green synthesis of highly fluorescent nitrogen-doped graphene quantum dots for the highly sensitive and selective detection of mercury(II) ions and biothiols. Anal. Mrhods. 2016;8:1565.
- [CrossRef] [Google Scholar]


