

Translate this page into:
Simultaneous determination of synthetic edible pigments in beverages by titania-based RP-HPLC
⁎Corresponding author at: Tianjin Key Laboratory of Food Biotechnology, College of Biotechnology and Food Science, Tianjin University of Commerce, Tianjin 300134, China. ztjiang@tjcu.edu.cn (Zi-Tao Jiang)
-
Received: ,
Accepted: ,
This article was originally published by Elsevier and was migrated to Scientific Scholar after the change of Publisher.
Peer review under responsibility of King Saud University.
Abstract
A titania-based stationary phase, ODT was prepared. A rapid HPLC method was developed for simultaneous determination of SEPs. Separation efficiency of ODT on SEPs was much better than that of silica. Retention mechanism of SEPs was studied.
Abstract
A rapid method for simultaneous determination of five synthetic edible pigments (SEPs) including tartrazine (TA), ponceau 4R (PO), sunset yellow (SY), brilliant blue (BB) and erythrosine (ER) in beverages with titania-based RP-HPLC has been developed. The good linear relationships were obtained in the concentration ranges of 2.5–40 μg mL−1 for TA, PO and SY, 0.75–12 μg mL−1 for BB, and 1.25–20 μg mL−1 for ER, respectively. The detection limits (LODs) of five SEPs were 0.042, 0.021, 0.042, 0.0005, and 0.021 μg mL−1, respectively. The average recoveries were between 92.2% and 106.3%. Relative standard deviations (RSD, n = 7) for five SEPs were less than 1.18%. The precision and accuracy of the method can meet the requirements of HPLC analysis. In addition, the thermodynamic parameters of retention of the pigments in the titania column such as enthalpy (ΔHο), entropy (ΔSο) and Gibbs free energy (ΔGο) were also determined.
Keywords
Titania-based stationary phase
RP-HPLC
Synthetic edible pigments (SEPs)
Beverages

1 Introduction
The synthetic edible pigments (SEPs) are increasingly used for color enhancement of practically all types of processed foods because of their low price, high effectiveness, and excellent stability (Ha et al. 2013). However, their safety has been questioned and concerned for a long time due to the organic chemical reactions involved in the production process (Qi et al., 2015). Though some SEPs are permitted, mainly including ponceau 4R (PO), sunset yellow (SY), tartrazine (TA), erythrosine (ER), and brilliant blue (BB), the quantity should be limited strictly to a certain degree by various countries, regions and relevant international organizations (GB2760-2011; Qi et al., 2015). The studies about the toxicological effect indicated that SEPs had certainly carcinogenic activities and the products of metabolism of azo pigments such as naphthylamine and aniline were listed as the Level 1 and Level 3 carcinogens (Doguc et al., 2015; Mizutani, 2009; Nayumi et al., 2005; Reyes et al., 1996). The potential hazards are still existed even if the consumer intakes low dose of SEPs over a long period of time in the daily diet, thus detection for them is very significant.
There have been some related reports on the determination of SEPs and the methodologies involved mainly include thin layer chromatography (TLC) (Andrade et al., 2014; Florin et al., 2008), oscillopolarography (Yilmaz et al., 2014), capillary electrophoresis (CE) (Huang et al., 2003), HPLC (Bonan et al., 2013; Shen et al., 2014; Tang et al., 2014; Zhu et al., 2014), and liquid chromatography tandem mass spectrometry (LC-MS) (Chen et al., 2014; Ortelli et al., 2008). These methods have been used to determine the pigments in foods such as drinks (Kang et al., 2012; Minioti et al., 2007; Yoshioka et al., 2008), candies (Yoshioka et al., 2008), ice cream (Tripathi et al., 2004), jams and jelly (Yang et al., 2014). Among these methods, TLC is the simplest and mainly used for qualitative analysis, but not very sensitive. Oscillopolarography only applies to the determination of metallic elements, some anions, strongly polar or charged substances. Furthermore, the polarizing electrode usually was the suspended mercury or mercury film electrodes. Although CE method is sensitive and limit of detection (LOD) also low, it is relatively poor in reproducibility. Perhaps, HPLC and LC-MS may be the best methods and are widely applied, especially HPLC because of the relatively inexpensive instrument used. However, silica stationary phases used in the two above-mentioned methods such as ODS are a very disadvantageous factor in separation of SEPs because silica can irreversibly adsorb the nitrogen-containing organic compounds including SEPs. This will cause trailing peak, peak asymmetry, sensitivity decline, and then reduce the separation effect of SEPs. Compared with ODS, titania does not have irreversible adsorption for the nitrogen-containing organic compounds and possesses greater mechanical and thermal stability, together with low back pressure (Murayama et al., 1994). Titania as a promising stationary phase, there is still lack of usefulness in real analysis. Only a few analytical applications have been reported (Ozawa et al., 2010; Tan et al., 2012; Zhao et al., 2010; Zhou et al., 2008). As far as our knowledge is concerned, the determination of SEPs has not been involved.
In the present work, a rapid titania-based RP-HPLC method for simultaneous determination of TA, PO, SY, BB and ER was developed. The separation of five SEPs in the beverage samples was satisfactory. The thermodynamic constants, enthalpy (ΔHο), entropy (ΔSο) and Gibbs free energy (ΔGο) were measured and used to explain the retention mechanism of SEPs on titania column.
2 Materials and methods
2.1 Reagents and samples
TA, PO, SY, BB, and ER standards were purchased from Tianjin Guangfu Fine Chemical Research Institute (Tianjin, China). Methanol, sodium phosphate monobasic and sodium phosphate dibasic were all of HPLC-grade and obtained from Kermel Chemical Reagent Co. Ltd. (Tianjin, China). Ultra-pure water was obtained from Milli-Q purification system (Millipore, USA).
Standard stock solutions of SEPs (1.0 mg mL−1) were prepared by dissolving in constant volume to 100 mL volumetric flask with ultra-pure water, then placed in the refrigerator under the condition of 4 °C for use. Working standard solutions were prepared by dilution with the stock solutions.
2.2 Instrumentations and chromatographic column
HPLC analysis was carried out with Agilent 1100 series HPLC system (Agilent, USA) comprising a G1311A quaternary pump, a G1328B manual injector, a G1379A degasser and a G1315B diode-array detector. A Yamatake HT-230A column oven was used to control column temperature.
The porous titania microspheres were synthesized according to our previous method (Du et al., 2013). The octadecyl titania stationary phase (ODT) was prepared by octadecylation of titania with octadecyl trimethoxysilane in toluene for 8 h. After a series of washing and drying treatments, then the obtained ODT phase was filled into the column (250 mm × 4.6 mm) by homogenation according to the previous literature (Jiang et al., 2001).
2.3 HPLC conditions
The temperature of chromatographic column was kept at 50 °C. The mobile phase was composed of methanol, water and phosphate buffer. The optimal gradient elution program was as follow: the concentration of methanol in the mobile phase increased from 0 to 60% within 12 min and then remained unchanged. The concentration of phosphate buffer in the mobile phase was always contained at 10%, which means that the buffer concentration in the mobile phase was 5.0 mM (pH = 7). The flow rate of mobile phase was 0.8 mL min−1. DAD detector wavelengths selected 427 nm (for monitoring TA), 507 nm (for PO, SY and ER) and 629 nm (for BB), respectively. The SEPs were identified by comparison of retention time with those of the standards, while the quantification was completed by comparison of peak areas with those of the standards.
2.4 Standard curves
The original mixing standard solution was prepared by measuring certain volume of each standard stock solution and mixing, then a series of different concentrations of mixing standard solution obtained by diluting to different volume. The concentrations of TA, PO, SY were 2.5, 5, 10, 20, and 40 μg mL−1 in these mixing standard solutions, BB were 0.75, 1.5, 3, 6, and 12 μg mL−1, and ER were 1.25, 2.5, 5, 10, and 20 μg mL−1, respectively. The prepared solutions were well shaken and filtered through 0.45 μm microporous filtering film and then 10 μL of each mixed standard solution was injected into HPLC for separating. The standard curve was drew with concentration as horizontal ordinate and peak area as longitudinal coordinate and the linear regression equation was calculated as well.
2.5 Pretreatment of samples
Six beverage samples were purchased from local supermarkets in Tianjin and prepared as follows: 10 mL of beverage samples was acquired in a 10 mL volumetric flask, degassed for 20 min in an ultrasonic bath and filtered through 0.45 μm membrane filters prior to HPLC analysis. There is no complex pretreatment procedure needed.
2.6 Calculation of chromatographic parameters
Van’t Hoff described the relationship between retention factor (k') and column temperature (T) by use of Eq. (1). If the dependence between ln k' and 1/T was linear, ΔHο and ΔSο could be calculated from the slope and intercept of Van’t Hoff plot. Then, ΔGο was calculated based on Gibbs-Helmholtz equation (Eq.(2)) (Žižkovský et al., 2008; Karatapanis et al., 2010):
3 Results and discussion
3.1 Selection of detection wavelength
The solutions of five SEPs standards were scanned in the ultraviolet-visible region. According to the scan results, we chose 427 nm for monitoring SY, 507 nm for PO, SY and ER, and 629 nm for BB, respectively.
3.2 Selection of buffer
The most commonly used buffer was ammonium acetate for a silica-based HPLC column. However, ammonium acetate had its own weakness that acetate ion could come into being non-ion complex by combining some cations, which would cause the column efficiency to become worse and affected the separation, and even affected the working life of chromatographic column. Since both Lewis acid and base sites existed on the surface of titania, this special feature had a remarkable effect on the analysis process that might make the peak wide, trailed and harder for separation. Based on the above-mentioned reasons, the phosphate was used as buffer solution because it could effectively shield the Lewis acid sites on the surface of titania as Lewis base sites. Furthermore it could also improve the ionic strength of mobile phase to avoid wide peaks and peak tailing phenomena. The experiment found that 50 mmol L-1 of phosphate buffer was good enough to achieve the separation of five SEPs, when volume fraction of phosphate buffer in mobile phase was maintained at 10%. These settings ensured that the chromatographic peak width was narrow and non-trailing.
3.3 Selection of gradient elution program
It was generally considered that the retention mechanism of the high aqueous mobile phase chromatography was solvophobic theory (Liu et al., 2014). The lyophobic effect of the solute and the solvent caused the solvophobic association between the alkyls and the solutes. When the polarity of the mobile phase decreased, the solution tended to disassociation so that the solute molecules were eluted. However, the polarity of the mobile phase was increased, association with enhanced.
It was not possible for isocratic elution to simultaneously separate five SEPs because of its unchangable elution strength. When the gradient elution was selected, five SEPs could well be separated. The mobile phase elution strength gradually enhanced to achieve effective separation. The specific procedure of effective gradient elution was finally determined. It was found that the separation effect was best when the concentration of methanol in the mobile phase increased from 0 to 60% within 12 min and then remained unchanged at a mobile phase flow rate of 0.8 mL min−1. Meanwhile, in the mobile phase, the concentration of 50 mM phosphate (pH = 7) was always kept at 10%. With the increase of methanol concentration in the mobile phase, the elution ability of the mobile phase relative to five SEPs was also gradually enhanced and the pigments were well separated.
3.4 Effect of column temperature
The influence of column temperature was investigated in the range 40–70 °C. As shown in Fig. 1A, the increase in column temperature resulted in a significant decrease in retention time for TA, PO and SY, while a slight decrease for BB and ER. The increase in column temperature resulted in lower column pressure, better peak shape (Fig. 1B) and better column efficiency (Fig. 1C). The elevated temperature resulted in an increase of resolution between peaks of SY, BB and BB, ER, respectively, but a decrease of resolution between peaks of TA and PO. Therefore, the column temperature 50 °C was chosen as the best for separation analytes.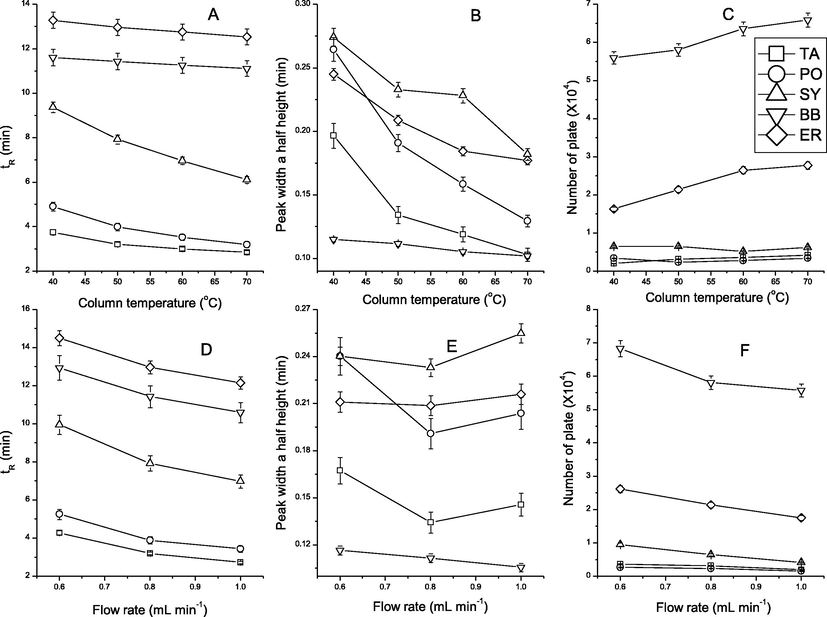
Effects of column temperature and flow rate on retention time, peak width at half height, and number of plates of synthetic edible pigments.
3.5 Effect of flow rate
The effects of flow rate on retention of SEPs were investigated by varying the flow rate from 0.6 to 1.0 mL min−1. As shown in Fig. 1, the higher flow rate of the mobile phase, the faster the separation (Fig. 1D). But worse column efficiency would be obtained (Fig. 1F). Flow rate of 0.8 mL min−1 resulted in the better peaks of all SEPs. The best result was obtained using flow rate of 0.8 mL min−1.
3.6 Thermodynamic behaviors
As mentioned above, the column temperature had a significant effect on the retention times of SEPs in the range 313.15–343.15 K. As shown in Fig. 1A, the increase in column temperature resulted in the decrease in retention for all analytes. It signified an exothermic character of analytes interaction with titania stationary phase. Fig. 2 shows the dependence between lnk’ of analytes and 1/T. Table 1 shows the intercept, slope and regression parameters of the analytes. The plot of lnk’ versus 1/T was linear (0.9999 > R2 > 0.9900), which signified similar mechanism of the separation process in the range 313.15–343.15 K for all analytes.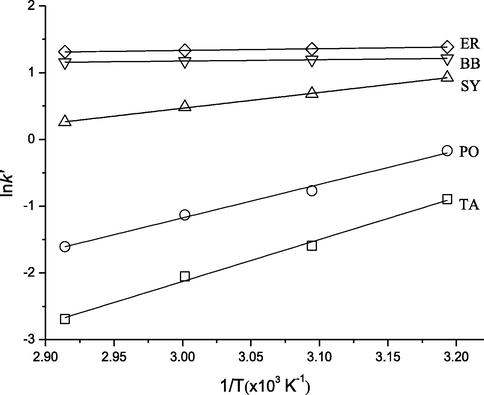
Van’t Hoff plot for five synthetic edible pigments on titania of different temperatures.
Analyte
tR (min)
Intercept
Slope (K)
R2
ΔHο (J mol−1)
ΔSο (J K−1 mol−1)
ΔGο (J mol−1)
TA
3.971
−21.01
6293.20
0.9923
−52321.68
−174.26
3990.44
PO
5.156
−16.27
5031.93
0.9900
−41835.44
−134.88
1751.03
SY
9.556
−6.62
236*3.33
0.9987
−19648.71
−54.66
−1985.33
BB
11.684
0.56
203.74
0.9999
−1693.90
5.08
−3335.50
ER
13.432
0.56
259.24
0.9933
−2155.34
5.02
−3777.55
The thermodynamic parameters of analytes from the mobile to the stationary phase were calculated from the slope and intercept (Table 1). As can be seen from Table 1, the separation of analytes was determined by different ΔHο and ΔSο. The retention process of TA and PO seemed to be entropically controlled because ΔGο was positive. However, the retention process of SY, BB and ER seemed to be enthalpically controlled because ΔGο was negative. The ΔGο was negative, which indicated the transfer of the analytes from the mobile phase to the stationary phase was a spontaneous process. The more negative ΔGο, the more easily it was for the analytes to transfer from the mobile phase to the stationary phase, resulting in stronger retention in the stationary phase. ΔGο of TA, PO, SY, BB and ER decreased gradually, which also verified the retention order of analytes in thermodynamic.
3.7 Method validation
An aliquot of 10 μL of each concentration of mixing standard solution was injected into the HPLC system for separation to investigate the linear ranges of synthesis edible pigments analysis in this method. Linearity of the standard curves was good in the range of 2.5–40 μg mL−1 for TA, PO and SY, while the result was good in the range of 0.75–12 μg mL−1 for BB and 1.25–20 μg mL−1 for ER. The LODs were fulfilled by injecting diluted lowest concentration of mixing standard solution, and the criteria of LODs detection was 3 times of the baseline noise height. The detection of LOQs was finished in the same way, only the criterion was 10 times of the baseline noise height. The relative standard deviations (RSDs) of peak area of five SEPs were evaluated by repeating injection for 7 times, the mixing standard solution for RSD detection contained 20 μg mL−1 of TA, PO and SY, 6 μg mL−1 of BB, 10 μg mL−1 of ER. The linear regression equations, correlation coefficients, LODs, LOQs and RSD are shown in Table 2.
Analyte
Linear equation
R2
LOD (μg mL−1)
LOQ (μg mL−1)
RSD (%)
TA
y = 14.8490x − 0.1400
0.9997
0.0420
0.1400
1.1844
PO
y = 10.5650x + 3.5396
0.9999
0.0210
0.0700
0.7907
SY
y = 16.5200x + 1.3371
0.9999
0.0420
0.1400
0.8923
BB
y = 99.5870x − 0.4971
0.9999
0.0005
0.0017
0.6592
ER
y = 50.0830x − 7.4979
0.9999
0.0210
0.0700
0.2035
3.8 Application to beverage samples
The mixture of standards was isolated under the proposed optimum conditions and the chromatogram was shown in Fig. 3. From this result, we could see that the separation effect was still very good. In addition, the synthetic pigment contents in the real beverage samples were also determined, as shown in Table 3 and Fig. 4. To get the average recoveries, three different concentration of mixing standard were added to the sample solutions. Then the mixtures were determined for five times. As can be seen from Table 3, the average recoveries of the method ranged from 92.2% to 106.3%. Sample f was the pure fruit juice, no synthetic edible pigment was added, and the results were consistent. It illustrated that the developed method was credible and accurate.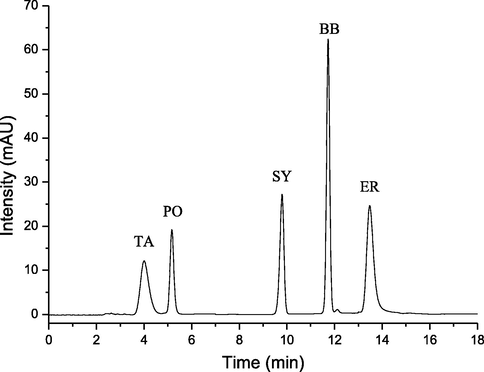
Chromatogram of the mixture of synthetic edible pigments standards. Conditions: phosphate buffer (5.0 mM, pH 7.0); column temperature 50 °C; flow rate 0.8 mL min−1.
Sample
Measured value (μg mL−1)
Spiked (μg mL−1)
Average recoveries (n = 5, %)
TA
PO
SY
BB
ER
TA
PO
SY
BB
ER
TA
PO
SY
BB
ER
a
−*
−
2.64 ± 0.08
0.75 ± 0.03
−
5
5
5
1.5
2.5
102.8
97.1
96.9
97.6
96.5
10
10
10
3
5
20
20
20
6
10
b
−
10.40 ± 0.42
−
0.41 ± 0.02
−
5
5
5
1.5
2.5
103.7
98.0
99.4
96.1
97.9
10
10
10
3
5
20
20
20
6
10
c
24.25 ± 0.83
10.39 ± 0.38
23.87 ± 0.92
−
−
5
5
5
1.5
2.5
100.5
95.4
97.6
101.3
96.9
10
10
10
3
5
20
20
20
6
10
d
−
−
−
0.65 ± 0.02
−
5
5
5
1.5
2.5
106.3
99.5
92.5
97.7
94.6
10
10
10
3
5
20
20
20
6
10
e
10.03 ± 0.40
57.57 ± 1.89
−
−
−
5
5
5
1.5
2.5
95.5
92.2
94.9
96.3
98.8
10
10
10
3
5
20
20
20
6
10
f
−
−
−
−
−
5
5
5
1.5
2.5
94.7
96.2
95.1
98.4
96.0
10
10
10
3
5
20
20
20
6
10
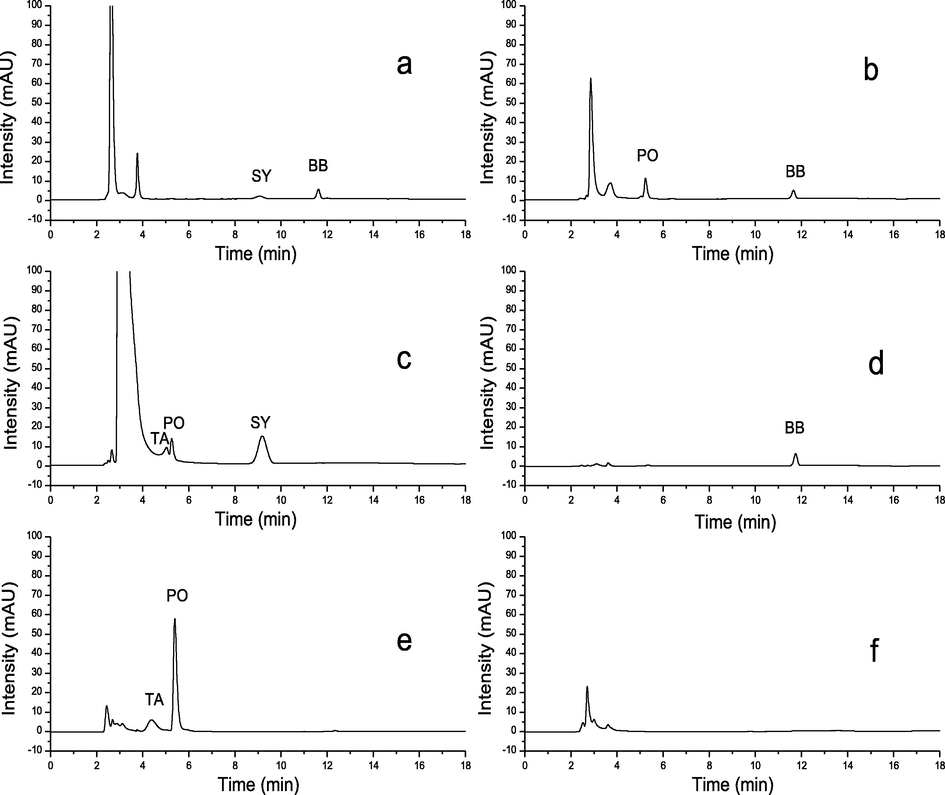
Chromatograms of samples (a–f). Conditions: phosphate buffer (5.0 mM, pH 7.0); column temperature 50 °C; flow rate 0.8 mL min−1.
4 Conclusions
A rapid and new method for simultaneous determination of five SEPs including TA, PO, SY, BB and ER using a titania-based HPLC has been developed. The influences of buffer pH, buffer concentration, gradient elution, column temperature, and flow rate on separation were investigated. Five SEPs were separated successfully using the optimized gradient elution. The thermodynamic parameters, ΔHο, ΔSο, and ΔGο were calculated. The thermal stability of titania for separation was much better than silica. Although the specific surface area of the prepared titania-based stationary phase was not large enough, it was much larger than that of the existing titania stationary phase (Žižkovský et al., 2007; 2008). The proposed method was simple, reliable, good chromatographic peak and competent for the quantitative assay of SEPs in beverages. The result proved potential utilization of titania-based HPLC column in the field of food, even extending to environmental and medicine (Žižkovský et al., 2007). This work also concluded that the titania-based stationary phase had a superior selectivity for these SEPs.
Ethical approval
This article does not contain any studies with human participants performed by any of the authors.
Acknowledgements
The present research was financially supported by the Natural Science Foundation of Tianjin (16JCYBJC43300, 17JCQNJC02400).
Declaration of Competing Interest
The authors declare that they have no conflict of interest.
References
- Determination of synthetic food dyes in commercial soft drinks by TLC and ion-pair HPLC. Food Chem.. 2014;157(1):193-198.
- [Google Scholar]
- Simultaneous determination of synthetic dyes in foodstuffs and beverages by high-performance liquid chromatography coupled with diode-array detector. Dyes Pigments. 2013;99(1):36-40.
- [Google Scholar]
- Fast determination of seven synthetic pigments from wine and soft drinks using magnetic dispersive solid-phase extraction followed by liquid chromatography–tandem mass spectrometry. J. Chromatogr. A. 2014;1346:123-128.
- [Google Scholar]
- Are there any remarkable effects of prenatal exposure to food colourings on neurobehaviour and learning process in rat offspring? Nutr. Neurosci.. 2015;18(1):12-21.
- [Google Scholar]
- Preparation of porous titania microspheres for HPLC packing by sol-gel method. Mater. Lett.. 2013;95:17-20.
- [Google Scholar]
- Quantitative determination of some food dyes using digital processing of images obtained by thin-layer chromatography. J. Chromatogr. A. 2008;1188(2):295-300.
- [Google Scholar]
- Chinese National Standard: Standards for Use of Food Additives. Beijing: China: Standard Press; 2011.
- Exposure assessment of synthetic colours approved in Korea. Food Addit. Contam. A. 2013;30(4):643-653.
- [Google Scholar]
- Analysis of food colorants by capillary electrophoresis with large-volume sample stacking. J. Chromatogr. A. 2003;995(1–2):29-36.
- [Google Scholar]
- Preparation and chromatographic characteristics of octadecyl bonded titania stationary phase for high performance liquid chromatography. Chin. J. Chromatogr.. 2001;19(4):297-300.
- [Google Scholar]
- Simultaneous determination of 20 food additives in drinks by high performance liquid chromatography coupled with photo-diode array detector. Chin. J. Anal. Chem.. 2012;40(11):1661-1667.
- [Google Scholar]
- Study of the behavior of water-soluble vitamins in HILIC on a diol column. Chromatographia. 2010;71(9–10):751-759.
- [Google Scholar]
- Simultaneous determination of cyclamate, acesulfame, and aspartame in beverages by titania-based RP-HPLC. Food Anal. Methods. 2014;7(7):1400-1406.
- [Google Scholar]
- Determination of 13 synthetic food colorants in water-soluble foods by reversed-phase high-performance liquid chromatography coupled with diode-array detector. Anal. Chim. Acta. 2007;583(1):103-110.
- [Google Scholar]
- Toxicity of xanthene food dyes by inhibition of human drug-metabolizing enzymes in a noncompetitive manner. J. Environ. Pub. Health 2009 Article ID 953952, 9 pages
- [Google Scholar]
- Preparation and evaluation of octadecyl titania as column-packing material for high-performance liquid chromatography. Microchem. J.. 1994;49(s2–3):362-367.
- [Google Scholar]
- Influence of synthetic and natural food dyes on activities of CYP2A6, UGT1A6, and UGT2B7. J. Toxicol. Environ. Health A. 2005;68(16):1431-1444.
- [Google Scholar]
- Fast and simultaneous determination of eleven synthetic color additives in flour and meat products by liquid chromatography coupled with diode-array detector and tandem mass spectrometry. Food Chem.. 2015;181:101-110.
- [Google Scholar]
- Fast screening and quantitation of microcystins in microalgae dietary supplement products and water by liquid chromatography coupled to time of flight mass spectrometry. Anal. Chim. Acta. 2008;617(1–2):230-237.
- [Google Scholar]
- Retention behavior of purine-like compounds on titania and the effect of organic modifiers content in the mobile phase. Chromatographia. 2010;72(3–4):313-316.
- [Google Scholar]
- Effect of organic synthetic food colours on mitochondrial respiration. Food Addit. Contam.. 1996;13(1):5-11.
- [Google Scholar]
- Simultaneous determination of red and yellow artificial food colourants and carotenoid pigments in food products. Food Chem.. 2014;157(8):553-558.
- [Google Scholar]
- Determination of melamine in liquid milk and milk powder by titania-based ligand-exchange hydrophilic interaction liquid chromatography. Food Anal. Methods. 2012;5(5):1062-1069.
- [Google Scholar]
- Simultaneous determination of 16 synthetic colorants in hotpot condiment by high performance liquid chromatography. J. Chromatogr. B. 2014;960(6):87-91.
- [Google Scholar]
- A novel method for the determination of synthetic colors in ice cream samples. J. AOAC Int.. 2004;87(3):657-663.
- [Google Scholar]
- Quantitative analysis of fourteen synthetic dyes in jelly and gummy candy by ultra performance liquid chromatography. Anal. Methods. 2014;6(15):5872-5878.
- [Google Scholar]
- Determination of the food dye carmine in milk and candy products by differential pulse polarography. J. Food Drug Anal.. 2014;22(3):329-335.
- [Google Scholar]
- Determination of 40 synthetic food colors in drinks and candies by high-performance liquid chromatography using a short column with photodiode array detection. Talanta. 2008;74(5):1408-1413.
- [Google Scholar]
- Determination of phosphatidylcholine in soybean lecithin samples by high performance liquid chromatography on titania. Anal. Methods. 2010;2(11):1779-1783.
- [Google Scholar]
- Hydrophilic interaction chromatography of nucleotides and their pathway intermediates on titania. J. Chromatogr. A. 2008;1187(1–2):87-93.
- [Google Scholar]
- Simultaneous determination of 14 oil-soluble synthetic dyes in chilli products by high performance liquid chromatography with a gel permeation chromatography clean-up procedure. Food Chem.. 2014;145(7):956-962.
- [Google Scholar]
- Titania-based stationary phase in separation of ondansetron and its related compounds. J. Chromatogr. A. 2008;1189(1–2):83-91.
- [Google Scholar]
- Potential employment of non-silica-based stationary phases in pharmaceutical analysis. J. Pharmaceut. Biomed.. 2007;44(5):1048-1055.
- [Google Scholar]


