

Translate this page into:
Single precursor-based luminescent nitrogen-doped carbon dots and their application for iron (III) sensing
⁎Corresponding author.
-
Received: ,
Accepted: ,
This article was originally published by Elsevier and was migrated to Scientific Scholar after the change of Publisher.
Peer review under responsibility of King Saud University.
Abstract
A single precursor N-(2-hydroxyethyl) ethylenediamine triacetic acid-based nitrogen-doped carbon dots have been prepared, which show blue fluorescent property and can be applied for Fe3+ sensing due to the fluorescent quenching after coordinate binding between N-CDs and Fe3+.
Abstract
Iron III (Fe3+) sensing is of great importance for monitoring its levels in different environmental and biological systems since its levels are tightly associated with many environmental concerns and serious diseases. Compared to the ordinary Fe3+ detection methods involving the sophisticated and expensive instruments, the use of fluorescent materials with short response time and low cost attracts much attention. Amongst a variety of fluorescent materials, a nitrogen-doped carbon dot (N-CD) is emerging as promising luminescent materials for biosensing due to their superior photoluminescent properties, good water solubility, and biocompatibility. Herein, N-CD prepared via a green and cost-effective one-pot hydrothermal method using a new single precursor N-(2-hydroxyethyl) ethylenediamine triacetic acid (HEDTA) as both the carbon and nitrogen sources is reported. The blue fluorescent emission of N-CDs is quenched by the addition of Fe3+, and the quenching intensity is concentration dependent in the wide range (0.76–400 μM) with a detection limit of 0.16 μM. The quantum yield for the as prepared N-CDs is 14.17%. The N-CDs also show a high selectivity for Fe3+ chelation amongst a range of biological metal ions. The fluorescent quenching is attributed to the formation of the coordinate covalent bonds between the Fe3+ and N-CDs, and the mechanism is proved to be a static type on the basis of the photoluminescence lifetime and the temperature-dependent fluorescent intensity change. Our eco-friendly and simple strategy will benefit the application of CDs in various fields.
Keywords
N-(2-hydroxyethyl) ethylenediamine triacetic acid (HEDTA)
Nitrogen-doped carbon dot (N-CD)
Metal sensing
Iron III
Quenching mechanism

1 Introduction
Metal ion sensing is crucial for environmental monitoring, food safety and medical diagnostics since its level is tightly associated with the environmental and health concerns (Zhang et al., 2016). Among these metal ions, iron III (Fe3+) is one of the essential ions, which serves as the cofactor of haem-proteins (Hamilton and Kizhakkedathu, 2015), the redox component in the electron transport chain (Botebol et al., 2017); and the constituent of non-haem iron enzymes etc. in humans (Crichton, 2001; Devos et al., 2014). The deficiency of Fe3+ are correlated with diseases like anemia (Singh et al., 2014; Bedford et al., 2013), while its overloading causes type 2 diabetes (Simcox and Mcclain, 2013), Hepatitis C (Narang et al., 2010), Parkinson’s (Hare and Double, 2016) and Alzheimer’s diseases etc. (Prasanthi et al., 2012). Similarly, its increase or decrease in the environment (for example in water) could severely affect the plant growth (Staiger, 2002). Therefore, a regular monitoring of the iron content in a system is needed for evaluating its role in different processes as discussed above. Until now, various methods such as inductively coupled plasma mass spectrometry (ICP-MS), voltammetry, spectrophotometry, and atomic absorption spectrometry (AAS) have been developed for detecting Fe3+ in liquid samples (Singh et al., 2014; Caprara et al., 2015; Chen et al., 2017). However, the above-mentioned methods have many issues, such as the use of sophisticated and expensive instrumentations as well as complicated sample preparation techniques, thus limiting the applications for the routine Fe3+ analysis in aqueous samples (Zhang et al., 2016; Zhang et al., 2015; Guo et al., 2017). Compared to the above-mentioned methods, the fluorescence-based approach has its unique advantages such as easy manipulating instruments, low cost, and simple sample preparation techniques (Zhang et al., 2016; Lee et al., 2007). Different kinds of fluorescent materials such as organic molecular dyes, fluorescent conjugated polymers and semiconductor quantum dots (QDs) have been developed for Fe3+ sensing. However, these fluorescent materials undergo the issues of photostability, biocompatibility and the requirement of further surface passivation (Feng et al., 2013; Kumar et al., 2011; Li et al., 2014; Fan et al., 2005; Thomas et al., 2007; Wu et al., 2009). Therefore, it is highly desirable to develop novel fluorescent materials with high photostability, low toxicity, and high biocompatibility for Fe3+ sensing (Lv et al., 2017).
Carbon dots (CDs), as a kind of metal-free fluorescent nanomaterials, have been widely investigated for bioimaging and biosensing owing to their good fluorescent properties and biocompatibility (Lim et al., 2015; Navalon et al., 2017; Zhu et al., 2011; Shen et al., 2012; Peng et al., 2017; Essner and Baker, 2017). In addition, their fluorescence can be further improved by doping other elements, which might be helpful for the biosensing applications (Liu et al., 2017). Among these doping elements, nitrogen has been considered a good candidate owing to its comparable atomic size to carbon atom and existence of five electrons in the valence shell, thus providing free electrons to other atoms for the changes of the electronic structure and photoluminescence (PL) properties of CDs (Liu et al., 2017; Dong et al., 2014; Weger et al., 2009). Currently, a series of N-CDs have been prepared via a bottom-up method, and some of them have been studied for Fe3+ sensing. For instance, Dong et al., used EDTA along with hot sulphuric acid for the synthesis of N-CDs (Dong et al., 2014). Similarly, Lv et al., reported the synthesis of N-CDs by using citric acid and ethanediamine as precursors (Lv et al., 2017). However, these methods use two precursors and also some harmful raw materials such as sulphuric acid, which could lead to the cost increase, purification burden, and environmental concerns. Therefore, more simple, cost effective and environmentally friendly strategies are needed for the synthesis of N-CDs.
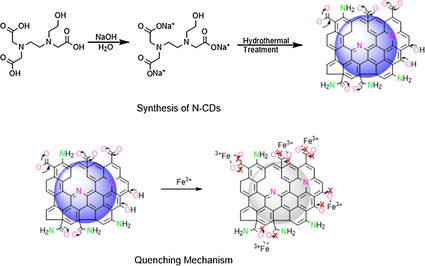
Herein, we reports N-CDs prepared from a single precursor N-(2-hydroxyethyl) ethylenediamine triacetic acid (HEDTA) by an eco-friendly and simple one-pot hydrothermal approach. We choose an HEDTA organic molecule as a precursor for three reasons: First, the HEDTA acts as both the carbon and nitrogen sources. Second, HEDTA has three —COOH, and one —OH groups, thus having the potential for the synthesis of N-doped CDs with the presence of —COOH and —OH as the functional groups responsible for their role in fluorescence. Third, HEDTA itself is an iron chelating agent due to the electron donating nature of oxygen and nitrogen in it (Weger et al., 2009), and the N-CDs obtained from HEDTA might retain the iron chelating ability which is essential for iron sensing. The obtained N-CDs show a blue emission with a maximum emission at 440 nm under the excitation at about 350 nm, and undergo the Fe3+ sensitivity by their PL quenching after treatment with Fe3+ in the concentration range of 0.76–400 μM with a detection limit of 0.16 μM and significant selectivity. The quantum yield calculated for these materials was 14.17%. The static type fluorescent quenching mechanism was confirmed due to the complex formation between the Fe3+ and the surface functional groups of N-CDs such as —COOH, —OH, and (—C⚌O)NH2 restricting the free electron transfer between these functional groups [34,35].
2 Results and discussion
2.1 Morphology and composition of N-CDs
The N-CDs were prepared from HEDTA through a facile one-pot hydrothermal approach. The morphology and structure of the as-prepared N-CDs were investigated by Transmission Electron Microscopy (TEM), Atomic Force Microscopy (AFM) and X-ray diffraction (XRD). As shown in Fig. 1a, N-CDs with an average size of 4 nm (Fig. 1a inset, bottom-left corner). The inset at the top-right corner confirms the crystallinity of the N-CDs with a crystal lattice spacing of 0.23 nm (Hong et al., 2018; Hu et al., 2017). The height of these N-CDs ranges from 0 to 1 nm as shown in the AFM image, which is typical for a monolayer structure (Fig. 1b) (Kouloumpis et al., 2017). The crystallinity of the N-CDs was further confirmed by XRD (Fig. 2a), which shows a peak at ∼23° with an interlayer spacing of 0.38 nm calculated from the Bragg’s law, validating the synthesis of graphitic N-CDs with a (0 0 2) crystal lattice (Wang et al., 2014). A slight increase in the interlayer spacing of N-CDs (0.38 nm) in comparison to the graphitic (0.34 nm) can be attributed to the presence of abundant surface functional groups in the obtained N-CDs (Hu et al., 2017; Zheng et al., 2017). We then measured QY of the as-prepared N-CDs, which was calculated to be about 14.17% using quinine sulfate (54% in 0.1 mol/L H2SO4, λ ex = 360 nm) as a reference.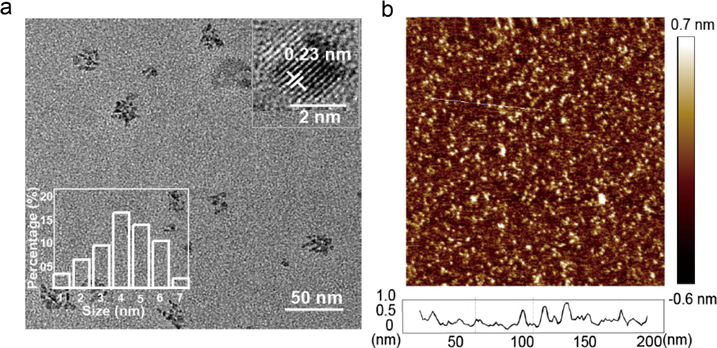
Morphology characterization of N-CDs. (a) TEM image of the as-prepared N-CDs (scale bar, 50 nm). The inset contains the HRTEM image of N-CDs (scale bar, 2 nm). (b) AFM profile line analysis (bottom) confirms the monolayer distribution, while the top one approves the homogeneous dispersion of the as-prepared N-CDs on the mica substrate.
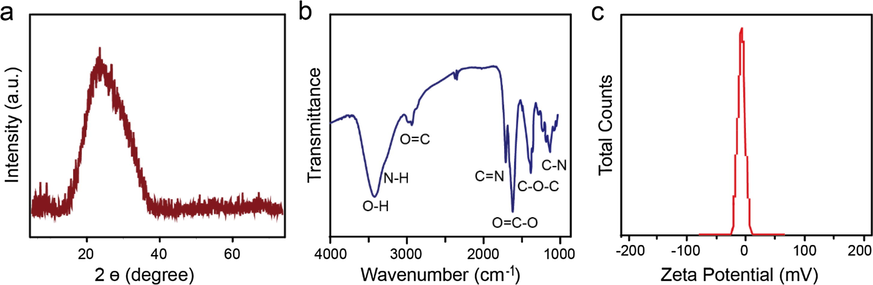
XRD pattern (a), FTIR spectrum (b), and the zeta potential (c) of N-CDs.
The Fourier-Transform Infra Red (FTIR) experiment was performed to explore the composition of the as-prepared N-CDs. As shown in Fig. 2b, there is a sharp peak representing —OH groups at ∼ 3440 cm−1 (Park et al., 2014), a sidewise small peak at ∼ 3300 cm−1 for the presence of —NH groups primarily of secondary amines (Wang and Zhou, 2014). Another peak at 2930 cm−1 is for the stretching of O⚌C with a high possibility of the amide groups (Hsieh et al., 2017). The peaks at ∼ 1740, ∼1620, ∼1360, and ∼ 1080 cm−1 corresponding to C⚌N, O⚌C—O, C—O—C, —CN of quaternary amine and groups, respectively (Wang and Zhou, 2014; Hsieh et al., 2017; Wang et al., 2018; Jackowska et al., 2012). The measured zeta potential value (Fig. 2c) of −7.64 mV further confirms the presence of —COO– and —O− ions on the surface of N-CDs, which are formed after the deprotonation of —COOH and —OH functional groups present on the surface of the prepared N-CDs (Honary and Zahir, 2013). Hence the mentioned data favor the synthesis of N-CDs composed of functional groups, such as —COOH, —OH, —C⚌O, and —C⚌N etc.
The presence of the functional groups and elements was further confirmed by X-ray photoelectron spectroscopy (XPS) (Fig. 3a–d). The XPS survey spectrum (Fig. 3a) confirms the presence of C, O and N in the as-prepared N-CDs. The C⚌C gives the appearance at 284.7 eV in the XPS C1s spectrum (Fig. 3b) along with —C—N, —C—O, and —C⚌O at 285.9, 286.5 and 287.8 eV respectively. The N1s spectrum (Fig. 3c) imparts the information regarding the pyridinic-N at 399.2 eV, pyrrolic N at 400 eV, —NH at 400.6 eV and graphitic N at 401.6 eV. The O1s spectrum (Fig. 3d) validates the presence of the C⚌O bonds at the binding energy of 532 eV, and the —CO bonds at 533.4 eV, respectively (Wang et al., 2014; Chen et al., 2016).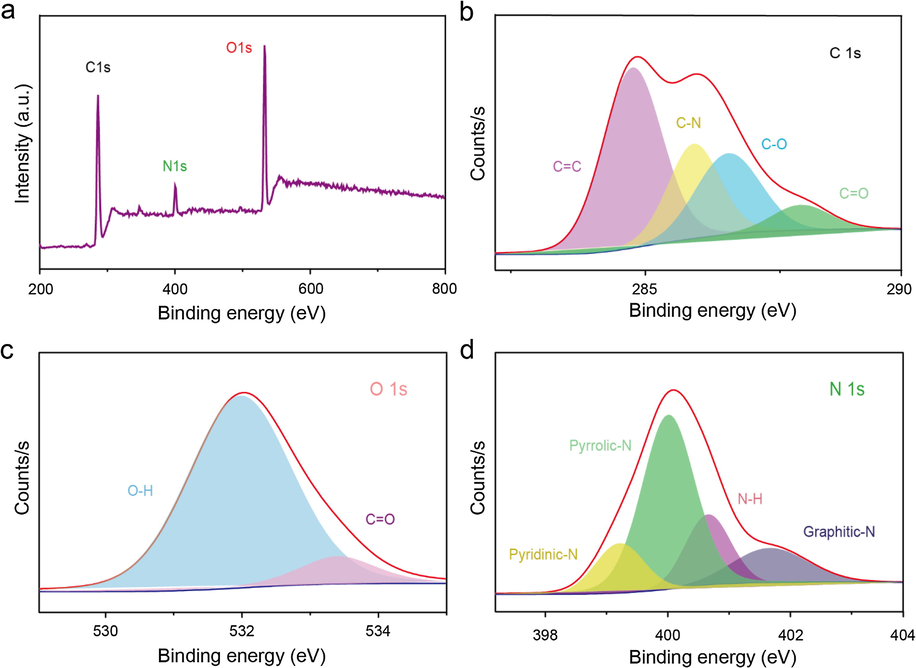
(a) XPS survey scan, (b) C1s, (c) O1s, and (d) N 1s spectra of the as-prepared N-CDs.
2.2 Fluorescent property and Fe3+ sensing of N-CDs
In order to study the fluorescence phenomena in the as-prepared N-CDs, the UV–Vis absorption and the transition leading to different excitations were investigated by the UV–Vis spectroscopy. The curves in Fig. 4a show the presence of excitable electrons in N-CDs within the range of 190–500 nm, giving two prominent peaks at 220 and 280 nm respectively, favoring the π → π* and n → π* transitions due to the presence of carbonyl groups of carboxylic acids or aldehydic and ketonic groups, or due to nitrogen-containing groups of amide, amine or imine nature on the surface of the N-CDs (Wang et al., 2014).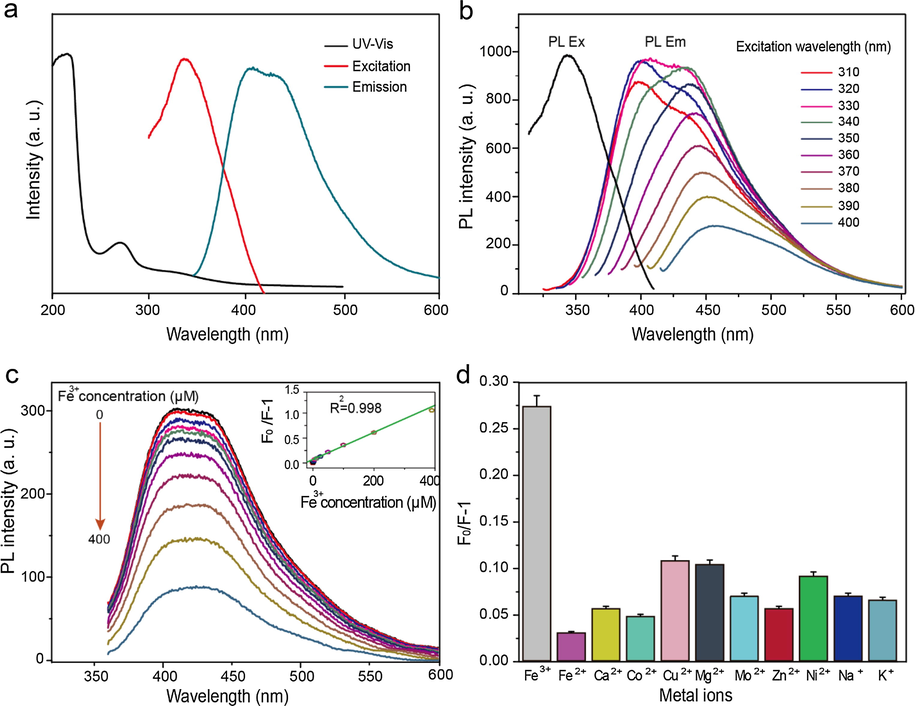
(a) UV–Vis absorption excitation and emission spectra of N-CDs. (b) The excitation and wavelength-dependent PL emission spectra of N-CDs. (c) PL emission spectra of N-CD’s with changing concentrations of Fe3+, confirming their high capacity to iron chelation. The upper left inset summarizes the range of different Fe3+concentrations used in this experiment, while in the upper right graph, linear calibration plots of PL variation of N-CD versus Fe3+ concentration (d) The N-CD’s specificity to Fe3+ is recorded comparatively to other common ions.
After confirming the light absorption in the UV–Vis range, the fluorescence phenomena was studied in the as-prepared N-CDs. Subsequently, the relevant maximum excitation and emission wavelengths of N-CDs were measured. The PL spectra were measured from 310 to 400 nm with a continuous increase of 10 nm in their excitation wavelength for each calculation, which resulted in a red-shift with increasing the emission wavelength, thus confirming the excitation-dependent PL emission of the N-CDs (Fig. 4b). At the excitation at 350 nm, the maximum emission was obtained for the as-prepared N-CDs with a peak at 440 nm. We then measured QY of the as-prepared N-CDs, which was calculated to be about 14.17% using quinine sulfate (54% in 0.1 mol/L H2SO4, λ ex = 360 nm) as a reference.
To quantitatively evaluate the detection ability of N-CDs to Fe3+, the fluorescent signals of an equal amount of N-CDs (500 μM) treated with different concentrations of Fe3+ were measured. There is a gradual decrease in the fluorescent intensity of N-CDs when the concentration of Fe3+ increases from 0.76 to 400 μM (Fig. 4c) with a limit of detection of 0.16 μM. The inset of Fig. 4c displays the result of plotting the Stern-Volmer constant (F0/F-1, where F0 is the fluorescence of N-CDs without Fe3+, and F is the fluorescence after the addition of Fe3+) against the Fe3+ concentration which gives a straight line showing the linear relationship between the Fe3+ concentration and the Stern-Volmer constant. To further investigate the selectivity of N-CDs towards Fe3+, the same concentration of N-CDs was treated with the equimolar concentrations of Fe3+ (see details in the section ‘metal ions detection’) and other metal ions of Fe2+, Ca2+, Co2+, Cu2+, Mg2+, Mo2+, Zn2+, Ni2+, Na+, and K+ (Fig. 4d). Among all these metal ions, only the N-CDs treated with Fe3+ show a significant decrease in the fluorescent intensity, which indicates the good selectivity of the N-CDs to Fe3+. The high selectivity of the N-CDs towards Fe3+ than the other metal ions such as Cu2+, Ni2+ and Fe2+ is due to the electron deficient nature of Fe3+ compared to other metal ions. It forms a coordinate bond between Fe3+ and the oxygen-containing functional groups of N-CDs, leading to a high fluorescence quenching (Wu et al., 2017).
To verify the chelation between N-CDs and Fe3+, the FTIR spectra of the Fe3+-treated N-CDs and the untreated N-CDs samples were obtained (Wang et al., 2014; Wu et al., 2017). As shown in Fig. 5a; the —C⚌O (∼1680 cm−1) and —COOH (∼3420 cm−1) peaks in the Fe3+ treated N-CDs sample are more prominent as compared to that of the untreated N-CDs, which is due to the coordinate bond formation between the Fe3+ and the surface functional groups of N-CDs, as the O atom present on the surface of N-CDs donates a lone pair of electrons to the Fe3+ forming a coordinate covalent bond between these two atoms of Fe3+ and O (Al-Jibouri et al., 2018; Majumder et al., 2015). In addition, an obvious peak is found at about 580 cm−1 in the Fe3+ treated N-CDs, owing to the formation of the Fe-O coordinate bond (Sowmiya et al., 2011) while the weak peak in the same region for the untreated N-CDs (the upper one in the Fig. 5a) might be due to the deformation of the hydrogen of their amides or the aromatic ring present in their basic carbon core skeleton (Wang et al., 2017). The FTIR results confirm the presence of coordinate covalent bonds formed between Fe3+ and the oxygen-contained functional groups of N-CDs, in which the N-CDs act as a donor of electron pairs while the Fe3+ is the acceptor of the electron pair represented in the Fig. 5d.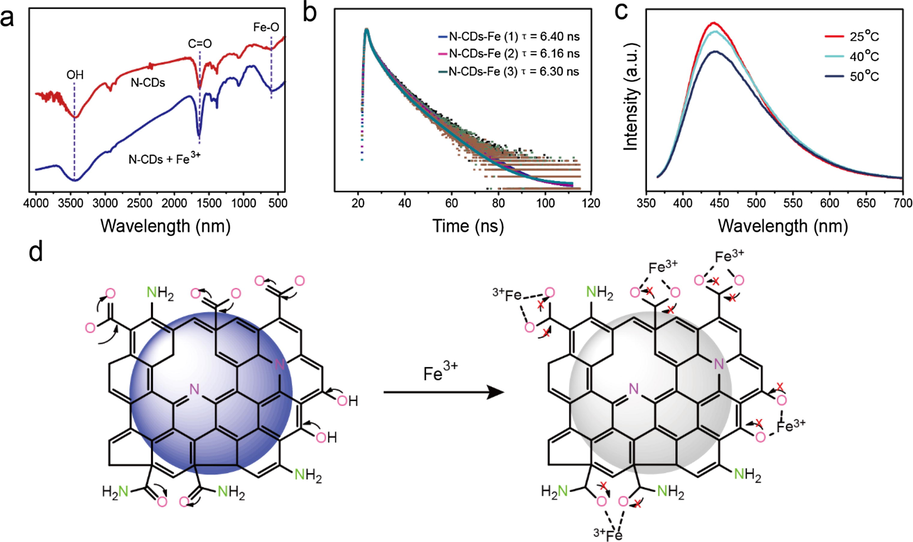
(a) FTIR of the N-CDs and Fe3+ chelated N-CDs. (b) PL lifetime of N-CDs with different concentrations of Fe3+. The concentrations for Fe3+ (1) = 0.027, Fe3+ (2) = 0.054 and Fe3+ (3) = 0.071 mM. (c) Temperature-dependent PL intensity of the Fe3+ chelated N-CDs. (d) Schematic showing the PL intensity quenching caused by Fe3+ chelation and inhibition of charge transfer between the atoms of different surface functional groups.
2.3 Quenching mechanism
Two types of fluorescent quenching, termed as dynamic/collisional quenching and static/ground state quenching are observed in interactions of fluorescent materials with quenchers. In dynamic quenching, soon after mixing, the quencher gets diffused into the solution of the fluorescent material. After irradiation, the interaction of the excited state fluorescent material and the quencher causes a fluorescence intensity decrease due to collisions. This process is time dependent, and in case of the quencher at a high concentration, more collisions are observed which results in greater fluorescence quenching. While in the static quenching, the quencher forms some interaction through chemical bonding with the fluorescent material, which makes a number of fluorescent molecules inactive towards the irradiation effect, thus causing a decrease in their fluorescence intensity. The other possible reason for the fluorescence intensity decrease in static quenching is that, after irradiation of the fluorescent material and quencher complex, the complex returns to the ground state without emission of the photon which is supposed that this energy get utilized in the new coordinate chemical bonds formation. So, both types of the quenching lead to a decrease in the fluorescence intensity. To further investigate the type of fluorescent quenching during the chelation of Fe3+ and N-CDs, the PL lifetime and temperature dependent PL intensity of N-CDs were tested and compared. In the PL lifetime experiments, a 2 ml of a 500 μM solution of N-CDs was treated with the Fe3+ aqueous solutions of different concentrations of 0.027, 0.054 and 0.071 mM, and their lifetimes were measured. The calculated lifetimes of 6.4, 6.1, and 6.3 ns do not show obvious change (Fig. 5b). As the fluorescence lifetime is independent of N-CDs concentration, hence this is not affected by the low concentration of N-CDs after the chelation. So the fluorescence lifetime time remains constant, and the quenching is considered to be the static quenching [35] (Xu et al., 2012).
Next, the temperature dependent fluorescence intensity of the Fe3+ treated N-CDs was evaluated. As shown in Fig. 5c, the fluorescence intensity of the Fe3+ treated N-CDs gradually decreases with increasing temperature, which is a typical case for the static quenching, and hence confirm the static quenching in the N-CDs because a high temperature can decrease the binding interactions of Fe3+ and N-CDs and thus the dissociation of the weakly bound complexes occurs, leading to the presence of a small amount of statically quenched undissolved complex in the medium [34] (Xu et al., 2012).
Based on the above experimental results, the PL quenching of N-CDs caused by Fe3+ chelation is owing to the alteration in the charge transfer of the surface functional groups on N-CDs (Al-Jibouri et al., 2018; Wang et al., 2017; El-Ayaan et al., 1997; Qu et al., 2013). The N-CDs display a high PL intensity when their surface functional groups, such as —COOH, —C (O) NH2 and —OH etc. have a free transfer of electrons amongst the oxygen and carbon atoms of these functional groups as shown in Fig. 5d (Wang et al., 2017; Shangguan et al., 2017). The charge transfer of the surface functional groups on N-CDs is blocked due to linking between the —O of N-CDs and the Fe3, in which the Fe3+ accepts the electron while the oxygen atoms of the N-CDs act as the electron donors, which results in the coordinate covalent bond formation between these two atoms. This new bond formed results in the restriction of the charge transfer, leading to the fluorescence quenching of the N-CDs (Al-Jibouri et al., 2018; Majumder et al., 2015; Wang et al., 2017; Xu et al., 2012; Shangguan et al., 2017; El-Ayaan et al., 1997; Qu et al., 2013; Ware and Richter, 1968; Huang et al., 2013).
3 Conclusion
We reported a hydrothermal route to synthesize the fluorescent N-CDs by using a single precursor of HEDTA, which acts as both carbon and nitrogen precursors. The N-CDs have blue emission and have been successfully applied for the detection of Fe3+ with a calculated quantum yield of 14.17%. The quenching mechanism of N-CDs by Fe3+ shows that the chelation of the N-CDs with Fe3+ is due to the inhibition of the electron transfer between the functional groups of —COOH, —C(O)NH2, and —OH present on the surface of N-CDs. Because the PL lifetime remains unchanged with changing concentration of Fe3+, and the PL intensity of N-CDs decreases with increasing temperature, the quenching mechanism was confirmed to be the static. This developed methodology has the advantages of low-cost and easy applications for Fe3+ sensing, and is promising for applications in environmental and biological issues.
3.1 Experimental section
3.1.1 Chemicals and instruments
N-(2-hydroxyethyl) ethylenediamine triacetic acid (crystalline) was purchased from Adamas Reagent Co., Ltd. China. FeCl3·6H2O, FeSO4·7H2O, CaCl2·6 H2O, Co (NO3)2·6 H2O, CuSO4·5 H2O, MgCl2·6 H2O, MoO2, Zn (NO3)2, NiSO4·6 H2O, NaCl, KBr, KCl, H2SO4 and NaOH were purchased from the Shanghai Macklin Biochemical Co. Ltd, China. The water used in all experiments was deionized (DI) water using Millipore S.A.S. 67,120 Molsheim, France. The morphology of the synthesized N-CDs was confirmed using an FEI Technai G20 transmission electron microscope (TEM) operated at 200 kV, followed by a high-resolution transmission electron microscope (HRTEM) characterization in FEI Technai F20 Model. X-ray diffraction (XRD) analysis with the copper tube was performed using X’pert PRO MPD of Parnaco analytical instrument, Netherlands. Atomic force microscopy (AFM) images were obtained by a Dimension 3100 AFM, operating in tapping mode with a scan rate of 1.20 Hz and a resolution of 512 × 512 pixels. A nitrogen-doped silicon tip with 1–10 Ω cm phosphorus (Veeco, MPP-11100-140) was used as the probe. Chemical composition analyses were carried out using X-ray photoelectron spectroscopy (XPS) VG ESCALAB 210 electron spectrometer with a multichannel detector. Infra-Red Affinity-1 Fourier-transform infrared (FTIR) spectrometer was used to confirm different functional groups present on the surface of N-CDs. UV–Vis spectra were recorded on a UV–Vis spectrophotometer 2600 (Shimadzu), followed by fluorescence studies on Steady-state/transient fluorescence spectrometer (NanoLOG-TCSPC).
3.1.2 Synthesis of HEDTA N-CDs
One-pot hydrothermal reaction was used to synthesize N-CDs. Briefly, 0.25 M, HEDTA solution was adjusted to prepare in 20 ml of DD water by continuous stirring and adding 0.8 mg of NaOH to achieve the dissolution. After getting a homogenous mixture, the solution was put in Teflon bottles inside the autoclave and heated up at 230 °C for 10 h in an oven. The mixture was allowed to cool to room temperature (25 °C) and was filtered using a 15–20 μm filter paper, followed by centrifugation. After that, the sample was concentrated using a rotary evaporator and dialyzed using a 3 kDa cut-off molecular weight dialysis bag with a change of water every 24 h for one week to further remove the impurities in the form of inorganic salts. After dialysis, the sample was concentrated using the rotary evaporator and collected for further use.
3.1.3 Morphology characterization
TEM was used to study the average size and distribution of the as-prepared N-CDs. HRTEM was further performed for observation and calculation of the crystallinity and the interlayer ‘d’ spacing values of N-CDs.
3.1.4 Compositional studies
The crystallinity and the graphitic nature of the as-prepared N-CDs were investigated by XRD. XPS and FTIR were used to explore the chemical structure, which give details about the elemental composition and functional groups on the surface of N-CDs.
3.1.5 Fluorescent experiments
The UV–Vis spectroscopic studies of the as-prepared N-CDs were carried out to measure the absorption, followed by the fluorescent measurements. The excitation-dependent emission and the maximum excitation and emission were measured by fluorescence spectroscopy.
3.1.6 Metal ion detection
The metal ion detection was carried out at room temperature (25 °C) in aqueous solution by using a fluorescent spectrophotometer. The 1 M solutions of the relevant metal cations, such as Fe3+, Fe2+, Ca2+, Co2+, Cu2+, Mg2+, Mo2+, Zn2+, Ni2+, Na+, and K+, were prepared from their salts using DI water in order to study N-CDs affinity with these metal cations. Typically, 0.5 ml of 500 μM solution of N-CDs was mixed with 1 ml of Tris-HCl buffer solution and then 0.5 ml of the metal cation solution was added to the mixture to study the chelation ability of the relevant metal cation present in the solution. Each time, the new sample solution of the related metal ions was prepared following the procedure described above in this section, and the change of the fluorescence intensity was recorded for comparing the metal chelation with the N-CDs. The mixed solution was placed on a fluorescent spectrophotometer for the fluorescent measurements at the excitation wavelength of 350 nm. In the case of Fe2+, the solution was acidified with 0.1 M H2SO4 to prevent its oxidation to Fe3+ and to retain it as a stable ion.
3.1.7 Fe3+ sensitivity measurement
For Fe+3 sensitivity studies, the prepared 1 M Fe3+ solution was further diluted to 0–400 μM in the ascending concentration order of 0 (as a control, which was the solution of N-CDs without adding the Fe3+ solution), 0.76, 1.56, 3.12, 6.25, 12.5, 25, 50, 100, 200, and 400 μM, respectively. For each experiment, a 0.5 ml of these Fe3+ aqueous solutions were mixed with 1 ml of Tris-HCl and 0.5 ml of 500 μM N-CDs solution, followed by further mixing for 5 min. The mixed samples were then analyzed for their PL emission by the fluorescent spectrophotometer at the excitation wavelength of 350 nm.
3.2 Quantum yield calculations
After that, the quantum yield and average lifetime of these NGQDs were calculated. For quantum yield, Quinine was dissolved in 0.1 M H2SO4 solution and was used as a standard which has a quantum yield of 54%. The formula used was QY u = QY s. Fu/Fs. As/Au, where QY = quantum yield, F = area of fitting, and A = absorbance, while s = standard, and u = sample.
3.2.1 Fluorescent quenching mechanism assay
The chelation of the Fe3+ with the N-CDs and the relevant fluorescent quenching phenomenon, along with the nature of fluorescent quenching were explored by the following studies. The chelation of Fe3+ with the as-prepared N-CDs was investigated through their FTIR spectra. In a typical experiment, two samples, consisting of 2 ml N-CDs (500 μM), and the other sample of 2 ml N-CDs mixed with 10 μl of 1 M Fe3+, were freeze-dried and mixed with KBr. The as-prepared samples were then analyzed by the FTIR instrument.
The quenching type was confirmed by the PL lifetime experiments and the temperature dependent fluorescence studies of the complexed samples. For the PL lifetime test, three different concentrations (0.027, 0.054, and 0.071 mM) of Fe3+ were mixed with same concentration (500 μM) of N-CDs, to make the total volume up to 2 ml, and then the PL lifetime was measured at the instrument. The fluorescent quenching was further confirmed by the PL intensity test of the Fe3+-N-CDs at the temperature of 25, 40, and 50 °C respectively. The PL instrument was attached with an external temperature controller, and the PL intensity was measured after setting and acquiring the required temperature.
Acknowledgment
The authors acknowledge financial support for this work from the National Key R&D Program “Nanotechnology” special focus (2016YFA0201600), National Natural Science Foundation of China (21422303, 21573049, 81602643, 21872043), Beijing Natural Science Foundation (2142036), the Knowledge Innovation Program and Youth Innovation Promotion Association, and Special Program of “One Belt One Road” of CAS. Also, financial support from the World Academy of Sciences and Chinese Academy of Sciences under the CAS-TWAS President’s fellowship program is highly acknowledged.
References
- Spectroscopic study of the effect of a new metal chelate on the stability of PVC. J. Assoc. Arab Univ. Basic Appl. Sci.. 2018;14:67-74.
- [Google Scholar]
- Iron chelation in the treatment of cancer: a new role for deferasirox? J. Clin. Pharmacol.. 2013;53:885-891.
- [Google Scholar]
- Acclimation of a low iron adapted Ostreococcus strain to iron limitation through cell biomass lowering. Sci. Rep.. 2017;7:327.
- [Google Scholar]
- Ultrasensitive and fast voltammetric determination of iron in seawater by atmospheric oxygen catalysis in 500 μL samples. Anal. Chem.. 2015;87:6357-6363.
- [Google Scholar]
- Intervalence charge transfer of ruthenium-nitrogen moieties embedded within nitrogen-doped graphene quantum dots. J. Phys. Chem. C. 2016;120:13303-13309.
- [Google Scholar]
- Electrolyzing synthesis of boron-doped graphene quantum dots for fluorescence determination of Fe(3+) ions in water samples. Talanta. 2017;164:100-109.
- [Google Scholar]
- Inorganic Biochemistry of Iron Metabolism: From Molecular Mechanisms to Clinical Consequences (second ed.). John Wiley & Sons Ltd; 2001. p. :1-355.
- Targeting Chelatable iron as a therapeutic modality in Parkinson’s disease. Antioxid. Redox Signal. 2014;21:195-210.
- [Google Scholar]
- Nitrogen-doped carbon-based dots prepared by dehydrating EDTA with hot sulfuric acid and their electrocatalysis for oxygen reduction reaction. RSC Adv.. 2014;4:32791-32795.
- [Google Scholar]
- Anaerobic oxidation of dopamine by iron (III) J. Chem. Soc. Dalton Trans. 1997:2813-2818.
- [Google Scholar]
- The emerging roles of carbon dots in solar photovoltaics: a critical review. Environ. Sci.: Nano. 2017;4:1216-1263.
- [Google Scholar]
- Design and synthesis of fluorescence “Turn-on” chemosensors based on photoinduced electron transfer in conjugated polymers. Macromolecules. 2005;38:2844-2849.
- [Google Scholar]
- Fluorescence-enhanced chemosensor for metal cation detection based on pyridine and carbazole. J. Org. Chem.. 2013;78:11318-11325.
- [Google Scholar]
- Fluorescent hydrogel waveguide for on-site detection of heavy metal ions. Sci. Rep.. 2017;7:7902.
- [Google Scholar]
- Polymeric nanocarriers for the treatment of systemic iron overload. Mol. Cell Ther.. 2015;3(3):1-15.
- [Google Scholar]
- Effect of zeta potential on the properties of nano-drug delivery systems - a review (part 1) Trop. J. Pharm. Res.. 2013;12:255-264.
- [Google Scholar]
- Fabrication of ultra-small monolayer graphene quantum dots by pyrolysis of trisodium citrate for fluorescent cell imaging. Int. J. Nanomedicine.. 2018;13:4807-4815.
- [Google Scholar]
- Photoluminescence from amino functionalized graphene quantum dots prepared by electrochemical exfoliation method in the presence of ammonium ions. RSC Adv.. 2017;7:18340.
- [Google Scholar]
- Controlling speciation of nitrogen in nitrogen-doped carbon dots by ferric ion catalysis for enhancing fluorescence. Carbon. 2017;111:133-141.
- [Google Scholar]
- The electron-transfer based interaction between transition metal ions and photoluminescent graphene quantum dots (GQDs): a platform for metal ion sensing. Talanta. 2013;117:152-157.
- [Google Scholar]
- Dendrimer modified silica gel for anion exchange chromatography: synthesis, characterization and application. Analyst. 2012;137:4610-4617.
- [Google Scholar]
- Graphene/carbon dot hybrid thin films prepared by a modified Langmuir−Schaefer Method. ACS Omega. 2017;2:2090-2099.
- [Google Scholar]
- Optical chemosensor for Ag+, Fe3+, and cysteine: information processing at molecular level. Org. Lett.. 2011;13:366-369.
- [Google Scholar]
- Optical sensor based on nanomaterial for the selective detection of toxic metal ions. Adv. Func. Mater.. 2007;17:3441-3446.
- [Google Scholar]
- Sulfur-doped graphene quantum dots as a novel fluorescent probe for highly selective and sensitive detection of Fe3+. Anal. Chem.. 2014;86:10201-10207.
- [Google Scholar]
- N-doped carbon dots: green and efficient synthesis on large-scale and their application in fluorescent pH sensing. New J. Chem.. 2017;41:10607-10612.
- [Google Scholar]
- Self-assembly of nitrogen-doped carbon dots anchored on bacterial cellulose and their application in iron ion detection. Carbohydr. Polym.. 2017;172:93-101.
- [Google Scholar]
- A comparative study on the structural, optical and magnetic properties of Fe3O4 and Fe3O4@SiO2 core-shell microspheres along with an assessment of their potentiality as electrochemical double layer capacitors. Dalton Trans.. 2015;44:7190-7202.
- [Google Scholar]
- Active sites on graphene-based materials as metal-free catalysts. Chem. Soc. Rev.. 2017;46:4501-4529.
- [Google Scholar]
- Photoluminescent green carbon nanodots from food-waste-derived sources: large-scale synthesis, properties, and biomedical applications. ACS Appl. Mater. Interfaces. 2014;6:3365-3370.
- [Google Scholar]
- Carbon dots: biomacromolecule interaction, bioimaging and nanomedicine. Coord. Chem. Rev.. 2017;343:256-277.
- [Google Scholar]
- Deferiprone reduces amyloid-beta and tau phosphorylation levels but not reactive oxygen species generation in hippocampus of rabbits fed a cholesterol-enriched diet. J. Alzheimers Dis.. 2012;30:167-182.
- [Google Scholar]
- Carbon dots prepared by hydrothermal treatment of dopamine as an effective fluorescent sensing platform for the label-free detection of iron (III) ions and dopamine. Chem. Eur. J.. 2013;19:7243-7249.
- [Google Scholar]
- Highly Fe (3+)-selective fluorescent nanoprobe based on ultrabright N/P codoped carbon dots and its application in biological samples. Anal. Chem.. 2017;89:7477-7484.
- [Google Scholar]
- Graphene quantum dots: emergent nanolights for bioimaging, sensors, catalysis and photovoltaic devices. Chem. Commun.. 2012;48:3686-3699.
- [Google Scholar]
- Rhodamine based organic nanoparticles for sensing of Fe3+ with high selectivity in aqueous medium: application to iron supplement analysis. Sens. Actuat. B: Chemical. 2014;204:617-621.
- [Google Scholar]
- Study on intramolecular charge transfer fluorescence properties of trans-4-[4′-(N, N′-dimethylamino) styryl] pyridine: effect of solvent and pH. J. Photochem. Photobiol. A Chem.. 2011;218:76-86.
- [Google Scholar]
- Chemical strategies for iron acquisition in plants. Angew. Chem. Int. Ed.. 2002;41:2259-2264.
- [Google Scholar]
- Chemical sensors based on amplifying fluorescent conjugated polymers. Chem. Rev.. 2007;107:1339-1386.
- [Google Scholar]
- Concentration-dependent color tunability of nitrogen-doped carbon dots and their application for iron(III) detection and multicolor bioimaging. J. Colloid Interface Sci.. 2018;521:33-41.
- [Google Scholar]
- Gram-scale synthesis of single-crystalline graphene quantum dots with superior optical properties. Nat. Commun.. 2014;5:5357.
- [Google Scholar]
- Gram-scale synthesis of single-crystalline graphene quantum dots with superior optical properties. Nat. Commun.. 2014;5:5357.
- [Google Scholar]
- One-step synthesis of self-doped carbon dots with highly photoluminescence as multifunctional biosensors for detection of iron ions and pH. Sens. Actuat., B: Chem.. 2017;241:73-79.
- [Google Scholar]
- Green synthesis of luminescent nitrogen-doped carbon dots from milk and its imaging application. Anal. Chem.. 2014;86:8902-8905.
- [Google Scholar]
- fluorescence quenching via charge transfer: the perylene-N, N-Dimethylaniline System. J. Chem. Phys.. 1968;48:1595-1601.
- [Google Scholar]
- High stability ferric chelates result in decreased iron uptake by the green alga Chlorella kessleri owing to decreased ferric reductase activity and chelation of ferrous iron. Botany. 2009;87:922-931.
- [Google Scholar]
- CdTe Quantum Dots (QDs) based kinetic discrimination of Fe2+ and Fe3+, and CdTe QDs-Fenton hybrid system for sensitive photoluminescent detection of Fe2+. Anal. Chem.. 2009;81:6252-6257.
- [Google Scholar]
- Hydrothermal synthesis of nitrogen-doped carbon quantum dots from microcrystalline cellulose for the detection of Fe3+ ions in an acidic environment. RSC Adv.. 2017;7:44144-44153.
- [Google Scholar]
- Synthesis, characterization and metal ion-sensing properties of two Schiff base derivatives. Spectrochim. Acta. A Mol. Biomol. Spectrosc.. 2012;91:375-382.
- [Google Scholar]
- Fluorescent nanoprobes for sensing and imaging of metal ions: recent advances and future perspectives. Nano Today. 2016;11:309-329.
- [Google Scholar]
- Microwave assisted one-pot synthesis of graphene quantum dots as highly sensitive fluorescent probes for detection of iron ions and pH value. Talanta. 2015;150:54-60.
- [Google Scholar]
- Ultrafast ammonia-driven, microwave-assisted synthesis of nitrogen-doped graphene quantum dots and their optical properties. Nanophotonics. 2017;6:259-267.
- [Google Scholar]
- Strongly green-photoluminescent graphene quantum dots for bioimaging applications. Chem. Commun.. 2011;47:6858-6860.
- [Google Scholar]


