

Translate this page into:
Single-stage microwave assisted coconut shell based activated carbon for removal of Zn(II) ions from aqueous solution – Optimization and batch studies
⁎Corresponding author. chazmier@usm.my (Mohd Azmier Ahmad)
-
Received: ,
Accepted: ,
This article was originally published by Elsevier and was migrated to Scientific Scholar after the change of Publisher.
Peer review under responsibility of King Saud University.
Abstract
Health and environmental issues associated with heavy metal ions have received serious attention from communities worldwide. This work explores the potential of coconut shell as activated carbon (CSAC), in adsorbing zinc, Zn(II) ions. This adsorbent was prepared via a single-stage microwave irradiation technique under the flow of carbon dioxide, CO2 gas. CSAC posed BET surface area of 625.61 m2/g, 513.25 m2/g of mesopores surface area, total pore volume of 0.42 cm3/g, and average pore diameter of 4.55 nm. Zeta potential distribution on CSAC was found to be −21 mV. Response surface methodology (RSM) had suggested that the optimum values of variables were 450 W and 3.17 min for radiation power and radiation time respectively, which resulted in 69.65% of Zn(II) removal and 44.32% of CSAC’s yield. Based on F-value, radiation power (473.62) and radiation time (140.50) posed major and moderate effects on Zn(II) removal, respectively. Meanwhile, CSAC’s removal was significantly affected by radiation power (78.84) and less affected by radiation time (7.06). In a batch study, when the initial concentration of Zn(II) was increased, Zn(II) uptakes increased as well. On contrary, Zn(II) removal percentage decreased with the increase of Zn(II)’s initial concentration. Multilayer adsorption of Zn(II) onto CSAC had occurred since this adsorption system followed Freundlich isotherm the best, and the monolayer adsorption capacity, Qm for Zn(II) was revealed to be 7.87 mg/g. The kinetic data of the Zn(II)-CSAC adsorption system was best described by pseudo-first-order (PFO) which indicated the role of physisorption. In the regeneration study, CSAC’s mass and Zn(II) adsorption uptakes had reduced from 100% to 37% and 77%, respectively, after 6 regeneration cycles.
Keywords
Adsorption process
Activated carbon
Heavy metals
Response surface methodology
Optimization
Microwave heating

1 Introduction
All countries are doing their best to provide good water quality and water supply to their people. One of the biggest challenges is to supply safe drinking water that is free from harmful water pollutants. Due to this reason, many methods are available to treat heavy metals from wastewater, but the adsorption process using activated carbon (AC) is regarded as one of the best methods for this task (Fahim Chyad et al., 2021). AC was utilized in many third-world countries to get safe clean drinking water. Besides having a large surface area between 1046 m2/g (Yusop et al., 2021b) and 2500 m2/g (Kuptajit et al., 2021) which enhanced the adsorption capacity of adsorbent, AC’s surface is known to be filled with polar functional groups which had an affinity towards positively charged ions of heavy metals. The demand for AC around the globe is increasing due to its effectiveness in treating different types of pollutants such as dyes (Yusop et al., 2021b, Yusop et al., 2021a, Ahmad et al., 2021c), heavy metals (Yusop et al., 2020, Peláez-Cid et al., 2020, Yao et al., 2021), pharmaceutical products (Ahmad et al., 2020a, Sousa et al., 2021), antibiotics (Maataoui et al., 2019), naphthalene (Gradel et al., 2021), harmful gases (Chen et al., 2021, Lin et al., 2021), carbon dioxide, CO2 (Ramezanipour Penchah et al., 2021, Soleimanpour et al., 2021), phenolic compounds (Kuśmierek et al., 2020), microplastics (Baldikova et al., 2020), pesticides (Aziz et al., 2021) and others. Due to its versatility and its ability to improve water quality and clean water effectively, it is not surprised that in 2014, approximately 1,100,000 metric tons of AC were produced by industries to cope with the world’s needs, and this amount is expected to increase 10% by the following years (Fahim Chyad et al., 2021). Unfortunately, commercially available AC which is acquired from non-renewable sources such as lignite, and the bituminous cost is causing the total cost of AC production to be expensive (Yusop et al., 2021a). Thus, an effort is continuously made by researchers to find other cheap raw materials to replace the existing non-renewable ones. For instance, different types of agricultural wastes are spotted to be promising alternatives to AC’s precursor such as pomegranate fruit peel (Ahmad et al., 2021a), palm kernel shell (Rashidi et al., 2021), durian peel (Yusop et al., 2021a), potato peel (Osman et al., 2019), peanut shell (Ahmad et al., 2021b), acacia wood (Yusop et al., 2021b), meranti wood (Ahmad et al., 2020c), date stone (Hijab et al., 2020), corncob (Yusop et al., 2020), Glyricidia sepium woodchip (Ahmad et al., 2020b), Alpinia galanga stem (Ahammad et al., 2021), pomelo peel (Bello et al., 2015), lemon grass (Ahmad et al., 2019) and so forth. Converting these agricultural wastes into AC is a brilliant move to solve their disposal problems and add their commercial values, which in turn can help farmers to earn side incomes. Furthermore, open burning of these wastes that can cause haze, destroy minerals in the soil, and emission of greenhouse gases like carbon dioxide, CO2, and carbon monoxide, CO can be prevented.
By definition, heavy metals are elements that pose atomic weight and density of 63.5–200.6 g/mol and greater than 5 g/cm3, respectively (Ismail et al., 2019). Certain heavy metals are acting as micronutrients or macronutrients in humans, animals, and plants which makes them very vital to life (Mariana et al., 2021). However, when their existence in the environment goes beyond the permissible level, they can turn into highly toxic substances to living creatures. Heavy metals such as chromium, arsenic, and cadmium are known to be linked to health issues like the damage to the kidney, liver, nerve tissues, skin irritation, and cancer of important organs such as lung, bladder, liver, and skin (Mirzabeygi et al., 2017, Iqbal and Yahya, 2021). Not only that but other severe effects including permanent damage to the brain, fetus, and kidney together with memory problems are noted to manifest upon high-level exposure to mercury (Hussain et al., 2019). One of the most popular and extensively utilized heavy metals in industries is zinc. Similar to other types of heavy metals, zinc above the permitted level is harmful and corresponds to diseases like anemia, internal hemorrhage, skin ulceration, respiratory disorder, chromosome alterations, dermatitis, and so on (Tang et al., 2019, Chen et al., 2018). Due to the resistance of heavy metals towards molecular breakdown, their discharge from industries to the environment need to be seriously prohibited because once they are in the environment, they can impart toxicity for a very long time.
In manufacturing AC, the dependency on conventional furnaces has shifted to microwave ovens due to the shorter time of activation required, thus reducing the amount of energy and activation gas used significantly, without compromising the performance of resulted in AC, as shown in many studies (Yusop et al., 2021b, Ahmad et al., 2020c, Yusop et al., 2017, Ahmad et al., 2017). In the conventional furnace, heat is transferred from the heating element to the sample via the conduction process and heat propagates from the outer layer of the sample into the inside of the sample. On contrary, in the microwave heating technique, microwave energy is absorbed by the sample and causes the molecules in the sample to rotate at an extremely high speed, thus dissipating heat, starting from the inner layer of the sample into the outer layer of the sample. Agricultural wastes are a good microwave absorbance which is why the microwave heating technique has been effective in converting them into AC. Therefore, in this study, coconut shell has been selected as a precursor to be converted to AC (CSAC) via a single-stage microwave irradiation technique to treat Zn(II) ions from an aqueous solution. The coconut shell was selected due to its hard physical properties which reflect relatively high carbon content and good mechanical strength which is desirable to withstand the regeneration process. To optimize the removal of Zn(II) ions and CSAC’s yield, a mathematical tool named response surface methodology (RSM) was utilized to find the optimum preparation conditions of radiation power and radiation time. The traditional approach to optimization which involved changing one factor at a time is a tedious process and offers fewer advantages. On contrary, RSM is known to pose many advantages including (i) able to analyze the effect of a single factor, interaction factor and quadratic effect of factor, (ii) able to create a relationship between variables and responses in mathematical form, (iii) presenting effects of variables in 3-dimensional (3D) graph, (iv) required much smaller number of experiments, and (v) result of experiments can be validated by analysis of variance (ANOVA).
2 Materials and methods
2.1 Materials
Analytical reagent grade metal salts of Zn(NO3)2 and NaOH were purchased from Sigma and Merck Company and were utilized directly without any modification. Inert gas of nitrogen, N2, and activating gas of CO2 were obtained from MOX Gases Berhad, Malaysia with quality of 99.9%. Precursor of coconut shell was collected from a market located in Nibong Tebal, Pulau Pinang, Malaysia.
2.2 Preparation of CSAC
Once received, the coconut shell was cleaned from impurities and dirt using water and then stored in an oven for a drying process at 110 °C for 24 h. The dried coconut shell was ground into smaller pieces between the size of 0.5 to 1 mm. Then, a coconut shell was inserted inside a modified microwave oven (EMW2001W, Sweden) and N2 gas was allowed to enter the oven to chase out oxygen for 10 min. After that, N2 gas was switched with CO2 gas, and the coconut shell was heated at 364–616 Watt for 2–8 min. CO2 gas was purged through the oven to give a gasification effect on the sample. Once microwave activation was done, the CO2 gas was switched to N2 gas one more time, and sample was allowed to cool to room temperature before being taken out from the oven. The flow rate of N2 and CO2 gases used in all steps of CSAC’s preparation was fixed at 150 cm3/min. The yield of CSAC was calculated using the following equation:
2.3 Characterization methods
The samples were characterized in terms of surface area, surface morphology, proximate analysis, and surface chemistry. The determination of samples’ surface area, pore volume together with pore diameter was conducted using a volumetric adsorption analyzer (Micromeritics ASAP 2020) that is based on the adsorption of N2 gas at 77 K. Surface area was calculated by quantifying the amount of gas adsorbed onto a solid surface using the static volumetric method and employing isotherm equation of Brunauer-Emmet-Teller (BET). Total pore volume was evaluated to be the volume of nitrogen in liquid form at a relative pressure of 0.99. The surface morphology of samples was scanned using a scanning electron microscope (SEM) (LEO SUPRA 55VP, Germany). Samples on the plate were inserted under an electron microscope to be analyzed at a magnification factor of 1000x. A simultaneous thermal analyzer (STA) was used to obtain a proximate analysis of the samples. The initial weight of the samples was assumed to be 100% and any weight loss afterward corresponded to the percentage of moisture, volatile matter, fixed carbon, and ash content. Moisture content was obtained by measuring the weight loss after samples were heated up from room temperature to 110 °C in an N2 gas atmosphere, until the completion of the dehydration process. Weight loss occurred from 110 °C until 850 °C associated with volatile matter and weight loss took place after N2 gas was switched to O2 gas corresponding to fixed carbon. The balance of the weight was attributed to ash content. Surface functional groups in samples were determined by using Fourier transform infrared (FTIR) spectroscope (IR Prestige 21 Shimadzu, Japan) between 400 and 4000 cm−1 wavenumber range.
2.4 Sample analysis method
The concentration of Zn(II) ions was quantified by using an atomic absorption spectrometer (AAS) with WizAArd Software. A good linear regression of the calibration curve for Zn(II) ions was constructed and a standard solution of concentration between 2 and 10 ppm was prepared through a dilution of 1000 ppm stock solution using 0.1 M nitric acid, HNO3. A solution containing Zn(II) ions was tested at a wavelength of 214 nm.
2.5 Experimental design
One of the objectives of this research was to determine optimum conditions in preparing CSAC with the aid of standard RSM design, specifically known as central composite design (CCD). The experimental data were analyzed using Design-Expert software (STAT-EASE Inc. Minneapolis, USA) v. 6.0.6. This study had chosen radiation power (X1) and radiation time (X2) as variables whereas Zn(II) removal (Y1) and CSAC’s yield (Y2) were selected as responses. The design matrix consisted of 13 sets of experiments with 5 replicates generated by the software since 2 variables were used. The summary of variables, responses, and their studied ranges is shown in Table 1. The following equation was the standard form of the quadratic model generated by RSM:
Unit
Notation
Coded Values
−1
0
+1
Variables
Radiation power
Watt (W)
X1
364
490
616
Radiation time
Minutes (Min)
X2
2.00
5.00
8.00
Responses
Zn(II) percent removal
%
Y1
–
CSAC’s yield
%
Y2
–
2.6 Equilibrium study
The purpose of performing an equilibrium study is to find the correlation between parameters (different initial concentration and contact time) and adsorption performance (Zn(II) uptakes and percentage removal). Zn(II) solution with six different concentrations (2, 4, 6, 8, and 10 mg/L) was prepared in conical flasks. The dosage used was 0.2 g of CSAC per 200 mL of Zn(II) solution. These conical flasks were placed inside a water bath shaker to provide homogenous mixing during the adsorption process. The temperature and agitation speed of the water bath shaker was fixed to be 30 °C and 150 rpm. Eq. (3) was used to determine adsorption uptakes of Zn(II) whereas Eq. (4) was utilized to find the percentage removal of Zn(II) (Kayan, 2019):
2.7 Isotherm study
Three isotherm models were used to fit equilibrium data which are Langmuir, Freundlich, and Temkin. The correlation coefficient, R2 generated by these isotherms were compared to determine which isotherm represents the Zn(II)-CSAC adsorption system the best. The equations for these isotherm models were given as follows:
Langmuir (Langmuir, 1918):
Freundlich (Freundlich, 1906):
Temkin (Temkin and Pyzhev, 1940):
2.8 Kinetic study
An almost similar method as in the equilibrium study was performed to assess the kinetic behavior of the Zn(II)-CSAC adsorption system. However, unlike in the equilibrium study, the sample of Zn(II) concentration was determined at a predetermined time interval from 15 to 180 min. In the kinetic study, six different initial concentrations of Zn(II) solutions (10, 20, 40, 60, 80, and 100 mg/L), each with a volume of 200 mL and an adsorbent dose of 0.2 g were used. The solution temperature was fixed at 30 °C whereas the agitation speed of the water bath shaker was set at 150 rpm. Two kinetic models were utilized to test kinetic data and their equations are presented as follows:
Pseudo-first-order (PFO) (Lagergren and Svenska, 1898):
Pseudo-second-order (PSO) (Ho and McKay, 1999):
2.9 Regeneration study
The regeneration study was conducted by reactivating saturated CSAC via microwave heating technique at optimum radiation power and radiation time, under the gasification effect of CO2 at a flow rate of 150 cm3/min. CSAC was reactivated 5 times and was tested in an adsorption study. Adsorption performance in the regeneration study was performed using Zn(II) concentration of 10 mg/L, solution volume of 200 mL, and regenerated CSAC, CSACn dose of 0.2 g. The weight loss of CSACn was determined by employing the following formula:
3 Results and discussions
3.1 Characteristics of CSAC
The values of surface area and pore characteristics for precursor and CSAC were tabulated in Table 2. Both BET surface area and mesopores surface area were noticed to rise sharply from 1.72 to 625.61 m2/g and from 0.02 to 513.25 m2/g, respectively. Carbon-based materials like the precursor were filled with non-polar compounds which makes them a good microwave absorber. Once microwave energy is absorbed, the electron in the precursor rotated at an extremely high speed, thus dissipating heat that heated the whole sample. As a result, moisture, volatile matter, and tar compounds inside the precursor were successfully removed, thus leading to the formation of a pores network. The formation of pores on the sample not only increases the surface area in CSAC but also increases the total pore volume from 0.0001 to 0.42 cm3/g. The average pore diameter of the precursor was found to be 1.13 nm which lies in the micropores region whereas, after activation, the average pore diameter for CSAC was noticed to be 4.55 nm which corresponded to the mesopores region. Contradicted to the precursor, CO2 gas molecules are non-polar, thus they do not absorb microwave energy efficiently. Therefore, during the activation process, CO2 gas molecules diffused into the pores of the sample and got heated from the sample via the convection heat transfer process. After gaining the energy, CO2 molecules bombarded the existing pores vigorously, thus widening the diameter of the pores from micropores to mesopores type of pores.
Samples
BET surface area (m2/g)
Mesopores surface area (m2/g)
Total pore volume (cm3/g)
Average pore diameter (nm)
Coconut shell (precursor)
1.72
0.02
0.0001
1.13
CSAC
625.61
513.25
0.4200
4.55
To verify further the type of pores that existed on precursor and CSAC, an analysis of N2 adsorption–desorption isotherm was made, as shown in Fig. 1. The curve for precursor followed isotherm type I which reflected domination of micropores type of pores on it. On contrary, the hysteresis loop on the curve for CSAC signified that it behaved similarly to isotherm type IV, which signified the existence of both mesopores and micropores (Yusop et al., 2021b).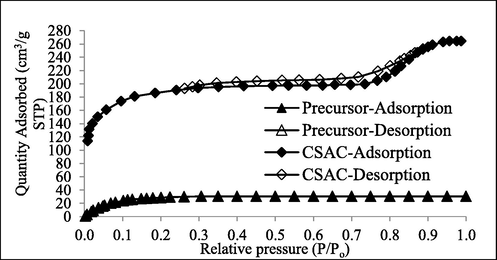
N2 adsorption–desorption curves for samples at STP.
Fig. 2 shows the SEM images for precursor and CSAC. The surface of the precursor was found to be rough, and pores were extremely hard to be seen. This was expected since the precursor has good physical strength which signified that it is not porous inside. On contrary, pores on CSAC’s image were found to exist and scattered everywhere. These pores were originally filled with components like lignin, cellulose, hemicellulose, and tar. Once the precursor was subjected to heat treatment via microwave heating, those original components vaporized and leaving the sample with vacant spaces (Yusop et al., 2021a). CO2 gas molecules diffused into these vacant spaces and became hyperactive from the heat, thus bombarding these vacant spaces and widening their size.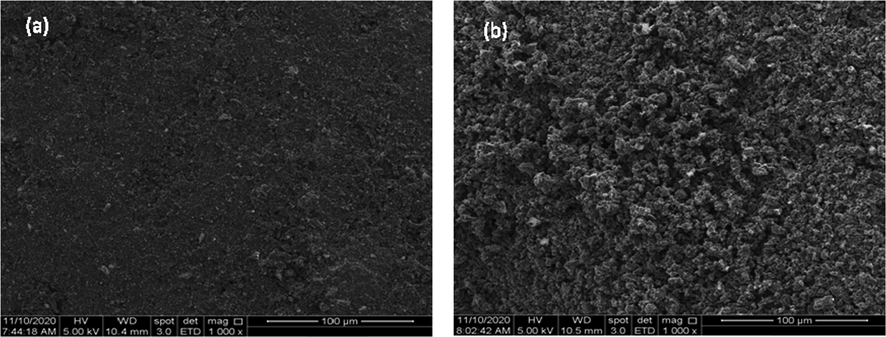
SEM image of (a) coconut shell and (b) CSAC (1000x).
The atomic composition in CSAC can be determined from the elemental spectrum, as shown in Fig. 3. Carbon atom was found to monopolize the elemental composition in CSAC with 87.15%. Other elements such as O, Fe, Al, Si, and S only contribute 22.85% of the total atoms in CSAC. An extremely high percentage of C atoms was required as they made up the structure matrices in CSAC. Plus, the existence of inorganic elements in a low percentage was needed to provide different types of surface chemistry on CSAC’s surface, which aided the adsorption process as well.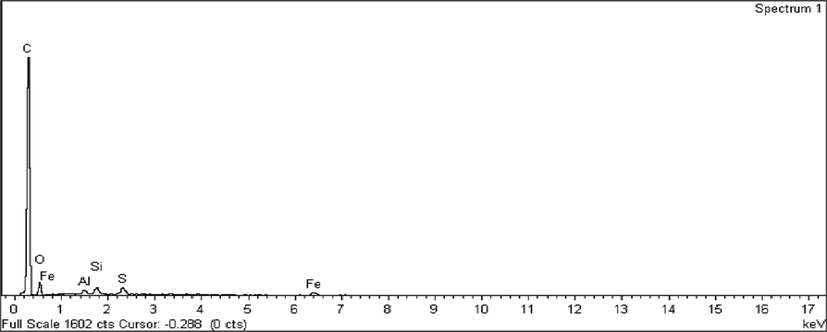
Elemental spectrum for CSAC.
Besides surface area, the adsorption performance of AC is very much dependent on the functional groups that existed on the AC’s surface. These functional groups are polar compounds that pose electron cloud, which can either attract positively charged adsorbate or repel negatively charged adsorbate molecules, thus affecting the adsorption capacity of the adsorbate. To substantiate the functional groups on CSAC, FTIR analysis was done. The summary of bandwidth peaks and their associated functional compounds are presented in Table 3. Different types of functional groups were found to survive the heat treatment during the activation process and therefore, retained their existence on the surface of CSAC at different intensities. These functional groups were alcohol, O—H, nitrile, C—N, alkene, C⚌C, alkyne, C≡C, and carboxylic, COOH. The intensity of these compounds is directly proportional to their polarity. Therefore, adsorption of positively charged Zn(II) ions on CSAC was significantly boosted by strong functional compounds (carboxylic at 3525 cm−1 and alcohol at 3604 and 3716 cm−1) and medium functional compounds (aldehyde at 2800 cm−1 and carboxylic at 2875 and 3007 cm−1).
Peak
Intensity
Compounds
748
Weak
Alcohol, O—H
1215
Weak
Nitrile, C—N
1625
Weak
Carbonyl groups
1689
Weak
Alkene, C⚌C
1778
Weak
Alkene, C⚌O
2102
Weak
Alkyne, C≡C
2206
Weak
Nitrile, C—N
2308
Weak
Nitrile, C—N
2800
Medium
Aldehyde, C⚌O
2875
Medium
Carboxylic, COOH
3007
Medium
Carboxylic, COOH
3525
Strong
Hydroxyl, O—H stretching
3604
Strong
Alcohol, O—H
3716
Strong
Alcohol, O—H
Further verification on the characteristic of CSAC’s surface was made in terms of zeta potential distribution, as shown in Fig. 4. It was found that the zeta potential for CSAC was −21 mv, thus signifying that in a natural state, CSAC’s surface was negatively charged, which granted the stability of CSAC. The negative value obtained for zeta potential confirmed that functional groups with strong intensity were dominant on CSAC’s surface as compared to the weak ones since strong intensity functional groups corresponded to higher polarity and stronger electron clouds. A similar result can be found in the study conducted by (Yusop et al., 2021b) where acacia wood-based AC was found to have negative zeta potential as well.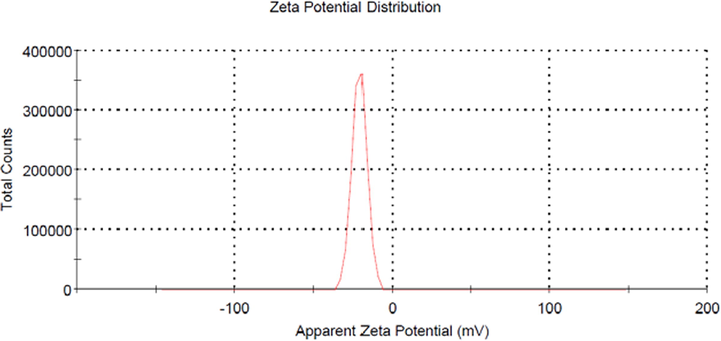
Zeta potential for CSAC.
3.2 Optimization study
3.2.1 Regression model development
Table 4 shows the complete matrix of experimental design in manufacturing CSAC. RSM via CCD had suggested quadratic models to represent both responses of Zn(II) removal and CSAC’s yield. The experimental values for Zn(II) removal was ranged from 56.34 to 97.36% whereas for CSAC’s yield, the range was between 33.86 and 45.21%. The models generated by the software for both responses were quadratic type, therefore, the mathematical equations that relate variables with responses contained single factor term, interaction factor term and quadratic factor term, as given as follows:
Run
CSAC’s preparation variables
Responses
Radiation power, X1 (Watt)
Radiation time, X2 (min)
Zn(II) removal, Y1 (%)
CSAC’s yield, Y2 (%)
1
490.00 (0)
8.00 (+1)
86.51
40.53
2
490.00 (0)
5.00 (0)
77.25
44.25
3
616.00 (+1)
5.00 (0)
90.44
38.41
4
490.00 (0)
5.00 (0)
78.25
42.11
5
616.00 (+1)
8.00 (+1)
97.36
35.16
6
490.00 (0)
5.00 (0)
77.11
42.93
7
364.00 (−1)
2.00 (−1)
56.34
45.21
8
364.00 (−1)
8.00 (+1)
62.14
40.99
9
490.00 (0)
2.00 (−1)
69.45
44.12
10
490.00 (0)
5.00 (0)
77.92
42.32
11
490.00 (0)
5.00 (0)
80.11
42.19
12
616.00 (+1)
2.00 (−1)
75.15
33.86
13
364.00 (−1)
5.00 (0)
61.72
42.98
Zn(II) removal, Y1:
CSAC’s yield, Y2:
The diagnostic plots of predicted versus actual for Zn(II) removal and CSAC’s yield are provided in Fig. 5(a) and (b), respectively. Four parameters were utilized to validate these plots namely correlation coefficient, R2, adjusted correlation coefficient, Adj. R2, standard deviation, S.D. and adequate precision, A.P. It was found that R2 and Adj. R2 for both responses of Zn(II) removal (0.9896 and 0.9823) and CSAC’s yield (0.9185 and 0.8603), respectively, were good, thus signifying the effectiveness of developed models in predicting the experimental data. It was noticed that value of Adj. R2 is a bit lower compared to R2. This was expected since Adj. R2 is an improved version of R2 where the insignificant factors were omitted from the calculation. More discussion on significant factors was provided in the next section. S.D. values for both Zn(II) removal and CSAC’s yield responses were 1.55 and 1.28, respectively, which implied that the dispersion of the data from the average value is small. A.P. was used to measure the signal-to-noise ratio, and its values obtained for Zn(II) removal and CSAC’s yield responses were 40.40 and 11.47, respectively. Since these values were greater than 4, it signified that the ratio was adequate and can be used to navigate the design space.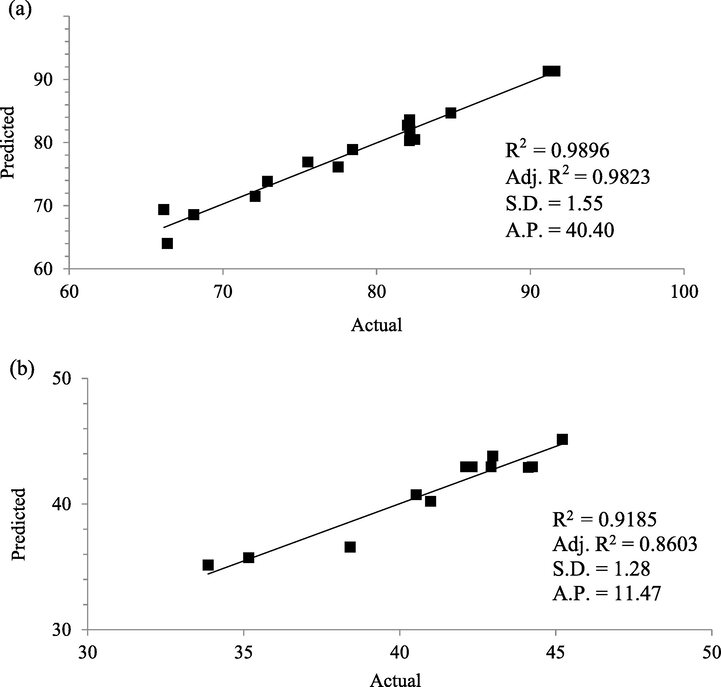
Plots of Predicted versus Actual for (a) Zn(II) removal and (b) CSAC’s yield Analysis of Variance (ANOVA).
For a better understanding of the models developed, analysis of variance (ANOVA) was analyzed. According to Tounsadi et al. (2016) and Liew et al. (2018), the terms in the model developed are significant towards the response if Prob > F is <0.05 and the F value is high. The terms that fulfilled these conditions are known to be contributed to the experiment and not random. ANOVA results for both Zn(II) removal and CSAC’s yield responses are given in Table 4(a) and (b), respectively. ANOVA confirmed that both models were significant due to the Prob > F value for Zn(II) removal and CSAC’s yield were < 0.0001 and 0.0011, respectively. For both studied responses, lack of fit was found to be insignificant, which implied that the models had a good fitting on the experimental data, and variables studied pose a noteworthy effect on the responses (Melliti et al., 2021).
Based on Table 5a, the significant terms for Zn(II) removal response were radiation power, X1, radiation time, X2, the quadratic effect of radiation power, X22, and interaction effect of radiation power and radiation time, X1X2. By evaluating the F value for these significant factors, their ranking in affecting Zn(II) removal was as follows; X1 (68.75%) > X12 (18.44%) > X1X2 (6.65%) > X2 (6.16%). Based on Table 5b, the significant terms of CSAC’s yield response were radiation power, X1, and the quadratic effect of radiation power, X12. By judging the F value, it was revealed that CSAC’s yield was greatly affected by X1 with 91.78%, followed by X12 with 8.22%. Similar observations were noticed in a study performed by Yusop et al. (2021b) and Ahmad et al. (2017) where radiation power was found to be superior compared to radiation time in impacting both adsorbate removal and adsorbents’ yield.
Source
Sum of Squares
DF
Mean Square
F Value
Prob > F
Model
1612.71
5
322.54
133.85
<0.0001
Significant
x1
1141.26
1
1141.26
473.62
<0.0001
x2
338.55
1
338.55
140.50
<0.0001
x12
35.50
1
35.50
14.73
0.0064
x22
7.84
1
7.84
3.26
0.1142
x1x2
67.32
1
67.32
27.94
0.0011
Residual
16.87
7
2.41
Lack of fit
11.07
3
3.69
2.55
0.1940
Not significant
Pure error
5.79
4
1.45
Cor Total
1629.58
12
Source
Sum of Squares
DF
Mean Square
F Value
Prob > F
Model
130.20
5
26.04
15.78
0.0011
Significant
x1
78.84
1
78.84
47.79
0.0002
x2
7.06
1
7.06
4.28
0.0773
x12
21.15
1
21.15
12.82
0.0090
x22
3.57
1
3.57
2.17
0.1846
x1x2
7.62
1
7.62
4.62
0.0687
Residual
11.55
7
1.65
Lack of fit
8.36
3
2.79
3.49
0.1291
Not significant
Pure error
3.19
4
0.80
Cor Total
141.74
12
3.2.2 Three-dimensional (3D) surface plot
One of the perks of utilizing RSM was the ability to analyze the pattern of variables affecting responses in 3-D plots. Fig. 6(a) and (b) presented the 3D surface plot for Zn(II) removal and CSAC’s yield, respectively. Based on Fig. 6(a), the lowest Zn(II) removal was achieved when both variables were at the minimum level within the studied range. As both variables increased, Zn(II) removal was also increased. However, the increment of Zn(II) removal was more significant when radiation power increased compared to radiation time. At high radiation power, more microwave energy was absorbed by the sample, thus increasing its temperature. At high temperatures, rigorous volatilization and thermal cracking processes took place, thus creating more pores, which in turn, increases the adsorption capacity. Increasing radiation time prolonged the process of pore creation, thus improving the adsorption capacity of CSAC as well. Maximum Zn(II) removal was obtained when radiation power and radiation time were at their highest level, signifying that both variables have a positive effect on this response. On contrary, Fig. 6(b) showed that both variables had a negative effect on CSAC’s yield. This was proven when the lowest value of this response was obtained when radiation power and radiation time were at their highest level and vice versa. As both variables decreased, CSAC’s yield was seen to increase too. However, the decrease in CSAC’s yield was more rapid when radiation power increased compared to the increase in radiation time. At high radiation power and radiation time, excess microwave energy is absorbed by the sample causing the carbon matrix that made up the structure of the sample to rupture, thus reducing the CSAC’s yield.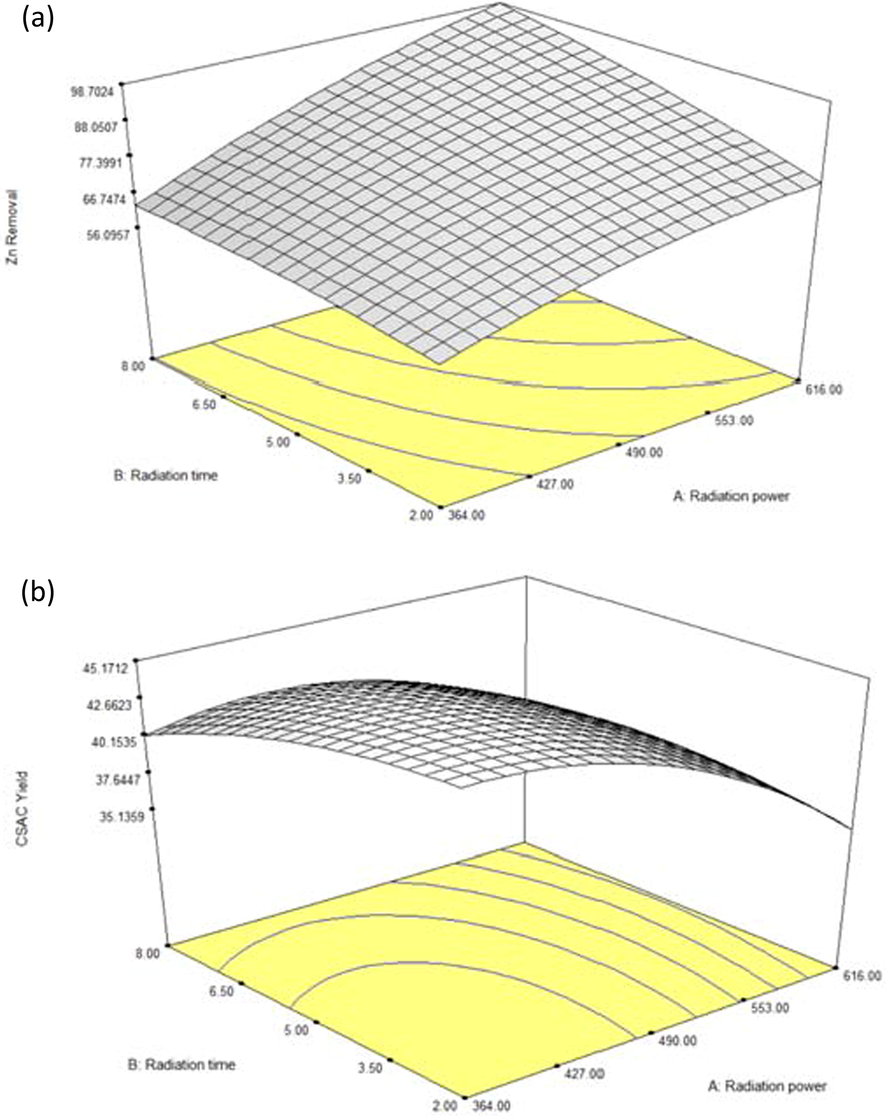
3D Plots for (a) Zn(II) removal and (b) CSAC’s yield.
3.2.3 Optimization on CSAC’s preparation variables
Since radiation power and radiation time posed different interest regions on Zn(II) removal and CSAC’s yield responses, RSM based on CCD was utilized in this study for factors optimization purposes. To do this, variables and responses were set to be “minimum” and “maximum”, respectively. The model validation for CSAC’s preparation variables is given in Table 6. The optimum values for radiation power and radiation time were 450 W and 3.17 min, respectively, which corresponded to optimum Zn(II) removal of 69.50% and optimum CSAC’s yield of 44.32%. A small error percentage of 5.25 and 5.48% for radiation power and radiation time respectively, were obtained which proved that the models developed were excellent in predicting the actual data.
Variables
Responses
Radiation power, X1 (watt)
Radiation time, X2 (min)
Zn(II) removal, Y1 (%)
CSAC’s yield, Y2 (%)
Predicted
Actual
Error
Predicted
Actual
Error
450
3.17
69.50
65.85
5.25
44.32
41.89
5.48
3.3 Equilibrium study
The plot of Zn(II) uptakes versus time for different initial concentration is given in Fig. 7(a) whereas the plot of Zn(II) percent removal versus time for different initial concentration is provided in Fig. 7(b). Adsorption capacity and percentage removal of Zn(II) were found to increase with time, and after certain time, they reached a plateau state, indicated that CSAC had exhausted, equilibrium state had attained and the net adsorption–desorption of Zn(II) by CSAC was equal in magnitude. Also, at equilibrium state, repulsion between Zn(II) ions in the bulk phase and solid phase took place, which caused a stop to the adsorption process. Based on Fig. 7(a), it was observed that lower initial concentration achieved equilibrium at lower contact time and vice versa. In fact, 3 to 4 h were needed by initial concentration of 1 and 2 mg/L, 6 to 8 h were required by initial concentration of 4 and 6 mg/L and 20 to 22 h were necessitated by initial concentration of 8 and 10 mg/L to attain equilibrium state. Lower initial concentration contains low ratio of Zn(II) ions to available surface area for adsorption process to proceed. Therefore, lower contact time was needed for Zn(II) molecules to be adsorbed by CSAC due to less competition occurred at lower initial concentration. On contrary, the exact opposite occurred at higher initial concentration. The adsorption capacity of Zn(II) was noticed to increase from 0.99 to 6.67 mg/g as the initial concentration increased from 1 mg/L to 10 mg/L. According to Tharaneedhar et al. (2017), higher initial concentration posed larger mass transfer driving force which can triumphed mass transfer resistance between Zn(II) ions in bulk phase and Zn(II) ions in solid phase, resulted higher Zn(II) uptakes. Based on Fig. 7(b), percentage removal of Zn(II) was noticed to decrease from 99.00 to 66.70% as the initial concentration increased from 1 to 10 mg/L. The ratio of Zn(II) ions: available surface area was lower at lower initial concentration, therefore CSAC’s surface area can easily became saturated and vice versa. Similar observation was found in the study made by Ahmad et al. (2021b) where initial concentration of adsorbate had positive and negative effect on adsorption capacity and percentage removal, respectively.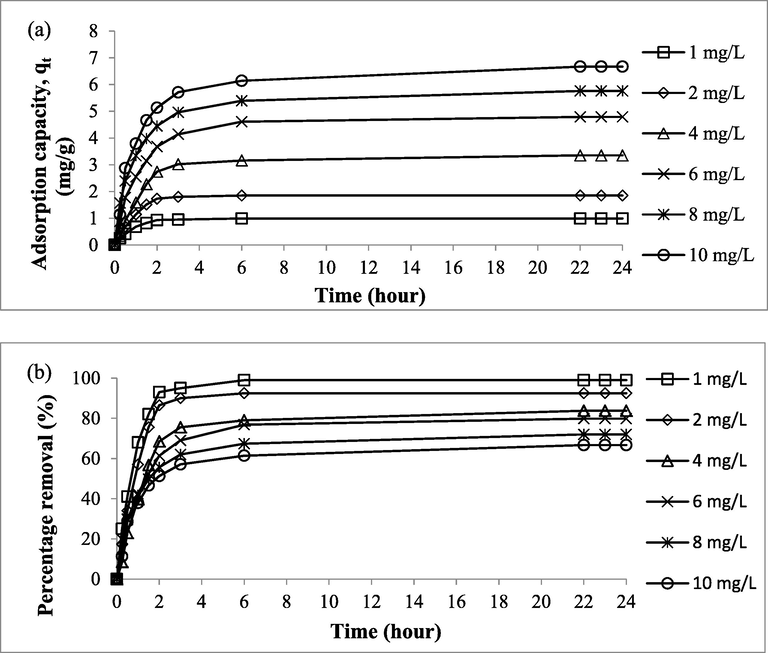
Plots of (a) Zn(II) Adsorption Uptakes versus Time and (b) Zn(II) Percentage Removal versus Time at Different Initial Concentration at 30 °C.
The plots of solution pH effect and solution temperature effect on the adsorption capacity of Zn(II) are presented in Fig. 8(a) and (b), respectively. Based on Fig. 8(a), it was found that Zn(II) ions adsorption onto CSAC preferred to occur in alkaline condition. In fact, highest adoption capacity of 8.65 mg/g was obtained at pH 12. At pH 2, lowest Zn(II) adsorption capacity of 4.29 mg/g was achieved. At this pH condition, extremely high number of H+ ions existed in the solution, and they were competing with Zn(II) ions to be adsorbed by CSAC. Even worse, H+ ions induced the surface of CSAC to be positively charged, therefore crating a repulsion between positively charged Zn(II) ions and the surface of CSAC, thus resulted low adsorption capacity. As the solution pH increased to 4, no significant change on adsorption capacity was noticed since excess H+ ions were still existed in the solution. Notable increment in adsorption capacity occurred at pH 6 with 6.98 mg/g. At pH 6, OH– ions existed in large numbers and they induced the surface of CSAC to be negatively charged, thus enhanced the attraction between Zn(II) ions and CSAC’s surface. As the solution pH increased to 8 and 10, the adsorption capacity of Zn(II) increased steadily. However, at pH 12, no significant increment in adsorption capacity was observed. This phenomenon occurred because further increment OH– ions in the solution can no longer enhanced the inducement effect of CSAC’s surface. As shown in Fig. 8(b), Zn(II)-CSAC adsorption system performed the best at solution temperature of 30 °C with 7.42 mg/g. As the solution temperature increased to 45 and 60 °C, adsorption capacity dropped to 6.91 and 6.47 mg/g, respectively. At high solution temperature, Zn(II) ions received more kinetic energy which enables them to escape from solid phase to bulk phase. Plus, higher solution temperature caused the intensity of electrostatic attraction between adsorbate and adsorbent’s surface to reduce, thus led to the low adsorption capacity of adsorbate (Doumic et al., 2015). Similar result was obtained in the study conducted by Zakaria et al. (2021) where higher solution temperature caused a decrease in methylene blue adsorption.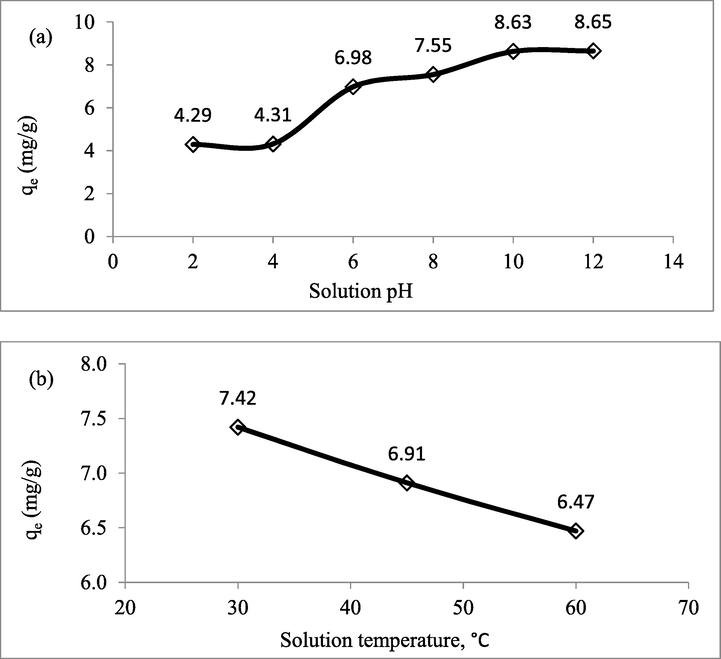
Plots of (a) Adsorption Capacity of Adsorbent versus Different Solution pH and (b) Adsorption Capacity of Adsorbent versus Different Solution Temperature.
3.4 Isotherm study
The adsorption data was tested on three isotherms models namely Langmuir, Freundlich, and Temkin. The non-linear plots of these isotherms are given in Fig. 9 while the parameters obtained from these isotherms are presented in Table 7. Adsorption data were found to fit both Langmuir and Freundlich isotherms equally well, due to high R2 values of 0.9908 and 0.9861, respectively. Temkin isotherm scored the lowest R2 value of 0.9229, signifying that the adsorption data did not follow this isotherm. Freundlich isotherm was found to be accurate in predicting the adsorption capacity of CSAC at equilibrium, thus producing the lowest error percentage of 8.35%. On contrary, Langmuir and Temkin yielded a relatively high error percentage of 22.50 and 29.45%, respectively. Based on R2 and error percentage, it can be concluded that the adsorption data followed Freundlich isotherm the best, which implied multilayer adsorption of Zn(II) ions occurred on the heterogeneous surface of CSAC. Langmuir monolayer adsorption capacity, Qm was found to be 7.87 mg/g as shown in Table 8. Despite having a relatively moderate surface area, the adsorption capacity of CSAC for Zn(II) ions was the lowest as compared to other adsorbents in Table 8. This can be explained by the fact that besides surface area, the adsorption capacity of the adsorbent relied majorly on the pore size and the modification of the adsorbent’s surface. The average pore diameter for CSAC of 4.25 nm was relatively big, thus its efficiency was reduced in adsorbing Zn(II) with a diameter of 0.148 nm. This was supported by the finding by Park et al. (2017) where Cu(II) had stronger adsorption than Zn(II) because its diameter was smaller (0.146 nm) which enabled Cu(II) ion to compenetrate into the micropores of biochar. Plus, CSAC did not undergo any surface modifications to increase its adsorption capacity unlike Borassus flabellifer and Aspergillus tamarii bio-sorbents (Saravanan et al., 2020). The adsorption system in this study was found to be favorable since the heterogeneity factor, nF obtained from the Freundlich isotherm was in the range of 1 to 10.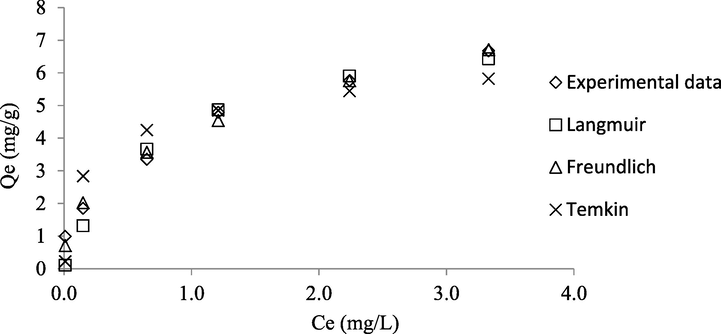
Non-linear Plots of Isotherm Models and Experimental Data.
Parameters
Isotherms
qe,exp (mg/g)
0.99, 1.85, 3.35, 4.79, 5.76, 6.67
Langmuir
Qm (mg/g)
7.87
KL (L/mg)
1.34
R2
0.9908
qe,cal
0.10, 1.32, 3.66, 4.87, 5.90, 6.43
Error (%)
22.50
Freundlich
nF
2.59
KF (mg/g)(L/mg)1/n
4.21
R2
0.9861
qe,cal
0.71, 2.02, 3.57, 4.54, 5.76, 6.71
Error (%)
8.35
Temkin
AT (L/mg)
126.30
BT (L/mg)
0.96
R2
0.9229
qe,cal
0.22, 2.83, 4.25, 4.85, 5.44, 5.82
Error (%)
29.45
Adsorbents
Adsorption Capacity (mg/g)
BET Surface area (m2/g)
Average Pore Diameter (nm)
References
Coconut shell-based AC
7.87
625.61
4.55
This study
Rare Earth
8.74
–
–
(Esmaeili and Eslami, 2020)
Rice straw-based char
38.60
162.60
–
(Park et al., 2017)
Borassus flabellifer and Aspergillus tamarii
49.79
–
–
(Saravanan et al., 2020)
Chitosan coated diatomaceous earth beads
127.44
6.40
3.23
(Salih and Ghosh, 2018)
Alginic acid-ester derivatives materials
200.00
–
–
(Boughrara et al., 2021)
Palm oil kernel shell-based AC
–
660.76
4.73
(Karri and Sahu, 2018)
Tamarix hispida based AC
246.40
1006.00
2.31
(Khademi et al., 2015)
3.5 Kinetic study
Pseudo-first-order (PFO) and pseudo-second-order (PSO) were chosen to fit kinetic data to provide a better insight into the kinetic behavior of the studied adsorption system. Kinetic models were beneficial in providing the value of rate constant and type of adsorption that corresponded to the rate-limiting step, which can be physisorption or chemisorption. The linearized plots of PFO and PSO are provided in Fig. 10(a) and (b), respectively, whereas the summary of kinetic parameters is tabulated in Table 9. Based on Table 9, it was revealed that PFO fitted kinetic data the best due to high R2 and low error of greater than 0.9575 and < 10.88, respectively. PFO indicated that the rate-limiting step in Zn(II)-CSAC adsorption system may be contributed by physisorption. A similar result was obtained in a study performed by Lad and Makkawi (2020) where physisorption plays a major role in the adsorption of methyl chloride on AC. The value of k1 was noticed to decrease from 1.14 to 0.59 s−1 as the initial concentration increased from 1 to 10 mg/L. This decreasing trend was expected since the ratio of adsorbate to the surface area at higher initial concentration was high, thus causing a slower adsorption process and lower rate constant.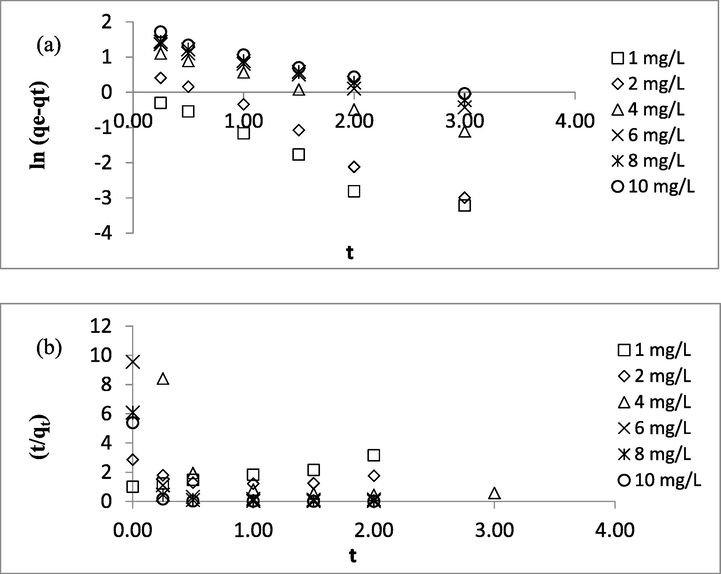
Plots of Kinetic Models (a) PFO and (b) PSO.
Adsorbates initial concentration (mg/L)
qe, exp (mg/g)
Pseudo-first order
Pseudo-second order
qe, cal (mg/g)
k1 (s−1)
R2
Δqt (%)
qe, cal (mg/g)
k2 (L/mol.s)
R2
Δqt (%)
1
0.99
0.93
1.14
0.9575
5.59
1.01
1.04
0.95
2.11
2
1.85
1.76
1.30
0.9836
4.86
2.47
0.08
0.25
233.43
4
3.35
3.71
0.83
0.9908
10.88
0.51
0.79
0.41
115.32
6
4.79
4.32
0.65
0.9947
9.72
0.33
1.99
0.38
106.96
8
5.76
5.33
0.60
0.9932
7.47
0.53
1.28
0.36
109.22
10
6.67
6.28
0.59
0.9755
5.85
0.62
1.12
0.33
109.25
3.6 Regeneration study
It is important to carry out a regeneration study to promote sustainability by reducing the usage of energy and materials to create new adsorbents. Sadly, biomass-based AC can be regenerated several times only before their performance declined significantly. Plus, the regeneration of the adsorbent very much depends on the mechanical strength of the precursor. The regeneration plot for Zn(II)-CSAC is given in Fig. 11. It was noticed that the weight of CSAC dropped from 100 to 37% after 6 regeneration cycles. Similarly, the adsorption performance of CSAC was also decreased from 100 to 77% after 6 regeneration cycles. Heat treatment on CSAC in every regeneration cycle caused the carbon matrix that made up CSAC’s structure to rupture, thus diminishing the pores on CSAC. This led to the reduction in both CSAC’s yield and adsorption efficiency.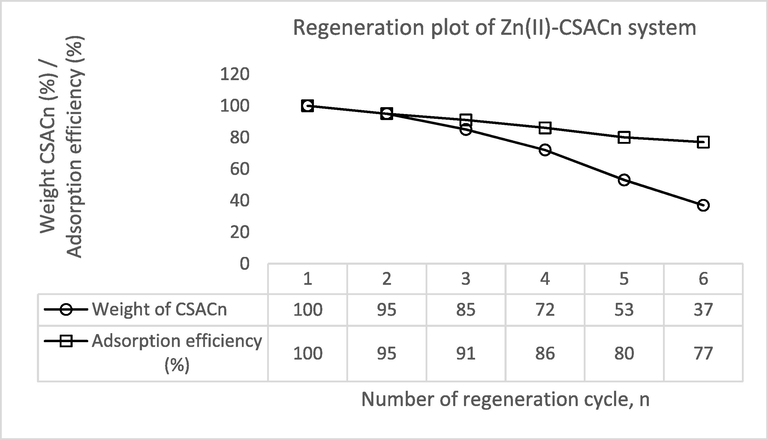
Regeneration Plot for Zn(II)-CSACn System.
4 Conclusion
This study successfully synthesized optimized CSAC via microwave heating and CO2 gasification technique. CSAC was found to pose 625.61 m2/g, 513.25 m2/g, and 0.42 cm3/g of BET surface area, mesopores surface area, and pore volume, respectively. The average pore diameter for CSAC was found to be 4.55 nm, which lies in the mesopores region. This was confirmed by N2 adsorption–desorption analysis where its curve follows isotherm type IV, thus indicating the dominance of mesopores type of pores in CSAC. FTIR analysis revealed a variety of polar functional groups existed on the surface of CSAC such as nitrile (C—N), alkene (C⚌C), alkyne (C≡), aldehyde (C⚌O), carboxylic (COOH), and alcohol (OH). Zeta potential reading was found to be −21 mv, thus confirming that the surface of CSAC was negatively charged at the natural state. Optimization study using RSM revealed the optimum preparation conditions of CSAC were 450 W of radiation power and 3.17 min of radiation time, which translated into Zn(II) removal of 69.50% and CSAC’s yield of 44.32%. The response of Zn(II) removal was affected 68.75%, 18.44%, 6.65%, and 6.16% by radiation power, quadratic of radiation power, interaction factors, and radiation time, respectively. On the other hand, the response of CSAC’s yield was significantly affected by a radiation power of 91.78%, followed by a quadratic radiation power of 8.22%. For lower initial concentrations of 1, 2, 4, and 6 mg/L, the contact time needed to achieve an equilibrium state was between 3 and 8 h whereas a higher initial concentration of 8 and 10 mg/L required 20 to 22 h to attain the same state. As initial concentration increased from 1 to 10 mg/L, adsorption capacity for Zn(II) was found to increase from 0.99 to 6.67 mg/g, while Zn(II) removal percentage was revealed to decrease from 99.00 to 66.70%. Freundlich isotherm produced a high R2 value of 0.9861 and a low error percentage of 8.35, signifying that Zn(II)-CSAC adsorption study followed this isotherm. The monolayer adsorption capacity for Zn(II) was 7.87 mg/g. In terms of kinetic, PFO fitted kinetic data the best which indicated that physisorption was dominant in the rate-limiting step of the adsorption process. In the regeneration study, after 6 regeneration cycles, the weight of CSAC and its adsorption performance dropped from 100% to 37 and 77%, respectively. For the economic reason, it is best to regenerate CSAC for up to 5 cycles only. CSAC was found to be a good adsorbent to remove heavy metals of Zn(II), thus providing safe water access to humans.
Acknowledgement
This research is supported by Ministry of Higher Education Malaysia under the Fundamental Research Grant Scheme (project code: FRGS/1/2021/TK0/USM/01/3).
Declaration of Competing Interest
The authors declare that they have no known competing financial interests or personal relationships that could have appeared to influence the work reported in this paper.
References
- Preparation of Alpinia galanga Stem Based Activated Carbon via Single-step Microwave Irradiation for Cationic Dye Removal. Sains Malaysiana. 2021;50:2251-2269.
- [CrossRef] [Google Scholar]
- Atenolol sequestration using activated carbon derived from gasified Glyricidia sepium. Arabian J. Chem.. 2020;13:7544-7557.
- [Google Scholar]
- Adsorption of basic green 4 onto gasified Glyricidia sepium woodchip based activated carbon: Optimization, characterization, batch and column study. Arabian J. Chem.. 2020;13:6887-6903.
- [Google Scholar]
- Sorption studies of methyl red dye removal using lemon grass (Cymbopogon citratus) Chem. Data Collect.. 2019;22
- [Google Scholar]
- Optimization and batch studies on adsorption of Methylene blue dye using pomegranate fruit peel based adsorbent. Chem. Data Collect. 2021:100676.
- [Google Scholar]
- Optimization of Microwave-Assisted Durian Seed Based Activated Carbon Preparation Conditions for Methylene Blue Removal. AIP Conf. Proc.. 2017;1892:1-11.
- [Google Scholar]
- Adsorption of methylene blue from aqueous solution by peanut shell based activated carbon. Mater. Today: Proc. 2021
- [Google Scholar]
- Carbonization of sludge biomass of water treatment plant using continuous screw type conveyer pyrolyzer for methylene blue removal. IOP Conference Series: Earth and Environmental Science. 2021;765:012112
- [Google Scholar]
- Activated Carbon from Meranti Wood Sawdust Waste Prepared by Microwave Heating for Dye Removal. In: Yaser A.Z., ed. Advances in Waste Processing Technology. Springer Nature Singapore Pte. Ltd: Singapore; 2020.
- [Google Scholar]
- Single-Stage Microwave-Assisted Coconut-Shell-Based Activated Carbon for Removal of Dichlorodiphenyltrichloroethane (DDT) from Aqueous Solution: Optimization and Batch Studies. Int. J. Chem. Eng.. 2021;2021:9331386.
- [CrossRef] [Google Scholar]
- Baldikova, E., Pospiskova, K., Safarik, I., 2020. Removal of Bisphenol A Using Magnetically Responsive Spruce Chip Biochar. 43, 168–171.
- Scavenging malachite green dye from aqueous solutions using pomelo (Citrus grandis) peels: kinetic, equilibrium and thermodynamic studies. Desalin. Water Treat.. 2015;56:521-535.
- [Google Scholar]
- Removal of Zn(II) and Ni(II) heavy metal ions by new alginic acid-ester derivatives materials. Carbohydr. Polym.. 2021;272:118439
- [Google Scholar]
- New Inorganic-Organic Hybrid Materials and Their Oxides for Removal of Heavy Metal Ions: Response Surface Methodology Approach. J. Inorg. Organomet. Polym Mater.. 2017;27:427-435.
- [Google Scholar]
- Multivariate optimization for removal of some heavy metals using novel inorganic–organic hybrid and calcined materials. Sep. Sci. Technol.. 2018;53:2563-2572.
- [Google Scholar]
- Gaseous Hydrogen Sulfide Removal Using Macroalgae Biochars Modified Synergistically by H2SO4/H2O2. Chem. Eng. Technol.. 2021;44:698-709.
- [Google Scholar]
- Structure evolution of polyethylene-plasticizer film at industrially relevant conditions studied by in-situ X-ray scattering: The role of crystal stress. Eur. Polym. J.. 2018;101:358-367.
- [Google Scholar]
- Efficient removal of Orange G using Prussian Blue nanoparticles supported over alumina. Catal. Today. 2015;240:67-72.
- [Google Scholar]
- Adsorption of Pb (II) and Zn (II) ions from aqueous solutions by Red Earth. MethodsX. 2020;7:100804
- [Google Scholar]
- Fahim Chyad, T., Fahim Chyad Al-Hamadani, R., Ageel Hammood, Z., Abd Ali, G. 2021. Removal of Zinc (II) ions from industrial wastewater by adsorption on to activated carbon produced from pine cone. Mater. Today: Proc..
- Adsorption of Naphthalene on Activated Wood Charcoal Derived from Biomass Gasification. Chem. Eng. Technol.. 2021;44:972-979.
- [Google Scholar]
- Active Carbon from Microwave Date Stones for Toxic Dye Removal: Setting the Design Capacity. Chem. Eng. Technol.. 2020;43:1841-1849.
- [Google Scholar]
- Pseudo-second order model for sorption processes. Process Biochem.. 1999;34:451-465.
- [Google Scholar]
- Hussain, S., Habib-ur-Rehman, M., Khanam, T., Sheer, A., Kebin, Z., Jianjun, Y., 2019. Health Risk Assessment of Different Heavy Metals Dissolved in Drinking Water. 16, 1737.
- In vivo assessment of reversing aminoglycoside antibiotics nephrotoxicity using Jatropha mollissima crude extract. Tissue Cell. 2021;72:101525
- [Google Scholar]
- Heavy metals in milk: global prevalence and health risk assessment. Toxin Rev.. 2019;38:1-12.
- [Google Scholar]
- Process optimization and adsorption modeling using activated carbon derived from palm oil kernel shell for Zn (II) disposal from the aqueous environment using differential evolution embedded neural network. J. Mol. Liq.. 2018;265:592-602.
- [Google Scholar]
- Inorganic-organic hybrid materials and their adsorbent properties. Adv. Compos. Hybrid Mater.. 2019;2:34-45.
- [Google Scholar]
- The behaviors and characteristics of a mesoporous activated carbon prepared from Tamarix hispida for Zn(II) adsorption from wastewater. J. Environ. Chem. Eng.. 2015;3:2057-2067.
- [Google Scholar]
- A study on pore formation of high surface area activated carbon prepared by microwave-induced plasma with KOH (MiWP-KOH) activation: Effect of temperature-elevation rate. Chem. Eng. Process. – Process Intensif.. 2021;167:108511
- [Google Scholar]
- Adsorption Properties of Activated Tire Pyrolysis Chars for Phenol and Chlorophenols. Chem. Eng. Technol.. 2020;43:770-780.
- [Google Scholar]
- Adsorption of Methyl Chloride on Molecular Sieves, Silica Gels, and Activated Carbon. Chem. Eng. Technol.. 2020;43:436-446.
- [Google Scholar]
- Lagergren, S., Svenska, K., 1898. About the theory of so-called adsorption of soluble substances. 24, 1–39.
- The adsorption of gases on plane surfaces of glass, mica and platinum. J. Am. Chem. Soc.. 1918;40:1361-1403.
- [Google Scholar]
- Microwave pyrolysis with KOH/NaOH mixture activation: A new approach to produce micro-mesoporous activated carbon for textile dye adsorption. Bioresour. Technol.. 2018;266:1-10.
- [Google Scholar]
- Carbon consumption and adsorption-regeneration of H2S on activated carbon for coke oven flue gas purification. Environ. Sci. Pollut. Res. 2021
- [Google Scholar]
- Mariana, M., H.P.S, A.K., Mistar, E. M., Yahya, E. B., Alfatah, T., Danish, M., Amayreh, M. 2021. Recent advances in activated carbon modification techniques for enhanced heavy metal adsorption. J. Water Process Eng., 43, 102221.
- Spiramycin adsorption behavior on activated bentonite, activated carbon and natural phosphate in aqueous solution. Environ. Sci. Pollut. Res.. 2019;26:15953-15972.
- [CrossRef] [Google Scholar]
- Date Palm Fiber as a novel precursor for porous activated carbon: Optimization, characterization and its application as Tylosin antibiotic scavenger from aqueous solution. Surf. Interfaces 2021:101047.
- [Google Scholar]
- Heavy metal contamination and health risk assessment in drinking water of Sistan and Baluchistan, Southeastern Iran. Hum. Ecol. Risk Assess.: Int. J.. 2017;23:1893-1905.
- [Google Scholar]
- How to Read and Interpret FTIR Spectroscope of Organic Material. J. Indonesian J. Sci. Technol.. 2019;4:22.
- [Google Scholar]
- Production and characterisation of activated carbon and carbon nanotubes from potato peel waste and their application in heavy metal removal. Environ. Sci. Pollut. Res.. 2019;26:37228-37241.
- [Google Scholar]
- Recycling of rice straw through pyrolysis and its adsorption behaviors for Cu and Zn ions in aqueous solution. Colloids Surf., A. 2017;533:330-337.
- [Google Scholar]
- Synthesis of activated carbons from black sapote seeds, characterization and application in the elimination of heavy metals and textile dyes. Chin. J. Chem. Eng.. 2020;28:613-623.
- [Google Scholar]
- Piperazine-modified activated carbon as a novel adsorbent for CO2 capture: modeling and characterization. Environ. Sci. Pollut. Res. 2021
- [Google Scholar]
- Evaluation of kinetics and mechanism properties of CO2 adsorption onto the palm kernel shell activated carbon. Environ. Sci. Pollut. Res.. 2021;28:33967-33979.
- [Google Scholar]
- Adsorption of Zn(II) ions by chitosan coated diatomaceous earth. Int. J. Biol. Macromol.. 2018;106:602-610.
- [Google Scholar]
- Enhanced Zn(II) ion adsorption on surface modified mixed biomass – Borassus flabellifer and Aspergillus tamarii: Equilibrium, kinetics and thermodynamics study. Ind. Crops Prod.. 2020;153:112613.
- [Google Scholar]
- Modification of activated carbon by MIL-53(Al) MOF to develop a composite framework adsorbent for CO2 capturing. Environ. Sci. Pollut. Res.. 2021;28:37929-37939.
- [Google Scholar]
- The comparison of two activation techniques to prepare activated carbon from corn cob. Biomass Bioenergy. 2013;48:250-256.
- [Google Scholar]
- Optimizing microwave-assisted production of waste-based activated carbons for the removal of antibiotics from water. Sci. Total Environ.. 2021;752:141662
- [Google Scholar]
- Electro-assisted Adsorption of Zn(II) on Activated Carbon Cloth in Batch-Flow Mode: Experimental and Theoretical Investigations. Environ. Sci. Technol.. 2019;53:2670-2678.
- [Google Scholar]
- Kinetics and ammonia synthesis on promoted iron catalyst. Acta Physiochim. USSR. 1940;12:327-356.
- [Google Scholar]
- Prediction and interpretation of adsorption parameters for the sequestration of methylene blue dye from aqueous solution using microwave assisted corncob activated carbon. Sustain. Mater. Technol.. 2017;11:1-11.
- [Google Scholar]
- Highly efficient activated carbon from Glebionis coronaria L. biomass: Optimization of preparation conditions and heavy metals removal using experimental design approach. J. Environ. Chem. Eng.. 2016;4:4549-4564.
- [Google Scholar]
- Activated carbon/bentonite/Fe3O4 as a novel nanobiocomposite for high removal of Cr (VI) ions. Chem. Eng. Technol. 2021
- [Google Scholar]
- Scavenging malachite green dye from aqueous solution using durian peel based activated carbon. Malaysian J. Fundam. Appl. Sci.. 2021;17:95-103.
- [Google Scholar]
- Adsorption of cationic methylene blue dye using microwave-assisted activated carbon derived from acacia wood: Optimization and batch studies. Arabian J. Chem.. 2021;14:103122
- [Google Scholar]
- Effect Bed Height on Adsorption of Cu(II) by Using Corncob Based Activated Carbon. Adv. Eng. Res.. 2020;200:164-168.
- [Google Scholar]
- Scavenging Remazol Brilliant Blue R Dye Using Microwave-Assisted Activated Carbon From Acacia Sawdust: Equilibrium and Kinetics Studies. AIP Conf. Proc.. 2017;1892:1-8.
- [Google Scholar]
- Effect of impregnation ratio and activation temperature on the yield and adsorption performance of mangrove based activated carbon for methylene blue removal. Results Mater.. 2021;10:100183.
- [Google Scholar]


