

Translate this page into:
Six new tigliane diterpenoids with anti-inflammatory activity from Euphorbia kansuensis
⁎Corresponding author. lshangg@163.com (Shang-Gao Liao)
-
Received: ,
Accepted: ,
This article was originally published by Elsevier and was migrated to Scientific Scholar after the change of Publisher.
Peer review under responsibility of King Saud University.
Abstract

Abstract
Six new tigliane diterpenoids, euphkanoids A − F (1–6), along with 12 known diterpenoids (7–18) were isolated from the roots of Euphorbia kansuensis, a traditional Chinese medicinal plant. Their structures were elucidated by spectroscopic analysis, ECD calculation and chemical methods. Compounds 1–3 represent the unusual examples of tigliane diterpenoids with a conjugated olefinic aldehyde moiety. 1–18 and two hydrolyzed analogues (1c and 4a) were screened for the inhibitory effects on nitric oxide (NO) production induced by lipopolysaccharide (LPS) in RAW264.7 cells. The results showed that 1–3 and 6 markedly inhibited NO production with IC50 values in the range of 4.8–11.3 μM, which were more active than the positive control quercetin (IC50 = 12.3 μM).
Keywords
Euphorbia kansuensis
Anti-inflammatory
NO inhibitory activity
Tigliane diterpenoid

1 Introduction
In recent years, diterpenoids derived from the genus Euphorbia have attracted the attention of pharmacologists and natural products chemists because of their extensive biological properties and structural diversity (Vasas and Hohmann, 2014). Up to now, over 1000 diterpenoids covering >30 skeletal types have been discovered from Euphorbia plants (Shi et al., 2008; Vasas and Hohmann, 2014; Xu et al., 2021). Among these diterpenoids, tiglianes possessing a 5/7/6/3 tetracyclic ring system are a class of diterpenoids with potential values in natural products drug discovery. Prostratin is a natural diterpenoids of this type under clinical trials as an anti-HIV agent capable of activating latent viral reservoirs and inhibiting HIV-1 infections through kinase C (PKC)-dependent NF-κB activation (Miana et al., 2015).
Euphorbia kansuensis is a traditional Chinese medicinal plant often used for the treatments of pyretolysis, cholagogue, and apocenosis (Wang et al., 2008). Previous studies showed the presence of lathyrane diterpenoids and ursane triterpenoids in this plant (Wang et al., 2008; Zhang et al., 2013; Zhang et al., 2012), and our early chemical investigation also found the occurrence of ingenane and lathyrane diterpenoids (Yan et al., 2019; Yan et al., 2020). Among them, two lathyrane diterpenoids exhibited marked NO inhibitory activity (Yan et al., 2021). In our continuing efforts toward novel NO inhibitor from this plants, six new tigliane diterpenoids and 12 known diterpenoids were isolated from the EtOAc fraction of E. kansuensis. All the compounds were tested for NO production inhibitory effects in LPS-induced RAW264.7 cells, and compounds 1–3 and 6 showed marked activity with IC50 values in the range of 4.8–11.3 μM. Herein, we reported the isolation, structural identification, and NO inhibitory activity of these diterpenoids.
2 Material and methods
2.1 General information
Optical rotations were measured on a Rudolph Autopol I automatic polarimeter. UV spectra were tested on a Shimadzu UV-2450 spectrophotometer, and IR spectra were recorded on Bruker Tensor 37 infrared spectrophotometers. ECD spectra were measured on an Applied Photophysics Chirascan spectrometer. NMR data were measured on Bruker AM-400/500 spectrometers at 25 °C. GC–MS was measured on a ThermoFinnigan TRACE DSQ spectrometer. ESIMS was measured on a Finnigan LCQ Decainstrument, and HRESIMS was performed on a Waters Micromass Q-TOF spectrometer. Column chromatography (CC) was performed on silica gel (100–200 and 300–400 mesh, Qingdao Haiyang Chemical Co., Ltd.), reversed-phase C18 (RP-C18) (12 nm, S-50 μm, YMC Co., Ltd.), Sephadex LH-20 gel (Amersham Biosciences), and MCI gel (CHP20P, 75–150 μm, Mitsubishi Chemical Industries Ltd.). A Shimadzu LC-20 AT equipped with a SPD-M20A PDA detector was used for HPLC. An YMC-pack ODS-A column (250 × 10 mm, S-5 μm, 12 nm) was used for semi-preparative HPLC separation. A chiral column (Phenomenex Lux, cellulose-2, 250 × 10 mm, 5 μm) was used for chiral separation. All solvents used were of analytical grade (Guangzhou Chemical Reagents Company, Ltd.).
2.2 Plant material
The roots of Euphorbia kansuensis Prokh. were collected in September 2020 from Yuncheng city, Shanxi Province, P. R. China and identified by one of the authors, Qing-De Long. A voucher specimen (accession number: GSDJ202009) was deposited at the School of Pharmacy, Guizhou Medical University.
2.3 Extraction and isolation
The air-dried powder of the roots of E. Kansuensis (6 kg) was extracted with 95% EtOH at room temperature to give a crude extract (480 g), which was suspended in H2O and partitioned with EtOAc. The EtOAc part was subjected to silica gel CC eluted with a CH2Cl2/MeOH gradient (100:0 → 10:1) to afford four subfractions (I − IV). Fr. II (5 g) was subjected to RP-C18 silica gel CC eluted with MeOH/H2O (50:50 → 100:0) to give three fractions (IIa − IIc). Fr. IIc was subjected to silica gel CC (PE/EtOAc, 3:1 → 1:1) to give two fractions (IIc1 − IIc2). Fr. IIc2 was purified by HPLC (3 mL/min, MeCN/H2O, 90:10) to give compounds 4 (60 mg, tR = 14.3 min), 5 (50 mg, tR = 15.1 min), and 11 (20 mg, tR = 20 min). Fr. III (12 g) was subjected to RP-C18 silica gel CC eluted with MeOH/H2O (50:50 → 100:0) to give three fractions (IIIa − IIIc). Fr. IIIb was separated by RP-C18 silica gel CC (MeOH/H2O, 70:30 → 100:0) to afford four subfractions (IIIb1 − IIIb4). Fr. IIIb2 was separated by silica gel CC (PE/EtOAc, 3:1 → 1:1) to give three fractions (IIIb2a − IIIb2c). Fr. IIIb2a was purified by silica gel CC (CH2Cl2/MeOH, 100:1) to afford 15 (40 mg) and 16 (60 mg). Fr. IIIb2b was purified by HPLC (3 mL/min, MeCN/H2O, 60:40) to give 17 (7 mg, tR = 8 min), 18 (13 mg, tR = 12.6 min), and 14 (13 mg, tR = 13.4 min). Fr. IIIb3 was separated by RP-C18 gel CC (MeOH/H2O, 70:30 → 100:0) to give two fractions (IIIb3a and IIIb3b). Fr. IIIb3a was purified by HPLC (3 mL/min, MeCN/H2O, 55:45) to afford 1 (20 mg, tR = 10 min), 2 (4 mg, tR = 14 min), and 3 (3 mg, tR = 17 min). Fr. IIIc was separated by silica gel CC to give three subfractions (IIIc1 − IIIc3). Fr. IIIc1 was purified by preparative TLC (CH2Cl2/MeOH, 30:1) to obtain 6 (11 mg). Fr. IIIc2 was purified by HPLC (3 mL/min, MeCN/H2O, 60%) to obtain 12 (5 mg, tR = 10.1 min) and 13 (4 mg, tR = 11.2 min). Fr. IIIc3 was separated by silica gel CC (CH2Cl2/MeOH, 30:1), followed by HPLC (3 mL/min, MeCN/H2O, 45%) to give 8 (7 mg, tR = 9 min) and 7 (5 mg, tR = 11 min). Fr. IV was separated by silica gel CC (CH2Cl2/MeOH) to give two fractions (IVa − IVb). Fr. IVb was purified by sephadex LH-20, followed by HPLC (3 mL/min, MeCN/H2O, 45%) to afford 9 (23 mg, tR = 11.3 min) and 10 (13 mg, tR = 15 min).
2.3.1 Euphkanoid A (1)
Colorless oil; [α]25D + 7.4 (c 0.270, MeOH); UV (MeOH) λmax (log ε) 308 (4.53) nm; ECD (c 2.6 × 10⁻⁴ mol/L, MeCN) λmax (Δε) 205 (−12.33), 229 (+5.72), 300 (−1.13) nm; IR (KBr) νmax 3397, 2925, 1705, 1678, 1625, 1376, 1333, 1256, 1104, 1013, 996, and 734 cm−1; 1H and 13C NMR data see Tables 1 and 2, respectively; HRESIMS m/z 585.2344 [M + HCOO]− (calcd for C31H37O11−, 585.2341) and 539.2263 [M − H]− (calcd for C30H35O9−, 539.2287).
No.
1a
2a
3a
No.
4a
5a
6b
1
7.59, s
7.59, s
7.59, s
1
7.59, s
7.60, s
7.58, s
5
α 2.49, d (19.2)
α 2.49, d (19.3)
α 2.48, d (19.1)
5
α 2.37, d (19.2)
α 2.37, d (19.0)
α 2.40, d (19.5)
β 2.57, d (19.2)
β 2.57, d (19.3)
β 2.54, d (19.1)
β 2.51, d (19.2)
β 2.50, d (19.0)
β 2.53, d (19.5)
7
5.69, d (5.4)
5.69, d (4.5)
5.69, d (5.0)
7
5.69. d (5.3)
5.70. d (5.3)
5.61, d (5.9)
8
3.27, dd (5.4, 5.1)
3.27, dd (5.1, 4.5)
3.26, dd (5.1, 5.0)
8
2.99, dd (5.3, 5.3)
2.99, dd (5.3, 5.3)
2.99, dd (5.9, 5.9)
10
3.26, br s
3.26, br s
3.25, br s
10
3.26, br s
3.27, br s
3.12, dd (2.5, 2.5)
11
2.21, m
2.20, m
2.19, m
11
1.96, m
1.97, m
2.01, m
12
5.49, d (10.3)
5.48, d (10.3)
5.47, d (10.3)
12
a 1.57, m
a 1.58, m
a 1.66, m
b 2.06, m
b 2.07, m
b 2.01, m
14
1.12, d (5.1)
1.11, d (5.1)
1.11, d (5.1)
14
0.82, d (5.3)
0.82, d (5.3)
0.92, d (5.9)
16
1.22, s
1.21, s
1.21, s
16
1.18. s
1.19. s
a 4.10, d (11.1)
b 4.24, d (11.1)
17
1.27, s
1.27, s
1.27, s
17
1.05, s
1.06, s
1.06, s
18
0.90, d (6.4)
0.90, d (6.3)
0.90, d (6.3)
18
0.87, d (6.3)
0.88, d (6.3)
0.98, d (6.4)
19
1.77, br s
1.77, br s
1.77, br s
19
1.76, br s
1.78, br s
1.76, br s
20
a 3.99, d (12.9)
a 3.99, d (13.0)
a 3.99, d (12.7)
20
a 4.42, d (12.4)
a 4.42, d (12.2)
3.97, d (13.5)
b 4.05, d (12.9)
b 4.05, d (13.0)
b 4.05, d (12.7)
b 4.47, d (12.4)
b 4.48, d (12.2)
3.93, d (13.5)
OAc
2.11, s
2.11, s
2.11, s
OAc
2.05, s
2.06, s
2.06, s
2′
6.10, d (15.4)
6.00, d (15.2)
5.95, d (15.2)
2′
2.28, t (7.6)
2.28, t (7.6)
3′
7.33, dd (15.4, 10.3)
7.31, dd (15.2, 11.1)
7.31, dd (15.2, 11.3)
3′
1.60, m
1.60, m
4′
6.74–6.76, overlap
6.55, dd (14.5, 11.1)
6.46, dd (14.5, 11.3)
4′−7′
1.29–1.31, m
1.29–1.31, m
5′
6.74–6.76, overlap
6.60–6.65, overlap
6.63, dd (14.5, 10.0)
8′
2.03, m
2.07, m
6′
7.15, dd (15.4, 10.3)
6.73, dd (14.5, 10.4)
6.54, dd (14.3, 10.0)
9′/13′
5.35, m
5.36, m
7′
6.29, dd (15.4, 7.8)
6.62–6.67, overlap
6.52, m
10′/12′
5.32, m
5.36, m
8′
9.63, d, (7.8)
7.15, dd (15.2, 10.9)
6.73, dd (14.5, 10.0)
11′
2.76, t (6.4)
2.81, m
9′
6.23, dd (15.2, 7.8)
6.55, dd (14.5, 11.2)
14′
2.03, m
2.81, m
10′
9.60, d (7.8)
7.15, dd (15.2, 11.2)
15′/16′
1.29–1.31, m
5.36, m
11′
6.20, dd (15.2, 7.9)
17′
1.29, m
2.07, m
12′
9.59, d (7.9)
18′
0.88, t (7.5)
0.97, t (7.5)
No.
1a
2a
3a
No.
4b
5b
6b
1
160.6
160.7
160.7
1
161.3
161.3
160.5
2
132.9
132.9
132.9
2
132.8
132.8
135.4
3
208.9
208.9
208.9
3
209.0
209.0
210.6
4
73.7
73.7
73.7
4
73.6
73.6
74.9
5
38.6
38.6
38.6
5
38.9
39.0
38.6
6
140.5
140.5
140.4
6
135.0
135.0
141.6
7
129.0
129.1
129.1
7
133.6
133.7
130.5
8
39.1
39.0
39.0
8
39.4
39.4
39.5
9
78.2
78.2
78.2
9
75.8
75.9
78.1
10
56.1
56.1
56.1
10
55.7
55.7
58.3
11
43.1
43.1
43.1
11
36.2
36.3
37.6
12
77.6
77.3
77.2
12
31.7
31.7
36.9
13
65.6
65.6
65.6
13
63.5
63.5
59.6
14
36.4
36.3
36.3
14
32.2
32.3
32.6
15
25.8
25.8
25.8
15
22.7
22.7
28.3
16
23.8
23.8
23.8
16
23.2
23.2
71.7
17
16.8
16.8
16.8
17
15.3
15.3
12.1
18
14.4
14.4
14.4
18
18.5
18.5
19.3
19
10.1
10.1
10.1
19
10.1
10.1
10.3
20
68.0
68.0
68.0
20
69.4
69.5
68.5
OAc
173.8
173.8
173.8
OAc
173.1
173.2
21.1
21.1
21.1
21.2
21.2
1′
166.1
166.4
166.6
1′
173.5
173.5
173.5
2′
125.6
123.3
122.1
2′
34.2
34.2
20.9
3′
142.6
143.6
144.1
3′
24.9
24.9
4′
138.4
134.8
132.8
4′−7′
29.1–29.6
29.1–29.6
5′
136.9
138.8
139.8
8′
27.2
27.2
6′
149.2
140.6
136.9
9′
130.2
130.3
7′
134.2
133.6
135.4
10′
128.0
128.2
8′
193.1
150.3
141.5
11′
25.6
25.5
9′
132.8
132.0
12′
127.9
127.7
10′
193.3
150.9
13′
130.0
128.2
11′
132.0
14′
27.2
25.6
12′
193.4
15′
29.1–29.6
127.1
16′
29.1–29.6
131.9
17′
22.5
20.5
18′
14.0
14.3
2.3.2 Euphkanoid B (2)
Yellow oil; [α]25D + 4.0 (c 0.194, MeOH); UV (MeOH) λmax (log ε) 341 (4.77) nm; ECD (c 2.0 × 10⁻⁴ mol/L, MeCN) λmax (Δε) 204 (−10.83), 230 (+7.65), 267 (−0.86), 340 (−0.99) nm; IR (KBr) νmax 3397, 2924, 1704, 1675, 1623, 1376, 1259, 1238, 1122, 999, 734 cm−1; 1H and 13C NMR data see Tables 1 and 2, respectively; HRESIMS m/z 611.2499 [M + HCOO]− (calcd for C33H39O11−, 611.2498) and 589.2412 [M + Na]+ (calcd for C32H38O9Na+, 589.2408).
2.3.3 Euphkanoid C (3)
Yellow oil; [α]25D + 6.6 (c 0.148, MeOH); UV (MeOH) λmax (log ε) 370 (4.55) nm; ECD (c 1.9 × 10⁻⁴ mol/L, MeCN) λmax (Δε) 203 (−6.92), 229 (+3.34), 267 (−0.90) nm; IR (KBr) νmax 3397, 2924, 1705, 1673, 1611, 1376, 1256, 1123, 1002, and 735 cm−1; 1H NMR and 13C NMR see Tables 1 and 2, respectively; HRESIMS m/z 637.2649 [M + HCOO]− (calcd for C35 H41O11−, 637.2654).
2.3.4 Euphkanoid D (4)
Colorless oil; [α]25D + 118.4 (c 0.375, CHCl3); UV (MeOH) λmax (log ε) 234 (4.56) nm; IR (KBr) νmax 3306, 2924, 2853, 1702, 1459, and 1013 cm−1; 1H NMR and 13C NMR see Tables 1 and 2, respectively; HRESIMS m/z 675.4258 [M + Na]+ (calcd for C40H60O7Na+, 675.4231).
2.3.5 Euphkanoid E (5)
Colorless oil; [α]25D + 33.2 (c 0.25, CHCl3); UV (MeOH) λmax (log ε) 232 (4.08) nm; IR (KBr) νmax 3412, 2926, 1713, and 1246 cm−1; 1H NMR and 13C NMR see Tables 1 and 2, respectively; HRESIMS m/z 673.4068 [M + Na]+ (calcd for C40H58O7Na+, 673.4075).
2.3.6 Euphkanoid F (6)
White powder; [α]25D + 11.8 (c 0.138, MeOH); UV (MeOH) λmax (log ε) 225 (3.69) nm; ECD (c 2.5 × 10⁻⁵ mol/L, MeCN) λmax (Δε) 227 (+6.67) and 207 (−9.50) nm; IR (KBr) νmax 3373, 2925, 1705, 1377, and 1263 cm−1; 1H NMR and 13C NMR see Tables 1 and 2, respectively; HRESIMS m/z 405.1921 [M − H]− (calcd for C22H29O7−, 405.1919).
2.4 ECD calculations.
The absolute configuration of 1 was studied by comparison of its experimental and simulated electronic circular dichroism (ECD) spectra using the quantum chemical time-dependent density functional theory (TDDFT) method. Details of ECD calculations were provided in the Supplementary Material.
2.5 Preparation of 1c by alkaline hydrolysis of 1 and HPLC analysis
5 mg K2CO3 was added to a solution of 1 (10 mg) in MeOH (2 mL), and the mixture was stirred at room temperature for 5 h. Then, the mixture was diluted with 20 mL H2O and was extracted with EtOAc (3 × 20 mL). The organic layer was dried and evaporated to give a residue, which was purified by preparative TLC to afford 1c (4 mg, CH2Cl2/MeOH, 5:1). 1c was identified as phorbol by the ESIMS and 1D NMR data, followed by co-HPLC analysis with an authentic phorbol sample (tR = 12.3 min).
Phorbol (1c). 1H NMR (CD3OD, 400 MHz) δH 7.62 (1H, s, H-1), 2.53 (1H, d, J = 19.0 Hz, H-5a), 2.43 (1H, d, J = 19.0 Hz, H-5b), 5.60 (1H, d, J = 5.4 Hz, H-7), 3.09 (1H, s, H-8), 3.16 (1H, m, H-10), 1.94 (1H, m, H-11), 4.05 (1H, d, J = 10.1 Hz, H-12), 0.74 (1H, d, J = 5.4 Hz, H-14), 1.26 (3H, s, H3-16), 1.14 (3H, s, H3-17), 1.07 (3H, d, J = 6.4 Hz, H3-18), 1.75 (3H, br s, H3-19), 3.96 (1H, d, J = 13.0 Hz, H-20a), 3.92 (1H, d, J = 13.0 Hz, H-20b); 13C NMR (CD3OD, 100 MHz) δC 161.3 (C-1), 134.3 (C-2), 210.8 (C-3), 79.8 (C-4), 38.6 (C-5), 141.9 (C-6), 131.2 (C-7), 40.3 (C-8), 74.9 (C-9), 58.8 (C-10), 46.2 (C-11), 82.1 (C-12), 63.2 (C-13), 37.5 (C-14), 27.1 (C-15), 24.1 (C-16), 17.8 (C-17), 15.5 (C-18), 10.2 (C-19), 68.3 (C-20). ESIMS m/z 399.1 [M + Cl]−. These data were consistent with those of phorbol reported (Neeman et al., 1979).
2.6 Preparation of 4a, methyl linoleate and methyl linolenate.
Compound 4 (40 mg) was treated with NaOH (2% in MeOH, 3 mL) at rt for 2 h. The mixture was diluted with 30 mL H2O and then extracted with EtOAc (3 × 20 mL). The organic layer was dried to give a residue, which was purified by preparative TLC to afford 12-deoxyphorbol (4a) (12 mg, CH2Cl2/MeOH, 10:1) and methyl linoleate (10 mg, CH2Cl2/MeOH, 100:1). Using the same method, hydrolysis of 5 afforded methyl linolenate (11 mg) and 4a.
12-Deoxyphorbol (4a). 1H NMR (CD3OD, 500 MHz) δH 7.57 (1H, br s, H-1), 2.40 (1H, d, J = 19.0 Hz, H-5a), 2.53 (1H, d, J = 19.0 Hz, H-5b), 5.61 (1H, d, J = 5.2 Hz, H-7), 2.94 (1H, t, J = 5.2 Hz, H-8), 2.02 (1H, m, H-11), 1.60 (1H, dd, J = 14.5, 9.1 Hz, H-12a), 1.94 (1H, m, H-12b), 0.62 (1H, d, J = 5.2 Hz, H-14), 0.99 (3H, s, H3-16), 1.21 (3H, s, H3-17), 0.97 (3H, d, J = 6.8 Hz, H3-18), 3.93 (1H, d, J = 13.0 Hz, H-20a), 3.96 (1H, d, J = 13.0 Hz, H-20b); 13C NMR (CD3OD, 125 MHz) δC 160.7 (C-1), 135.5 (C-2), 210.8 (C-3), 75.0 (C-4), 38.6 (C-5), 141.2 (C-6), 131.2 (C-7), 40.1 (C-8), 78.2 (C-9), 58.2 (C-10), 37.6 (C-11), 36.7 (C-12), 59.5 (C-13), 34.0 (C-14), 24.7 (C-15), 16.5 (C-16), 23.0 (C-17), 19.4 (C-18), 10.3 (C-19), 68.5 (C-20). These data were consistent with those of 12-deoxyphorbol reported (Sosath et al., 1988).
Methyl linoleate. 1H NMR (CDCl3, 500 MHz) δH 5.30–5.41 (4H, m), 3.66 (3H, s, OCH3), 2.77 (2H, t, J = 6.6 Hz), 2.30 (2H, t, J = 7.6 Hz), 2.05 (4H, q, J = 6.9 Hz), 1.60–1.63 (5H, m), 1.25–1.37 (14H, m), 0.89 (3H, t, J = 6.8 Hz); 13C NMR (CDCl3, 125 MHz) δC 14.1, 22.6, 24.9, 25.6, 27.2, 27.2, 29.1, 29.1, 29.1, 29.3, 29.6, 31.5, 34.1, 51.4, 127.9, 128.0, 130.0, 130.2, 174.3. GC–MS m/z 294.1 [M]+. These data were consistent with those of methyl linoleate reported (Huh et al., 2010).
Methyl linolenate. 1H NMR (CDCl3, 400 MHz) δH 5.32–5.41 (6H, m), 3.66 (3H, s, OCH3), 2.81 (2H, t, J = 6.0 Hz), 2.30 (2H, t, J = 7.6 Hz), 2.06 (4H, m), 1.57–1.64 (2H, m), 1.25–1.37 (14H, m), 0.97 (3H, t, J = 7.5 Hz); 13C NMR (CDCl3, 100 MHz) δC 14.3, 20.5, 24.9, 25.5, 25.6, 27.2, 29.1, 29.1, 29.6, 29.7, 34.1, 51.4, 127.1, 127.7, 128.2, 128.3, 130.3, 132.0, 174.3. GC–MS m/z 292.1 [M]+. These data were consistent with those of methyl linolenate reported (Chang et al., 2000).
2.7 Cell culture
The RAW264.7 mouse macrophage cell line was purchased from the Cell Bank of Shanghai Institute of Biochemistry and Cell Biology, Chinese Academy of Sciences (Shanghai, China), and was cultured in Dulbecco’s modified Eagle medium (DMEM, Gibco Invitrogen Corp., Carlsbad, CA, USA) that was supplemented with 10% FBS, 100 units/mL penicillin and 100 μg/mL streptomycin. The cells were placed at 37 °C in a humidified incubator containing 5% CO2.
2.8 MTT assay
MTT assay was used to investigate the cytotoxicity of compounds 1–6 toward RAW264.7 cells. Briefly, RAW264.7 cells were planted in 96-well plates (5 × 10³/well) for 24 h. Then they were treated with test samples that dissolved in DMSO and diluted in 100 μL DMEM, making the final drug concentration 50 or 20 μM. 24 h later, 20 μL solution MTT was added in each well. After incubation for 4 h, the medium was removed and 100 μL DMSO was added in each well, then the absorbance (A) was detected at 490 nm using a microplate reader. The inhibition of cell growth was calculated according to the formula: % Inhibition = [1− (Asample − Ablank) / (Asolvent − Ablank)] × 100.
2.9 Inhibitory activity toward NO production
NO release was assessed by a colorimetric assay based on a diazotization reaction using the Griess reagent system. RAW264.7 cells were planted in 96-well plates (5 × 10³/well) for 24 h and then pre-incubated with different concentrations of compounds for 1 h before stimulation with or without LPS (1 μg/mL) for 24 h. The NO concentration in culture medium was determined by Griess reagent kit, then the absorbance (A) was measured at 540 nm using a microplate reader. The inhibition of NO release was calculated according to the following formula: % Inhibition = [1 − (Asample − Ablank) / (Amodel − Ablank)] × 100. The experiments were performed in triplicates, and the data were presented as the mean ± SD. Quercetin was used as a positive control.
3 Results and discussion
The roots of E. kansuensis were extracted with 95% EtOH to give a crude extract, which was suspended in H2O and partitioned with EtOAc. The EtOAc extract was separated by various column chromatographic methods to afford compounds 1–18 as shown in Fig. 1.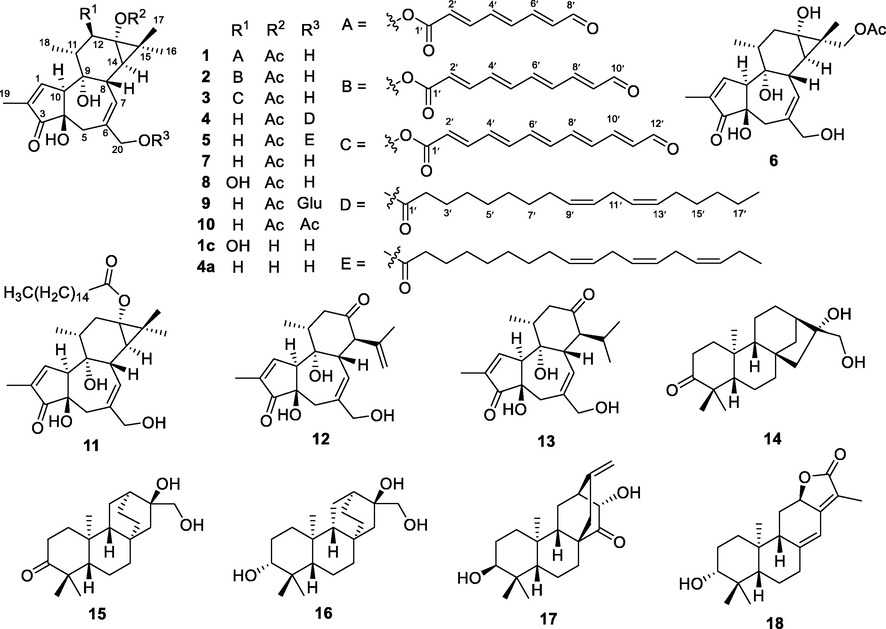
Structures of compounds 1–18 and two hydrolyzed analogues 1c and 4a.
Compound 1 was obtained as a yellow oil. Its molecular formula C30H36O9 was determined by the HRESMS at m/z 585.2344 [M + HCOO]− (calcd for C31H37O11−, 585.2341) and 539.2263 [M − H]− (calcd for C30H35O9−, 539.2287). Its IR spectrum showed the presence of hydroxyl (3397 cm−1) and carbonyl (1705 cm−1) groups. The 1H NMR data of 1 showed signals for five methyls [δH 0.90 (3H, d, J = 6.4 Hz), 1.22 (3H, s), 1.27 (3H, s), 1.77 (3H, br s), and 2.11 (3H, s)], an oxygenated methene [δH 3.99 (1H, d, J = 12.9 Hz) and 4.05 (1H, d, J = 12.9 Hz)], an oxygenated methine [δH 5.49 (1H, d, J = 10.3 Hz)], an aldehyde group [δH 9.63 (1H, d, J = 7.8 Hz)], and six olefinic protons (δH 5.69–7.59). The 13C NMR data and DEPT experiments resolved 30 carbon resonances attributable to a ketone carbonyl (δC 208.9), an 8-oxo-2,4,6-octatrienoyl (δC 125.6, 134.2, 136.9, 138.4, 142.6, 149.2, 166.1, and 193.1), an ester carbonyl (δC 173.8), two trisubstituted double bonds, five methyls, two sp3 methenes (one oxygenated at δC 68.0), five sp3 methines (one oxygenated at δC 77.6), three oxygenated sp3 tertiary carbons, and a characteristic quaternary carbon (δC 25.8). The abovementioned NMR data showed high similarity to those of a known tigliane phorbol ester, 12-O-(2′E,4′E)-6-oxohexa-2′,4′-dienoylphorbol-13-acetate (Wagh et al., 2017), except for the replacement of the 6-oxo-2,4-hexadienoyl side chain in the known compound by an 8-oxo-2,4,6-octatrienoyl side chain in 1. This long chain fatty acid moiety, C-1′−C-8′, was tied to C-12 of the phorbol backbone in 1 by HMBC correlation from H-12 to the ester carbony carbon (δC 166.1, C-1′) (Fig. 2). Further 2D NMR data interpretation confirmed the planar structure of 1.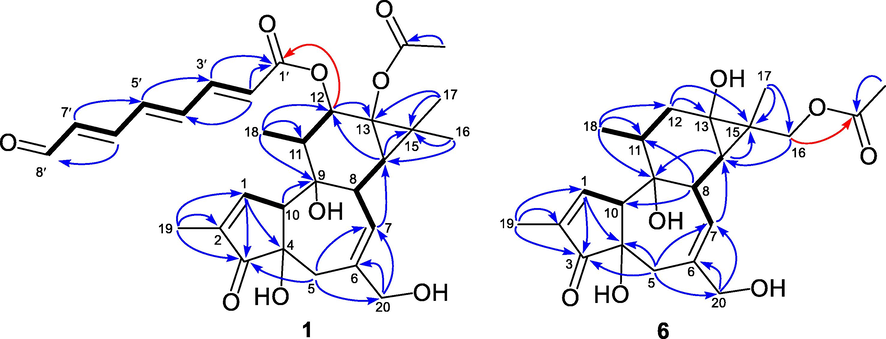
Key 1H−1H COSY (-) and HMBC (arrows) correlations of 1 and 6.
The relative configuration of 1 was assigned to be the same as that of 12-O-(2′E,4′E)-6-oxohexa-2′,4′-dienoylphorbol-13-acetate based on their similar 1D NMR and NOESY data. As shown in Fig. 3, the strong NOESY correlation of H3-17/H-11, H3-17/H-8, and H-8/H-11 suggested that H-8, H-11, and CH3-17 were on the same side and were arbitrarily designated as β-orientation, while the NOE correlations of H3-18/H-12 and H3-16/H-14 indicated that H-12, and H-14 were α-oriented. In particular, the E-geometry for Δ2′ and Δ6′ were determined by the coupling constants of H-2′/H-3′ (J = 15.4 Hz) and H-6′/H-7′ (J = 15.4 Hz), respectively. These assignments were supported by the NOE correlations of H-2′/H-4′ and H-6′/H-8′, respectively. The E-geometry for Δ4′ was established by the strong NOE correlations of H-4′/H-6′ and H-5′/H-3′. As the chemical shifts of C-4 (δC 73.7), C-9 (δC 78.2), and C-10 (δC 56.1, δH 3.26) in 1 were very similar to those of the known compound (C-4: δC 73.7; C-9: δC 78.2; C-10: δC 56.2, δH 3.27), the orientations of 4-OH, 9-OH, and 10-OH in 1 were determined to be the same as those in the known compound.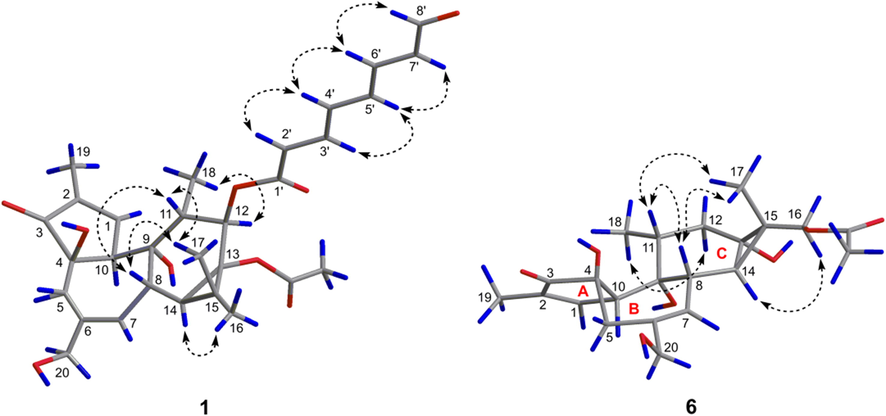
Key NOE correlations (↔) of 1 and 6.
ECD calculation was used to identify the absolute configuration of 1. As shown in Fig. 4, the experimental ECD curve of 1 showed three cotton effects around 205 (−), 229 (+), and 300 (−) nm, respectively, which matched well with those calculated for 1a, an isomer with a 4R,8S,9S,10S,11R,12R,13S,14R configuration, suggesting that 1 had the same absolute configuration as that of 1a. Moreover, the structure of 1 was further confirmed by chemical method. Briefly, alkaline hydrolysis of 1 generate a product 1c, which was identified as phorbol by its 1D NMR and ESIMS data (Neeman et al., 1979) (Fig. S53–55), followed by co-injection of 1c with an authentic phorbol sample on HPLC equipped with a chiral column (Fig. S3). Compound 1 was given the trivial name euphkanoid A.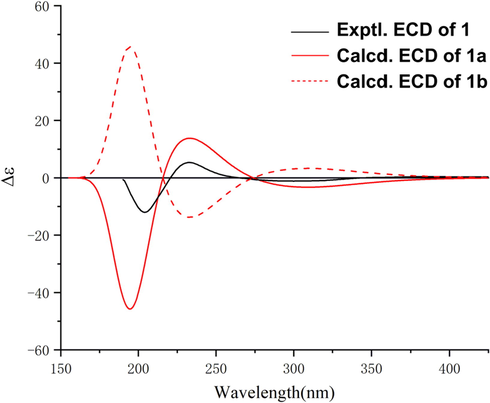
The experimental and calculated ECD curves of 1.
Compound 2 had the molecular formula C32H38O9 determined by its HRESIMS and 13C NMR data. The 1D NMR data of 2 were similar to those of 1, with the major difference being the presence of additional signals attributable to one double bond in 2, suggesting that 2 had a 10-oxo-2,4,6,8-decatetraenoyl moiety at C-12 instead of an 8-oxo-2,4,6-octatrienoyl moiety. This was supported by detailed analysis of the HMBC and 1H−1H COSY correlations of 2 (Fig. S1). The relative configuration of 2 on the chiral centers was determined to be the same as that of 1 by comparing its 1D NMR and NOESY data with those of 1. In particular, the E-geometry for Δ2′, Δ4′, Δ6′ and Δ8′ were determined by the large coupling constants of H-2′/H-3′ (J = 15.2 Hz), H-4′/H-5′ (J = 14.5 Hz), H-6′/H-7′ (J = 14.5 Hz), and H-8′/H-9′ (J = 15.2 Hz), respectively. These assignments were further supported by the corresponding NOE correlations of H-2′/H-4′, H-3′/H-5′, H-6′/H-8′, and H-7′/H-9′ (Fig. S2). As the experimental ECD curve of 2 showed similar tendency to that of 1 (Fig. S4), the absolute configuration of 2 was assigned to be the same as that of 1, and compound 2 was given the trivial name euphkanoid B.
Euphkanoid C (3) had the molecular formula of C34H40O9 as determined by its HRESIMS data, C2H2 more than that of 2. The 1D NMR data of 3 bored a high resemblance to those of 2 except for the presence of additional signals attributable to a double bond, suggesting that 3 possessed a 12-oxo-2,4,6,8,10-dodecapentaenoyl moiety at C-12 instead of a 10-oxo-2,4,6,8-decatetraenoyl moiety in 2. Further analysis of its 2D NMR data secured the planar structure of 3 (Fig. S1). The relative configuration of 3 in the chiral carbons was assigned to be the same as that of 2 by comparison of their similar 1D NMR and NOESY data. In particular, the E-geometry for Δ2′, Δ4′, Δ6′, Δ8′, and Δ10′ were determined by the large coupling constants of H-2′/H-3′ (J = 15.2 Hz), H-4′/H-5′ (J = 14.5 Hz), H-6′/H-7′ (J = 14.3 Hz), H-8′/H-9′ (J = 14.5 Hz), and H-10′/H-11′ (J = 15.2 Hz), respectively. The stereochemistry of 3 was assigned to be the same as that of 2 based on their similar ECD spectra, both of them showed two apparent Cotton effects around 204 (−) and 230 (+) nm (Fig. S4 in Supplementary Material).
Compound 4 was isolated as a colorless oil. The pseudomolecular ions in HRESIMS at m/z 675.4258 [M + Na]+ (calcd. for C40H60O7Na+, 675.4231) allowed the molecular formula C40H60O7 to be assigned to 4. The 1H and 13C NMR data were very similar to those of a co-isolated compound, prostratin (7) (Gustafson et al., 1992), except for the presence of additional signals attributable to a linoleoyl group (Huh et al., 2010), suggesting that 4 was a O-linoleoyl derivative of 7. The linoleoyl group was further located at C-20 by the HMBC correlations from Ha-20 and Hb-20 to the additional ester carbonyl carbon (δC 173.5, C-1′, Fig. S1). This was also supported by the severely downfield-shifted H2-20 signals in 4 with respect to those of 7 (δH 3.79 and 3.86 in 7, δH 4.42 and 4.47 in 4). The relative configuration on the phorbol backbone in 4 was assigned to be the same as that of 7 based on their similar 1D NMR data, while the structure of the linoleoyl group remained to be determined. Thus, alkaline hydrolysis of 4 in NaOMe was carried out to generate a mixture of 12-deoxyphorbol (4a) and methyl linoleate. The 12-deoxyphorbol isolated from the mixture was identified by comparing the experimental 1H and 13C NMR data with those reported in the literature (Sosath, et al., 1988), and was further confirmed by 2D NMR data analysis, while the structure of the isolated methyl linoleate was confirmed by GC–MS (tR = 6.87 min, m/z 294.1 [M]+) and 1D NMR data (Marwah et al., 2007) (Fig. S63 − 65). Thus, the structure of 4 was established and was given a trivial name euphkanoid D.
Compound 5 had a molecular formula C40H58O7, as determined by its HRESIMS and 13C NMR data. The 1D NMR data of 5 were very similar to those of 4 except for the presence of additional signals attributable to a cis double bond and absence of signals for two methenes, suggesting that 5 had a linolenoyl group at C-20 instead of linoleoyl group. The linolenoyl moiety was further identified by comparison of the 1D NMR data of 5 with those of a methyl linolenate reported in the literature (Chang et al., 2000). HMBC correlations from Ha-20 and Hb-20 to the ester carbonyl carbon (δC 173.5, C-1′) located the linolenoyl group at C-20 (Fig. S1). The structure of 5 was further confirmed by using the same method as described for 4, which afforded the same hydrolysis product 4a and a methyl linolenate. The structure of methyl linolenate was confirmed by comparing the observed GC–MS (tR = 8.44 min, m/z 292.1 [M]+) and 1D NMR data with those reported in the literature (Chang et al., 2000) (Fig. S66 − 68). Compound 5 was given a trivial name euphkanoid E.
Compound 6 was obtained as a white powder. Its molecular formula was determined to be C22H30O7 by the HRESIMS peak at m/z 405.1921 [M − H]− (calcd for C22H29O7−, 405.1919). The 1D NMR data of compound 6 resembled closely to those of a known tigliane diterpenoid, prostratin (7) (Gustafson et al., 1992), with the major difference being in the chemical shift values for protons and carbons around C-13 and C-16, suggesting that the acetoxyl was located at C-16 in 6 instead of C-13 in 7. This was confirmed by the HMBC correlations from two additional oxymethene protons (δH 4.10 and 4.24, H2-16) to the ester carbonyl carbon (δC 173.5) (Fig. 2). The relative configuration of 6 was determined by analysis of its NOESY data. Firstly, the configuration of the chiral centers on A/B/C rings of 6 was readily assigned to be the same as that of 7 by comparing their 1D NMR data. In particular, the NOE correlations from Ha-16/Hb-16 to H-14 indicated that C-15 − C-16 was α-oriented (Fig. 3). As the absolute configuration of 7 has been confirmed by total synthesis and X-ray single crystal diffraction (Hirose et al., 2021). The absolute configuration of 6 on A/B/C rings could be determined to be the same as that of 7 based on their similar ECD curves, both of them showed two cotton effects around 227 (+) and 207 (−) nm, respectively (Fig. S69). Thus, the remaining C-15 could be assigned as S-configuration according to the strong NOE correlations from Ha-16/Hb-16 to H-14. Compound 6 was given the trivial name euphkanoid F.
The known compounds prostratin (7) (Gustafson et al., 1992), phorbol-13-acetate (8) (Yang et al., 2014), fischeroside A (9) (Pan et al., 2011), 12-deoxyphorbol-13,20-diacetate (10) (Wang et al., 2010), phorbol (1c) (Neema and Simmo, 1979), 12-deoxyphorbol (4a) (Sosath et al., 1988), 12-deoxyphorbol-13-hexadecanoate (11) (Ma et al., 1997), langduin A (12) (Ma et al., 1997), neostellerin (13) (Feng and Pei, 2001), abbeokutone (14) (Yang and Yue, 2008), atisane-3-oxo-16α,17-diol (15) (Ding et al., 1990), ent-atisane-3β,16α,17-triol (16) (Jia and Ding, 1991), ent-(3β,13S)-dihydroxyatis-16-en-14-one (17) (Wang et al., 2014), and helioscopinolide A (18) (Borghi et al., 1991) were identified by comparison of their NMR data with those reported.
All the isolates (1–18) and two hydrolysis products (1c and 4a) were screened for their inhibitory effects on NO production in LPS-induced RAW 264.7 macrophages. The results showed that compounds 4, 5, 1c, 4a, and 7–18 showed weak activity (IC50 > 20 μM), while 1–3 and 6 showed marked inhibitory activity with IC50 values in the range of 4.8–11.3 μM, better than or comparable to the positive control quercetin (IC50 = 12.3 μM) (Table 3). Further cytotoxicity evaluations showed that 1–6 did not show any significant cytotoxicity against RAW 264.7 cells at concentrations up to 50 μM (Table S1), which confirmed that their NO production inhibitory effects were not related to the cytotoxicity but to their anti-inflammatory effects. Based on the biological data, the brief structure–activity relationships for these structurally diverse diterpenoids were discused. Generally, tiglianes with 5/7/6/3 carbon ring system showed greater activity than that of diterpenoids with 6/6/6 ring system (1–6 vs 14–18). In tigliane series, the conjugated olefinic aldehyde moiety were beneficial to the activity, as indicated by the increased activity of 1–3 vs 7 and 8. Besides, the presence of the bulky groups at C-20 decreased the activity as shown by 4 and 5 vs 9, 10 and 4a.
Compound
IC50 (μM)b
Compound
IC50 (μM)b
1
9.41 ± 0.82
8
44.8 ± 0.77
2
11.3 ± 1.33
10
37.9 ± 1.56
3
5.92 ± 2.22
1c
47.0 ± 2.67
4
24.5 ± 1.67
4a
35.7 ± 3.78
5
35.3 ± 0.45
11
24.3 ± 2.93
6
4.80 ± 0.77
18
23.5 ± 1.02
7
45.9 ± 0.45
Quercetinc
12.3 ± 0.85
4 Conclusions
In the study, six new tigliane diterpenoids and 12 known diterpenoids were isolated from the roots of E. kansuensis. Their structures were determined by NMR data analysis, ECD calculation, and chemical methods. Compounds 1–3 were rare examples of tigliane diterpenoids featuring a conjugated olefinic aldehyde moiety at C-12. Up to now, only one example has been found in nature. Compounds 1–3 and 6 could inhibit NO release in LPS-induced RAW264.7 cells with IC50 values in the range of 4.8–11.3 μM, better than or comparable to the positive control quercetin. To our best knowledge, tigliane diterpenoids mainly possess anti-HIV and anticancer activities, while their anti-inflammatory potential have rarely been investigated (Wang et al., 2015). Our bioactivity assay for the first time demonstrated that tigliane diterpenoids exhibited marked anti-inflammatory effect in vitro. These findings not only enriched the chemical diversity of Euphorbia diterpenoids, but also indicated that tigliane diterpenoids may also serve as potential tools for further anti-inflammation drug development.
Acknowledgments
This work was supported by Natural Science Foundation of China (22167009), China Postdoctoral Science Fund (2021 M693809), Postdoctoral Science Fund of Guizhou Medical University (YJ20073), and the funds from Guizhou Science and Technology Department (Nos. 2020-5006 and 2020-6011).
Declaration of Competing Interest
The authors declare that they have no known competing financial interests or personal relationships that could have appeared to influence the work reported in this paper.
References
- Structure elucidation of helioscopinolides D and E from Euphorbia calyptrata cell cultures. J. Nat. Prod.. 1991;54:1503-1508.
- [CrossRef] [Google Scholar]
- The low polar constituents from Bidens Pilosa L. var. minor (blume) sherff. J. Chin. Chem. Soc.. 2000;47:1131-1136.
- [CrossRef] [Google Scholar]
- Studies on the chemical constituents of Stellera chamaejasme. Chin. Pharm. J.. 2001;36:21-22.
- [Google Scholar]
- A nonpromoting phorbol from the samoan medicinal plant Homalanthus nutans inhibits cell killing by HIV-1. J. Med. Chem.. 1992;35:1978-1986.
- [CrossRef] [Google Scholar]
- Unifified total syntheses of rhamnofolane, tigliane, and daphnane diterpenoids. J. Am. Chem. Soc.. 2021;143:12387-12396.
- [CrossRef] [Google Scholar]
- Huh, S., Kim, Y.S., Jung, E., Lim, J., Jung, K.S., Kim, M.O., Lee, J., Park, D., 2010. Melanogenesis inhibitory effect of fatty acid alkyl esters isolated from Oxalis triangularis. Biol. Pharm. Bull. 33, 1242−1245. https://www.researchgate.net/publication/45097284.
- New diterpenoids from Euphorbia sieboldiana. Planta Med.. 1991;57:569-571.
- [CrossRef] [Google Scholar]
- Diterpenoids from Euphorbia fischeriana. Phytochemistry. 1997;44:663-666.
- [CrossRef] [Google Scholar]
- Musanahol: a new aureonitol-related metabolite from a Chaetomium sp. Tetrahedron. 2007;63:8174-8180.
- [CrossRef] [Google Scholar]
- Carbon-13 nuclear magnetic resonance spectroscopy of phorbol. Can. J. Chem.. 1979;57:2071-2072.
- [CrossRef] [Google Scholar]
- Tigliane-type diterpenoid glycosides from Euphorbia fischeriana. J. Nat. Prod.. 2011;74:1508-1512.
- [CrossRef] [Google Scholar]
- Chemical and pharmacological research of the plants in genus Euphorbia. Chem. Rev.. 2008;108:4295-4327.
- [CrossRef] [Google Scholar]
- Irritant principles of the spurge family (Euphorbiaceae) xiii. oligocyclic and macrocyclic diterpene esters from latices of some Euphorbia species utilized as source plants of honey. J. Nat. Prod.. 1988;51:1062-1074.
- [CrossRef] [Google Scholar]
- Euphorbia diterpenes: isolation, structure, biological activity, and synthesis (2008–2012) Chem. Rev.. 2014;114:8579-8612.
- [CrossRef] [Google Scholar]
- Inflflammation modulatory phorbol esters from the seeds of Aquilaria malaccensis. J. Nat. Prod.. 2017;80:1421-1427.
- [CrossRef] [Google Scholar]
- Two new diterpenes from Euphorbia kansuensis. Fitoterapia. 2008;79:262-266.
- [CrossRef] [Google Scholar]
- Tigliane diterpenoids from the Euphorbiaceae and Thymelaeaceae families. Chem. Rev.. 2015;115:2975-3011.
- [CrossRef] [Google Scholar]
- Study on the chemical constituents from fresh roots of Euphorbia fischeriana. J. Chin. Med. Mater.. 2010;33:1406-1409.
- [Google Scholar]
- Chemical constituents from Euphorbia tirucalli. Nat. Prod. Res. Dev.. 2014;26:1961-1964.
- [Google Scholar]
- Diterpenoids from the genus Euphorbia: Structure and biological activity (2013–2019) Phytochemistry. 2021;190:112846
- [CrossRef] [Google Scholar]
- Euphanoids A and B, two new lathyrane diterpenoids with nitric oxide (NO) inhibitory activity from Euphorbia kansuensis. Nat. Prod. Res.. 2021;35:4402-4408.
- [CrossRef] [Google Scholar]
- Euphorkanlide A, a highly modifified ingenane diterpenoid with a C24 appendage from Euphorbia kansuensis. Org. Lett.. 2019;21:4128-4131.
- [CrossRef] [Google Scholar]
- Chemical constituents of Euphorbia tibetica and their biological activities. Chin. J. Nat. Med.. 2014;12:0038-0042.
- [CrossRef] [Google Scholar]
- Terpenoids from Chloranthus multistachys. Nat. Prod. Res.. 2008;22:1163-1168.
- [CrossRef] [Google Scholar]
- Triterpenoids of Euphorbia kansuensis Proch. Fitoterapia. 2012;83:1242-1247.
- [CrossRef] [Google Scholar]
- Norlathyrane diterpenes from the root of Euphorbia kansuensis. Chem. Biodiversity. 2013;10:1887-1893.
- [CrossRef] [Google Scholar]
Appendix A
Supplementary material
Supplementary data to this article can be found online at https://doi.org/10.1016/j.arabjc.2022.103807.
Appendix A
Supplementary material
The following are the Supplementary data to this article:Supplementary data 1
Supplementary data 1


