

Translate this page into:
Sobol sensitivity analysis for non-carcinogenic health risk assessment and water quality index for Kohgiluyeh and Boyer-Ahmad Province, Western Iran
⁎Corresponding author. azhdarpoor@sums.ac.ir (Abooalfazl Azhdarpoor)
-
Received: ,
Accepted: ,
This article was originally published by Elsevier and was migrated to Scientific Scholar after the change of Publisher.
Peer review under responsibility of King Saud University.
Abstract
Human activities and climate may have an impact on the water quality of reservoirs. Therefore, the present research aims to use the entropy water quality index assessment technique to analyze the water quality features of the main water supply reservoirs as well as to investigate the effect of water parameters on the water quality of the reservoirs. In this study, the total non-carcinogenic health risks from various exposure paths were estimated for adults and children. The water quality of the major water supply reservoirs in Kohgiluyeh and Boyer-Ahmad province was typically poor and unfit for human consumption. Besides, the non-carcinogenic risk was higher in males (0.958–1.497) and children (1.065–1.664) than in females (0.879–1.374) according to health risk assessments. Among the factors under study, magnesium and nitrate had the highest influence on the non-carcinogenic risk. Finally, the sensitivity of each of the parameters affecting the non-carcinogenic risk was assessed using Sobel sensitivity analysis. The results indicated that the nitrate concentration (Cw) and Ingestion Rate (IR) were the most sensitive in the oral state, while Cw and fraction of skin’s surface area (F) were more sensitive in the dermal state.
Keywords
Health risk assessment
Water quality
Ions
Sobol sensitivity analysis

1 Introduction
One of the most important requirements for health, growth, and development in today's societies is having high-quality drinking water, and every-one's attention is currently focused on the safety of water reservoirs. The conservation of water reservoirs is one of the initial and most fundamental steps in their management and exploitation (Yin et al., 2021, Ren et al., 2021, Bibi et al., 2021).
Scientific assessment of water resources is required to better understand their qualities and ensure the health and safety of the water consumed by humans. Health risk assessment associated with water resources can reveal a relationship between human health and water pollutants (Ji et al., 2020, Radfard et al., 2018). It is possible to make an essential and sensible decision about how to manage and safeguard water resources by assessing the health hazards posed by water resources. Under certain conditions, the physical and chemical qualities of water are altered as a result of its interaction with subsoil and rock, necessitating a change in the source of water supply. Different minerals can be present in water sources in the form of cations and anions, depending on the source of water supply (Deng et al., 2021, Jiries et al., 2022, Gugulothu et al., 2022).
Two of the most frequent substances that impact the quality of drinking water are nitrate (NO3–) and fluoride (F-). Fluoride enters water primarily from geological and anthropogenic sources, with dissolved minerals containing fluoride serving as the primary source (Gao et al., 2020, Li et al., 2014). Excess fluoride in water causes high intake in people's bodies, particularly in youngsters, which has negative consequences such as caries and deformation of bones, whereas a lack of fluoride in water causes tooth decay (Li et al., 2014, Chandrajith et al., 2012). Nitrate pollution is a kind of manmade groundwater contamination that can come from both point (such as septic systems, dairy lagoons, wastewater effluent penetration, and livestock manure) and non-point origins (such as fertilizers, pesticides, manure application, atmospheric deposition, etc.). Increased NO3– pollution in drinking water causes health problems in children including methemoglobinemia, thyroid disorders, and high blood pressure (Radfarda et al., 2019, Azhdarpoor et al., 2019, Subba Rao, 2021). These NO3– and F– produce a non-carcinogenic health risk, which is a critical factor for population health. Several studies have highlighted the negative health impacts of enhanced NO3– and F– in groundwater (Ji et al., 2020).
Water quality can be assessed using a variety of methods including the water quality index (Şener et al., 2017), Entropy Water Quality Index (EWQI) (Wang et al., 2019), and fuzzy mathematical method (Dahiya et al., 2007). EWQI is the most extensively used approach for water quality assessment (Adimalla, 2021, Wang et al., 2019). The humans’ ability to monitor and control water quality has improved as water science has progressed. The health risk assessment of water resources complements the quality evaluation of water resources and aids in evaluating the ions impacting water quality (Adimalla et al., 2018, Rao et al., 2021, Qasemi et al., 2023).
The risks of exposure to polluted water resources can be assessed and used to urge people to pollute water resources less by calculating health risks. There are a variety of assessment models in use around the world. One of the most prevalent models is the health risk assessment model proposed by the US Environmental Protection Agency (USEPA). To date, water quality and health risks have been assessed in several studies including those conducted by (Zheng et al., 2017) and (Chen et al., 2017) in northeast and northwest China.
In the present study, to assess the non-carcinogenic health risk factors related to F–, NO3–, NO2–, Mg2+, Mn2+, and Fe2+ through ingestion and dermal paths, an effort has been made to 1. determine the distribution patterns of non-carcinogenic health risk assessment, 2. distinguish contaminant resources utilizing hydrochemistry markers, and 3. evaluate the non-carcinogenic health risk factors related to F–, NO3–, NO2–, Mg2+, Mn2+, and Fe2+ through ingestion and dermal routes. The findings of this study can help interpret the complicated factors affecting water quality, determine NO3– and F– pollution sources, and assess the risk level as it is associated with population health for the long-term management of groundwater resources.
2 Materials and methods
2.1 Study area
Kohgiluyeh and Boyer-Ahmad is an Iranian province with Yasuj as its capital. This province that extends 16,249 km2 and is bordered by Chaharmahal and Bakhtiari province in the north, by Khuzestan province in the west, by Bushehr province in the south, and by Fars and Isfahan provinces in the east is located along the Zagros Mountains, with the geographical coordinates of 29° 36′ 00″ and 31° 26′ 00″ North latitude and 49° 55′ 00″ and 51° 53′ 00″ East longitude. Rainfall in the province has decreased from the north-east to the south-west as a result of its geographic position, where around 80 % of it is surrounded by mountains. In addition, the area's average annual rainfall is approximately 863 mm, and the average temperature is 14℃ (Fakhir Nasab et al., 2020). As indicated in Fig. 1, 130 wells were sampled from the 8 counties of Kohgiluyeh and Boyer-Ahmad.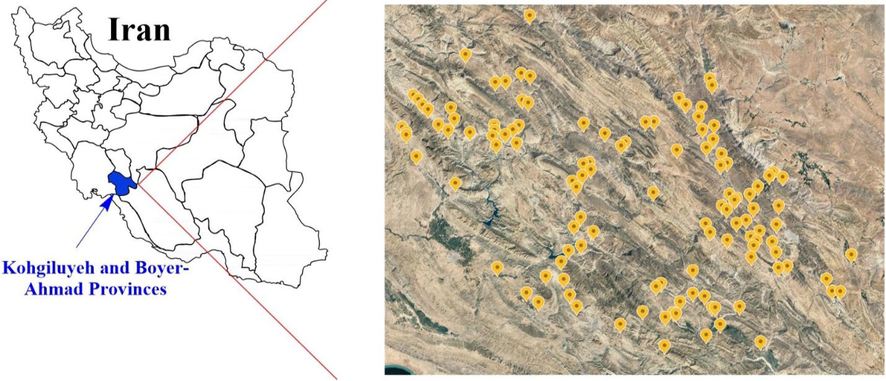
Map of the study area and water sampling points.
2.2 Sample collection and analysis
Local government authorities frequently evaluate the water quality of reservoirs. In Kohgiluyeh and Boyer-Ahmad province, there are eight reservoirs that were surveyed in the current research. The samples were taken from January to December 2021 and the water quality was evaluated weekly at each monitoring station. pH, Electroconductivity (EC), turbidity, Total Dissolved Solids (TDS), total alkalinity, total hardness, permanent hardness, temporary hardness, bicarbonate alkalinity, F-, Cl-, SO42-, PO42-, NO2–, NO3–, Ca2+, Mg2+, K+, Fe2+, and Mn2+ were some of the monitored indicators. When the highest concentrations of water quality indicators were less than the detectable level, water quality was assessed using half of the detectable limit. Standard methodologies were used for the analysis. Before sampling, the samples were gathered in disposable polyethylene containers that had been rinsed three times. A portable pH meter was used to monitor the pH levels in place. Duplicates of every sample were also taken to guarantee the validity and accuracy of the data. In fact, the accuracy of the analyses were checked using verified reference materials under identical conditions and the dependability of the data was ensured (Zhang et al., 2018). Overall, 580 samples from the entire province were gathered over the course of a year and analyzed for various parameters in the dependable lab of the water and wastewater company using the techniques from the Standard Methods (Rice et al., 2012).
2.3 Entropy water quality index
EWQI is a comprehensive water quality evaluation method that has been widely used to determine the quality of water for drinking purposes (Su et al., 2018, Zhou et al., 2016). The steps for calculating the EWQI are as follows:
The first step in calculating the EWQI is to give each water quality measure the appropriate weight. The entropy ej and entropy weight wj can then be computed using Eq. (1) to Eq. (3).
The second step in calculating the EWQI is to compute the quality rating scale (qj), which can be done using Eq. (4).
Where Cj is the concentration of the investigated water quality parameters and Sj is the water quality parameter recommendation value in the Iranian standard (ISIRI, 2010).
Finally, the EWQI can be determined using Eq. (5).
According to the findings of the EWQI, water quality can be divided into five categories, namely excellent quality (less than25), good quality (25 ∼ 50), medium quality (50 ∼ 100), poor quality (100 ∼ 150), and extremely poor quality (greater than150) (Adimalla, 2021, Su et al., 2018, Subba Rao et al., 2020).
2.4 Health risk assessment
Humans are exposed to toxic compounds in water through three major routes; i.e., ingestion through drinking water, intake through inhalation, and dermal exposure (Wang et al., 2021, Li et al., 2021, Ji et al., 2020). Since water is mostly utilized for drinking and bathing, the major exposure methods for the inhabitants in the study region were drinking water ingestion and dermal exposure. F–, NO3–, NO2–, Mg2+, Mn2+, and Fe2+ were chosen to do the non-carcinogenic health risk assessment according to the measurement data. In this research, age and sex were both regarded as the factors affecting the health risk, and three groups (children, adult females, and adult males) were deemed (Zhang et al., 2021).
Eq. (6) and Eq. (7) were used to assess the non-carcinogenic risk of drinking water consumption (He et al., 2021, He and Wu, 2019).
Where IR was the ingestion rate of drinking water (L/day) and C was the contaminant concentration in the collected samples (mg/L). IR was divided into two components in this research. The first was direct water intake (IR1), while the second was indirect water intake (IR2) such as consuming food prepared with water. EF referred to the exposure frequency (day/year), and its value was 365 day/year. ED stood for the exposure duration (year), F (unit less) denoted the fraction of the skin's surface area in contact with water, BW referred to bodyweight (kg), AT was the average time of non-carcinogenic effects (day) (Karunanidhi et al., 2021), and RfD was the reference dosage (mg/(kg.day)). Based on the Integrated Risk Information System (IRIS) database of the USEPA, the RfDoral levels for F–, NO3–, NO2–, Mg2+, and Mn2+ were 0.06, 1.6, 0.1, 11.0, and 0.14 mg/(kg.day), respectively (USEPA, 1996, Council and Committee, 1977). Additionally, the provisional-RfD for Fe2+ was 0.7 mg/(kg. day) (Agency, 2006). The particular values for each of these have been listed in Table 1 (Yin et al., 2021).
Parameters
Units
Children
Adult males
Adult females
IR1
L/day
0.52
1.73
1.22
IR2
L/day
0.21
0.57
0.47
ED
Year
12
30
30
BW
Kg
20
70
56
AT
Day
4380
10,950
10,950
t
h/day
0.4
0.4
0.4
EF
Day/year
365
365
365
F
Unit less
0.65
0.65
0.65
SA
cm2
7557
17,000
15,000
Eq. (8) to Eq. (11) were used to estimate the non-carcinogenic risk of dermal exposure (Li et al., 2017).
Where EV stood for daily dermal contact exposure frequency that was 1 in this study, SA was the surface area of the skin (cm2), and K was the permeability of the skin that was considered 0.001 cm/h. The contact time (h/day) or exposure time (ET) was set at 0.4 h/day for both adults and children (Li et al., 2016). ABSgi was a gastrointestinal absorption factor with a value of 1 for all the ions and CF was a conversion factor with a value of 0.001. Eq. (12) and Eq. (13) were used to calculate the total non-carcinogenic risks.
Where HI referred to the non-carcinogenic risk index. HI less than 1 denoted a tolerable risk, whereas HI ≥ 1 indicated a higher-than-tolerable non-carcinogenic risk (Zhou et al., 2021).
2.5 Sobol sensitivity analysis
To find the relevant input parameters and evaluate their impacts on the variance of the exposure outcomes, use was made of Sobol sensitivity analysis combined with the Monte Carlo approach (Sobol, 2001). The Sobol Sensitivity Indices (SIs) refer to the ratio of the partial variable to the overall variable. The first term of SI is named First Order Sensitivity Index (FOSI), which explains the impact of a single variable on the variance in model results. The second term is named Second-Order Sensitivity Index (SOSI) that explains the impact of the interaction between variables. Finally, the Overall Order Sensitivity Index (TOSI) is used to compute the overall influence of the variable on the final variance. Sensitivity indices greater than 0.1 (highly sensitive), 0.01–0.1 (sensitive), and less than 0.01 (insensitive) represent significantly relevant, prominent, and unresponsive input variables, respectively (Mukherjee and Singh, 2022, Mukherjee and Singh, 2021). In the current research, Sobol sensitivity analysis was carried out utilizing the R-platform (‘EnvStats’, ‘sensobol’, ‘EnviroPRA’ packages), version 4.1.2.
2.6 Spatial distribution
This investigation revealed the spatial distribution of the health risk assessment. The Arc-GIS program (10.8.1 version) was utilized to analyze the spatiotemporal variations in the concentrations of contaminants in groundwater in this area to detect high contamination locations by Inverse Distance Weighted (IDW) analysis (RadFard et al., 2019).
3 Results and discussion
3.1 General hydrochemistry
Based on the findings of laboratory and field experiments, the chemical features of groundwater were detailed. The statistical information on the appropriateness of groundwater for drinking based on Iranian Standard (ISIRI, 2010) and World Health Organization’s (WHO) guidelines (Organization, 2017) has been presented in Table 2. Based on the results, the mean temperature of groundwater over a year was 19.44 °C, which contributed to regulating the responses in the groundwater and aquifers media. In addition, the groundwater in the region was considerably mineralized. The average EC and TDS were 567.4 µmhos/cm and 319.1 mg/L, respectively, indicating that the liquid phase of water had a considerable contact with both gaseous and solid media. None of the samples exceed the Iranian Standard and WHO-recommended limits for EC and TDS (Organization, 2017, ISIRI, 2010). Moreover, the mean pH of the groundwater was 7.64, which indicated that it was moderately alkaline. As seen by the mean concentration of 195.2 mg/L in groundwater, the total alkalinity of groundwater was mostly attributable to soluble carbon dioxide molecules in water. Furthermore, the average hardness of the groundwater in the area was 239.3 mg/L as CaCO3, indicating that the groundwater in the region was extremely hard. Water with a hardness of more than 200 mg/L in 58.1 % of the samples was unfit for human consumption (Organization, 2017).
Parameter
N = 580
Iranian standard
WHO
Percentage of the samples having higher values than
Min.
Max.
Mean
Std. Dev.
Iranian standard
WHO
Temperature (℃)
18
22
19.44
1.43
–
–
–
–
pH
7.02
7.89
7.64
0.291
6.5 – 8.5
6.5–8.5
0 %
0 %
EC (µmhos/cm)
210
1960
567.4
245.4
–
–
–
–
Turbidity (NTU)
0.04
4.9
0.73
0.67
5
5
0 %
0 %
TDS (mg/L)
32
771
319.1
136.8
1000
1000
0 %
0 %
Total alkalinity
(Methyl orange)85
400
195.2
66.7
–
–
–
–
Total hardness (mg/L)
50
908
239.3
122.2
200
200
58.1 %
58.1 %
Permanent hardness (mg/L)
35
652
144.4
82.8
–
–
–
–
Temporary hardness (mg/L)
10
284
89
46.2
–
–
–
–
Bicarbonate alkalinity (mg/L)
23
488
230.9
72.9
–
–
–
–
F- (mg/L)
0.0
1.3
0.45
0.22
1.5
1.5
0 %
0 %
Cl- (mg/L)
0.2
78
13.57
17.23
250–400
200–600
0 %
0 %
SO42- (mg/L)
1
612
55.48
89.2
250–400
400
6 %
6 %
PO42- (mg/L)
0.01
1.1
0.24
0.25
–
–
–
–
NO2– (mg/L)
0
0.65
0.06
0.12
3
3
0 %
0 %
NO3– (mg/L)
0.01
90.7
13.41
10.87
50
50
1 %
1 %
Ca2+ (mg/L)
0.63
250
58.65
30.11
300
75–200
5 %
8 %
Mg2+ (mg/L)
2.4
55.2
20.01
9.56
30
30
3 %
3 %
K+ (mg/L)
0.02
20.3
2.42
4.02
–
10
–
5 %
Fe2+ (mg/L)
0.0
1
0.18
0.2
0.3
0.3
9 %
9 %
Mn2+ (mg/L)
0.0
2
0.17
0.34
0.1
0.1
45 %
45 %
The mean Ca2+ and Mg2+ levels in groundwater were 58.65 mg/L and 20.01 mg/L, respectively. Sandstone, limestone, basalts, and dolomites found in the region might considerably contribute to Ca2+ and Mg2+ levels in groundwater. In all WHO-mandated samples, the quantity of Ca2+ ions were within the allowed level, but the level of Mg2+ ions surpassed the allowed limit in 3 % of the samples. Additionally, the mean K+ content was 2.42 mg/L, which might be due to the potential for K+ to be absorbed back through groundwater movement. K+ is produced by the ion exchange process and can come from both geological and human origins in groundwater. If potassium compounds are widely utilized, farming can add K+ to groundwater. Moreover, the concentration of Mn2+ in groundwater was averagely 0.17 mg/L. According to the WHO guidelines, the allowable level of Mn2+ is 0.1 mg/L. The WHO’s guideline was exceeded in almost 45 % of the samples. Finally, the Fe2+ concentration differed widely from well to well, with a mean of 0.18 mg/L. The WHO has established a maximum of 0.3 mg/L for Fe2+ in drinking water (Nawale et al., 2021).
In the research region, SO42– levels in groundwater varied from 1 to 612 mg/L (mean: 55.48 mg/L). In 6 % of the samples, the level of SO42– ions surpassed the allowed limit. Groundwater may contain SO42– as a result of atmospheric deposition. It is impossible to rule out the potential of sulphur-bearing minerals like pyrite occurring in coal. Sulfate fertilizers can play a role, as well (Marghade et al., 2021, Organization, 2017). On the other hand, phosphate concentrations were low (0.24 mg/L). The highest phosphate level was 1.1 mg/L, while the lowest value was 0.01 mg/L. The mean NO2– and NO3– concentrations in groundwater were 0.06 and 13.41 mg/L, respectively. Inappropriate disposal, sewage, and farming in the region were the substantial contributors to NO3– in groundwater. The NO3–exceeded the Iranian standard and WHO’s limit of 50 mg/L in 1 % of the samples. Finally, the level of F– varied from 0 to 1.3 mg/L (mean: 0.45 mg/L). Aqueous media with F– carrying minerals caused F– to enter the groundwater in the studied region (Sankhla and Kumar, 2018, Organization, 2017, ISIRI, 2010).
3.2 Water quality assessment
F-, NO3–, NO2–, Ca2+, Mg2+, Mn2+, and Fe2+ were chosen as water quality parameters in this research to accomplish an all-water quality evaluation utilizing the EWQI. The EWQI calculations for the groundwater samples have been provided in Table 3. Accordingly, EWQI was 80 to 516 for the measured variables in a year. One reservoir had medium-quality water (rank 3), while the other had severely poor-quality water (rank 5) that could be utilized for drinking after considerable treatment. Overall, the findings demonstrated that the quality of groundwater was typically unfit for drinking throughout the year. The evaporating and concentrating impacts of the groundwater might be attributed to high temperatures and high evaporation rates throughout the year. Furthermore, the increase in surface water and groundwater levels over a year made it simpler for surface water, which could be contaminated by animal feces, human excrement, and other sources, to permeate into groundwater.
Counties
EWQI
Water Quality
Basht
194
Extremely poor quality
Boyer-Ahmad
175
Extremely poor quality
Bahmai
299
Extremely poor quality
Choram
233
Extremely poor quality
Dana
380
Extremely poor quality
Gachsaran
80
Medium quality
Lendeh
426
Extremely poor quality
Kohgiluyeh
516
Extremely poor quality
Drinking water is transmitted by pipelines and increased temperature will alter the development of microorganisms in pipelines, resulting in a rise in bacteria, microorganisms, and byproducts and lowering the overall quality of water. Mg2+ and NO3– are two important ions for determining water quality. Agricultural activities are linked to NO3– concentrations in various seasons. The water quality of the groundwater is often inadequate for house use. The water quality of Gachsaran was better than that of other reservoirs, which suggested that climate change could have a big influence on the groundwater quality (Ji et al., 2020).
3.3 Health risk assessment
Since groundwater is the primary supply of drinking water, the health risks associated with ingesting polluted water gets to be a major concern (Adimalla, 2021). The Hazard Quotient (HQoral) for the consumption of drinking water in adult males ranged from 0.955 to 1.492, with an average of 1.179. This measure ranged from 0.877 to 1.371 in adult females, with an average of 1.083. For children, the HQoral through the consumption of drinking water varied from 1.061 to 1.658, with an average of 1.310. Based on the results, 75 % of the samples for adult males, 50 % for adult females, and 100 % for children had an HQoral surpassing 1, indicating that almost all the samples might cause non-carcinogenic risks. Dermal exposure had a lower hazard quotient (HQdermal) compared to oral exposure, ranging from 0.003 to 0.004, 0.002 to 0.004, and 0.004 to 0.007 for adult males, adult females, and children, respectively. This showed that the non-carcinogenic risk was primarily transmitted through the oral ingestion of polluted water. The overall non-carcinogenic health risks (HItotal) for children, adult females, and adult males have been presented in Table 4. Accordingly, adult males had a non-carcinogenic risk of 0.958 to 1.497 (mean: 1.182), adult females had a non-carcinogenic risk of 0.879 to 1.374 (mean: 1.086), and children had a non-carcinogenic risk of 1.065 to 1.664 (mean: 1.315). These findings suggested that adults and children in the study region encountered a significant non-carcinogenic health risk. On the other hand, children in the research region faced higher non-carcinogenic health risks in comparison with adults. However, no significant difference was observed between the adult males and females in terms of health risks. Similar studies have also revealed a greater health risk for children compared to adults, implying that children were more sensitive to pollutants compared with adults (Li et al., 2021, Wang et al., 2021). The non-carcinogenic health risks associated with the Bahmai reservoir were greater than those associated with other reservoirs.
Counties
HQoral
HQdermal
HItotal
Children
Adult males
Adult females
Children
Adult males
Adult females
Children
Adult males
Adult females
Basht
1.209
1.088
0.999
0.005
0.003
0.003
1.214
1.092
1.003
Boyer-Ahmad
1.061
0.955
0.877
0.004
0.003
0.002
1.065
0.958
0.879
Bahmai
1.658
1.492
1.371
0.007
0.004
0.004
1.664
1.497
1.374
Choram
1.519
1.368
1.256
0.006
0.004
0.003
1.526
1.372
1.259
Dana
1.274
1.147
1.053
0.005
0.003
0.003
1.279
1.150
1.056
Gachsaran
1.356
1.221
1.121
0.006
0.004
0.003
1.362
1.225
1.125
Lendeh
1.215
1.094
1.005
0.005
0.003
0.003
1.220
1.097
1.008
Kohgiluyeh
1.184
1.066
0.979
0.005
0.003
0.003
1.189
1.069
0.981
Min
1.061
0.955
0.877
0.004
0.003
0.002
1.065
0.958
0.879
Mean
1.310
1.179
1.083
0.005
0.003
0.003
1.315
1.182
1.086
Max
1.658
1.492
1.371
0.007
0.004
0.004
1.664
1.497
1.374
Pollutants lead to health concerns in diverse ways. As indicated in Fig. 2, Mg2+ (57.93 %) followed by NO3– (39.80 %) were the most important factors in non-carcinogenic risks. Other pollutants contributed by less than 5 % to non-carcinogenic risks, implying that Mg2+ and NO3– might be the causes of negative human health impacts. The sequence, in which the contaminants contributed to non-carcinogenic risks was as follows: Mg2+ > NO3– > F- > Mn2+ > Fe2+ > NO2–.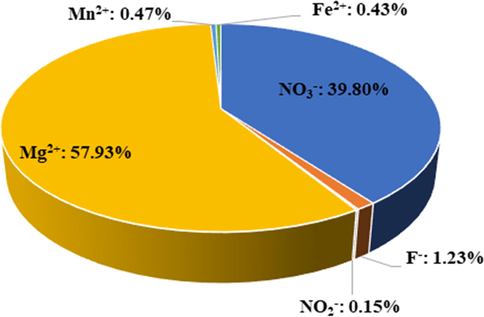
Contributive ratios of non-carcinogenic risk pollutants to health risks.
Generally, there are three uncertainties in every health risk assessment: model uncertainty, parameter uncertainty, and input data uncertainty. In the present study, there were some uncertainties in the model itself. For instance, SA and DA were computed using experimental models and, consequently, the SA and DA values varied depending on the used experimental models. In addition, assessment models contained a large number of factors, each of which was correlated to a level of uncertainty. For adults and children, the water consumption rate was considered 0.52 to 1.73 L/d in a direct way and 0.21 to 0.57 L/d in an indirect way in this research. These estimates were based on statistical data, but they varied from person to person. Various rates of consumption result in different dangers. Likewise, BW, AT, and EV quantities are all derived from statistical data, and various people may have various parameter quantities. Furthermore, the input data had an element of uncertainty. Even though all the water samples were evaluated in a qualified laboratory using conventional processes and techniques, both analytical and systematic errors were unavoidable and added to the level of uncertainty. Despite these concerns, the study findings were credible and useful. The findings indicated the mean risk levels, with individual risks varying within a reasonable range around the average. These results are particularly important for decision-makers, since they provide them with broad risk information that leads to making informed decisions based on the majority of people. When comprehensive information is supplied, it is often difficult to make sound decisions. Decision-makers, for instance, find it hard to make judgments if they take into account each individual's real-life circumstances (Li et al., 2016, Qasemi et al., 2019, Nabizadehb et al., 2019).
The drinking water supplies of several towns, including Tehran, Mashhad (Khorasan Razavi), Ardabil, Ahwaz (Khuzestan), and Qom, have greater nitrate concentrations than the level advised by the Institute of Standards and Industrial Research of Iran (ISIRI) and WHO. This is according to a study by Darvishmotevalli et al. in Iran, which evaluated the carcinogenic hazards associated with nitrate exposure in drinking water. As a result, the cancer risk associated with nitrosamine, which is created when nitrate is taken through drinking water, is higher in these cities. According to this study, there is a significant link between nitrate exposure and the occurrence of cancer in the vast majority of Iranian districts whose drinking water sources have been restricted (Darvishmotevalli et al., 2019). The level of nitrate in drinking water was identified by Fallahzadeh et al. as the most crucial factor. The average nitrate concentration was 27.57 to 6.80 mg/L, and all observed amounts were below the allowed maximum threshold. Children in this group were at a high risk since their HQ values were more than 1. The author came to the conclusion that lowering the concentration of nitrate might lower population risk (Fallahzadeh et al., 2019).
3.4 Sobol sensitive analysis
The Sobol sensitivity analysis was performed to analyze the most relevant input factors related to the non-carcinogenic health hazards related to nitrate contamination in drinking water in the population of the region. The factors for this model have been listed in Table 1. As the table depicts, the oral model had four input factors, namely nitrate concentration in groundwater (Cw), Body Weight (BW), Exposure Frequency (EF), and Intake Rate (IR1 and IR2), while the dermal model had six input factors as follows: contaminant concentration (Cw), the fraction of skin contact (F), exposure during shower time (ET), BW, skin surface area (SA), and EF.
According to the results of Sobol sensitivity analysis (Fig. 3), the Cw parameter was the most effective parameter in oral HQ among the children (0.793), males (0.386), and females (0.466). Following Cw, the parameters were ranked as IR (0.093) > EF (0.024) > BW (0.007) in the children and as IR (0.321, 0.274) > BW (0.022, 0.022) > EF (0.011, 0.014) in male and female adults. The BW value was less than 0.01 among the children, indicating its insensitivity in terms of relevance. Besides, the EF value was the less sensitive parameter in adult males and females. However, since the Cw value was more sensitive in females than in males, it could be concluded that this parameter was more important in females, while IR was more important in males. Since the total sensitivity was higher than the first-order sensitivity, these parameters had interactions. The values of the effective parameters in total Sobol sensitivity in oral HQ were as follows: Cw = 0.874, IR1 = 0.156, EF = 0.042, and BW = 0.013 for children, Cw = 0.627, IR1 = 0.559, BW = 0.055, and EF = 0.029 for males, and Cw = 0.675, IR1 = 0.474, BW = 0.051, and EF = 0.032 for females. The interaction diagram (Fig. 3) for the children showed that Cw had interaction effects with three factors, with the effect being significantly stronger for Cw-IR1 compared to Cw-EF and Cw-BW, which varied for different IR1 values. There were also interactions between Cw-BW, Cw-IR1, BW-IR1, Cw-EF, and IR1-EF in both males and females. However, the severity of this interaction was much greater between IR1 and Cw, and all the other parameters, except for EF-BW, had very little interactions. Furthermore, the children were more exposed to non-carcinogenic risks from water contaminants in comparison with adults, and Cw was among the most effective parameters in the oral HQ of this group. The sensitivity study findings for IR2 were comparable to the sensitivity analysis results for IR1, which was due to the same parameters and the same way of exposure to nitrate in water (Fig. 4). The effective parameters in oral HQ in total Sobol sensitivity were Cw = 0.793, IR2 = 0.093, EF = 0.024, and BW = 0.007 for children, Cw = 0.386, IR2 = 0.321, BW = 0.022, and EF = 0.011 for males, and Cw = 0.466, IR2 = 0.274, BW = 0.022, and EF = 0.014 for females.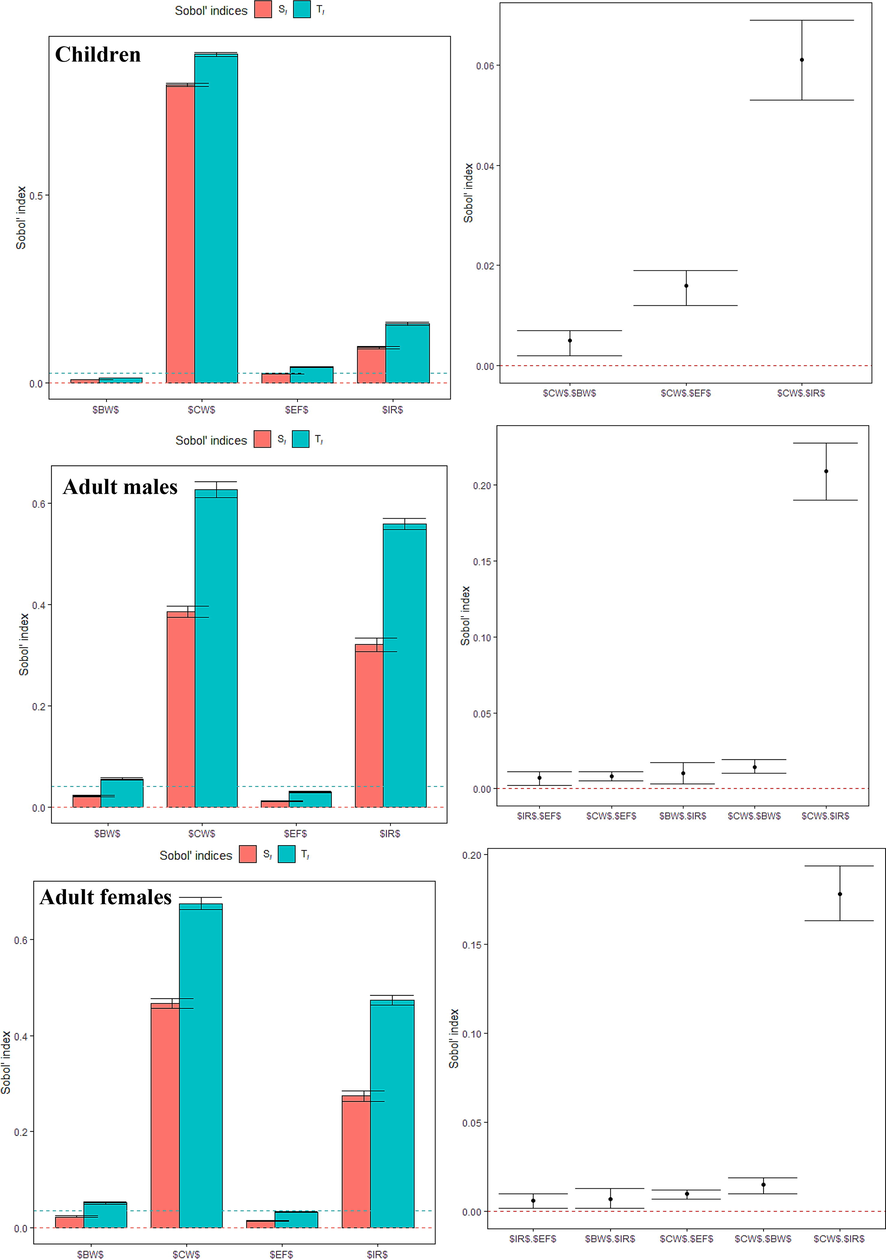
Sensitivity analysis based on the oral HQ ingestion model (Cw, BW, IR1, EF) for the three age groups considering the first-order effect (Si), total effect (Ti), and pair-wise interactions.
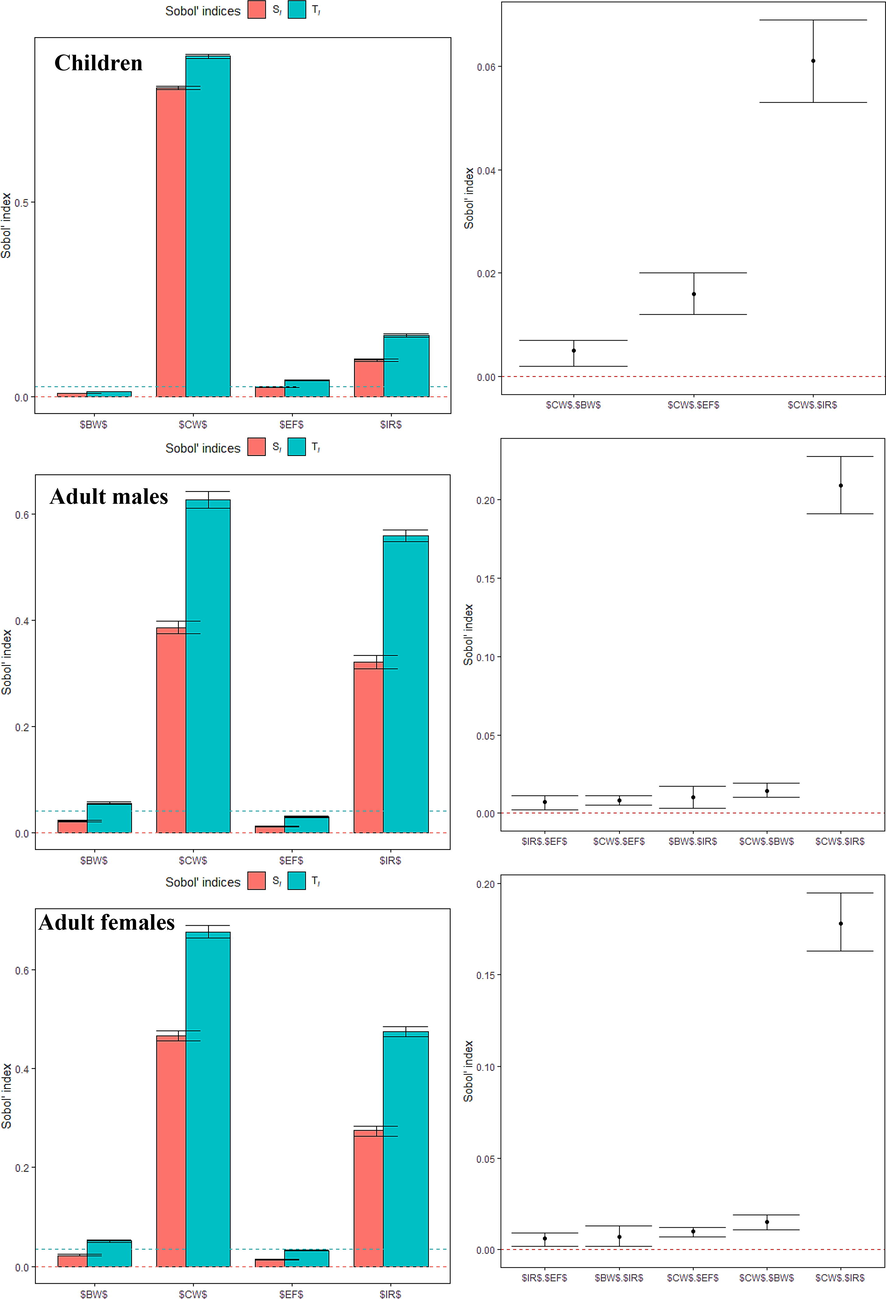
Sensitivity analysis based on the oral HQ ingestion model (Cw, BW, IR2, EF) for the three age groups considering the first-order effect (Si), total effect (Ti), and pair-wise interactions.
Cw was the most important and effective parameter in dermal HQ amongst children (0.837), males (0.783), and females (0.792). The parameters were ranked as F (0.064) > EF (0.025) > BW (0.008) in the children and as F (0.060, 0.060) > BW (0.044, 0.038) > EF (0.024, 0.024) in male and female adults. All the ET and SA values were less than 0.01, showing their insensitivity to the dermal HQ. Furthermore, because the Cw value was larger in females than in males, this parameter was more essential in females. However, BW was more important in males. Moreover, because the total sensitivity was greater than the first-order sensitivity, it might be inferred that these factors interacted with each other. Considering the total Sobol sensitivity in dermal HQ, the effective parameters were Cw = 0.901, F = 0.108, EF = 0.044, and BW = 0.013 for children, Cw = 0.868, F = 0.104, BW = 0.077, and EF = 0.042 for males, and Cw = 0.874, F = 0.105, BW = 0.067, and EF = 0.043 for females. In the children, the interaction diagram (Fig. 5) revealed that Cw interacted with three parameters, with the influence of Cw-F being much greater than Cw-EF and Cw-BW, which changed for various F values. In both males and females, there were interactions between Cw-F, Cw-BW, and Cw-EF, with the intensity of the interaction between F and Cw being significantly stronger compared to the other parameters. All the other parameters had moderate interactions. Similar results were also obtained in another study conducted by Karunanidhi et al. on nitrate concentrations amongst children, males, and females. The results also indicated that children were more sensitive to changes in the parameters affecting health risk compared to males and females (Karunanidhi et al., 2021).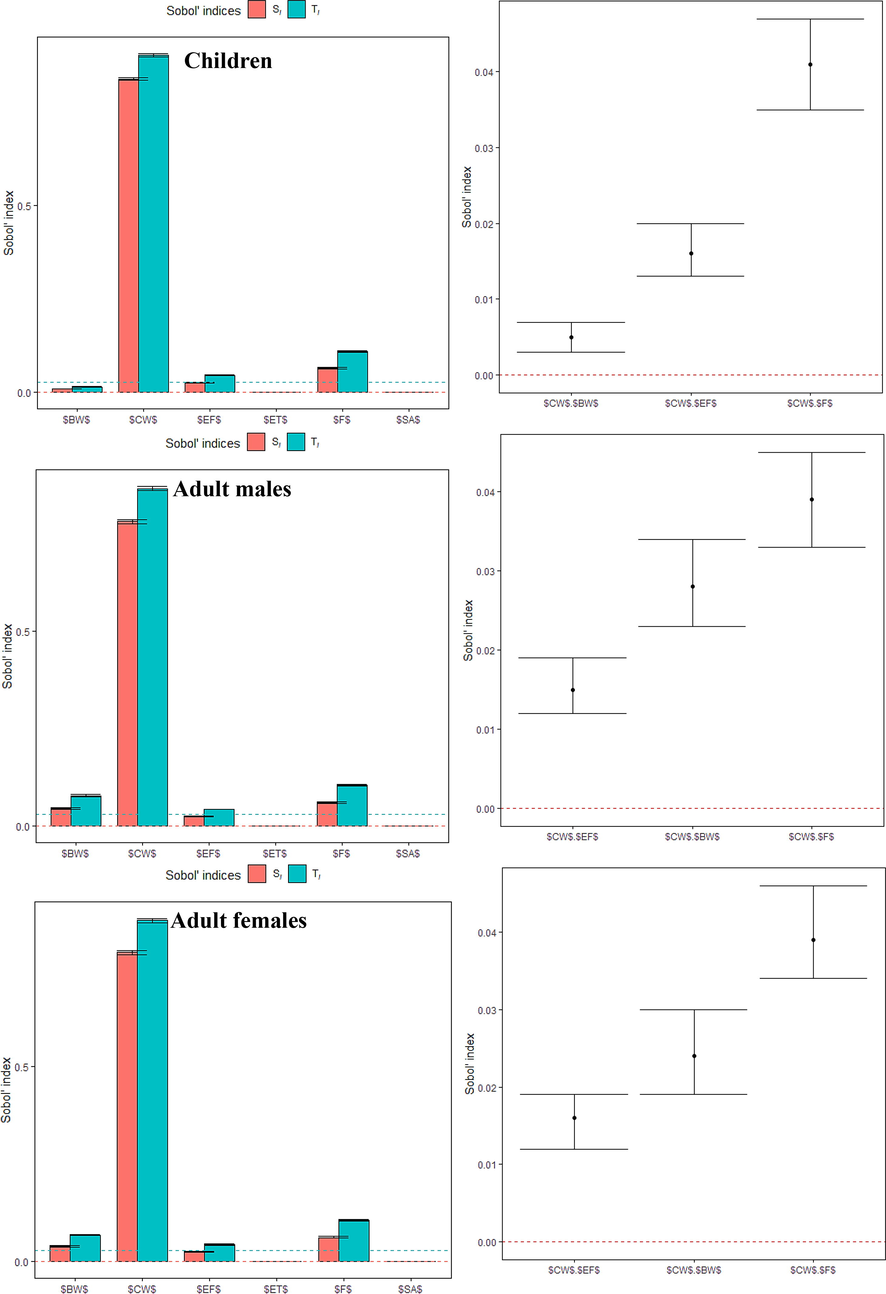
Sensitivity analysis based on the dermal HQ model (Cw, BW, SA, F, ET, EF) for the three age groups considering the first-order effect (Si), total effect (Ti), and pair-wise interactions.
3.5 Spatial distribution
F-, NO3–, NO2–, Ca2+, Mg2+, Mn2+, and Fe2+ all showed a wide range of contamination from mild to severe. Nonetheless, the HI of the three groups (children, males, and females) revealed the comparable geographical distribution patterns of the environmental risk (Fig. 6a, b, and c). The hazard in this area was substantially higher compared to other places. Additionally, the concentrations of these ions were higher in the west, northwestern, and bordered areas with Fars province than in other regions. This provided obvious environmental consequences inside these zones, needing more monitoring. Given that groundwater is the principal supply of water in Kohgiluyeh and Boyer-Ahmad province, it is logical to assume that the ions concentrations are rather higher in these resources than in other regions (Davraz and Batur, 2021). Ion concentrations have risen as a result of geological composition, land use in the vicinity of groundwater sources, pollution leakage from diverse sources, and industrial effluent infiltration. Furthermore, ions concentrations alter with precipitation and annual rainfall, and groundwater levels shift from season to season. In places with high ion concentrations, the watershed height and depth are usually low. Another consideration is the general east-to-northwest slope of Kohgiluyeh and Boyer-Ahmad plains. As a result, agricultural operations should be established carefully (Ehya and Mosleh, 2018). Groundwater overuse to suit municipal, industrial, and agricultural demands can change the properties and natural components of water. Development and upgrade of the wastewater collection system as well as the rate at which industrial effluent is generated are the other factors that influence the concentrations of water pollutants (e.g., nitrate and fluoride). Monitoring of wells, reservoirs, and nearby regions is crucial due to the natural and human factors that affect the concentrations of ions in groundwater (Adeli Moghadam et al., 2020, Das and Nag, 2022).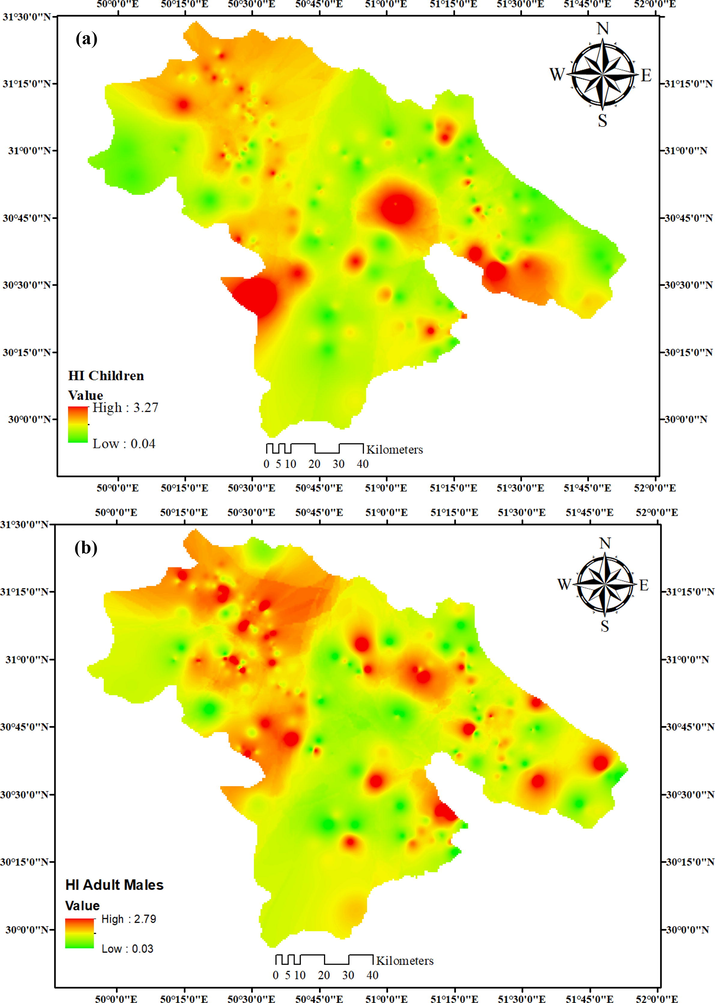
Spatial distribution of HI in children (a), adult males (b), and adult females (c).
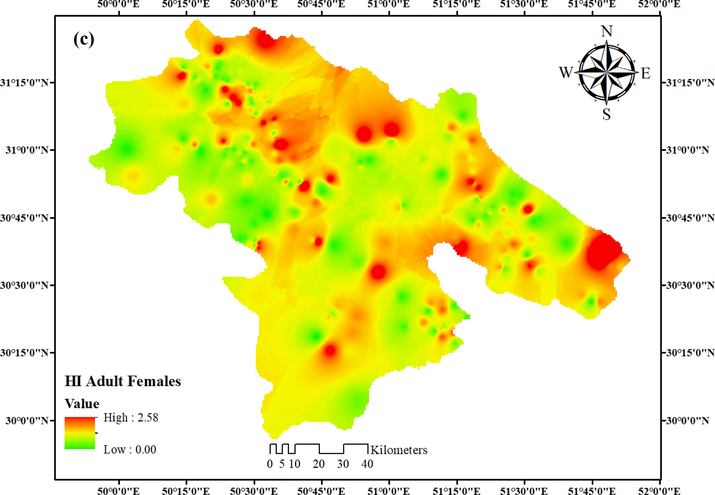
Spatial distribution of HI in children (a), adult males (b), and adult females (c).
4 Conclusion
The present study investigated the water quality parameters of eight counties in Kohgiluyeh and Boyer-Ahmad province. The EWQI was used to assess the water quality of the counties. Health risk assessment was also conducted, taking into consideration the participants’ gender and age. Based on the results, the reservoirs in the eight counties had a poor quality of water. Except for Gachsaran, the majority of the reservoirs had a severely poor water quality throughout the year. On the other hand, all the water quality indicators did not match the requirements for drinking, suggesting minor contamination in a nearby reservoir, except for Gachsaran. Consumption of polluted groundwater in the research region was attributed to human health concerns for people via a variety of routes including oral consumption and dermal exposure. For adult females, the overall non-carcinogenic risks ranged from 0.879 to 1.374. Adult males and children had considerably greater noncarcinogenic risks, ranging from 0.958 to 1.497 and 1.065 to 1.664, respectively. Mg2+ and NO3– were the primary pollutants that contributed to the total non-carcinogenic risk. The sequence, in which the contaminants contributed to non-carcinogenic risk was as follows: Mg2+ > NO3– > F- > Mn2+ > Fe2+ > NO2–. The sensitivity of the factors affecting the non-carcinogenic risk was further explored using the Sobel sensitivity analysis. The results indicated that nitrate concentration (Cw) was most sensitive in both oral and dermal conditions, which was followed by IR for oral condition and fraction of skin’s surface area (F) for dermal condition. Using the findings of this study, local decision-makers will be better informed, thereby providing a better management of groundwater resources in these areas.
Acknowledgments
The authors wish to thank Ms. A. Keivanshekouh at the Research Consultation Center (RCC) of Shiraz University of Medical Sciences for her invaluable assistance in editing the manuscript. The present article was adopted from the proposal number 25523 and ethical cod IR.SUMS.SCHEANUT.REC.1401.089 approved by Shiraz University of Medical Sciences.
Declaration of Competing Interest
The authors declare that they have no known competing financial interests or personal relationships that could have appeared to influence the work reported in this paper.
References
- ADELI MOGHADAM, E., DERIKVAND, E., ESLAMI, H., GHORBANIZADEH KHARRAZI, H. & RAZAZ, M. 2020. Determination of Suitable Areas for Groundwater Recharge in Different Geomorphological Units and Evaluation of Water Quality in Kohgiluyeh and Boyer Ahmad. Irrigation Sciences and Engineering, 43, 213-226.
- Evaluation of groundwater contamination for fluoride and nitrate in semi-arid region of Nirmal Province, South India: a special emphasis on human health risk assessment (HHRA) Hum. Ecol. Risk Assess.: Int. J.. 2018;25:1107-1124.
- [Google Scholar]
- Application of the Entropy Weighted Water Quality Index (EWQI) and the Pollution Index of Groundwater (PIG) to assess groundwater quality for drinking purposes: a case study in a rural area of Telangana State, India. Arch. Environ. Contam. Toxicol.. 2021;80:31-40.
- [Google Scholar]
- AGENCY, U. S. E. P. 2006. Provisional Peer Reviewed Toxicity Values for Iron and Compounds. US EPA, Superfund Health Risk Technical Support Center, National Center for ….
- Assessing fluoride and nitrate contaminants in drinking water resources and their health risk assessment in a semiarid region of southwest Iran. Desalin. Water Treat.. 2019;149:43-51.
- [Google Scholar]
- Analysis and health risk assessment of heavy metals in some onion varieties. Arabian J. Chem.. 2021;14:103364
- [Google Scholar]
- Spatial distribution of fluoride in groundwater of Sri Lanka. J. Natl. Sci. Found. Sri Lanka. 2012;40
- [Google Scholar]
- Assessing nitrate and fluoride contaminants in drinking water and their health risk of rural residents living in a semiarid region of northwest China. Exposure and Health. 2017;9:183-195.
- [Google Scholar]
- Drinking Water and Health. 1977;Volume 1
- Analysis of groundwater quality using fuzzy synthetic evaluation. J. Hazard. Mater.. 2007;147:938-946.
- [Google Scholar]
- Evaluation of carcinogenic risks related to nitrate exposure in drinking water in Iran. MethodsX. 2019;6:1716-1727.
- [Google Scholar]
- Hydrogeochemical assessment and appraisal of groundwater quality in Saltora Block, Bankura District, West Bengal, India. Int. J. Energy Water Resour.. 2022;6:209-230.
- [Google Scholar]
- Hydrogeochemistry characteristics of groundwater and health risk assessment in Yalvaç-Gelendost basin (Turkey) Appl. Water Sci.. 2021;11:1-21.
- [Google Scholar]
- Water quality and health risk assessment based on hydrochemical characteristics of tap and large-size bottled water from the main cities and towns in Guanzhong Basin, China. Enviro. Earth Sci.. 2021;80:1-15.
- [Google Scholar]
- Hydrochemistry and quality assessment of groundwater in Basht plain, Kohgiluyeh-va-Boyer Ahmad Province, SW Iran. Environ. Earth Sci.. 2018;77:1-21.
- [Google Scholar]
- FAKHIR NASAB, A., ALIJANI, B. & ASADIAN, F. 2020. Detection of air temperature and precipitation changes in Kohgiluyeh and Boyer-Ahmad provinces under climate change conditions using MIROC5 model. Physical Geography Quarterly, 13, 15-35
- Spatial analysis and probabilistic risk assessment of exposure to nitrate in drinking water of Abarkouh, Iran. J. Environ. Health Sustain. Develop. 2019
- [Google Scholar]
- Assessing natural background levels in shallow groundwater in a large semiarid drainage Basin. J. Hydrol.. 2020;584:124638
- [Google Scholar]
- GUGULOTHU, S., SUBBA RAO, N., DAS, R., DUVVA, L. K. & DHAKATE, R. 2022. Judging the sources of inferior groundwater quality and health risk problems through intake of groundwater nitrate and fluoride from a rural part of Telangana, India. Environmental Science and Pollution Research, 1-22
- Poor groundwater quality and high potential health risks in the Datong Basin, northern China: research from published data. Environ. Geochem. Health. 2021;43:791-812.
- [Google Scholar]
- Hydrogeochemical characteristics, groundwater quality, and health risks from hexavalent chromium and nitrate in groundwater of Huanhe Formation in Wuqi county, northwest China. Exposure and Health. 2019;11:125-137.
- [Google Scholar]
- ISIRI 2010. Drinking Water: Physical and Chemical Specifications (ISIRI No. 1053). 5th ed.; Institute of Standards and Industrial Research of Iran (ISIRI): Tehran, Iran, 26.
- Seasonal variation of drinking water quality and human health risk assessment in Hancheng City of Guanzhong Plain, China. Exposure and Health. 2020;12:469-485.
- [Google Scholar]
- Polycyclic aromatic hydrocarbons in citrus fruit irrigated with fresh water under arid conditions: concentrations, sources, and risk assessment. Arabian J. Chem.. 2022;15:104027
- [Google Scholar]
- Investigation of health risks related with multipath entry of groundwater nitrate using Sobol sensitivity indicators in an urban-industrial sector of south India. Environ. Res.. 2021;200:111726
- [Google Scholar]
- LI, P., QIAN, H., WU, J., CHEN, J., ZHANG, Y. & ZHANG, H. 2014. Occurrence and hydrogeochemistry of fluoride in shallow alluvial aquifer of Weihe River, China. Environ Earth Sci 71 (7): 3133–3145. doi. org/10.1007/s1266, 5-013.
- Appraising groundwater quality and health risks from contamination in a semiarid region of northwest China. Exposure and Health. 2016;8:361-379.
- [Google Scholar]
- Spatiotemporal variability of contaminants in lake water and their risks to human health: a case study of the Shahu Lake tourist area, northwest China. Exposure and Health. 2017;9:213-225.
- [Google Scholar]
- Groundwater quality, health risk, and major influencing factors in the lower Beiluo River watershed of northwest China. Hum. Ecol. Risk Assess.: Int. J.. 2021;27:1987-2013.
- [Google Scholar]
- Hydrogeochemical evaluation, suitability, and health risk assessment of groundwater in the watershed of Godavari basin, Maharashtra, Central India. Environ. Sci. Pollut. Res.. 2021;28:18471-18494.
- [Google Scholar]
- Characterization of groundwater nitrate exposure using Monte Carlo and Sobol sensitivity approaches in the diverse aquifer systems of an agricultural semiarid region of Lower Ganga Basin, India. Sci. Total Environ.. 2021;787:147657
- [Google Scholar]
- Environmental fate and health exposures of the geogenic and anthropogenic contaminants in potable groundwater of Lower Ganga Basin, India. Geosci. Front.. 2022;13:101365
- [Google Scholar]
- Northwest of Iran as an endemic area in terms of fluoride contamination: a case study on the correlation of fluoride concentration with physicochemical characteristics of groundwater sources in Showt. Desalin. Water Treat.. 2019;155:183-219.
- [Google Scholar]
- Non-carcinogenic health risk assessment with source identification of nitrate and fluoride polluted groundwater of Wardha sub-basin, central India. Ecotoxicol. Environ. Saf.. 2021;208:111548
- [Google Scholar]
- ORGANIZATION, W. H. 2017. Guidelines for Drinking-Water Quality, 4th edn. incorporating the first addendum. World Health Org (WHO), Geneva (Licence: CC BY-NC-SA 3.0 IGO).
- Spatial distribution of fluoride and nitrate in groundwater and its associated human health risk assessment in residents living in Western Khorasan Razavi, Iran. Desalin. Water Treat.. 2019;170:176-186.
- [Google Scholar]
- Characteristics, water quality index and human health risk from nitrate and fluoride in Kakhk city and its rural areas, Iran. J. Food Compos. Anal.. 2023;115:104870
- [Google Scholar]
- Drinking water quality and arsenic health risk assessment in Sistan and Baluchestan, Southeastern Province, Iran. Hum. Ecol. Risk Assess.: Int. J.. 2018;25:949-965.
- [Google Scholar]
- Protocol for the estimation of drinking water quality index (DWQI) in water resources: artificial neural network (ANFIS) and Arc-Gis. MethodsX. 2019;6:1021-1029.
- [Google Scholar]
- Health risk assessment to fluoride and nitrate in drinking water of rural residents living in the Bardaskan city, arid region, southeastern Iran. Water Treat.. 2019;145:249-256.
- [Google Scholar]
- Appraisal of vulnerable zones of non-cancer-causing health risks associated with exposure of nitrate and fluoride in groundwater from a rural part of India. Environ. Res.. 2021;202:111674
- [Google Scholar]
- Hydrogeochemical processes affecting groundwater chemistry in the central part of the Guanzhong Basin, China. Arch. Environ. Contam. Toxicol.. 2021;80:74-91.
- [Google Scholar]
- Standard methods for the examination of water and wastewater. DC: American public health association Washington; 2012.
- Fluoride contamination of water in India and its impact on public health. ARC J. Foren. Sci.. 2018;3:10-15.
- [Google Scholar]
- Evaluation of water quality using water quality index (WQI) method and GIS in Aksu River (SW-Turkey) Sci. Total Environ.. 2017;584:131-144.
- [Google Scholar]
- Global sensitivity indices for nonlinear mathematical models and their Monte Carlo estimates. Math. Comput. Simul.. 2001;55:271-280.
- [Google Scholar]
- Assessing groundwater quality and health risks of nitrogen pollution in the Shenfu mining area of Shaanxi Province, northwest China. Exposure and health. 2018;10:77-97.
- [Google Scholar]
- Spatial distribution of quality of groundwater and probabilistic non-carcinogenic risk from a rural dry climatic region of South India. Environ. Geochem. Health. 2021;43:971-993.
- [Google Scholar]
- SUBBA RAO, N., SUNITHA, B., ADIMALLA, N. & CHAUDHARY, M. 2020. Quality criteria for groundwater use from a rural part of Wanaparthy District, Telangana State, India, through ionic spatial distribution (ISD), entropy water quality index (EWQI) and principal component analysis (PCA). Environmental geochemistry and health, 42, 579-599
- USEPA 1996. Integrated Risk Information System (IRIS) Database. EPA Washington, DC
- Occurrence, controlling factors and health risks of Cr6+ in groundwater in the Guanzhong Basin of China. Exposure and Health. 2021;14:239-251.
- [Google Scholar]
- Finding high-quality groundwater resources to reduce the hydatidosis incidence in the Shiqu County of Sichuan Province, China: analysis, assessment, and management. Exposure and Health. 2019;12:307-322.
- [Google Scholar]
- Water quality characteristics and health risk assessment of main water supply reservoirs in Taizhou City, East China. Hum. Ecol. Risk Assess.: Int. J.. 2021;27:2142-2160.
- [Google Scholar]
- Surface water quality and health risk assessment in Taizhou City, Zhejiang Province (China) Exposure and Health. 2021;14:1-16.
- [Google Scholar]
- Human health risk assessment of groundwater nitrogen pollution in Jinghui canal irrigation area of the loess region, northwest China. Environ. Earth Sci.. 2018;77:1-12.
- [Google Scholar]
- Health risk assessment of a reservoir-type water source in the northeastern region of China. Hum. Ecol. Risk Assess.: Int. J.. 2017;23:751-766.
- [Google Scholar]
- Groundwater quality evaluation and health risk assessment in the Yinchuan Region, Northwest China. Exposure and Health. 2016;8:443-456.
- [Google Scholar]
- Groundwater quality for potable and irrigation uses and associated health risk in southern part of Gu’an County, North China Plain. Environ. Geochem. Health. 2021;43:813-835.
- [Google Scholar]


