

Translate this page into:
Solid water at room temperature?
⁎Corresponding author. abha6@u.washington.edu (Abha Sharma),
-
Received: ,
Accepted: ,
This article was originally published by Elsevier and was migrated to Scientific Scholar after the change of Publisher.
Abstract
Previously, we have shown that water adjacent to many hydrophilic substances excludes colloidal and molecular solutes. It was labelled “exclusion zone” (EZ) or “fourth phase” water. A salient feature is its characteristic light absorbance at or near 270 nm. In this study, EZ water formed against three chemically distinct surfaces, Nafion, ghee, and Whatman-5 filter paper was extracted, characterized by UV–Visible absorbance spectroscopy, and solidified either by lyophilizing or evaporation in an oven. The resulting highly stable solid was dissolved in water and confirmed as EZ water by its characteristic absorbance at 270–280 nm. We used mass spectroscopy to verify the absence of ionizable contaminants that could reproduce the characteristic “signature EZ” spectra in the three liquid preparations, or in the solids formed from desiccated EZ water that had been reconstituted in deionized water. Hence, a solid form of EZ water may, indeed, exist at room temperature.
Keywords
Chemically distinct surfaces
Exclusion-zone water
Solid water at room temperature
UV–Visible absorbance spectroscopy
Mass-spectrometry

1 Introduction
Water is an ageless enigma. A major constituent of the earth’s hydrosphere, water is the only chemical substance known to exist naturally in three different physical states (Franks, 2000). Recently, a distinct fourth phase has been identified. This phase commonly forms when water meets hydrophilic interfaces. Termed “exclusion-zone” (EZ) water because it profoundly excludes colloidal and molecular solutes (Pollack, 2001, Zheng and Pollack., 2003, Zheng et al., 2006, Pollack, 2013, Ling, 2001), this phase commonly grows to several hundred micrometers and is detectable through a characteristic absorbance at a wavelength of approximately 270 nm.
EZs are commonly observed adjacent to strongly hydrophilic materials. Those materials include the polymer Nafion, as well as hydrogels such as polyethylene glycol, polyvinyl alcohol, polyacrylic acid, collagen, gelatin, starch, agar, agarose, Qelby, and cellulose (Zheng et al., 2006, Pollack, 2013, Li and Pollack, 2020, Sharma et al., 2017, Sulbara’n et al., 2014). More recently, we confirmed the presence of particularly large EZs adjacent to various health-promoting fats such as ghee (clarified butter) and coconut oil (Sharma and Pollack, 2020).
Recent studies have demonstrated that EZ water could be obtained in solid form at room temperature (Lo et al., 2009, Elia and Napoli, 2010, Elia et al., 2013, Elia et al., 2014, Elia et al., 2018, Elia et al., 2019). This was a surprising observation — a form of water existing in a solid phase at temperatures at which one would expect a liquid. We therefore strived to repeat and extend those experiments, not only to attempt to discover additional features, but also to test whether the solid EZ could have arisen from unsuspected contaminants.
To this end, we extracted the EZ waters formed against three chemically distinct surfaces - namely ghee, Nafion, and Whatman-5 filter paper. We then lyophilized those samples, which yielded white, crystalline, flaky powders. In addition, we investigated a less cumbersome production method: oven drying. Finally, we used mass spectrometry to address the question whether the characteristic absorption associated with EZ formation could have arisen artifactually from soluble or suspended compounds released from the different material surfaces required to nucleate EZ growth.
2 Experimental
2.1 Materials
Deionized (DI) water was obtained from a Barnstead D3750 Nanopure Diamond purification system (type 1 HPLC grade,18.2 MΩ, ThermoFisher Scientific, Waltham, MA, USA).
Ghee was acquired from Bulletproof (BP) ghee (grass-fed) (Seattle, WA, USA).
Whatman® qualitative filter paper, Grade 5 (Cat no. 1005–070; 70 mm diameter), caprylic acid (CAS: 124–07-2), decanoic acid (CAS: 334–48-5) and 4-benzene dodecylsulfonate (BDS) were obtained from Sigma Aldrich, MO, USA.
Nafion® tubing (TT-0030 Nafion, internal diameter 0.53 mm) was obtained from PermaPure LLC. Care was taken to wear sterile gloves while handling the tubing.
Disposable 20 ml borosilicate flat-bottomed clear glass scintillation vials were used for lyophilization and oven-drying.
2.2 Set-ups for obtaining various EZ waters
The method of collecting the EZ water adjacent to a ghee cylinder has been described (Sharma and Pollack, 2020). Here, we slightly modified that method to facilitate collection.
A small amount of ghee was scooped out of its container with a clean spatula, placed in a borosilicate-glass liquid-scintillation vial and allowed to melt in an oven set at 65 °C. 1 ml of liquid ghee was then carefully placed in a 20 ml borosilicate glass scintillation vial and allowed to set for 20 to 30 min in a refrigerator (4 °C). DI water was added carefully along the side of the vial, to a level 0.8 to 1 mm above the solid ghee. After 10 min, the overlaid water was aspirated carefully with a pipette and designated as “Ghee-EZ water,” although it inevitably contained some liquid water. Ghee-EZ, thus collected from several vials was pooled together to create one sample.
In the second method, involving filter paper, a fixed amount of DI water was passed through a quadrant-folded Whatman Qualitative Filter Paper, Grade 5 (stacked 1–4 in number), and collected in a 20-ml borosilicate glass scintillation vial. Samples were designated as “Whatman-5-EZ water.”.
In the third method, Nafion tubing was cut into 2-inch-long segments. One segment was manipulated with tweezers to be well submerged in 3 ml of DI water contained in a 35-mm × 10 mm Falcon® polystyrene petri dish. After 10 min, water immediately adjacent to the tubing was siphoned off with a 1 ml tuberculin syringe and 27G × 1/2″ BD PrecisionGlide needle into a fresh scintillation vial. We refer to that water as “Nafion-EZ.”.
All three waters thus collected were subjected to UV–Visible absorbance measurement, lyophilization, and/or oven drying.
2.3 UV–Visible absorbance spectroscopy
We used a Cary UV–vis-NIR 5000 model and followed the manual instructions.
The three types of water samples were tested for their EZ content by UV–Visible absorbance spectroscopy, scanning in the wavelength range of 200 to 350 nm. Several independent measurements were made for each type of EZ water. Also, the samples were tested for their characteristic absorbance before lyophilizing or oven-drying.
2.4 Drying studies
2.4.1 Lyophilization
Defined volumes (5–10 ml) of the samples obtained from each of the three different sources were dispensed into borosilicate glass scintillation vials and frozen overnight at −80 °C. They were then lyophilized using a Labconco FreeZone 2.5 L lyophilizer.
Designated as “L-Ghee-EZ”, “L-Whatman-5-EZ”, and “L-Nafion-EZ”, the resulting white powdery, flaky solids were stored in their original vials at room temperature for further analysis.
2.4.2 Oven drying
Defined volumes of the liquid EZ samples obtained from each of the three different sources were distributed in uncapped borosilicate glass scintillation glass vials. Drying (2–3 ml) was carried out in an oven (Precision Scientific Instruments, Inc, India) set at 65.5 °C for 18–20 h.
Designated as “OD-Ghee-EZ”, “OD-Whatman-5-EZ”, and “OD-Nafion-EZ”, the oven-dried residues were stored in the vials themselves at room temperature for further analysis.
2.5 UV–Visible absorbance spectroscopy of the re-constituted solid forms
The contents of each lyophilized or oven-dried vial were reconstituted in DI water, and once again tested for their EZ content by UV–Visible absorbance spectroscopy using a Cary UV–Vis-NIR 5000 spectrometer as per manual instructions.
2.6 Mass-spectrometry studies
2.6.1 Preparation of octanoic acid, decanoic and benzene sulphonic acids
2.6.1.1 Octanoic acid
Octanoic acid (caprylic acid) is a straight-chain saturated medium-chain (C8) fatty acid. Octanoic acid was first dissolved in acetonitrile at a concentration of 1 % prior to serial dilutions in DI water to generate caprylic acid standards for UV–Visible absorbance measurements and mass spectrometric analysis at concentrations varying from 0.7 nM to 0.7 mM.
2.6.1.2 Decanoic acid
Decanoic acid (solubility: 100 mg/ml in methanol), also known as capric acid, is a medium-chain (C10), straight-chain saturated fatty acid. A 1 M solution was made in 100 % ethanol. Further dilutions were made with DI water for generating decanoic acid standards for UV–Visible absorbance measurements and mass spectrometric analysis, varying in concentration from 0.01 to 10 µM.
2.6.1.3 4-Dodecylbenzenesulphonic acid
Benzenesulfonic acid (BZS), an organosulfur compound, is a brown to very dark brown viscous liquid. It was suitably diluted to make a range of concentrations ranging from 1 to 10 µM.
2.6.2 Setup for sample injection
Aliquots from the samples prepared as described above were directly infused into a Thermo Linear Trap Quadropole-Orbitrap [FT (OT)] tandem hybrid mass spectrometer with an Electrospray ionization (ESI) source, using a syringe pump. Samples were analyzed directly (without dilution or additives) in both positive (ESI + ) and negative (ESI -) ion modes to detect unique masses with a mass to charge ratio (m/z) ranging from 50 to 1000, at a resolving power of 100,000. In the positive ion mode, the capillary voltage was 25 V and tube lens voltage was 100 V, while in the negative ion mode, the capillary voltage was −15 V and the tube lens voltage was −100 V. The capillary temperature was 350 °C. All samples were introduced into the ESI source at a flow rate of 50 μL min−1 using a syringe pump. The system was flushed by infusing 1 ml of water in between samples to eliminate carry-over.
3 Results
3.1 UV–Visible absorption spectroscopy of EZ waters
In addition to the standard test for EZ presence based on microsphere exclusion (data not presented here), we tested samples for EZ presence by their signature absorbance within the 250–300 nm range. The first sample was the water adjacent to ghee, which was placed in a UV–Visible spectrometer cuvette. It displayed a broad peak in the vicinity of 280 nm, indicating EZ content (Fig. 1a). No such peak was found in DI water.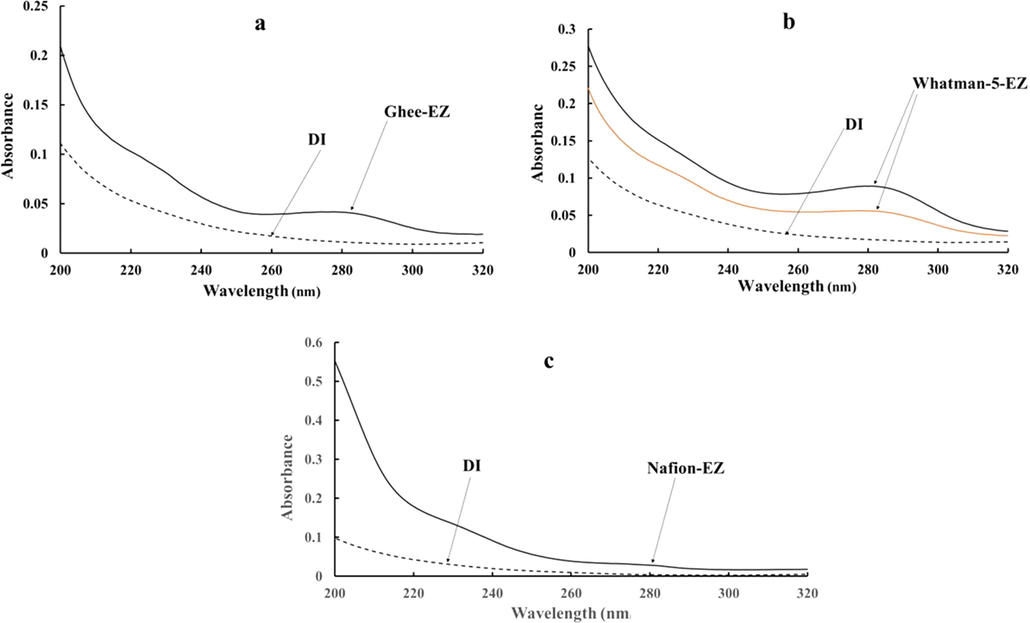
Representative absorbance spectra. (a): Ghee-EZ; (b) Whatman-5-EZ collected by filtering DI water through one (red) or two (black) filters; and (c) Nafion-EZ water. Dashed curve ( − − −) represents the absorbance spectra of DI water. Data representative of ∼ 15 independent measurements for each condition.
A similar peak was observed in water samples obtained by filtering DI through Whatman-5 paper filter (Fig. 1b). A noteworthy feature here was the increase of the EZ-related peak, by almost two times, when the DI water had been passed through two nested Whatman-5 filters compared to only one (Fig. 1b). In general, peak size increased with increasing numbers of nested filters (data not shown).
A peak was also present, though considerably weaker, in the Nafion samples (Fig. 1c). We surmise that the weakness may have arisen from the technical challenges involved with obtaining concentrated EZ water from around the tubular geometry of Nafion.
The data above confirm the presence of EZ water in each of the samples extracted.
3.2 Lyophilized vs oven-dried residues
Lyophilization of all three types of EZ-water-containing samples resulted in white, crystalline, flaky powders at room temperature, similar to that reported by others (Lo et al., 2009, Elia and Napoli, 2010, Elia et al., 2013, Elia et al., 2014, Elia et al., 2018, Elia et al., 2019).
When solubilized in DI water, both the lyophilized water and the oven-dried residue displayed similar UV–Visible spectral patterns, with an absorption maximum around 280 nm (Fig. 2a-c). No such peak could be detected in control samples of DI water that had been similarly lyophilized or oven-dried, and then rehydrated (Fig. 2d). These observations imply that the spectral properties of the samples were not altered by either lyophilization or drying. Studies conducted on fish protein hydrolysate by other researchers have similarly concluded that UV absorption spectral features are not altered by the particular mode of drying (Elavarasan and Shamasundar, 2016).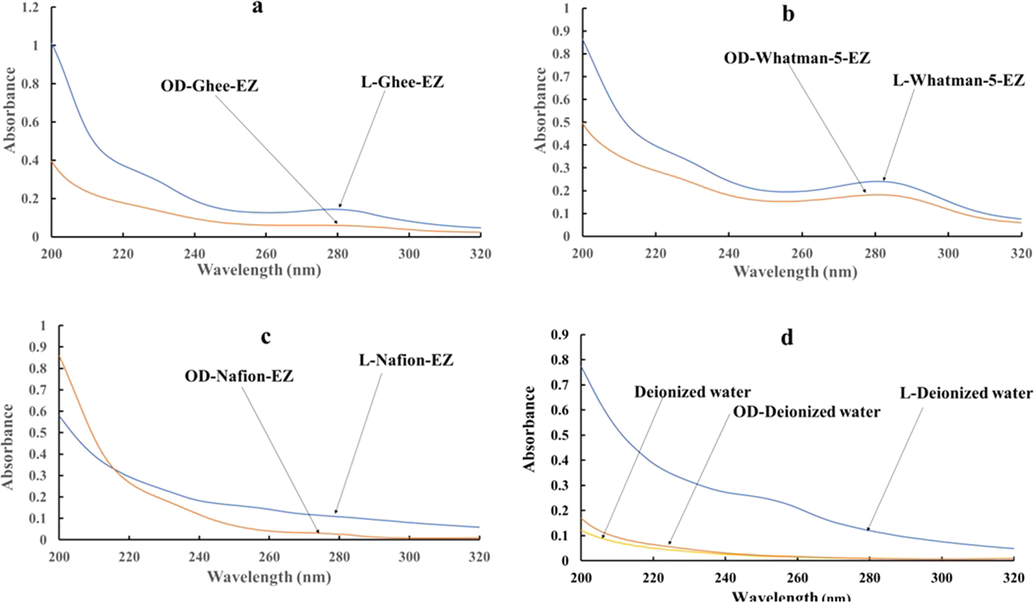
UV–Visible absorbance spectra of lyophilized (blue) vs oven-dried (orange) residues reconstituted in DI water. (a) l-Ghee-EZ vs OD-Ghee-EZ; (b) l-Whatman-5-EZ vs OD-Whatman-5-EZ. (c) l-Nafion-EZ vs OD-Nafion-EZ. (d) L-Deionized water vs OD-Deionized water vs DI water (yellow curve).
3.3 Mass spectrometric analysis
To ascertain the possible presence of contaminants that might contribute to the unique absorbance spectra of EZ samples, we employed direct-infusion electrospray ionization mass spectrometry (ESI-MS) to capture ionizable compounds that can form either positive or negative ions.
Samples were directly infused into the mass spectrometer to reduce unnecessary loss of solutes and to minimize contact with tubing and container surfaces that could possibly absorb or release compounds into the water. Nevertheless, low levels of background contamination can result from incomplete water purification or surface leaching. Contaminants can also be introduced during the process of drying water samples (e.g., dust in the oven or aerosols from the lyophilizer). To control for contamination introduced through the drying process, the DI water used to prepare and reconstitute dried EZ samples was also subjected to similar drying and reconstitution protocols.
Mass-spectrometric profiles of the putative EZ waters derived from samples of Nafion, ghee, or Whatman filter paper, were similar to those obtained from equivalent samples that had been lyophilized or oven-dried and then resuspended in DI water. Although the signals in the resuspended samples were enhanced, we observed no substantive differences in the spectra from resuspended lyophilized and oven-dried samples.
Samples were measured in both positive and negative ion modes. This permitted detection of ionizable contaminant compounds with a mass-to-charge ratio (m/z) of 50–1000 as either positive or negative ions. We also assessed the overall level of impurities by comparing the total ion current (TIC), which is the sum of all m/z values above the instrument’s background noise, for the three types of EZ water vs that of DI water (Fig. 3). As can be seen in Fig. 3, the TIC values in the positive ion mode were higher in general than in the negative ion mode, which reflects that there are more analytes present that can accept a proton than can donate a proton. Differences in contamination between oven-dried and lyophilized samples were minimal, hence subsequent experiments focused on oven-dried samples.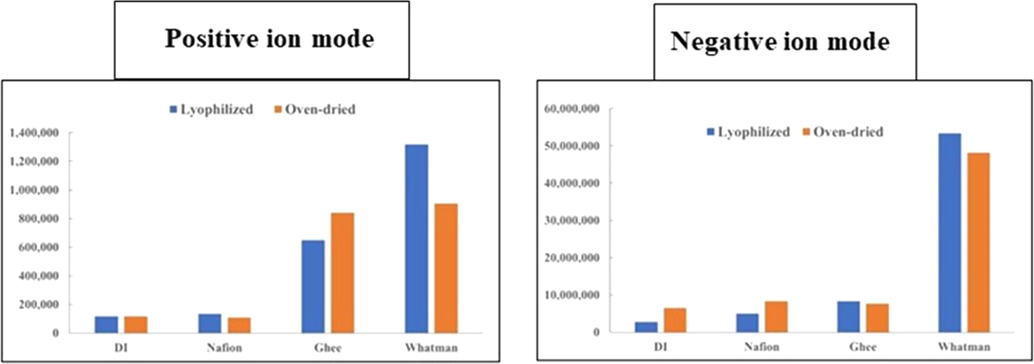
Comparison of total ion current (TIC) of oven-dried and reconstituted Nafion, ghee and Whatman-5-EZ water samples and DI water controls, measured with ESI-Mass spectrometry in both positive and negative ion mode. Total ion current is the sum of the absolute intensities of all m/z in each sample. The data presented come from one experiment in which the four sample types were compared in the same analysis set. Subsequently, EZ water samples were tested individually in multiple experiments. The results were positively replicated, although the magnitude of the elevated Whatman-5-EZ TIC was variable.
Irrespective of whether the TIC measurements were made in positive or negative ion mode, we found no significant differences in the level of contaminants between dried and reconstituted Nafion-EZ and DI samples. Furthermore, in the Nafion samples, no unique masses were detected that were not already detected in DI water. Although lyophilized and reconstituted samples had higher absorbance than oven-dried counterparts, as can be seen in Fig. 2, this did not appear to be linked to TIC values (Fig. 3). Also, regardless of the contaminants identified in other EZ samples, the Nafion-EZ MS data implies that the unique absorbance feature at 270/280 nm in Nafion-EZ does not arise from any ionizable contaminant.
On the other hand, for both the dried and reconstituted Ghee-EZ and Whatman-EZ samples, the TIC values were considerably elevated (Fig. 3). Hence, our next goal was to determine the nature and possible origin of the ions that predominated in those samples.
Dried and reconstituted Ghee-EZ displayed several-fold higher TIC than DI water irrespective of whether measurements were made in the negative or positive ion mode. The bulk of the elevated TIC in these samples consisted of ions corresponding to short and medium chain fatty acids with m/z of 143, 171, 185, 199, 215, 227, as seen in Fig. 4. Of these, the m/z values of 171, corresponding to decanoic acid, was observed most consistently and prominently in all Ghee-EZ samples. Accordingly, in the positive ion mode, the sodiated adduct of decanoic acid (m/z = 195) was the predominant ion across all Ghee-EZ samples.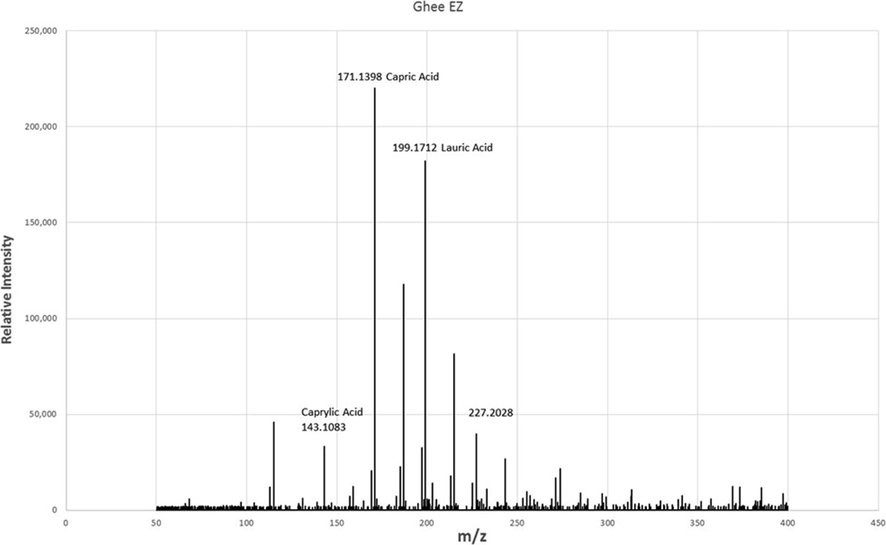
Representative ESI (-) spectra from the dried and reconstituted Ghee-EZ sample from Fig. 3 revealing the presence of fatty acids. In three other preparations of dried and reconstituted Ghee-EZ, the relative abundance of the other fatty acids varied but decanoic acid was consistently prominent in all samples.
To assess the approximate concentration of fatty acids in the dried and reconstituted Ghee-EZ samples, we compared spectra of fatty acids known to exist in ghee (decanoic and octanoic acid) with those of the Ghee-EZ samples. Based on the magnitude of signals generated in dried and reconstituted Ghee-EZ compared to those from successive dilutions of octanoic or decanoic acid external standards, we estimated the maximum concentration of fatty acids in Ghee-EZ to be 10 µM. In parallel experiments, a series of prepared concentrations of decanoic and octanoic acid in DI water were examined for their absorbance spectra in the UV–Visible wavelength range. Even at millimolar concentrations, there was no absorption peak at 270/280 nm (see Fig. 5 a & b), indicating that these two fatty acids could not be responsible for the characteristic EZ absorbance peak.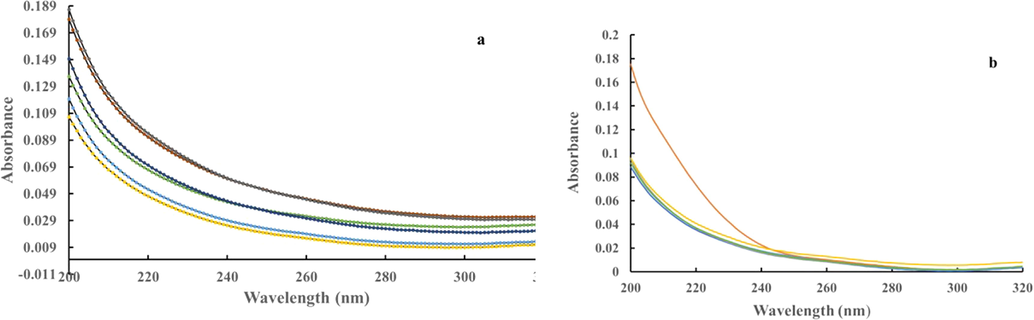
a: Representative absorbance spectra of decanoic acid. 1 M decanoic acid in 100 % ethanol was diluted in DI water to concentrations ranging from 0.01 to 10 µM (yellow: 0.01 µM; light blue: 0.1 µM; green: 1 µM; dark blue: 2 µM; brown: 5 µM; grey: 10 µM). b: Representative absorbance spectra of octanoic acid. Octanoic acid was first dissolved in acetonitrile at a concentration of 1 % prior to serial dilutions in nanopure water to generate the indicated concentrations, varying from 0.7 nM to 0.7 mM and compared with that of DI water (brown: 0.7 nM; dark blue: 7 nM; green: 70 nM; blue: 7 µM; yellow: 0.7 mM).
The highest TIC values in both negative and positive ion mode were found in dried, reconstituted Whatman-5-EZ samples (Figs. 6 and 7), thereby indicating the highest level of contamination amongst the three types of EZ water. While the magnitude of the TIC varied up to tenfold among Whatman samples, the MS spectra revealed consistent patterns. We found that the negative ion spectra matched that of BZS (Fig. 6), a common surfactant, while the positive ion spectra (Fig. 8) revealed the presence of oligosaccharides, which might arise from the paper itself either through contamination or from a minor degree of degradation since paper is composed of oligosaccharides.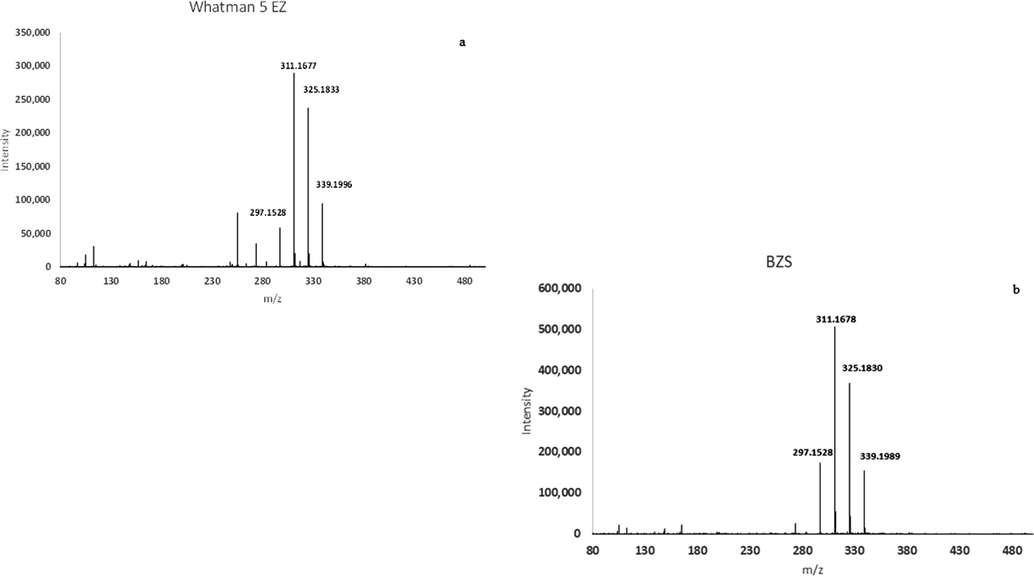
Representative ESI (-) spectra of Whatman-5-EZ (a) compared to 5 µM benzene sulfonic acid (b).
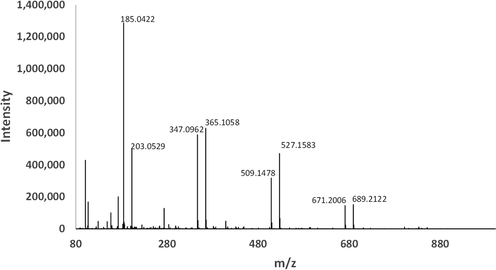
Representative ESI(+) spectra of Whatman-5-EZ, revealing the presence of sodiated adducts (M+Na+) of oligosaccharides. Na + adducts are notoriously resistant to dissociation. Thus, it is unlikely that these ions are fragments of heavier ions.
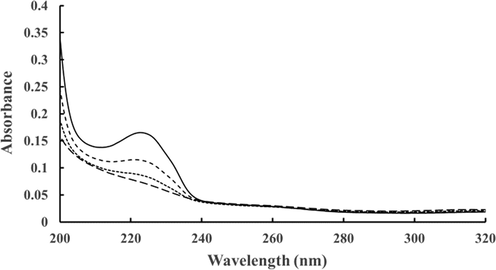
Representative absorbance spectra of different concentrations of benzenesulphonic acid diluted in DI water to concentrations ranging from 1 to 10 µM (long dash: 1 µM; square dot: 2 µM; dashed: 5 µM; solid: 10 µM). No peak appears at 270/280 nm.
The most prominent ion in the negative ion spectra from Whatman-5-EZ had a m/z value of 311.167 (Fig. 6). To identify whether the corresponding mass was indeed BZS, MS/MS analysis of both Whatman-5-EZ and BZS samples was performed using collision energies of either 30 or 40 V. We found that the daughter fragment generated from either sample had the same mass (183).
Since benzene sulfonates appeared to be the major contaminant contributing to elevated negative ion TIC in the Whatman-5-EZ samples, we measured the absorbance spectra of multiple dilutions of BZS to assess the possibility that this contaminant might contribute to the 270/280 nm absorbance peak. BZS absorbance was elevated throughout the UV range, but without the characteristic 270/280 peak at any concentration tested up to 10 µM (Fig. 8). Furthermore, the Whatman-5-EZ samples with the greatest absorbance at 270/280 nm were not the samples with the highest TIC, suggesting that the contaminants observed with MS were not responsible for the 270/280 nm absorbance peak in Whatman-5-EZ samples.
In conclusion, we find that the three types of EZ water have low levels of qualitatively different contaminants that correspond to the chemical nature of materials used to generate the EZ water. However, none of these observed contaminants could account for the unique absorbance at 270/280 nm characteristic of EZ water. Also, we could not detect any common contaminant in all three types of EZ water that could explain its unique physico-chemical properties.
4 Discussion
The aim of this study was to corroborate the existence of EZ water in solid form at room temperature, i.e., a solid form of water existing under ambient conditions. We used each of three chemically distinct surfaces to nucleate the growth of EZ water: ghee, Nafion, and Whatman-5 filter paper. The EZ water was then lyophilized or oven dried, and the characteristics of the resulting solids were explored.
We are not the first to have studied solid EZ water at room temperature. Elia and colleagues have explored a range of lyophilized solids obtained from various water sources. Those sources included iteratively Nafionated water, extremely diluted solutions (EDS) of homeopathic medicines, and iteratively perturbed water that had come into contact with either hydrophilic cellulose paper filters, cellophane, or cotton (Elia and Napoli, 2010, Elia et al., 2013, Elia et al., 2014, Elia et al., 2018, Elia et al., 2019). In each case, the lyophilized solid was compared to that obtained by eliminating bulk water through evaporation, either at room temperature or at high temperatures.
Here, we have extended the studies of Elia and colleagues by employing UV–Visible absorbance and mass spectroscopy to analyze the waters in contact with various EZ-nucleating surfaces (Zheng and Pollack, 2003, Zheng et al., 2006, Pollack, 2013, Sulbara’n et al., 2014, Sharma and Pollack, 2020). An important point to emphasize, however, is that those waters were not pure EZ. The methodology did not enable us to completely separate EZ from bulk water, the latter being inevitably present in modest amounts. To quantify the relative amounts, we measured the absorbance at 270/280 nm (Zheng et al., 2006). Thus, each collected liquid sample was checked for EZ content before proceeding to the next step of obtaining the solid forms.
For transforming the liquids to the solid form, we employed two independent methods: lyophilization and oven drying. Lyophilization is a standard procedure. Oven drying was less cumbersome. For 2–3 ml sample volumes, a temperature of 65.5 °C for a duration of 18–20 h was evidently sufficient to achieve full evaporation.
In either case, the resulting EZ residue was soluble in DI water. Once solubilized, we could confirm again by UV–Visible absorbance measurements (Pollack, 2013), that the liquid contained EZ water. Hence, the drying process did not impact the spectral properties of the resuspended solid. A similar conclusion was drawn when investigating antioxidant and functional properties of fish-protein hydrolysates produced by the same two methods, oven drying and freeze drying (Elavarasan and Shamasundar, 2016). The oven-drying process could be employed without significant changes in physicochemical properties.
An issue is whether all of these results could be the consequence of some kind of contamination. Possibly, the solid residue, and/or the 270/280 nm absorbance of the rehydrated samples, could have arisen from the presence of some unsuspected contaminant. To check these possibilities, we used mass spectrometry.
Electrospray-ionization mass spectroscopy (ESI-MS) is a sensitive method that can be used to detect, identify, and, under the proper circumstances quantitate ions in solutions, although it cannot detect compounds that do not ionize. While a negative result using ESI-MS cannot totally rule out all possibility of contamination, it is a significant first step in doing so. We scanned for all compounds with a mass to charge (m/z) ratio of 50–1000, which encompassed a broad range of molecules. Many compounds can form both positive and negative ions, but some will only form one or the other. Hence, we scanned for compounds in both negative and positive ion mode to look for possible contaminants that could account for the characteristic absorbance at 270/280 nm.
In two of our preparations we were able to detect compounds that were not present in DI water, compounds that appeared to arise from the materials used to generate the EZ. Samples of Ghee-EZ, for example, contained low levels of fatty acids known to be present in ghee. However, when we tested the absorbance spectra of a range of concentrations of two of the more abundant fatty acids dissolved in DI water, we found no resemblance to the spectra of Ghee-EZ. Hence, those compounds could not account for the unique absorbance at 270/280 nm.
Similarly, distinctive contaminants ascribed to BZS, a common surfactant, were found in Whatman-5-EZ samples. Once again, however, the absorption spectra of BZS dissolved in DI water did not reveal any peak corresponding to that displayed by Whatman-5-EZ. While the presence of the detected contaminants in Whatman-5-EZ and Ghee-EZ likely contribute to the residue observed following lyophilization or oven drying, they cannot explain the absorbance peak at 270/280 nm.
On the other hand, Nafion-EZ appeared to be the purest of the three preparations tested, with no unique masses detected by ESI-MS that were not already present in the suspending water. Thus, we were unable to detect anything in Nafion-EZ that could explain the unique absorbance at 270/280 nm.
Combined, these data support the conclusion that the unique absorbance in all three preparations of EZ water cannot be explained by the presence of ionizable contaminants.
A relevant issue is the practical consequence of solid EZ water at room temperature. What applications might that phenomenon enable? One possibility is a substitute for liquid crystalline EZ water. In distant places lacking convenient sources of potable water, it may be possible to augment hydration by swallowing the more easily transportable solid water. One convenient source may be the solid EZ obtained from the region next to (edible) ghee, although other sources may be possible.
Another potential application may be the imparting of information (Montagnier et al., 2009, Foletti et al., 2012). EZ water is ordinarily a liquid crystal. Crystals, such as those of silicon, are routinely used to store information. One can imagine imparting therapeutic information into EZ water, converting it to solid EZ, storing the solid EZ inside a capsule, and swallowing such when the therapeutic need arises. Of course, the practicality of any such endeavor, including the survival of information following drying and reconstitution, would need to be evaluated extensively in further studies.
We ordinarily think that water-based solids exist only in the form of ice, typically forming at or below 0 °C or 32 °F. The studies above provide evidence that they can exist also at room temperature and do not appear to be a contamination artifact. Thus, a solid form of water appears to exist at room temperature.
5 Conclusions
In this paper, we provide evidence for the genuine existence of EZ water in solid form at room temperature. Three chemically distinct surfaces- ghee, Nafion, and Whatman-5 filter paper were used to nucleate the growth of EZ water, which was then solidified by lyophilization or oven-drying. The resulting highly stable solids were each dissolved in water and confirmed to contain EZ water by their “signature absorbance” at wavelengths of 270–280 nm. Through use of mass spectrometry, we could further verify the genuine existence of EZ water by confirming the absence of any ionizable contaminants that could have reproduced the characteristic EZ spectra. This analysis was carried out both in the original liquid preparations as well as in the solids that had been reconstituted in deionized water; absence was confirmed in both. Taken together, the results lead us to conclude that a solid form of water at room temperature is not the result of some identifiable experimental artifact. A solid form of water does appear to exist at room temperature.
CRediT authorship contribution statement
Abha Sharma: Methodology, Project administration, Writing – review & editing, Writing – original draft. Alexis Traynor-Kaplan: Writing – review & editing, Writing – original draft. Gerald H. Pollack: Conceptualization, Funding acquisition, Project administration, Resources, Supervision, Writing – review & editing.
Acknowledgements
The authors are grateful to Kurt Kung, Zheng Li and Laura Colton for overall help in the lab. A.S. is thankful to R. Sharma for continuous encouragement, and to Ryan Stemen, Abhishek Sharma and Ashish Verma for their helpful questions and discussions.
Funding
This work was supported by the SAGST Foundation, and by private support.
Declaration of Competing Interest
The authors declare that they have no known competing financial interests or personal relationships that could have appeared to influence the work reported in this paper.
References
- Effect of oven drying and freeze drying on the antioxidant and functional properties of protein hydrolysates derived from freshwater fish (Cirrhinus mrigala) using papain enzyme. J. Food Sci. Technol.. 2016;53:1303-1311.
- [CrossRef] [Google Scholar]
- Dissipative structures in extremely diluted solutions of homeopathic medicines: a molecular model based on physico-chemical and gravimetric evidences. Int. J. Des. Nat. Ecodyn.. 2010;5:39-48.
- [CrossRef] [Google Scholar]
- Experimental evidence of stable aggregates of water at room temperature and normal pressure after iterative contact with a Nafion® polymer membrane. Water. 2013;5:16-26.
- [CrossRef] [Google Scholar]
- Experimental evidence of stable water nanostructures in extremely dilute solutions, at standard pressure and temperature. Homeopathy. 2014;103:44-50.
- [CrossRef] [Google Scholar]
- Experimental study of physicochemical changes in water by iterative contact with hydrophilic polymers: a comparison between cellulose and Nafion. J. Mol. Liq.. 2018;268:598-609.
- [CrossRef] [Google Scholar]
- New chemical-physical properties of water after iterative procedure using hydrophilic polymers: the case of paper filter. J. Mol. Lipids. 2019;296:1-7.
- [CrossRef] [Google Scholar]
- Experimental finding on the electromagnetic information transfer of specific molecular signals mediated through the aqueous system on two human cellular models. J. Altern. Complement. Med.. 2012;18:258-261.
- [CrossRef] [Google Scholar]
- Water: A Matrix of Life (2nd edition). Cambridge: RSC Paperbacks; 2000.
- Surface-induced flow: a natural microscopic engine using infrared energy as fuel. Sci. Adv.. 2020;6
- [CrossRef] [Google Scholar]
- Life at the Cell and Below-Cell Level: The Hidden History of a Fundamental Revolution in Biology (1st ed). Melville, New York: Pacific Press; 2001.
- Evidence for the existence of stable-water-clusters at room temperature and normal pressure. Phys. Lett. A. 2009;373:3872-3876.
- [CrossRef] [Google Scholar]
- Electromagnetic signals are produced by aqueous nanostructures derived from bacterial DNA sequences. Interdiscip. Sci.. 2009;1:81-90.
- [CrossRef] [Google Scholar]
- Cells, Gels and the Engines of Life; a new unifying approach to cell function. Seattle, WA: Ebner & Sons; 2001.
- The Fourth Phase of Water; Beyond Solid, Liquid, and Vapor. Seattle, WA: Ebner & Sons; 2013.
- Sharma, A., Pollack, G.H., 2020. Healthy Fats and Exclusion-Zone Size, Food Chemistry 316, http://doi:10.1016/j.foodchem.2020.126305.
- Qelby®-induced enhancement of exclusion zone build up and seed germination. Adv. Mater. Sci. Eng. 2017
- [CrossRef] [Google Scholar]
- Sulbarán, B., Toriz, G., Allan, G.G., Pollack, G.H., Delgado, E., 2014. The dynamic development of exclusion zones on cellulosic surfaces, Cellulose 21, 1143–1148. http://dx.doi.org/10.1007/s10570-014-0165-y.
- Long-range forces extending from polymer-gel surfaces. Phys. Rev. E. 2003;68:031408
- [CrossRef] [Google Scholar]
- Surfaces and interfacial water: evidence that hydrophilic surfaces have long-range impact. Adv. Colloid Interface Sci.. 2006;127:19-27.
- [CrossRef] [Google Scholar]


