

Translate this page into:
Solubilities and solubility products of clomipramine hydrochloride ion-associates with tetraphenylborate and silicotungstate
⁎Corresponding author. Tel.: +20 2 01005600793. yousrymi@yahoo.com (Yousry M. Issa)
-
Received: ,
Accepted: ,
This article was originally published by Elsevier and was migrated to Scientific Scholar after the change of Publisher.
Peer review under responsibility of King Saud University.
Abstract
The solubility and solubility product of the two ion-associates clomipraminium tetraphenylborate (CLP-TPB) and silicotungstate ((CLP)4-ST) were determined using conductimetric and potentiometric measurements applying the standard addition method. The obtained values from both conductimetric measurements and standard addition method are close to each other. Thermodynamic parameters ΔG, ΔH and ΔS have been determined. Sodium tetraphenylborate has been used for the determination of CLP.Cl in model solution and pharmaceutical preparation by conductimetric titrations. The proposed method allowed the determination of CLP.Cl within the range of 0.17–35.15 mg. The accuracy of the method is indicated by the excellent recovery 99.95–101.23%, and the precision is supported by the low relative standard deviation 0.50–1.21%. The ruggedness and robustness of the proposed method were also studied.
Keywords
Solubility
Solubility product
Clomipramine hydrochloride
Conductimetric titration
Sodium tetraphenylborate
Silicotungstic acid

1 Introduction
Clomipramine hydrochloride (CLP.Cl), 3-(3-chloro-10,11-dihydro-5H-dibenzo[b,f]-azepin-5-yl)-N,N-dimethylpropan-1-amine hydrochloride, molar mass 351.3 g mol−1, Scheme 1, is a tricyclic antidepressant (British Pharmacopoeia, 2014). It is a psychiatric medication used to treat and relief symptoms of depressive, obsessive–compulsive disorders (Greist et al., 1995) by correcting chemical imbalances of neurotransmitters in the brain.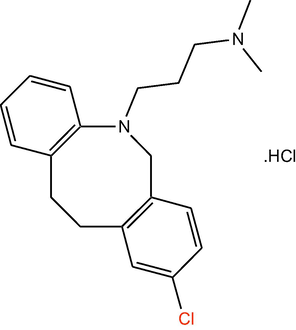
Chemical structure of clomipramine hydrochloride.
Several methods have been reported for the determination of CLP.Cl including HPLC (Frahnert et al., 2003; Malfará et al., 2007), gas chromatography (Kristinsson, 1981; Nevado et al., 2000), liquid chromatography–mass spectrometry (Shinozuka et al., 2006), gas chromatography–mass spectrometry (Papoutsis et al., 2012), spectrophotometry (Mohamed et al., 2003; Lakshmi, 2013), chemiluminescence (Marques et al., 2004; Ji et al., 2011), spectrofluorimetry (Rahman and Afaq, 2010; Kaur and Malik, 2013), capillary zone electrophoresis (Flores et al., 2004; Kou et al., 2004) and potentiometry (Ortuño et al., 2006; Faridbod, 2012). No previously reported studies are concerned with determination of solubilities and solubility products of its ion-associates and its determination using conductimetry. Consequently, we studied the solubility and solubility products of clomipramine hydrochloride ion-associates with tetraphenylborate and silicotungstate and proposed a new conductimetric titration method for its determination using sodium tetraphenylborate (NaTPB).
2 Experimental
2.1 Apparatus
A conductivity meter model Orion S/N 28849, Inc., USA, provided with a dip-type cell, Kcell = 1.0 was used for electrical conductance measurement. The meter is connected with a thermocouple for temperature measurement. The desired temperature was maintained with circulating water bath thermostat connected to a jacket around the analysis vessel.
The potentiometric measurements were carried out with a Jenway 3010 digital pH/mV meter. A saturated calomel electrode (SCE) was used as the external reference.
2.2 Materials and reagents
All reagents used were of chemically pure grade. Bidistilled water was used throughout the experiments. CLP.Cl and its pharmaceutical preparations Anafranil® tablets (25 and 50 mg/tablet) were provided by NOVARTIS PHARMA S.A.E., Cairo, Egypt. Sodium tetraphenyl borate (NaTPB) Na[C24H20B], silicotungstic acid (STA) (H4[W12SiO40]), o-nitrophenyl phenyl ether (ONPPE) and graphite powder were obtained from Sigma-Aldrich, USA.
2.3 Preparation of solutions
1.0 × 10⁻² mol L−1 standard solutions of CLP.Cl, NaTPB and STA were prepared by dissolving 0.3513, 0.3422 and 2.8783 g in 100 mL bidistilled water, respectively. Working solutions of lower concentration were prepared by accurate dilution of the standard with the same solvent.
2.4 Preparation of the ion-associates
Clomipraminium-tetraphenylborate (CLP-TPB) and silicotungstate ((CLP)4-ST) were prepared by mixing 50 mL of 1.0 × 10⁻² mol L−1 CLP.Cl with 50 mL of 1.0 × 10⁻² mol L−1 NaTPB or 2.5 × 10⁻³ mol L−1 STA. To assure complete coagulation, the resulting precipitates were left in contact with their mother liquor overnight. The precipitates were then filtered, washed thoroughly with bidistilled water, left at room temperature till complete dryness and then ground to fine powders.
2.5 Procedure for determination of CLP ion associates ratio
50 mL of 1.0 × 10⁻³ mol L−1 NaTPB or STA was transferred quantitatively to a conductimetric titration cell, and then the solution was titrated against 1.0 × 10⁻² mol L−1 CLP.Cl delivered from a micro-burette. The conductance was measured subsequent to each addition of CLP.Cl solution. The later was corrected for dilution by means of Eq. (1), assuming that conductivity is a linear function of dilution:
A graph of corrected conductivity versus the added titrant volume was constructed. The CLP-titrant stoichiometric ratio was then determined from the intercept of the two linear segments of the graph.
2.6 Determination of the solubility products of the ion-associates
For this purpose, 0.1 g of both CLP-TPB and (CLP)4-ST was completed to 50 mL bidistilled water and shaken for 24 h. The solubility of both of them was determined using the conductimetric measurements and the standard addition method.
As the standard addition method was applied in the determination of very low concentrations, the low CLP+ concentration (solubility) was determined using a previously prepared chemically modified carbon paste electrode; (2% CLP-TPB, 49% o-NPPE and 49% graphite powder) with a slope value 60.53 ± 0.14 mV decade−1, Linear range of 3.74 × 10⁻⁶–1.00 × 10⁻² mol L−1 and Limit of detection of 2.70 × 10⁻⁶ mol L−1 (Issa et al., 2014). For this purpose, a known incremental change is made through the addition of different volumes of 1.0 × 10⁻² mol L−1 CLP.Cl standard solution to 50 mL of the above prepared saturated solution. The change in the mV-reading was recorded for each volume and used to calculate CLP+ concentration in the saturated solution using Eq. (2) (Baumann, 1968):
For conductimetric measurements, dilute solutions (1 × 10⁻⁶, 2.5 × 10⁻⁶, 5.0 × 10⁻⁶, 7.5 × 10⁻⁶ and 1.0 × 10⁻⁵ mol L−1) of CLP.Cl, NaTPB and STA were prepared. The conductivity of these solutions was measured at 25 °C and the specific conductivities (ks) were calculated and used to obtain the equivalent conductivities (λ) of these solutions. Straight line plots of λ versus were constructed.
2.7 Determination of thermodynamic parameters of CLP ion-associates
The solubility of these ion-associates was determined at different temperatures (298, 303, 313, 323, 333 and 343 K). The thermodynamic parameters (ΔH, ΔG and ΔS) were thus calculated. The free energy of dissolution (ΔG) can be calculated by Eq. (3):
The values of ΔH and ΔS were calculated from Eq. (4).
By the substitution of Eqs. (3) and (4) in Eq. (5), we can get a linear relation between ln Ksp and 1/T (K−1) to determine the entropy and enthalpy changes.
2.8 Studying the best conditions for conductimetric titrations
In this study, 50 mL of 1.0 × 10⁻³ mol L−1 CLP.Cl was titrated conductmetrically against NaTPB using different solvents (H2O, ethanol, methanol and acetone), different titrant concentrations (1.0 × 10⁻³, 5.0 × 10⁻³ and 1.0 × 10⁻² mol L−1 NaTPB) and at different temperatures, (25–60 °C), to study the effect of changing these factors on the sharpness of the end point. The conductance was measured subsequent to each addition of the titrant. The conductance was corrected for dilution by means of Eq. (6) and plotted versus the volume of the added titrant.
A graph of corrected conductivity versus the added titrant volume was constructed. The titrand–titrant stoichiometric ratio is then determined from the intercept of the two linear segments of the graph.
2.9 Conductimetric analysis of CLP.Cl
A volume containing different amounts of CLP.Cl was transferred into a 50 mL measuring flask and made up to the mark with bidistilled water. The content of the volumetric flask was transferred to the titration cell. 1.0 × 10⁻³ or 1.0 × 10⁻² mol L−1 NaTPB was added from a microburette in small increments and the conductance was measured subsequent to each addition of the reagent solution after stirring. The conductance readings were corrected for dilution by means of Eq. (6).
2.10 Analysis of tablets
For analysis of tablets, 10 tablets were weighed and powdered, and an accurately weighed portion was mixed with 25 mL of bidistilled water, shaken in a mechanical shaker for about 30 min and filtered into a 50 mL volumetric flask. The solution was completed to the mark with bidistilled water and shaken. Different volumes of the solution were taken and titrated conductimetrically against NaTPB.
3 Results and discussion
3.1 The stoichiometry of CLP ion-associates
The molar ratio was calculated for each increment of CLP.Cl and plotted against the corrected conductance values, Fig.1. The obtained titration graphs are more or less smooth-straight lines with breaks at definite molecular ratios corresponding to the composition of the formed species in the solution. A general behavior of the formed species is the continuous increase in conductance of their solutions (Issa et al., 2001; Askar et al., 2010). The molar ratio was 1:1 and 1:4 in case of NaTPB and STA which is identical with elemental analysis data (Issa et al., 2014).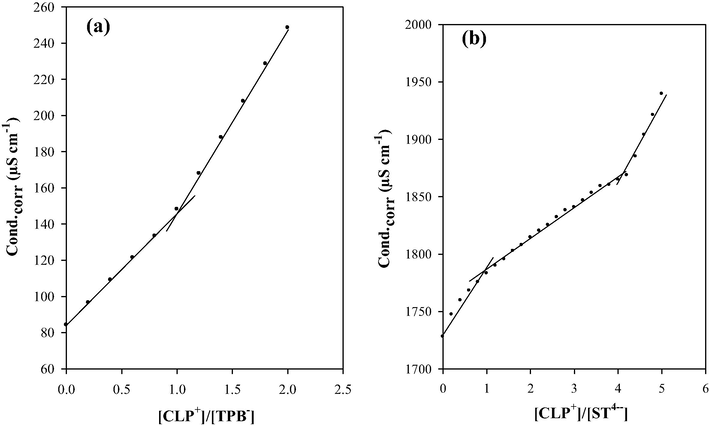
Molar ratios of CLP+ with TPB− (a) and ST4− (b).
3.2 The solubilities of CLP+ ion-associates
Ion-associates formation is the main controlling factors in many chemical reactions, such as precipitation reactions, where the degree of feasibility of titration depends on the degree of completeness of the precipitation reaction. The solubility products (Ksp) of the formed ion-associates were determined conductimetrically as described under Section 2.6. The conductivity of 1 × 10⁻⁶, 2.5 × 10⁻⁶, 5.0 × 10⁻⁶, 7.5 × 10⁻⁶ and 1.0 × 10⁻⁵ mol L−1 of CLP.Cl, NaTPB and STA was measured at 25 °C and the specific conductivities (ks) were calculated and used to obtain the equivalent conductivities (λ) of these solutions. Straight line plots of λ versus
were constructed, Fig. 2. The limiting equivalent conductance (λο) for CLP.Cl, NaTPB and STA was determined from the intercept of the line with λ-axis. The activity coefficients of the ions were taken as unity because all the solutions were sufficiently dilute. The values of λο were calculated using Kohlrausch’s law of independent migration of ions (Antropov, 1997). The results showed that λοCLP-TPB and λοCLP-ST are 7956.14 and 20848.95 cm2 Ω−1 gequi−1, respectively.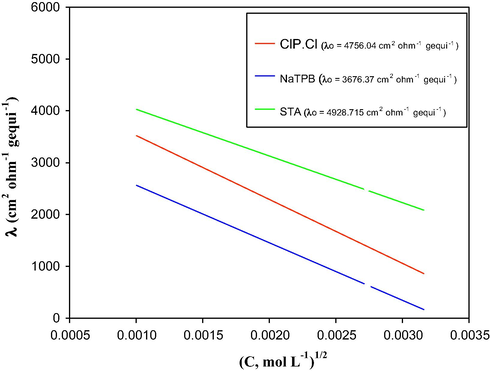
The relation between the equivalent conductance and the square root of the concentration of dilute solutions of CLP.Cl, NaTPB and STA.
The solubility (S) and solubility product (Ksp) of the particular ion-associate were calculated using the following equations:
Ksp = 1 S2
for 1:1 ion-associates, and
Ksp = 256 S5
for 1:4 ion-associates
The equilibrium constant of the precipitation reaction (K) is inversely proportional to the solubility products (Ksp) whereas, the smaller the solubility product of the formed ion-associate, the sharper the end point. Also, it has been shown that the solubility products of the precipitates constituting the ion-selective sensor determine the detection limits of precipitate-base sensors (Pungor and Toth, 1970). The values of solubility and solubility products of the ion-associates obtained from both conductimetric measurements and potentiometric measurements applying the standard addition method are close to each other, Table 1. The results indicated that the solubility product of ion-exchanger of (CLP)4-ST is lower than that of CLP-TPB, so it is most stable because it has higher equilibrium constant. The following equation describes the reaction mechanism of the ion-exchanger formation:
Temperature (K)
S (mol L−1)
Ksp
ln Ksp
Conductimetrically
CLP-TPB
298
1.80 × 10⁻⁶
3.27 × 10⁻¹²
−26.4462
303
1.82 × 10⁻⁶
3.32 × 10⁻¹²
−26.4311
313
1.86 × 10⁻⁶
3.46 × 10⁻¹²
−26.3898
323
1.92 × 10⁻⁶
3.69 × 10⁻¹²
−26.3254
333
2.03 × 10⁻⁶
4.14 × 10⁻¹²
−26.2103
343
2.18 × 10⁻⁶
4.78 × 10⁻¹²
−26.0666
(CLP)4-ST
298
1.02 × 10⁻⁶
2.91 × 10⁻²⁸
−63.4042
303
1.08 × 10⁻⁶
3.91 × 10⁻²⁸
−63.1088
313
1.09 × 10⁻⁶
4.09 × 10⁻²⁸
−63.0638
323
1.13 × 10⁻⁶
4.85 × 10⁻²⁸
−62.8934
333
1.27 × 10⁻⁶
8.65 × 10⁻²⁸
−62.3148
343
1.41 × 10⁻⁶
1.42 × 10⁻²⁷
−61.8191
Potentiometric measurements with the standard addition method
CLP-TPB
2.36 × 10⁻⁶
5.56 × 10⁻¹²
−25.9154
(CLP)4-ST
1.07 × 10⁻⁶
3.59 × 10⁻²⁸
−63.1942
3.3 Thermodynamic parameters of CLP.Cl ion-associates
The solubilities of these ion-associates were measured as a function of temperature and the data were used to calculate the equilibrium constant (Ksp), enthalpy (ΔH), entropy (ΔS) and free energy of dissolution (ΔG). On increasing the temperature the solubilities increase as shown in Table 1.
The relation between (ln Ksp) and (1/T) was plotted according to Eq. (5), Fig. 3. The results show positive values of ΔH, which indicate the endothermic nature of the dissolution of these ion-associates. The entropy changes show negative values proving the formation of strong ion-associates with greater order in molecules. The free energy (ΔG) of dissolution was calculated from Eq. (3). The positive values of the ΔG indicate that the dissolution of these ion-associates occurs non-spontaneously, Table 2.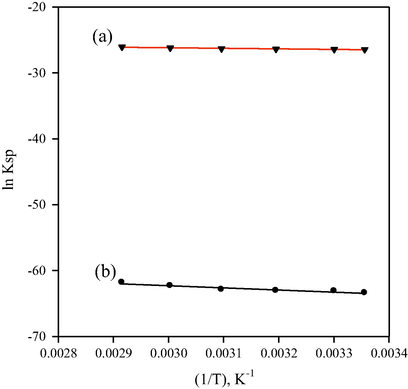
The relation between (ln Ksp) and (1/T) for CLP-TPB (a) and (CLP)4-ST (b).
Physical parameter
Ion-associate
CLP-TPB
(CLP)4-ST
S (mol L−1), 25 °C
a 1.80 × 10⁻⁶ ± 0.16
a 1.02 × 10⁻⁶ ± 0.13
Ksp, 25 °C
3.27 × 10⁻¹²
2.91 × 10⁻²⁸
ΔG (kJ mol−1), 25 °C
65.52
157.08
ΔH (kJ mol−1)
6.86
27.15
ΔS (kJ mol−1 K−1)
−0.19
−0.43
3.4 The best conditions for the conductimetric titrations
The shape of the titration graphs depends seriously on all the species present during the titration process and other factors such as viscosity, dielectric constant, solvation, association, proton-transfer and temperature of the medium. So we study some of these parameters to reach the best conditions for conductimetric titration such as effect of solvent, titrant’s concentration and temperature of the medium. As it is more convenient in analytical chemistry to use titrants that form one type of product than those forming more than one type, NaTPB solution was used for the analysis.
The results indicated that the concentration of the NaTPB (1.0 × 10⁻³–1.0 × 10⁻² mol L−1) has no effect on the inflection at the end point of the titration curve of 1.0 × 10⁻³ mol L−1 CLP.Cl. Hence, all of these concentrations are suitable for conductimetric titration as the conductance readings are stable within 1 min of mixing and the end point was easily detected.
Consequently, for studying the effect of solvent on the shape of the titration curve and the detection of the end point 1.0 × 10⁻³ mol L−1 CLP.Cl solution was prepared in different solvents (H2O, ethanol, methanol and acetone). The sharpest end point occurs upon using water solutions.
As the temperature increases, the conductivity of the whole solution increases and there is no obvious effect observed on the shape of titration graph and the position of end point which can be detected easily up to 60 °C, Fig. 4.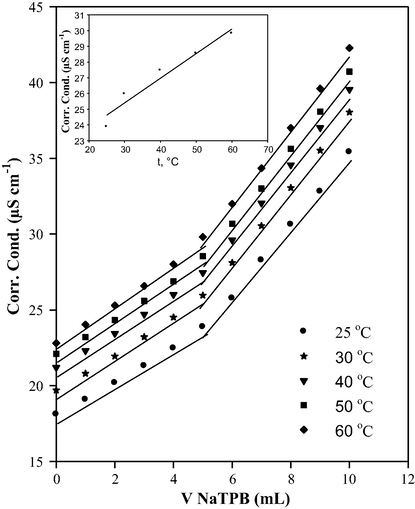
Conductimetric titration curves at different temperatures of 1.75 mg CLP.Cl against 1.0 × 10⁻³ mol L−1 NaTPB, and a relation between the conductivity at the end point and temperature (insert).
3.5 Analytical applications
Conductimetric titration was applied to determine CLP.Cl in pure form and pharmaceutical preparations using NaTPB solution as a titrant. Volumes containing 0.17–35.13 mg were taken from a stock 1 × 10⁻² mol L−1 CLP.Cl and completed to 50 mL using bi-distilled water. The prepared solutions were transferred to the titration cell and titrated against 1.0 × 10⁻² mol L−1 NaTPB standard solution. Fig. 5 shows the titration curves for 7.02, 10.53, 17.56 and 35.13 mg CLP.Cl (Curves a–d), and these curves show a clear end point for all taken amounts. The average recoveries were 99.95–101.07% with RSD% of 0.50–0.90%, Table 3.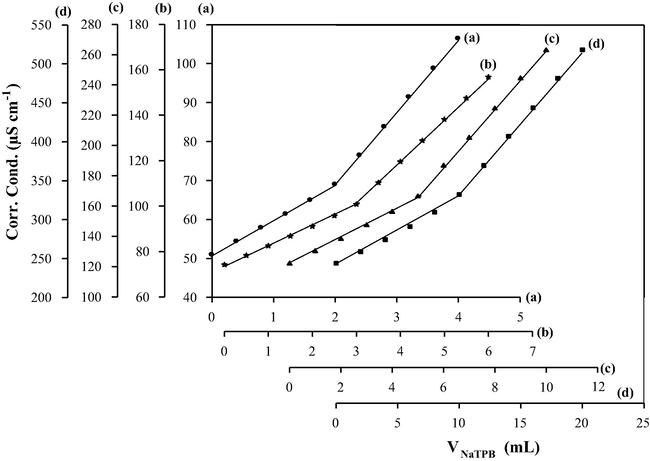
Conductimetric titration of 7.02 mg; 2 mL of 1.0 × 10⁻² mol L−1 (a), 10.53 mg; 3 mL of 1.0 × 10⁻² mol L−1 (b), 17.56 mg; 5 mL of 1.0 × 10⁻² mol L−1 (c) and 35.13 mg; 10 mL of 1.0 × 10⁻² mol L−1 of CLP.Cl in 50 mL final volume (d) against 1.0 × 10⁻² mol L−1 NaTPB at 25 °C.
Taken (mg)
aRecovery ± SD%
RSD%
Pure solution
0.17
99.95 ± 0.45
0.90
0.35
100.30 ± 0.37
0.75
0.70
100.96 ± 0.42
0.83
1.05
100.59 ± 0.39
0.78
1.75
100.41 ± 0.39
0.78
3.51
101.06 ± 0.41
0.82
7.02
100.78 ± 0.37
0.73
10.53
100.63 ± 0.44
0.87
17.56
101.07 ± 0.25
0.50
35.13
101.05 ± 0.44
0.87
Anafranil® (25 mg/tablet)
0.99
101.43 ± 0.61
1.21
2.49
101.07 ± 0.41
0.81
Anafranil® (75 mg/tablet)
2.99
100.98 ± 0.33
0.67
7.48
101.23 ± 0.31
0.62
The applicability of the proposed method for the assay of CLP.Cl in pharmaceutical formulations (25 and 75 mg/tablet Anafranil®) was examined. Different weights from 0.99 to 7.48 mg of Anafranil® were analyzed and they gave recoveries of 100.98–101.43% with RSD% of 0.62–1.21%, Table 3.
The results in Table 3 revealed that, the commonly used additives and excipients in tablets have negligible interference with the assay method and there is no effect on the shape of the titration graphs and the position of the end point. Thus, conductimetric determination is a good analytical tool used to determine CLP.Cl in pure form and pharmaceutical preparations.
3.6 Validation of the proposed method
3.6.1 Precision, accuracy, ruggedness and robustness
Four standard samples, containing 7.00 mg CLP.Cl, were analyzed for the repeatability study. The RSD% value for the later was ⩽1.21%. For ruggedness, a comparison between the results obtained by two analysts was performed; the obtained RSD% values by two analysts in the same laboratory under the same analysis conditions were 0.72% and 0.64%. The robustness of the proposed methods was studied while the parameters (solvent and temperature of the solution) were slightly changed, and the recovery percentages were good under most conditions and do not show any significant change when the critical parameters were modified.
3.6.2 Statistical treatment of the analytical application results
The results were statistically compared with the British Pharmacopoeia method, 2014, the British Pharmacopoeia method, 2014, in which a potentiometric titration was carried out using 0.1 mol L−1 NaOH (where, 1 mL 0.1 mol L−1 NaOH is equivalent to 35.13 mg CLP.Cl); using t- and F-tests, Table 4. At 95% confidence level for 4 replicate measurements, the calculated t- and F-values did not exceed the critical values, indicating that there is no significant difference between the proposed method and the official method with regard to accuracy and precision.
Pharmacopieal method
Pure solution
Anafranil® tablet (25 mg/tablet)
Anafranil® tablet (75 mg/tablet)
NaTPB
X ± S.Ea
101.59 ± 0.72
100.41 ± 0.39
101.07 ± 0.41
101.23 ± 0.31
RSD%
1.42
0.78
0.82
0.62
t-valueb
2.67
1.23
1.36
F-valuec
0.35
0.38
0.27
X ± S.E
101.59 ± 0.72
100.52 ± 0.33
101.05 ± 0.27
99.79 ± 0.28
AgNO3
RSD%
1.42
0.67
0.53
0.57
t-valueb
2.81
2.67
6.63
F-valuec
0.26
0.22
0.19
4 Conclusion
Different thermodynamic parameters concerning the solubility, solubility product, ΔG, ΔH and ΔS have been determined using potentiometric and conductimetric measurements. The results obtained by applying both methods were comparable. Such techniques (ion-selective sensors and conductimetry) are easy to perform and can be further generalized for such type of study.
Also, this work presents a conductimetric method for the determination of CLP.Cl using NaTPB as titrant. The suggested method is precise, accurate, repeatable, sensitive and rapid over other spectrophotometric, potentiometric and chromatographic methods. The method is successfully applied to pharmaceutical preparations. The results showed that there is no interference from excipients or additives used in the pharmaceutical tablets. The obtained results are in good agreement with those obtained from the British Pharmacopoeia method, 2014.
References
- Theoretical Electrochemistry. Mir; 1997.
- Conductimetric determination of reproterol HCl and pipazethate HCl and salbutamol sulphate in their pharmaceutical formulations. J. Saud. Chem. Soc.. 2010;14:175-182.
- [Google Scholar]
- Trace fluoride determination with specific ion electrode. Anal. Chim. Acta. 1968;42:127-132.
- [Google Scholar]
- British Pharmacopoeia Cambridge University Press, 2014. Cambridge 1, UK, pp. 585–586.
- Clomipramine determination by potentiometric PVC membrane and carbon paste sensors. Anal. Bioanal. Electrochem.. 2012;4:315-326.
- [Google Scholar]
- Development of a capillary cone electrophoretic method to determine six antidepressants in their pharmaceutical preparations. J. Sep. Sci.. 2004;27:33-40.
- [Google Scholar]
- Analysis of eighteen antidepressants, four atypical antipsychotics and active metabolites in serum by liquid chromatography: a simple tool for therapeutic drug monitoring. J. Chromatogr. B. 2003;794:35-47.
- [Google Scholar]
- Efficacy and tolerability of serotonin transport inhibitors in obsessive–compulsive disorder: a meta-analysis. Arch. Gen. Psychiatry. 1995;52:53-60.
- [Google Scholar]
- Chemically modified carbon paste sensors for determination of clomipramine hydrochloride in pharmaceutical formulations. Int. J. Res. Pharm. Chem.. 2014;4:723-734.
- [Google Scholar]
- Conductimetric determination of reproterol HCl and pipazethate HCl and salbutamol sulphate in their pharmaceutical formulations. J. Pharm. Biomed. Anal.. 2001;26:379-386.
- [Google Scholar]
- Determination of clomipramine by flow-injection analysis with acidic potassium permanganate–formic acid chemiluminescence detection. Luminescence. 2011;26(6):741-746.
- [Google Scholar]
- Study on the fluorescence quenching reaction of amitriptyline and clomipramine hydrochlorides with eosin Y and its analytical application. J. Fluorescence. 2013;23:533-542.
- [Google Scholar]
- Method for simultaneous determination of eight cyclic antidepressants by cyclodextrin-modified capillary zone electrophoresis: applications in pharmaceuticals. Anal. Chim. Acta. 2004;525:23-30.
- [Google Scholar]
- A gas chromatographic method for the determination of antidepressant drugs in human serum. Acta Pharmacol. Toxicol.. 1981;49:390-398.
- [Google Scholar]
- Spectrophotometric method for estimation of clomipramine in bulk and tablet dosage form. Int. J. Pharm. Sci. Res.. 2013;4:1610-1613.
- [Google Scholar]
- Reliable HPLC method for therapeutic drug monitoring of frequently prescribed tricyclic and nontricyclic antidepressants. J. Pharm. Biomed. Anal.. 2007;44:955-962.
- [Google Scholar]
- Multicommutated flow system for the chemiluminometric determination of clomipramine in pharmaceutical preparations. Anal. Chim. Acta. 2004;518:31-36.
- [Google Scholar]
- The use of Quercetin for spectrophotometric determination of some CNS acting drugs. Bull. Pharm. Sci.. 2003;26:15-27.
- [Google Scholar]
- Determination of fluoxetine, fluvoxamine, and clomipramine in pharmaceutical formulations by capillary gas chromatography. J. Chromatogr. Sci.. 2000;38(5):200-206.
- [Google Scholar]
- Ion-selective electrode for the determination of some multidrug resistance reversers. Sens. Actuators B Chem.. 2006;119:282-287.
- [Google Scholar]
- A fully validated method for the simultaneous determination of 11 antidepressant drugs in whole blood by gas chromatography-mass spectrometry. J. Pharm. Biomed. Anal.. 2012;70:557-562.
- [Google Scholar]
- Optimization and validation of spectrofluorimetric method for the determination of clomipramine hydrochloride via ion-pair complexation with alizarin red S. Anal. Methods. 2010;2:513-518.
- [Google Scholar]
- Solid-phase extraction and analysis of 20 antidepressant drugs in human plasma by LC/MS with SSI method. Forensic Sci. Int.. 2006;162:108-112.
- [Google Scholar]


