

Translate this page into:
Sonochemical synthesis and characterization of CuInS2 nanostructures using new sulfur precursor and their application as photocatalyst for degradation of organic pollutants under simulated sunlight
⁎Corresponding authors. hbashiri@kashanu.ac.ir (Hadis Bashiri), Salavati@kashanu.ac.ir (Masoud Salavati-Niasari)
-
Received: ,
Accepted: ,
This article was originally published by Elsevier and was migrated to Scientific Scholar after the change of Publisher.
Peer review under responsibility of King Saud University.
Abstract
In this research, we investigated the photocatalytic activity of CuInS2 nanoparticles in visible light during the decomposition of three toxic dyes (Eriochrome Black T, Rhodamine B, and Erythrosine). The CuInS2 nanostructures were synthesized by a rapid and simple sonochemical method using dithiooxamide as a sulfur reagent and various capping agents, including SDS, CTAB, and PVP, were applied to achieve a pure structure with fine morphology. The flower-like structure was observed through FESEM images, implying different capping agents and fabrication had a considerable influence on the morphology of samples. The suitable bandgap of CuInS2 (1.53 eV) was obtained from DRS analysis and resulted in higher photodegradation efficiency. The fabricated CuInS2 revealed better photodegradation efficiency (74.8%) to the anionic dyes than cationic dye. A possible photodegradation mechanism was suggested based on scavenger tests of active species.
Keywords
Nanostructures
Photodegradation
CuInS2
Erythrosine
Rubeanic acid
Sonochemical fabrication

1 Introduction
Pure water is vital for life and has boosted needs because of the growth in the world population. While industrial settlement is beneficial to society, their emissions are composed of organic and inorganic sewage that impacts water quality and eventually concern the ecosystem and environment. In wastewater, non-biodegradable dyes cause aquatic contamination and have serious consequences (Phaltane et al., 2017; Liu et al., 2018; Thwin et al., 2019). Various biological, chemical, and physical water purification methods have been used to manage this issue but have failed because of enormous facility costs or the inability to complete the mineralization of these poisonous contaminants. The failure of these techniques has attracted the researcher's concentration on the evolution of new, simple, and inexpensive processes capable of complete wastewater purification (Rafique et al., 2018). Accordingly, photocatalytic activity based on the Advanced Oxidation Process (AOP) has evolved into a novel and promising technology with a significant ability to decompose inorganic and organic colorants. The photocatalytic revolution starts with the electron-hole (e–-h+) pair's production in response to light. This e–-h+ pairs are in charge of the reduction and oxidation procedures that destroy contaminants (Tahir et al., 2018).
Metal oxide semiconductors, including ZnO and TiO2, have been broadly employed as photocatalysts to degrade toxic pollutants in sewage because they are non-toxic and chemically and thermally stable (Ong et al., 2018; Jiang et al., 2020). Unfortunately, these compounds have the problem of low visible light utilization because of the wide bandgap (3.3 eV for ZnO and 3.2 eV for TiO2) (Ong et al., 2018; Schneider et al., 2014). Binary metal sulfides are alluring nominees as positively efficient photocatalysts driven by visible light. Since the valence bands of these compounds are composed of 3p orbitals of S, the bandgap is narrower than those of metal oxides and therefore sensitizes the majority of metal sulfides to visible rays (Haque et al., 2018). Nevertheless, these compounds possess low efficiency of charge separation and suffer from photo corrosion, restricting their functional usages (Zhang and Zhu, 2010). Lately, photocatalysts based on ternary metal sulfide have been highly emphasized in photocatalysis investigation due to their long-term corrosion resistance, high thermal property, and high absorption coefficient over a broad spectral range in comparison with photocatalysts based on binary metal sulfide (Regulacio and Han, 2016; Yousif and Agbolaghi, 2020). Intriguingly, nanostructured photocatalysts with high specific surface areas have more active locations for the optimal transfer of e– and h+ to the photocatalyst surface that are obtainable for photocatalytic reactions. All of this leads to improved photocatalytic behavior compared to bulk structures (Adhikari and Lachgar, 2016).
A promising ternary metal sulfide is copper indium sulfide (CuInS2), which has a variety of potential uses, such as photodetectors, photocatalysis, solar cells, and bioimaging (Bulyarsky et al., 2016; Jabarullah et al., 2019; Haran and Yousif, 2022; Zhang et al., 2020; Liu et al., 2013; Deng et al., 2012). Its valence band is made of 3p orbitals from S, and its conduction band is composed of 5 s orbitals from In (Regulacio and Han, 2016). Therefore, the narrower bandgap (1.53 eV) can be obtained (Luo et al., 2015). CuInS2 has been studied as a photocatalyst for reduction of nitrate ion (Haran and Yousif, 2022), H2 generation (Kobayakawa et al., 1992), and decomposition of toxic pollutants (Liu et al., 2011; Yousif and Al-Zhara, 2016). Hydro/solvothermal approaches have been applied to fabricate CuInS2 nanostructures (Han et al., 2009; Yousif and Haran, 2021). Nevertheless, these techniques commonly demand high electrical energy consumption, extended reaction time, and complicated and expensive tools. The sonochemical approach plays an important role in the nanostructure preparation with small crystal sizes and high surface areas. This is a property that is helpful for photocatalytic performance (Karami et al., 2021). The sonochemical procedure is an efficient technique for the fabrication of nanostructures over a brief reaction time because of its high potential to pulse, which can create hot spots in the reaction media (Ghanbari and Salavati-Niasari, 2018).
In this work, we utilized a sonochemical approach to produce CuInS2 nanostructures employing dithiooxamide (also known as rubeanic acid) as a sulfur precursor. Dithiooxamide is an organic compound. It is the sulfur analog of oxamide. It performs as a chelating agent, for example, in the determination or detection of copper. Besides, it has been utilized as a construction unit in the fabrication of cyclen (Soylak and Erdogan, 2006). To our knowledge, this is the first time that rubeanic acid has been used as a sulfur precursor. The types of capping agents, including SDS, CTAB, and PVP, were investigated on the purity and morphology of CuInS2 nanostructures.
According to the Tauc plot, CuInS2 has a proper bandgap in the visible region (1.53 eV). Therefore, the photodegradation behavior of Eriochrome Black T (ECBT), Rhodamine B (RhB), and Erythrosine (Ery) (denoting toxic contaminants) with respect to the fabricated CuInS2 photocatalyst was scrutinized. The possible photodegradation mechanism was carried out through scavenger experiments of active species.
2 Experimental
2.1 Precursors
All precursors involved in this study were of analytical grade and utilized as obtained with no additional refinement. Copper nitrate trihydrate (Cu(NO3)2·3H2O), Propylene glycol (PG), Sodium dodecyl sulfate (SDS), Indium chloride (InCl3), Polyvinylpyrrolidone (PVP), Ethylenediaminetetraacetic acid (EDTA), Rubeanic acid, Methanol, 1,4-Benzoquinone (BQ), Cetyltrimethylammonium bromide (CTAB), and Benzoic acid (BA) were procured from Sigma-Aldrich.
2.2 Preparation of CuInS2 nanostructures
In a standard approach, CuInS2 was synthesized by combining InCl3, Cu(NO3)2, rubeanic acid, and surfactant, including SDS, PVP, and CTAB under ultrasonic radiation. 0.62 mmol Cu(NO3)2 was dissolved in 10 mL PG, 1.24 mmol surfactant was liquified in 10 mL PG and added to Cu2+ solution. In the next step, 0.61 mmol InCl3 was dissolved in 10 mL propylene glycol and added to the mentioned solution. 1.24 mmol rubeanic acid was also dissolved in 10 mL propylene glycol and added to the mixture under ultrasonic radiation for 10 min. The obtained dark brown powder was washed with ethyl alcohol and dionized water multiple times and dried at 70 °C for 12 h. The dried powder was annealed at 400 °C for 2 h in a gas mixture of 85% Argon and 15% Hydrogen. Table 1 and Scheme 1 show the different condition for fabrication of CuInS2.
Sample No.
Surfactant
Method
In: Cu: Surfactant
Grain size (nm)
1
SDS
Co– precipitation
18.43
2
CTAB
1:1:2
16.96
3
SDS
Sonochemical
17.31
4
PVP
19.00
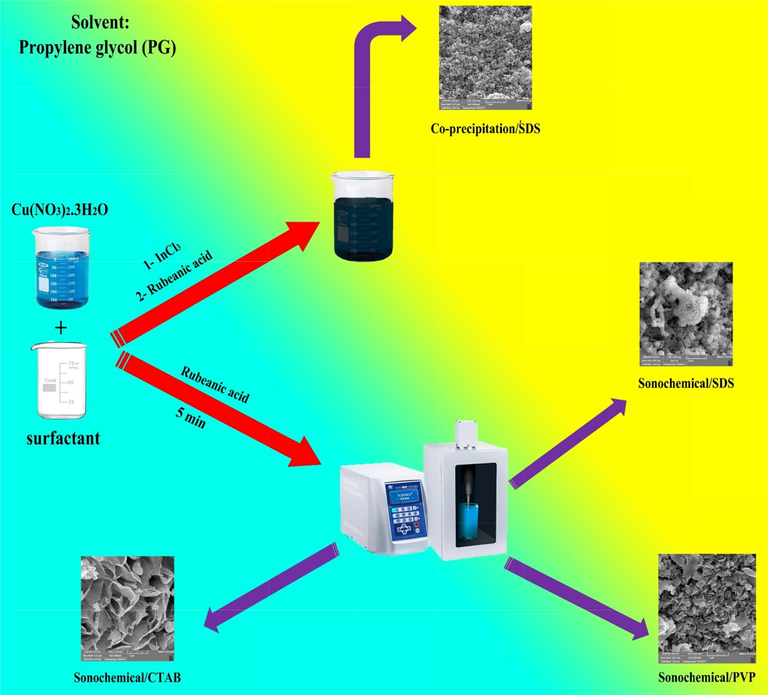
Schematic of preparation of CuInS2 by sonochemical method.
2.3 Photocatalytic process
CuInS2 was used to examine its photocatalytic activity for decolorization of toxic colorants, including Eriochrome Black T, Rhodamine B, and Erythrosine under visible light. A 150 W Osram lamp with a wavelength between 400 and 780 nm was used as the radiation source for the photocatalytic operation. The tests were run without radiation and CuInS2, and virtually no dye was eliminated after 2 h. In each experiment, 20 mg of CuInS2 was added to 20 mL of 10 ppm toxic contaminate. The suspension was agitated in the darkness for 0.5 h before activating the visible lamp. A 3 mL specimen was taken from the mixture every 15 min throughout radiance and centrifuged at 11,000 rpm for 6 min. Buoyancy was gathered, filtered, and monitored with a UV–Vis spectrophotometer.
3 Result and discussion
3.1 Characterization
FT–IR spectra of CuInS2 before and after annealing, and rubeanic acid are illustrated in Fig. 1. FTIR spectroscopy was employed to verify the existence of the chemical structure of CuInS2. The FTIR spectra indicate the lack of lattice vibrations generated with CuInS2 in the 4000–400 cm−1 spectral range. Nevertheless, it reveals vibrations at 1271 and 621 cm−1 can be associated with the sulfate group (SO4) (Adhikari and Lachgar, 2016). The FTIR information in annealed CuInS2 reduces as compared to un-annealed CuInS2. Absorption bands at 3439 cm−1 and 3238 cm−1 indicate the existence of both indium and copper complexes. This Figure also reveals the characteristic peak at 1271 cm−1, which are designated to CuSO4. The absorption band at 782 cm−1 belongs to the Cu2O group (Behera et al., 2013). The IR spectra demonstrated the potential vibration at 3228 cm−1, which belonged to the existence of both indium and copper. The vibration peaks at 1052 and 864 cm−1 for Cu-complex and In-complex because of C⚌S stretching vibrations (Bera et al., 2008). Besides, the absorption bands at 1631 cm−1, 1509 cm−1 belong to CuS (Krunks et al., 2002). The absorption bands of rubeanic acid (Fig. 3c), including 3294, 3134, 1585, 1427, 1278, 1195, 835, 705, and 639 cm−1, were so identical to the peaks documented in the literature (Hinogami et al., 2012).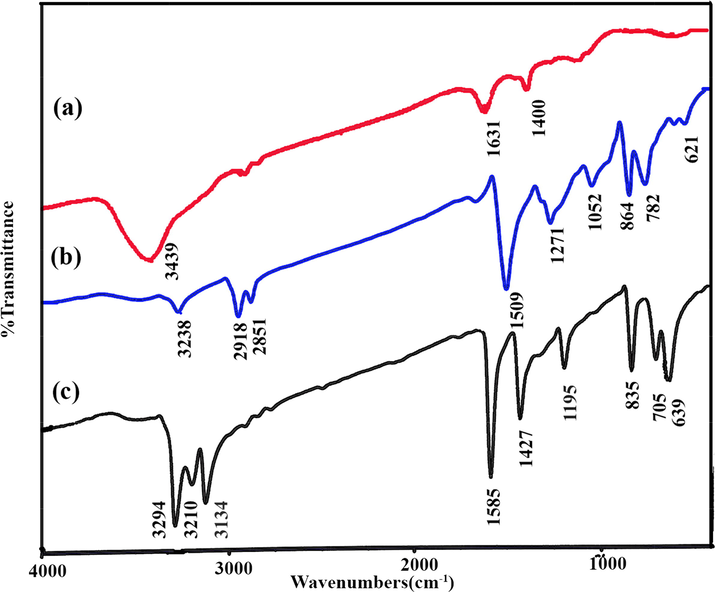
FTIR spectra of CuInS2 (a) before, (b) after annealing, and (c) Rubeanic acid.
The XRD patterns for specimens 1–4 were presented in Fig. 2(a–d). The XRD pattern of specimen 1 prepared by the co-precipitation method (Fig. 2a) shows an impurity such as Cu2S (JCPDS No. 072-1071) in the final product. Fig. 2(b–d) unveils the XRD patterns of CuInS2 synthesized by sonochemical method in the presence of three different types of capping agents, including CTAB (cationic), SDS (anionic), and PVP (polymeric), respectively. Sample 2 (Fig. 2b) was formed from CuInS2 with JCPDS No. 38–0777 as the main product and Cu2S (JCPDS No. 072-1071) as an impurity. Fig. 2c and 2d were allocated to the tetragonal phase of CuInS2 with reference code of JCPDS No. 38-0777 (a = b = 5.5200 Å, and c = 11.1200 Å) and space group of I-42d. The diffraction peaks in these patterns correspond to the (1 1 2), (2 1 1), (2 0 0), (2 2 0), and (3 1 6) planes. There are no diffraction peaks related to other phases in Fig. 2c and 2 d, suggesting the acquired product in the presence of SDS and PVP (samples 3 and 4) are pure, while the XRD patterns of the sample achieved in the presence of CTAB (specimen 2) indicated the existence of some impurity like Cu2S (072-1071) in the final product. Scherrer equation was applied to estimate the grain size in the range of 16–19 nm (Table 1) (Abkar et al., 2022).
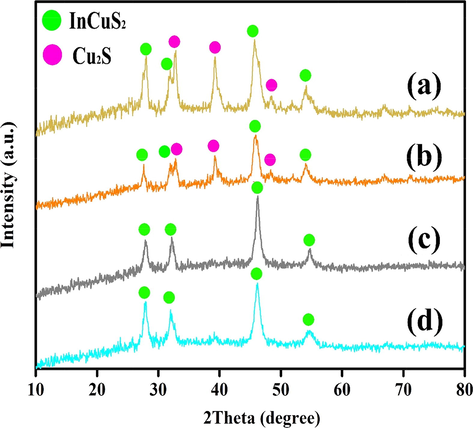
XRD patterns of CuInS2 (a) Sample 1 (Co-precipitation/SDS), (b) Sample 2 (Sonochemical/CTAB), (c) Sample 3 (Sonochemical/SDS), (d) Sample 4 (Sonochemical/PVP).
The corresponding reaction to compose stoichiometric CuInS2 during the sonochemical procedure can be presented as follow:
Fig. 3 indicates the SEM images of the CuInS2. Fig. 3a and b illustrates that the co-precipitation method results in a large amount of sphere-like nanoparticles with agglomeration. Fig. 3c and d shows the SEM images of CuInS2 in the existence of CTAB as a cationic covering agent, representing homogenous flake-like particles. Flower-like morphology was observed for CuInS2 utilizing SDS as an anionic surfactant (Fig. 3e and f). Applying PVP as a polymeric surfactant was composed flake structures of CuInS2. The particle size of the CuInS2 is between 11 and 14 nm based on the TEM image of the CuInS2 (sample 3, Fig. 4). The EDS spectrum of CuInS2 (specimen 3) shows that the compound is composed of Cu, In, and S elements without any impurities (Fig. 5).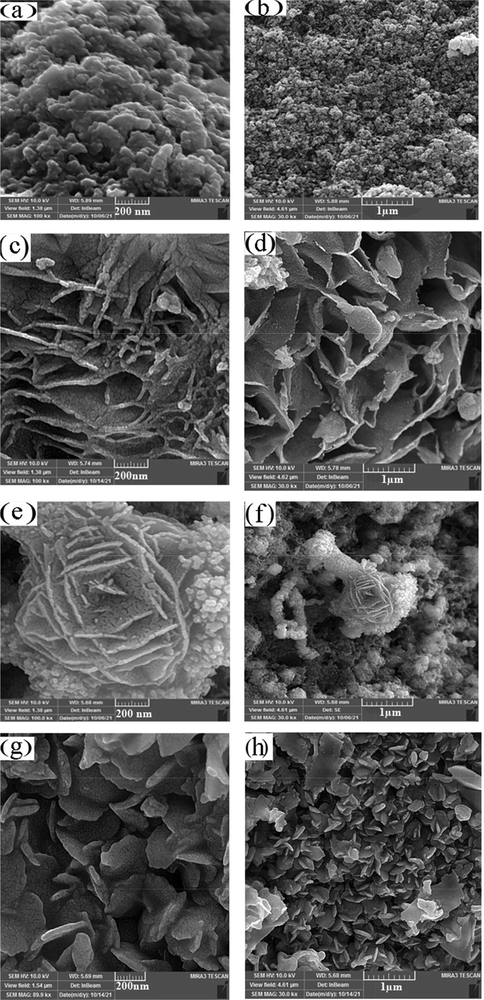
FE-SEM images of the CuInS2 (a,b) Sample 1 (Co-precipitation/SDS), (c,d) Sample 2 (Sonochemical/CTAB), (e,f) Sample 3 (Sonochemical/SDS), (g,h) Sample 4 (Sonochemical/PVP).
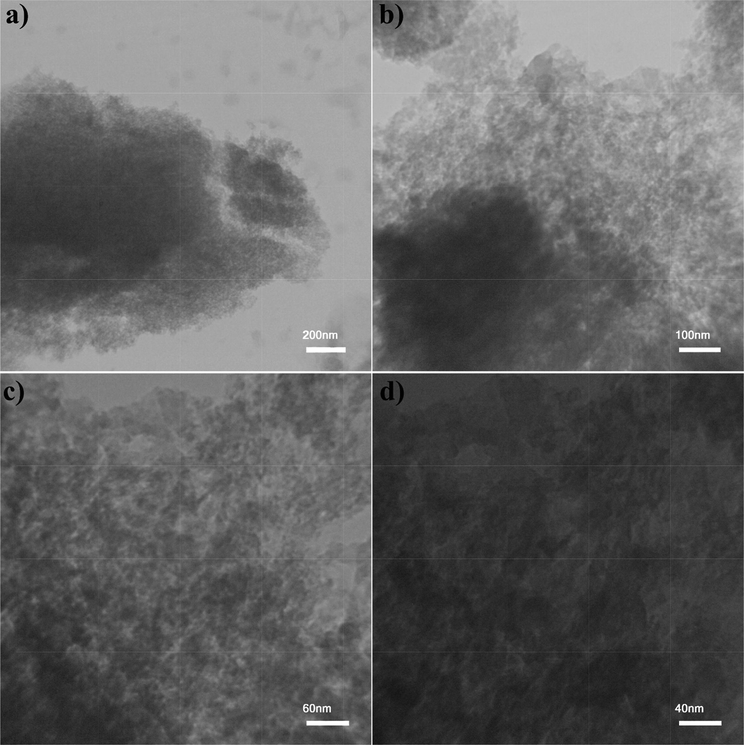
TEM images of CuInS2 Sample 3.
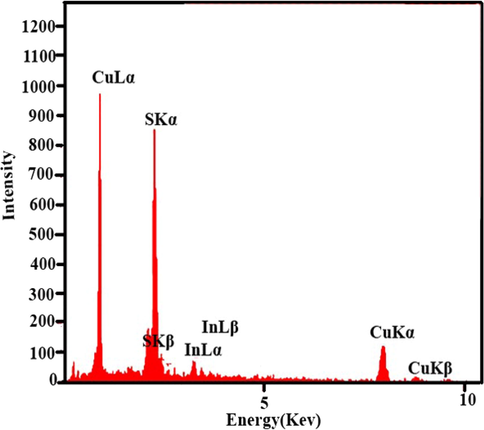
EDS spectrum of Sample 3.
The surface characterization of CuInS2 nanostructures is illustrated in Fig. 6. The received isotherm is type III with H3-type hysteresis (Fig. 6a), belonging to the mesoporous materials. The average size of pores was obtained between 1 and 25 nm for sample 3 from the BJH plot (Fig. 6b). The specific surface area is 11.96 m2/g, the pore size on average, and the total pore volume is 6.77 nm and 0.024 cm3/g, respectively.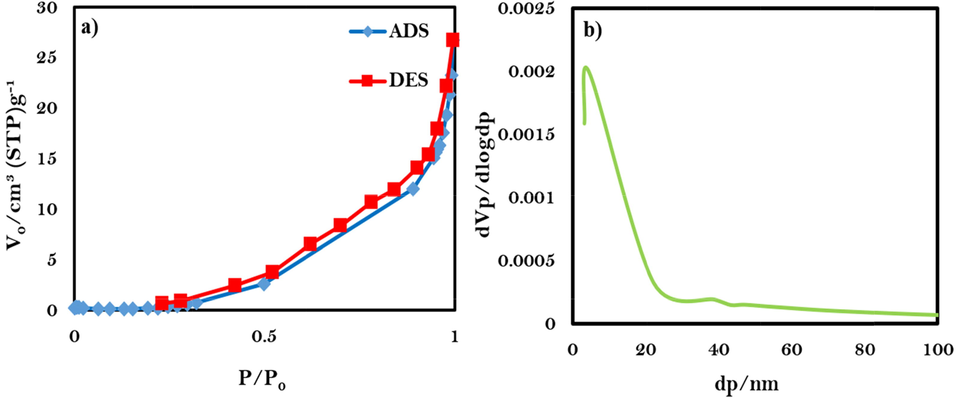
(a) Low temperature N2 adsorption/desorption isotherm, (b) BJH plot of CuInS2 nanostructures (sample 3).
The optical property of CuInS2 (sample 3) is indicated in Fig. 7 using UV–Vis diffuse reflectance spectroscopy (DRS). CuInS2 shows typical absorptions in the area of 200–500 nm. The optical bandgap (B.G.) was calculated by (Ghanbari and Salavati-Niasari, 2018),
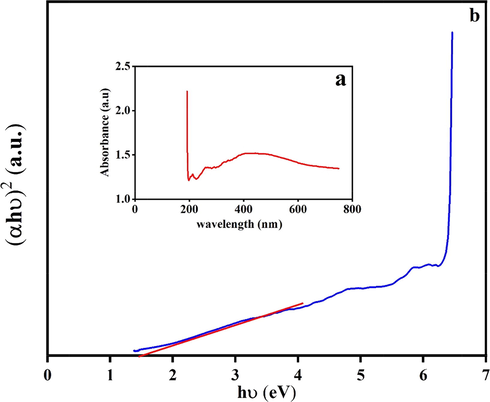
UV–vis absorption spectrum and the corresponding plots of (αhυ)2 against photon energy (hυ) of CuInS2.
3.2 Photocatalytic performance
The photocatalytic behavior of CuInS2 (sample 3) was examined by observing the decolorization of three different dyes, including Eriochrome Black T, Rhodamine B, and Erythrosine in an aqueous solution, below visible light (Fig. 8). With no irradiation or CuInS2, nearly no dyes were decolorized after 120 min revealing the self-decolorization was inapplicable. The decolorization percentage (%D) was calculated as
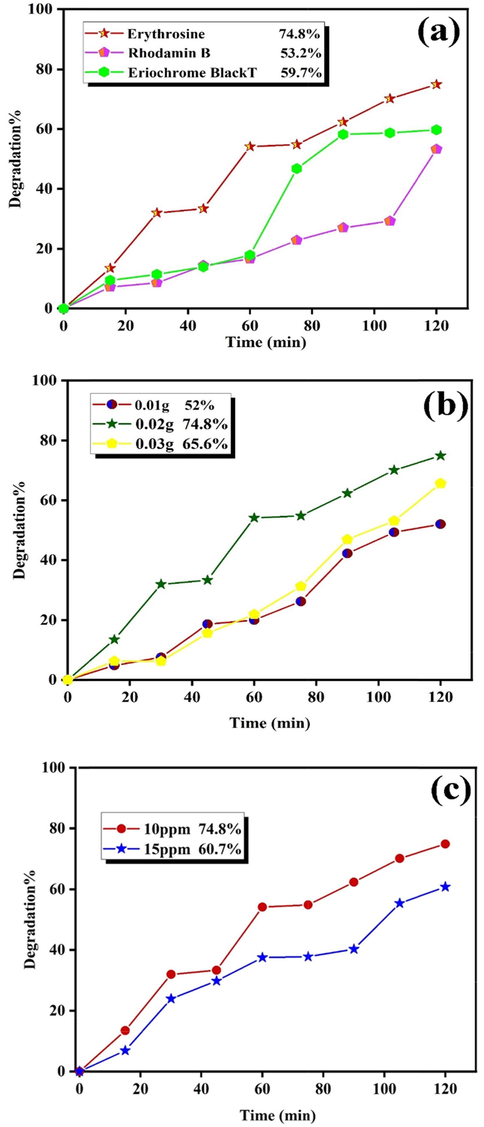
Photodecolorization of CuInS2 (a) over three different dyes, (b) catalyst dosages over Erythrosine, and (c) Erythrosine concentrations.
which A0 and At are absorbance of the sample solution before and after degradation, respectively (Orooji et al., 2020). The influence of three different pollutants and the catalyst dosages (0.01, 0.02, and 0.03 g) was accomplished to attain adequate efficiency. Fig. 8a reveals the photocatalytic decolorization of 0.02 g CuInS2 in the presence of Eriochrome Black T, Rhodamine B, and Erythrosine. These dyes were decolorized about 59.7%, 53.2%, and 74.8% after 120 min, respectively. Fig. 8b unveils the impact of CuInS2 dosages on the decolorization of Erythrosine. Increasing CuInS2 dosage from 0.01 to 0.02 g has enhanced the decolorization of Erythrosine from 52.0% to 74.8%, while enhancing dosage from 0.02 to 0.03 g has resulted in a reduction from 74.8% to 65.6%. Hence, enriching the CuInS2 doses improve the surface of the catalyst and improves the adsorption of dye on the CuInS2 surface. Nevertheless, the expansion in the catalyst dosage is practical up to a specific quantity (0.02 g), and then CuInS2 saturation layers were observed. Increasing the thickness of CuInS2 in the colorant solution averts radiation from reaching the solution and reduces the efficiency (Sunayana et al., 2010). Fig. 8b demonstrates the impact of pollutant concentrations (10 and 15 ppm) of Erythrosine after 120 min, unveiling that increasing concentration from 10 ppm to 15 ppm reduces the decolorization from 74.8% to 60.7%. Fig. 9a shows the effect of Cu2S as an impurity in the photocatalytic efficiency, which indicates that the decolorization performance indicates an obvious reduction (29.2%). Table 2 lists the photocatalytic activates of some sulfide compounds in comparison with CuInS2. The results show that CuInS2 are a potential photocatalyst and it can compete with other related compounds for water treatment.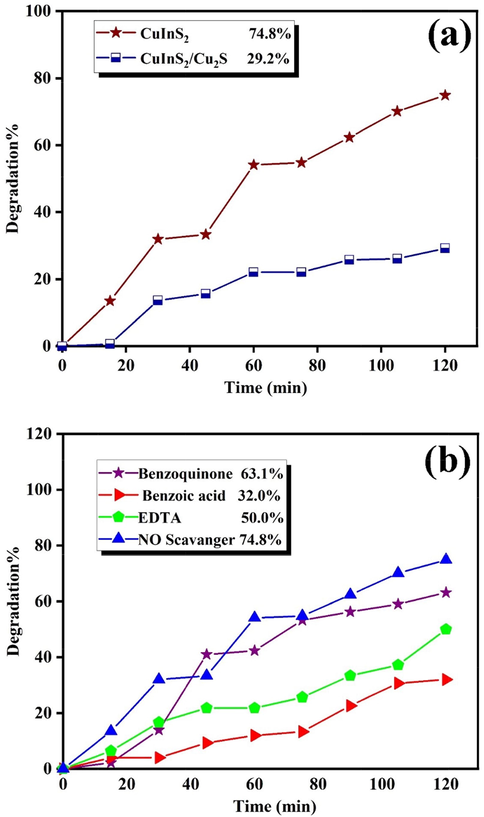
Photodecolorization of (a) CuInS2 and CuInS2/Cu2S, and (b) scavenger test over Erythrosine.
Sample
Highest decolorization (%)
Lowest decolorization (%)
Catalyst dosage (g)
Source of light
Ref.
CuInS2 nanostructures
74.8 (Ery)
53.2 (RhB)
0.02
Vis
This work
ZnIn2S4/CdIn2S4 nanocomposite
100 (RhB)
99.7 (MO*)
0.04
Vis
Mahdi et al., 2021
PS/ZnIn2S4 nanocomposites
86 (MO)
–
0.02
Vis
Sun et al., 2017
CdIn2S4 nanostructures
98 (MO)
–
0.05
Vis
Yuan et al., 2020
ZnS/CdIn2S4 nanocomposite
71 (RhB)
–
0.05
Vis
Mu et al., 2012
ZnS-ZnIn2S4 nanocomposites
97 (MB**)
34 (MB)
0.01
UV
Xu et al., 2013
CDs@-ZnIn2S4
100 (MO)
–
0.05
Vis
Janani et al., 2021
CuInS2 nanostructures
74.29 (RhB)
64.08 (MB)
0.1
Vis
Lei et al., 2019
CuInS2 nanostructures
65 (RhB)
–
0.1
Vis
Chumha et al., 2020
Three different scavengers, including BQ for O2•−, EDTA for h+, and (BA) for •OH, were used to remove the essential influential factors to evaluate the impact of active species in the photodecolorization of toxic pollutants (Mahdiani et al., 2018). As shown in Fig. 9b, the photodecolorization was scarcely decreased with the addition of 1,4-Benzoquinone as no scavenger was used. Regardless, when Benzoic acid and EDTA were used to remove •OH and h+, a notable decrease in photocatalytic efficiency was observed, which confirmed the influence of •OH and h+ on the photo-oxidation approach. In summary, the impacts of diverse scavengers showed that •OH and h+ recreated prominent parts, and O2•− recreated an insignificant part in Erythrosine decolorization. It is well established that the electrons of the conduction band (CB) and holes of the valence band (VB) are formed when the aqueous suspension of the catalyst is irradiated with light energy higher than its bandgap (1.53 eV) (Tang et al., 2014). The photogenerated electrons can reduce dye or react with electron acceptors, such as dissolved O2 in water or adsorbed on the surface of a catalyst and reduced it to O2•− (superoxide anion radical). The photogenerated holes can react with H2O or OH– and oxidize them into OH• radicals or oxidize the organic dyes to produce R+. They have been reported to be responsible for the photodegradation of organic dyes together with other high oxidant species (peroxide radicals). Several previous studies have reported on several reactions that take place in a photocatalytic process and involve H2O2, •OH and O2•−. Thus, the connected reactions at the CuInS2 surface driving the dye decolorization can be described as follows (Konstantinou and Albanis, 2004; Arabameri and Bashiri, 2021; Arabameri and Bashiri, 2022; Mohammed and Yousif, 2021; Yousif, 2021; Abdulsahib et al., 2021; Aljeboree et al., 2020; Aljeboree et al., 2021; Alshamusi et al., 2021; Ganduh et al., 2021; Ganduh et al., 2021; Jasim et al., 2022; Mahdi et al., 2021):
4 Conclusions
Pure and flower-like CuInS2 nanostructures were fabricated by a facile and rapid sonochemical procedure utilizing dithiooxamide as a sulfur reagent and various capping agents, including SDS, and PVP, which only demanded 10 min of ultrasonic irradiation. CuInS2 exhibited higher photocatalytic performance on Erythrosine than on two other dyes, which was ascribed to the electrostatic interaction between Erythrosine molecules and the positive charge on the surface of CuInS2. The scavenger tests revealed that h+ and •OH were responsible for the photodecolorization operation. The outcomes implied that the CuInS2 nanostructures could be a potential photocatalyst for the decolorization of toxic contaminants in sewage below visible rays. Besides, the sonochemical technique is desired to apply to the fabrication of other ternary chalcogenide nanostructures.
CRediT authorship contribution statement
Aazam Jafarinejad: Investigation, Formal analysis, Methodology, Writing – original draft, Software. Hadis Bashiri: Supervision, Project administration, Validation, Resources. Masoud Salavati-Niasari: Formal analysis, Methodology, Writing – review & editing, Writing – original draft, Conceptualization, Supervision, Project administration, Investigation, Data curation, Validation, Resources, Visualization, Funding acquisition.
Acknowledgement
The authors acknowledge the University of Kashan by Grant No (159271/AJ1 and 1143438/1) and Iran National Science Foundation (INSF, 97017837) for supporting this investigation.
Declaration of Competing Interest
The authors declare that they have no known competing financial interests or personal relationships that could have appeared to influence the work reported in this paper.
References
- Adsorption Study of Cephalexin Monohydrate Drug in Solution on Poly (vinyl pyrrolidone-acryl amide) Hydrogel Surface. Int. J. Drug Delivery Technol.. 2021;11(4):1169-1172.
- [CrossRef] [Google Scholar]
- Sonochemical synthesis and characterization of Cu2HgI4 nanostructures photocatalyst with enhanced visible light photocatalytic ability. Arabian J. Chem.. 2022;15:103536
- [Google Scholar]
- Effect of particle size on the photocatalytic activity of BiNbO4 under visible light irradiation. J. Phys.: Conf. Ser.: IOP Publish. 2016012017
- [Google Scholar]
- Adsorption of pollutants by using low-cost (Environment-Friendly): Equilibrium, kinetics and thermodynamic studies: A review. System. Rev. Pharm.. 2020;11(12):1988-1997.
- [CrossRef] [Google Scholar]
- Synthesis, characterization of p(Ch/aa-co-am) and adsorptive removal of pb(ii) ions from aqueous solution: Thermodynamic study. NeuroQuantology. 2021;19(7):137-143.
- [CrossRef] [Google Scholar]
- Adsorption of crystal violate (CV) dye in aqueous solutions by using P(PVP-co-AAM)/go composite as (eco-healthy adsorbate surface): characterization and thermodynamics studies. Biochem. Cell. Archiv.. 2021;21:2423-2431.
- [Google Scholar]
- Introduction of the Effective Photon Concentration Variable for Studying the Mechanism of Crystal Violet Photodegradation. Photochem. Photobiol. 2021
- [Google Scholar]
- A new approach to study the degradation of the organic pollutants by A-doped MxOy/B photocatalysts. Environ. Sci. Pollut. Res. 2022:1-25.
- [Google Scholar]
- Single Phase Formation of CuInS2 Nanoparticles: Structural, Morphological, Thermal Studies with Annealing Effect. J Appl Phys. 2013:4-6.
- [Google Scholar]
- Synthesis, spectroscopic characterization and thermal behavior of cadmium (II) complexes of S-methyldithiocarbazate (SMDTC) and S-benzyldithiocarbazate (SBDTC): X-ray crystal structure of [Cd (SMDTC) 3]· 2NO3. Polyhedron. 2008;27:3433-3438.
- [Google Scholar]
- Photocatalytic activity of CuInS2 nanoparticles synthesized via a simple and rapid microwave heating process. Mater. Res. Express. 2020;7:015074
- [Google Scholar]
- High-quality CuInS2/ZnS quantum dots for in vitro and in vivo bioimaging. Chem. Mater.. 2012;24:3029-3037.
- [Google Scholar]
- Selective spectrophotometric determination of 4-amino antipyrine antibiotics in pure forms and their pharmaceutical formulations. Int. J. Drug Delivery Technol.. 2021;11(2):371-375.
- [CrossRef] [Google Scholar]
- Spectrophotometric Determination of Metoclopramide-HCL in the Standard Raw and it Compared with Pharmaceuticals. J. Pharm. Negative Results. 2021;12(2):44-48.
- [CrossRef] [Google Scholar]
- Tl4CdI6 nanostructures: facile sonochemical synthesis and photocatalytic activity for removal of organic dyes. Inorg. Chem.. 2018;57:11443-11455.
- [Google Scholar]
- Synthesis of copper indium sulfide nanoparticles by solvothermal method. Mater. Lett.. 2009;63:1192-1194.
- [Google Scholar]
- Two-dimensional transition metal oxide and chalcogenide-based photocatalysts. Nano-micro Lett.. 2018;10:1-27.
- [Google Scholar]
- The efficiency of TiO2 nanotube photoanode with graphene nanoplatelets as counter electrode for a dye-sensitised solar cell. Int. J. Ambient Energy. 2022;43:1-8.
- [CrossRef] [Google Scholar]
- Electrochemical reduction of carbon dioxide using a copper rubeanate metal organic framework. ECS Electrochem. Lett.. 2012;1:H17.
- [Google Scholar]
- Potential of Ge-adopted Boron Nitride Nanotube as Catalyst for Sulfur Dioxide Oxidation. Prot. Met. Phys. Chem. 2019;55:671-676.
- [CrossRef] [Google Scholar]
- Facile one pot in situ synthesis of ZnS–ZnIn2S4 composite for improved photocatalytic applications. Mater. Sci. Semicond. Process.. 2021;122:105480
- [Google Scholar]
- Effective adsorptive removal of riboflavin (RF) over activated carbon. AIP Conf. Proc.. 2022;2386(2022):030030.
- [CrossRef] [Google Scholar]
- Thermomechanical reliability assessment of solder joints in a photovoltaic module operated in a hot climate. IEEE Trans. Components, Packag. Manuf. Technol.. 2020;10:160-167.
- [CrossRef] [Google Scholar]
- Sonochemical synthesis, characterization and investigation of the electrochemical hydrogen storage properties of TlPbI3/Tl4PbI6 nanocomposite. Int. J. Hydrogen Energy. 2021;46:6648-6658.
- [Google Scholar]
- TiO2-assisted photocatalytic degradation of azo dyes in aqueous solution: kinetic and mechanistic investigations: a review. Appl. Catal. B. 2004;49:1-14.
- [Google Scholar]
- Composition of CuInS2 thin films prepared by spray pyrolysis. Thin Solid Films. 2002;403:71-75.
- [Google Scholar]
- A comparative study on photocatalytic hydrogen evolution activity of synthesis methods of CDs/ZnIn2S4 photocatalysts. Colloids Surf., A. 2019;574:105-114.
- [Google Scholar]
- Self-assembled AgNP-containing nanocomposites constructed by electrospinning as efficient dye photocatalyst materials for wastewater treatment. Nanomaterials. 2018;8:35.
- [Google Scholar]
- Optimizing the synthesis of red-and near-infrared CuInS 2 and AgInS 2 semiconductor nanocrystals for bioimaging. Analyst. 2013;138:6144-6153.
- [Google Scholar]
- Enhanced photoelectrocatalytic degradation of 2, 4-dichlorophenoxyacetic acid by CuInS2 nanoparticles deposition onto TiO2 nanotube arrays. J. Alloys Compd.. 2011;509:2434-2440.
- [Google Scholar]
- Solution transformation of Cu2O into CuInS2 for solar water splitting. Nano Lett.. 2015;15:1395-1402.
- [Google Scholar]
- Synthesis, characterization and adsorption studies of a graphene oxide/polyacrylic acid nanocomposite hydrogel. NeuroQuantology. 2021;19(9):46-54.
- [CrossRef] [Google Scholar]
- Grafting of CuFe12O19 nanoparticles on CNT and graphene: eco-friendly synthesis, characterization and photocataly tic activity. J. Cleaner Prod.. 2018;176:1185-1197.
- [Google Scholar]
- A simple, step-by-step approach for the preparation of MoO3@g-C3N4 nanocomposite. J. Phys.: Conf. Ser.. 2021;1999:012159.
- [CrossRef] [Google Scholar]
- Facile preparation and visible light photocatalytic activity of CdIn2S4 monodispersed spherical particles. J. Alloys Compd.. 2012;513:506-509.
- [Google Scholar]
- A review of ZnO nanoparticles as solar photocatalysts: Synthesis, mechanisms and applications. Renew. Sustain. Energy Rev.. 2018;81:536-551.
- [Google Scholar]
- Facile fabrication of silver iodide/graphitic carbon nitride nanocomposites by notable photo-catalytic performance through sunlight and antimicrobial activity. J. Hazard. Mater.. 2020;389:122079
- [Google Scholar]
- Photocatalytic degradation of methylene blue by hydrothermally synthesized CZTS nanoparticles. J. Mater. Sci.: Mater. Electron.. 2017;28:8186-8191.
- [Google Scholar]
- Aquatic biodegradation of methylene blue by copper oxide nanoparticles synthesized from Azadirachta indica leaves extract. J. Inorg. Organomet. Polym Mater.. 2018;28:2455-2462.
- [Google Scholar]
- Multinary I-III-VI2 and I2-II-IV-VI4 semiconductor nanostructures for photocatalytic applications. Acc. Chem. Res.. 2016;49:511-519.
- [Google Scholar]
- Understanding TiO2 photocatalysis: mechanisms and materials. Chem. Rev.. 2014;114:9919-9986.
- [Google Scholar]
- Copper(II)–rubeanic acid coprecipitation system for separation–preconcentration of trace metal ions in environmental samples for their flame atomic absorption spectrometric determinations. J. Hazard. Mater.. 2006;137:1035-1041.
- [Google Scholar]
- Facile synthesis of hierarchical ZnIn2S4/CdIn2S4 microspheres with enhanced visible light driven photocatalytic activity. Appl. Surf. Sci.. 2017;407:328-336.
- [Google Scholar]
- Photocatalytic degradation of eriochrome black T using ammonium phosphomolybdate semiconductor. Int. J. Chem. Sci.. 2010;8:1580-1590.
- [Google Scholar]
- WO 3 nanostructures-based photocatalyst approach towards degradation of RhB dye. J. Inorg. Organomet. Polym Mater.. 2018;28:1107-1113.
- [Google Scholar]
- A novel AgIO4 semiconductor with ultrahigh activity in photodegradation of organic dyes: insights into the photosensitization mechanism. RSC Adv.. 2014;4:2151-2154.
- [Google Scholar]
- An efficient and recyclable nanocatalyst for the green and rapid synthesis of biologically active polysubstituted pyrroles and 1,2,4,5-tetrasubstituted imidazole derivatives. RSC Adv.. 2019;9:15966-15975.
- [CrossRef] [Google Scholar]
- Facile synthesis of ZnS–CdIn2S4-alloyed nanocrystals with tunable band gap and its photocatalytic activity. J. Lumin.. 2013;135:47-54.
- [Google Scholar]
- Environmentally sustainable disposal of expired albendazole medication and its role in the protection of mild steel. IOP Conf. Ser.: Earth Environ. Sci.. 2021;790:012072
- [CrossRef] [Google Scholar]
- A Comparison Between Functions of Carbon Nanotube and Reduced Graphene Oxide and Respective Ameliorated Derivatives in Perovskite Solar Cells. Macromol. Res.. 2020;28:425-432.
- [CrossRef] [Google Scholar]
- Electrochemical methods, sem-eds and afm studies for assessing corrosion inhibition of carbon steel in acidic media. ARPN J. Eng. Appl. Sci.. 2016;11:12619-12630.
- [Google Scholar]
- Fabrication of TiO2 nanotubes via three-electrodes anodization technique under sound waves impact and use in dye-sensitized solar cell. Egypt. J. Chem.. 2021;64:125-132.
- [CrossRef] [Google Scholar]
- Persulfate promoted ZnIn2S4 visible light photocatalytic dye decomposition. Int. J. Electrochem. Sci.. 2020;15:8761-8770.
- [Google Scholar]
- SCMNPs@Urea/Py-CuCl2: a recyclable catalyst for the synthesis of pyrano[2,3-d]pyrimidinone and pyrano[2,3-d] pyrimidine-2,4,7-trione derivatives. J. Coord. Chem.. 2020;73:558-578.
- [CrossRef] [Google Scholar]
- Significant visible photoactivity and antiphotocorrosion performance of CdS photocatalysts after monolayer polyaniline hybridization. J. Phys. Chem. C. 2010;114:5822-5826.
- [Google Scholar]


