

Translate this page into:
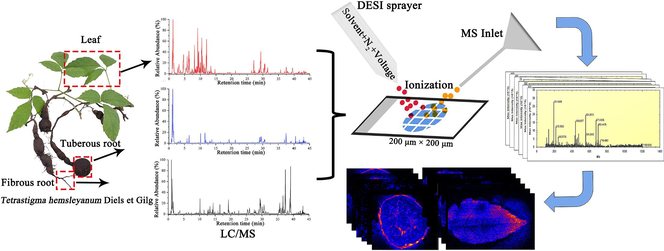
Spatial distribution of differential metabolites in different parts of Tetrastigma hemsleyanum Diels et Gilg by ultrahigh-performance liquid chromatography/mass spectrometry and desorption electrospray ionization mass spectrometry imaging
⁎Corresponding author. luyingyuan518@bjmu.edu.cn (Yingyuan Lu),
⁎⁎Corresponding author at: College of Pharmacy, Changchun University of Chinese Medicine, Changchun, 130117, China. pengfeitu@bjmu.edu.cn (Pengfei Tu)
-
Received: ,
Accepted: ,
This article was originally published by Elsevier and was migrated to Scientific Scholar after the change of Publisher.
Abstract
Abstract
Tetrastigma hemsleyanum Diels et Gilg (T. hemsleyanum) is a homology medicine and food that is rich in bioactive ingredients such as flavonoids and phenolic acids. A strategy that integrates ultrahigh-performance liquid chromatography–electrospray ionization mass spectrometry (UHPLC–ESI/MS) and desorption electrospray ionization mass spectrometry imaging (DESI-MSI) spatial metabolomics analysis was proposed and applied to different parts of T. hemsleyanum for the first time. A total of 132 compounds were tentatively identified, and 3, 7, and 24 components were found only in tuberous roots (TRs), fibrous roots (FRs), and leaves, respectively, using UHPLC–ESI/MS. The DESI-MSI results showed that the spatial distribution of flavonoids between the aerial and underground parts was diverse; for example, vitexin-2″-O-glucoside was largely localized in the epidermis and xylem of TRs, while a small amount was restricted to the xylem of the leaf margin and FRs. There was a higher abundance of most organic acids and flavonoids in the leaves than in the underground parts. Some flavonoids showed the same abundance in FRs and TRs, but the levels of most compounds were considerably higher in FRs. It is possible for leaves and FRs to become new medicinal parts of T. hemsleyanum. Through chemometrics statistics analysis, 19 key differential compounds in different parts of T. hemsleyanum were found, and the pharmacological mechanisms of the main differential metabolites were predicted by network pharmacology. This study provides a novel method for the medicinal development of T. hemsleyanum, showing its great potential in the development of medicinal resources.
Keywords
Mass spectrometry imaging
Desorption electrospray ionization
Tetrastigma hemsleyanum Diels et Gilg

1 Introduction
Tetrastigma hemsleyanum Diels et Gilg (T. hemsleyanum), a perennial liana plant from the Vitaceae family, is mainly distributed in southern China, especially in Zhejiang, Guangxi, and Yunnan Provinces (Gong et al., 2021). T. hemsleyanum is a homology medicine and food and was awarded as the new “Zhebawei” cultivar of traditional Chinese medicine (TCM) in Zhejiang Province in February 2018 (Wu et al., 2021). It contains abundant flavonoids, polysaccharides, terpenoids, phenolic acids, alkaloids, organic acids, and other chemical components (Ji et al., 2021). Modern studies have indicated that these compounds have anti-inflammatory, antibacterial, antiviral, antioxidant, and other effects (Sun et al., 2017a,b; Wang et al., 2023; Xiao et al., 2023; Chen et al., 2019). However, owing to the low number of wild T. hemsleyanum seeds, the germination rate is low and natural regeneration is slow. With a large number of people digging, wild T. hemsleyanum germplasm resources are gradually being depleted. At the same time, the yield of artificially planted T. hemsleyanum is limited due to the lack of familiarity with advanced planting theories and cultivation techniques, long planting period, which contribute to the short supply in the market (Hu et al., 2021). At present, only the tuberous roots (TRs) of T. hemsleyanum are used as medicine, and the chemical composition analysis of T. hemsleyanum focuses on the medicinal parts of the TRs (Li et al., 2021; Sun et al., 2017a,b); however, TRs only account for a small part of the dry weight of the whole plant (Wang et al., 2018). While the TRs are used in medicine, the other parts of the plant are often discarded, which not only wastes resources but also pollutes the environment (Li et al., 2021). The stems and leaves of T. hemsleyanum are used as livestock medicine in Zhejiang Province, but the chemical composition of the potential medicinal parts of the fibrous roots (FRs) and stem leaves has rarely been reported (Jiang et al., 2020). With the advancement of modern chemical analytical techniques and instruments, increasing number of studies are focusing on investigating its medicinal value based on the chemical compositions of different parts of the plant with the aim of solving the problem of resource scarcity.
Most analytical methods for determining chemical constituents are focused on high-performance liquid chromatography and nuclear magnetic resonance (Jiang et al., 2021; Gülcemal et al., 2013). However, application of these methods is limited because of their difficult sample preparation, lack of spatial distribution of the metabolites, and focus on the differences in the varieties and contents of TCM. Mass spectrometry imaging (MSI), a novel label-free and sensitive imaging technology, has been increasingly used for this purpose. MSI combines the multichannel detection capability of mass spectrometry (MS) and imaging technology, enabling the detection of thousands of analytes and providing spatial information at a nanometer to micrometer spatial resolution on the sample surface (Ifa et al., 2007; Lostun et al., 2015). Furthermore, sample preparation for MSI analysis can obtain spatial distribution profiles of metabolites in plants without comminuting the whole tissue (Hemalatha and Pradeep, 2013). According to the ionization mode, the MSI technology can be divided into secondary ion mass spectrometry imaging (SI-MSI), matrix-assisted laser desorption ionization (MALDI) MSI, and desorption electrospray ionization MSI (DESI-MSI). Although SI-MSI can provide nanometer-scale biomolecule imaging information in a lower m/z range, it is limited to low molecular–weight (<500 Da) applications because it tends to fragment molecules during the ionization process (Smeal and Wilkins, 2010). In the imaging analysis of small molecules, MALDI-MSI can suffer from matrix problems and ion cluster effect (Chen et al., 2023). DESI is an ambient ionization MS technique conducted at atmospheric pressure without a matrix; therefore, no matrix-related ion suppression is observed. It is more suitable for imaging of small-molecule compounds (Abdelhamid et al., 2014). As a valuable and unique tool for imaging the spatial distribution of metabolites, DESI-MSI has many advantages such as simple sample pretreatment, no vacuum system, no chromatographic separation, and convenient operation (Ren et al., 2023). At present, DESI-MSI has been developed to study the spatial distribution of metabolites in various plants, including Radix Puerariae (Guo et al., 2023), maize roots (Zhang et al., 2023a,b), Panax ginseng (Zou et al., 2024; Jiang et al., 2023) and Glycyrrhiza uralensis (Zhao et al., 2023).
In this study, an integrated method for spatial metabolomics and LC–MS was developed to analyze the metabolites differences in different parts of T. hemsleyanum. The metabolites of the aerial and underground parts of T. hemsleyanum were visualized using DESI-MSI for the first time. The spatial characteristics of various metabolites in different regions of the plant were imaged to determine the spatial distribution differences in different parts of T. hemsleyanum. Through chemometrics statistical analysis, 19 key differential metabolites were found in different parts of T. hemsleyanum. Combined with UHPLC–ESI/MS and network pharmacology, further qualitative, semiquantitative, and prediction of pharmacological mechanism analyses of the differential metabolites in the different parts of T. hemsleyanum were performed. Results showed that it is possible for the leaves and FRs to become new medicinal parts of T. hemsleyanum. The combination of DESI-MSI and UHPLC–ESI/MS provides an effective method for systematically comparing the metabolite differences in different parts of T. hemsleyanum through distribution, qualification, and semiquantification. This method is used to develop the medicinal value of different parts of the plant for the first time and provides a new means for the related fields.
2 Materials and methods
2.1 Reagents and plant materials
Methanol, acetonitrile, and formic acid (MS grade) were purchased from Fisher Scientific (Fair Lawn, NJ, USA). Distilled water vaporized at 105 °C was purchased from Watson’s Food & Beverage Co., Ltd. (Guangzhou, China). Fresh whole plant T. hemsleyanum was collected from Guangdong, China, including TRs, FRs, and leaves, and authenticated by Professor Pengfei Tu (Peking University, Beijing, China). Fresh T. hemsleyanum was placed in the refrigerator at 4 °C until analysis.
2.2 Sample preparation
After airing and drying, different sections of the TRs, FRs and leaves of T. hemsleyanum were pulverized into fine powder and passed through a 50 mesh sieve. 2.0 g of sample powder was soaked in 20 mL 70 % methanol (v/v) and further ultrasonically extracted at 25 °C for 60 min. After centrifugation at 8000 rpm for 10 min, the supernatant was filtered through a 0.22 μm polytetrafluoroethylene (PTFE) membrane to be determined.
The different parts of T. hemsleyanum were studied by two sample preparation methods: frozen sectioning and imprinting. Frozen sections of underground parts were prepared as follows: fresh underground parts, TRs, and FRs were stored at −80 °C until use; the frozen samples were embedded in 0.1 % gelatin solution and then transferred to a freezing microtome (Leica CM1950, Germany). When the gelatin solution became hard, the samples were sectioned with the 100 μm thick slices and were adhered to a glass slide, then stored at −80 °C until analysis. For aerial parts, samples were prepared to follow the protocol of Muller (Muller et al., 2011). Briefly, fresh leaves were placed between two PTFE membranes, then placed on a vise. They were compressed with high pressure for approximately 10 s to transfer metabolites to the membrane sandwich. Then the imprint of the plant leaves on porous PTFE was obtained and analyzed by DESI-MSI immediately afterwards.
2.3 UHPLC-ESI/MS analysis
Analysis was performed with an ExionLC™ AD UHPLC system (AB SCIEX, USA), equipped with a quaternary solvent manager, sample manager, column manager and photodiode array detector. A Waters ACQUITY UPLC BEH C18 column (2.1 × 100 mm, 1.7 μm) was maintained at 40 °C. The mobile phase consisted of 0.1 % formic acid (solvent A) and acetonitrile (solvent B) at a flow rate of 250 μL/min. The gradient elution conditions were as follows: 0–2 min, 5 % (B); 2–5 min, 5 %–10 % (B); 5–11 min, 10 %–18 % (B); 11–18 min, 18 %–40 % (B); 18–24 min, 40 %–50 % (B); 24–28 min, 50 %–60 % (B); 28–33 min, 60 %–70 % (B); 33–38 min, 70 %–90 % (B); 38–42 min, 90 %–100 % (B); and 42–45 min, 5 % (B). The injection volume was 3 μL. The aforementioned UHPLC system was coupled with an AB SCIEX Triple TOF 6600+ mass spectrometer via an ESI source (AB SCIEX, USA). MS was operated in negative ion mode. The source parameters were set as follows: Auxiliary Gas Pressure, 60 psi; Nebulizer Gas Pressure, 60 psi; Curtain Gas, 35 psi; Ion Source Temperature, 600 °C; IonSpray Voltage, −4500 V; Declustering Potential, −80 V; Collision energy, 40 ± 20 V. Data were collected in profile mode with scan ranges of m/z 50–1200 for MS1 and MS2.
2.4 DESI-MSI analysis
Imaging experiments were performed on a SYNAPT G2Si QTOF-MS mass spectrometer (Waters Corporation, Manchester, UK) with DESI XS ion source. The DESI source conditions used were as follows; Capillary voltage, 0.8 kV; Ion source temperature, 150 °C; Sampling cone, 40 V; Nitrogen flow rate, 0.02 Mpa; spray solvent, 90 % methanol (v/v); tip of spray to surface, 2 mm; tip to inlet distance, 6 mm. The angle between the sprayer and sample surface was set to 60°, the spatial resolution was 200 μm, and the spatial scanning rate was 400 μm/s. The mass scale was calibrated using 200 pg uL-1 leucine enkephalin as an external standard in the electrospray solvent during data collection. Data were acquired in the negative ion mode and the MSI data were acquired in sensitivity scan mode in the range of m/z 50–1200.
2.5 Network pharmacology
The active compounds in the differential metabolites of T. hemsleyanum were entered into the SwissTargetPrediction database (https://swisstargetprediction.ch/) (Daina, Michielin, & Zoete, 2019). The selected species were “Homo sapiens” and filtered for targets with probability > 0 to predict corresponding target proteins. The targets of the differential metabolites were obtained by integrating the target proteins and removing duplicate target proteins. The anti-inflammatory targets were searched in the GeneCards 5.18 database (https://www.genecards.org) (Stelzer et al., 2016), DrugBank database (https://go.drugbank. com/) (Wishart et al., 2017), and OMIM database (https://www.omim.org/). The target genes closely related to anti-inflammation were identified after merging the genes and removing the duplicate genes.
The interaction relationships between the targets were obtained using the STRING database (https://stringdb.org) (Szklarczyk et al., 2023) to discuss the potential association and mechanisms of the anti-inflammatory effects of differential compounds in T. hemsleyanum at the level of protein–protein interactions (PPI). The PPI relationships were imported into the Cytoscape 3.10.0 statistical software for visualization to obtain a PPI network. The encoded genes of the target proteins of T. hemsleyanum were imported into the DAVID 2021 database (https://david.ncifcrf.gov/summary.jsp) (Sherman et al., 2022) for GO enrichment analysis and KEGG pathway enrichment analysis. A threshold of P < 0.01 was set to filter the top-ranked biological processes and pathways, and the results of the GO and KEGG pathway enrichment analyses were presented as bar graphs and bubble charts.
2.6 Data analysis
DESI-MSI data were processed using the high-definition imaging 1.6 software (Waters Corporation, Manchester, UK). DESI-MSI data were processed by Simca 14.1 (Umetrics AB, Umea, Sweden) for multivariate statistical analysis. Unsupervised pattern recognition of different plant parts was applied using the principal component analysis (PCA) model. Orthogonal partial least squares discriminant analysis (OPLS-DA) was further conducted to screen the metabolic markers and determine the supervised pattern recognition among defined groups. Metabolites with variable importance in projection (VIP) values of ≥ 1 in the OPLS-DA model were considered as the potential chemical markers with high contributions. The raw UHPLC–ESI/MS data were processed using the PeakView software (version 1.2, AB SCIEX). An in-house database of T. hemsleyanum was established by searching the relevant literature and chemical database websites (Web of Science, PubChem, PubMed, CNKI, MassBank, etc.). Then, the database was imported into the AB Sciex OS software to extract and match the peaks of target compounds. The compounds finally identified in the sample were determined based on the results of a matching degree over 70 % and the reasonable fragmentation process of MS.
3 Results and discussion
3.1 Systematic characterization of the leaves, TRs, and FRs of T. hemsleyanum in the negative ESI mode
The medicinal parts of T. hemsleyanum are mainly TRs and FRs, and the aerial parts after planting and harvesting are rarely used, leading to a considerable waste of resources. It is necessary to explore the similarities and differences in the chemical compositions of different parts of the plant and identify more medicinal parts. Comprehensive multicomponent characterization of leaves, TRs, and FRs of T. hemsleyanum was performed by elucidating structures based on MS2 data to infer the fragmentation pathway and searching an in-house chemical database of T. hemsleyanum (for unknown compounds, by searching public databases, including Mass Bank, NIST, and ReSpect for phytochemicals). In addition, AB SCIEX OS enables identification and annotation of MS data using defined data processing methods and in-house libraries to generate component lists to aid in data interpretation. A total of 132 compounds were identified, and the information on these compounds is summarized in Table S1. UHPLC–ESI/MS analysis of the different parts of T. hemsleyanum shows the presence of prominent metabolites in the range of retention times (tR) of 0–45 min (Fig. S1). In detail, 95 compounds were characterized from TRs (involving 39 flavonoids, 13 phenolic acids and derivatives, 7 organic acids, 3 amino acids and derivatives, 14 fatty acids, and 19 others), 100 compounds from FRs (involving 38 flavonoids, 15 phenolic acids and derivatives, 8 organic acids, 5 amino acids and derivatives, 14 fatty acids, and 20 others), and 108 compounds from leaves (involving 41 flavonoids, 18 phenolic acids and derivatives, 8 organic acids, 3 amino acids, 13 fatty acids, 1 triterpene saponin, and 24 others). Here, only a few representative examples were provided to illustrate the structures.
3.1.1 Characterization of flavonoids
Flavonoids are a class of naturally occurring compounds with a basic structural unit of 2-phenylchromone, which comprises two benzene rings with phenolic hydroxyl groups connected by a central three-carbon atom (Zhang et al., 2014). A total of 55 flavonoids were characterized, including 39 from TRs, 38 from FRs, and 41 from leaves. Among these, 23 flavonoids were found to be common to all three parts. Compound 41 (tR 8.11 min; m/z 609.1512 for [M−H]–) was identified as luteolin-6-C-glucoside-8-C-arabinoside (C27H30O16). In Fig. 1a, the precursor ion at m/z 609.1512 ([M−H]–) could generate the product ions of m/z 519.1178 ([M−H−C3H6O3]–), m/z 489.1079 ([M−H−C4H8O4]–), m/z 429.0844 ([M−H−C6H12O6−H2O]–), m/z 399.0749 ([M−H−C4H8O4−C3H6O3]–), and m/z 369.0641 ([M−H−2C4H8O4]–). Among them, the fragment ions of m/z 519.1178, m/z 489.1079, and m/z 399.0749 were produced by the loss of C4H8O4 (120 Da) or C3H6O3 (90 Da) due to the continuous ring-opening cleavage of hexose six-membered rings. The fragment ion of m/z 429.0844 was obtained due to the loss of one molecule of glucose residue and one molecule of water by the precursor ion. Similarly, compound 66 (tR 10.78 min, m/z 563.1430 for [M−H]–) exhibits the same fragmentation mode as compound 41. The ring-opening cleavage of the sugar ring is a characteristic form of cleavage for carbon glycosides, typically manifesting as the neutral loss of C4H8O4 or C3H6O3 in hexose and the neutral loss of C3H6O3 or C2H4O2 in pentose. This type of fragmentation pathway can provide important evidence for the identification and structural identification of flavonoid glycosides. By matching with the in-house database, compound 66 was tentatively characterized as vicenin 1 (isomer) (Fig. 1b). Compound 57 was characterized as kaempferol-3-O-apiofuranoside-7-O-rhamnosylglucoside. In Fig. 1c, the molecular formula of the precursor ion observed at m/z 725.1963 was inferred as C32H38O19. In the MS2 spectrum, the product ions with m/z 579.1412, 430.0918, and 285.0373, could be characterized as the [M–H–C6H10O4]−, [M–H–C6H10O4–C5H8O4–OH]− and [M–H–C6H10O4–C5H8O4–C6H10O5]− ions, respectively. The precursor ion lost one molecule of rhamnose to generate the fragment ion with m/z 579.1412 and one molecule of apiofuranoside to generate the fragment ion with m/z 430.0918, and the characteristic fragment ion with m/z 285.0373 was further generated by losing a glucose molecule. Another compound 75 (tR 11.93 min, m/z 609.1466 for [M–H]−) was tentatively characterized as rutin (C27H30O16) by referring to the in-house library of T. hemsleyanum (Fig. 1d).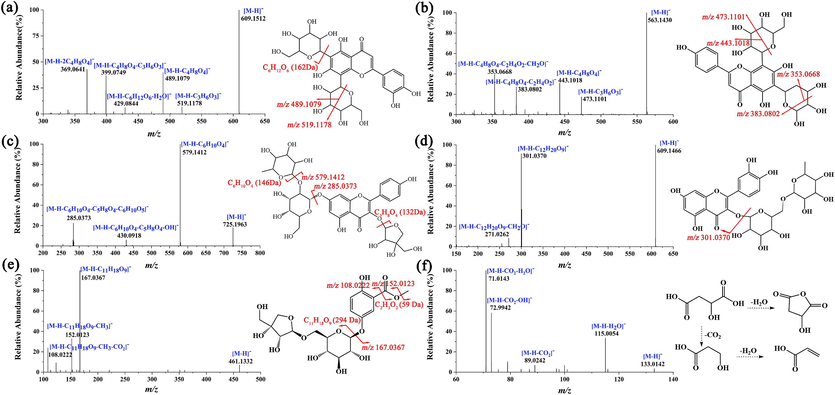
MS/MS spectra and fragmentation pathways of (a) luteolin-6-C-glucoside-8-C-arabinoside, (b) vicenin 1, (c) kaempferol-3-O-apiofuranoside-7-O-rhamnosylglucoside, (d) rutin, (e) saccharumoside C, and (f) malic acid.
3.1.2 Characterization of phenolic acids and derivatives, organic acids, and fatty acids
A total of 21 phenolic acids were characterized, with 13 from TRs, 15 from FRs, and 18 from leaves. Among these, 12 phenolic acids were identified across all three parts. The regular fragmentation pathway of phenolic acid involves the neutral loss of CO2 and the loss of the side chain on the benzene ring, which could be observed in the MS2 spectra of compounds 20 (Fig. 1e) and compound 18 (Fig. S2a). Compound 20 (tR 3.71 min, m/z 461.1332 for [M−H]–) was characterized as saccharumoside C (C19H26O13) by comparison with the literature (Sun et al., 2015). Its MS2 spectrum (Fig. 1e) displayed fragment ions at m/z 167.0367, m/z 152.0123, and m/z 108.0222, assigned to [M–H–C11H18O9]−, [M–H–C11H18O9–CH3]− and [M–H–C11H18O9–CH3–CO2]−, respectively. Similarly, compound 18 (tR 3.26 min, m/z 431.1193 for [M−H]−) exhibited the same fragmentation mode as compound 20. As shown in Fig. S2a, the precursor ion lost the side chain on the benzene ring (C11H18O9) to generate a fragment ion with m/z 137.0254, and then, the neutral loss of CO2 generated a fragment ion with m/z 93.0338. Therefore, compound 18 was suggested as apiosylglucosyl-4-hydroxybenzoate based on the public database.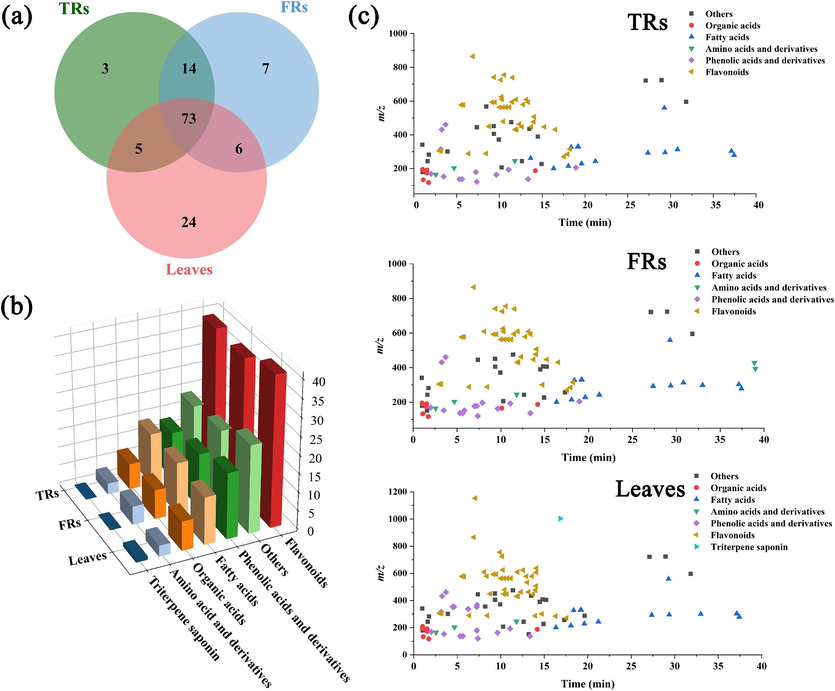
Global summary of the structural features of 132 compounds characterized in TRs, FRs, and leaves. (a) Venn diagram of the overlapping metabolites in TRs, FRs, and leaves from T. hemsleyanum; (b) three-dimensional histogram showing the number of compound in TRs, FRs, and leaves from T. hemsleyanum; (c) two-dimensional scatter plots of all compounds in TRs, FRs, and leaves from T. hemsleyanum based on tR and m/z.
A total of 9 organic acids were characterized in the aerial and underground parts of T. hemsleyanum. Compounds 3, 4, 5, 6, 7, 8, 11, 56, and 98 were identified as gluconic acid, mucic acid, quinic acid, malic acid, aconitic acid, citric acid, succinic acid, 3-phenyllactic acid, and azelaic acid, respectively (Table S1). The the MS2 spectra of compounds 6 (tR 1.10 min, m/z 133.0142 for [M−H]−) and 11 (tR 1.73 min, m/z 117.0192 for [M−H]−) are shown in Fig. 1f and Fig. S2b, respectively. In the MS2 spectra, compounds 6 and 11 exhibited their product ions at m/z 115.0036, 71.0143 and m/z 99.9238, 55.0199, respectively, which can be explained by the loss of one molecule of H2O and the subsequent loss of one molecule of CO2. A total of 15 fatty acids were identified or tentatively characterized, of which 8 were unsaturated fatty acids and 7 were saturated fatty acids (Table S1). Among them, two saturated fatty acids, compounds 112 (tR 18.06 min) and 120 (tR 21.23 min), exhibited precursor ions [M−H]− at m/z 215.1294 and 243.1605 with molecular formulas of C11H20O4 and C13H24O4, respectively. In Fig. S2c, compound 112 afforded the main product ions at m/z 197.1184, 153.1277, 99.9278, and 57.0339, assigned to [M–H–H2O]−, [M–H–H2O–CO2]−, [M–H–H2O–CO2–C3H2O]−, and [M–H–H2O–CO2–C3H2O–C3H6]−, respectively. Thus, compound 112 was tentatively characterized as undecanedioic acid. Because the fragmentation mode of compound 120 was similar to that of compound 112, based on the MS2 spectrum (Fig. S2d) that compound 120 was suggested as tridecanedioic acid.
3.1.3 Characterization of other compounds
Twenty-six other compounds were detected in the TRs, FRs, and leaves of T. hemsleyanum. As shown in Fig. S2e, compound 123 (tR 28.95 min, m/z 723.3809 for [M + HCOO]−), with product ions at m/z 415.1454, 397.1363, and 279.2337, which were assigned to [M–H–C18H30O]−, [M–H–C18H30O–H2O]− and [M–H–C18H30O–H2O–C5H10O3]−, respectively, was tentatively identified as gingerglycolipid B (C33H58O14). In the MS2 spectrum (Fig. S2f), compound 69 (tR 11.40 min, m/z 475.1819 for [M−H]−) was tentatively characterized as darendoside B (C21H32O12). Interestingly, compounds 79 (tR 12.64 min, m/z 243.0668 for [M−H]−) and 102 (tR 14.93 min, m/z 227.0714 for [M−H]−) were tentatively characterized as piceatannol (C14H12O4) and resveratrol (C14H12O3), respectively, showing potent anticancer and anti-inflammatory activities (Banik et al., 2020; Cui et al., 2022). Finally, a total of five amino acids and derivatives (compounds 14, 24, 73, 131, and 132) were tentatively identified in the T. hemsleyanum, and only one triterpene saponin (compound 108) was detected in the leaves.
3.1.4 Comprehensive characterization of the multicomponents of TRs, FRs, and leaves from T. hemsleyanum
In total, 132 compounds from T. hemsleyanum were tentatively identified, as listed in Table S1, including 95 compounds from TRs, 100 compounds from FRs, and 108 compounds from leaves. Among these compounds, 3, 7, and 24 compounds were found in TRs, FRs, and leaves, respectively. The remaining 73 compounds were common constituents in these three parts (Fig. 2a). Notably, compared with the underground parts, the aerial parts exhibited higher number of compounds. As shown in Fig. 2b, the compounds identified in FRs, TRs, and leaves from T. hemsleyanum were remarkably different in structure categories. According to the three-dimensional histogram (Fig. 2b), the quantity of flavonoids occupies a large proportion. Phenolic acids, other compounds, and fatty acids are ranked the second most abundant, while organic acids and amino acids are third most abundant. Among them, flavonoids and phenolic acids are the main bioactive components in T. hemsleyanum with anti-inflammatory, antioxidation, antibiosis, and anticancer activities (Zhang et al., 2023a,b; Shahidi and Yeo, 2018). Meanwhile, a two-dimensional scatter plot of all the components identified from T. hemsleyanum has been plotted between tR and m/z, in which different categories of compounds display certain features (Fig. 2c). Owing to the greater polarity and weakened retention on the RP column, most compounds such as flavonoids, phenolic acids, and organic acids outflow with tR < 20 min under the current chromatographic conditions. Conversely, fatty acids that are less polar tend to have longer retention time compared to most other components. These characteristics depict the overall structural features that indicate the chemical complexity of T. hemsleyanum. To obtain more reliable differential metabolites among the three parts of T. hemsleyanum, we further analyzed the spatial metabolomics of the samples.
3.2 Visualization and spatial distribution analysis of different plant parts of T. hemsleyanum
DESI-MSI analysis was performed on the aerial and underground parts of the plant. The thickness of the underground part sections was preliminarily optimized. Root tissue contains a significant amount of starch. When the slice thickness was sufficiently thin (less than 100 μm), under low temperature conditions, the starch content in the tissue could cause the root slices to fragment, preventing the formation of complete slices. This fragmentation could affect the overall imaging quality of subsequent sections. When the thickness of the section was set at 100 μm, a complete tissue section could be formed. Therefore, the tissue section of 100-μm thickness was used for DESI-MSI analysis. Based on the DESI-MSI scanning data of different parts of T. hemsleyanum, the spatial distribution of various metabolites could be observed in the negative ion mode. By comparing the DESI-MSI data with the LC–MS data (Table S1), some metabolites could be preliminarily confirmed. The DESI-MSI results revealed that the distribution of metabolites in different parts was different. The recorded mass spectra were converted into two-dimensional ion images using a color intensity scale, and the relative ion intensity was indicated by the color intensity. Yellow represents high relative concentration and blue represents low relative concentration.
PTFE imprinting was chosen in the DESI experiment of leaves, because it can effectively transfer abundant nonvolatile molecules and has been shown to be a suitable carrier for leaf metabolite detection under a DESI sprayer (Wu et al., 2022). An optical image of the leaf is shown in Fig. 3a, and the structure includes the blade, apex, and petiole. The negative mass spectra of leaves are shown in Fig. 3b. Good DESI-MS images were obtained from the leaves, as displayed in Fig. 3c. For the leaves, phenolic acids, organic acids, and flavonoids composed the majority of the metabolites detected in the negative ion mode. The observed compounds are 3-caffeoylquinic acid (m/z 353.08) or isomers, shanzhiside methyl ester (m/z 454.14), coumaroyl quinic acid (m/z 337.09), berbamunine (m/z 595.28), procyanidin trimer (m/z 865.20), and apigenin-6-C-arabinopyranosyl-8-C-xylopyranoside (m/z 533.13). Specifically, berbamunine (m/z 595.28) was found only in the leaf petiole. Shanzhiside methyl ester (m/z 454.14) was present in higher abundance in the leaf apex, while coumaroyl quinic acid (m/z 337.09), procyanidin trimer (m/z 865.20), and apigenin-6-C-arabinopyranosyl-8-C-xylopyranoside (m/z 533.13) were uniformly distributed on the upper side of the leaf blade (Fig. 3c). Interestingly, 3-caffeoylquinic acid (m/z 353.08) was evenly distributed on both sides of the leaf.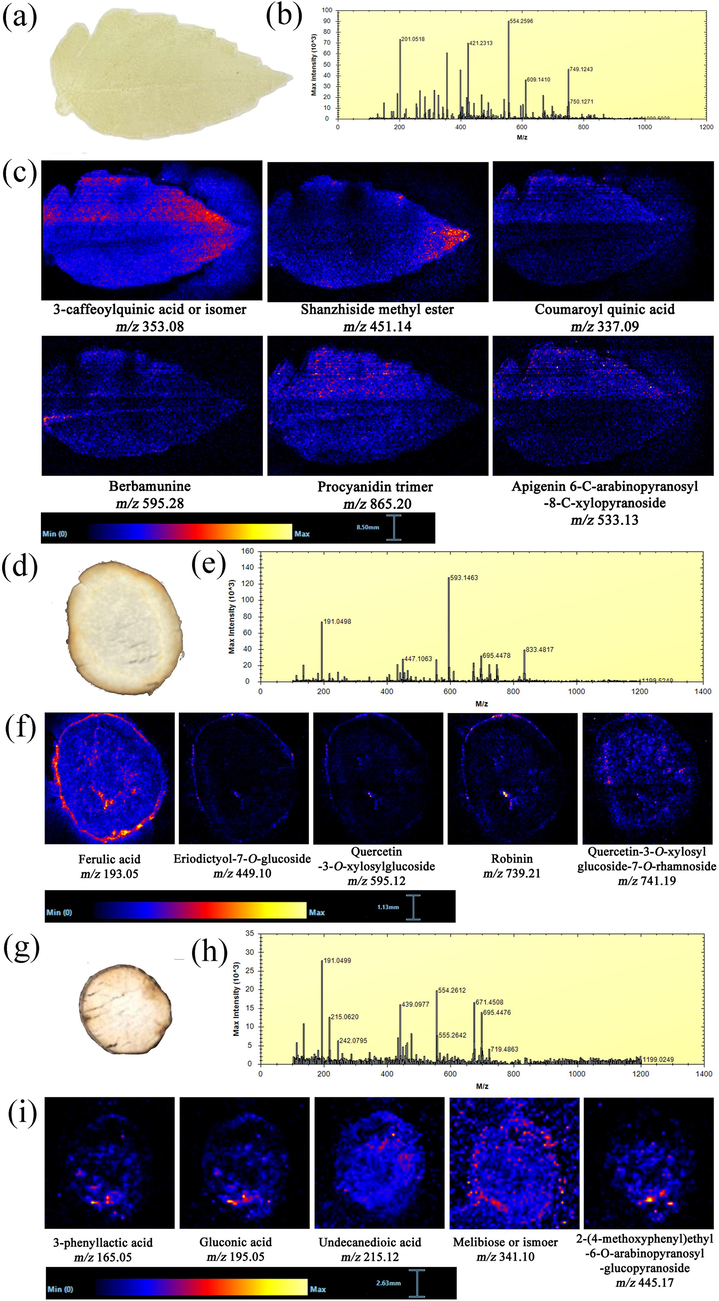
(a) Optical image of the leaf section. (b) Negative mass spectra of leaves by imprint DESI-MSI. (c) MS images of some representative compounds in leaves detected by DESI-MSI in the negative ion mode. (d) Optical image of the TR section. (e) Negative mass spectra of TRs by imprint DESI-MSI. (f) MS images of some representative compounds in TRs detected by DESI-MSI in the negative ion mode. (g) Optical image of the FR section. (h) Negative mass spectra of FRs by imprint DESI-MSI. (i) MS images of some representative compounds in FRs detected by DESI-MSI in the negative ion mode.
For the underground parts, cross sections of the TRs and FRs of T. hemsleyanum showed distinct spatial distribution patterns of various ions. There is no considerable difference in structure between the two underground parts (TRs and FRs), including periderm, phloem, and xylem. Most of the phenolic acids and flavonoids were present in TRs and showed tissue-specific localization (Fig. 3f). As important bioactive compounds in TRs, flavonoids such as eriodictyol-7-O-glucoside (m/z 449.10), quercetin-3-O-xylosylglucoside (m/z 595.12), robinin (m/z 739.21), vitexin (m/z 431.10), and quercetin-3-O-xylosylglucoside-7-O-rhamnoside (m/z 714.19) were present in the cortex and xylem. Similarly, ferulic acid (m/z 193.05) was particularly abundant in the cortex, but it was also prominent in the xylem (Fig. 3f). FRs contained, caffeic acid (m/z 179.03), isoorientin-4′-O-xyloside (m/z 579.13), and 2-(4-methoxyphenyl)ethyl-6-O-arabinopyranosyl-glucopyranoside (m/z 445.17) with a localization pattern similar to that in TRs (Fig. 3i). By contrast, carbohydrates are the key metabolites for plant growth and defense, and melibiose was found in almost all the regions of FRs sections (Fig. 3i). FRs also contained a small amount of organic acids. As shown in Fig. 3i, 3-phenyllactic acid (m/z 165.05), gluconic acid (m/z 195.05), and undecanedioic acid (m/z 215.12) were distributed in the phloem and xylem. Interestingly, two flavonoids, vitexin (m/z 431.10) and isoquercitrin (m/z 463.08), existed in almost all the areas of FRs, but only in the epidermis and xylem of TRs (Fig. S3). In conclusion, most of the flavonoids are higher in the epidermis and lower in the phloem. The content of flavonoids in xylem is higher near the phloem and gradually decreases from the outside to the inside of the xylem.
The DESI-MS images of the common metabolites in leaves, TRs, and FRs are shown in Fig. 4. In DESI-MSI, flavonoids are active metabolites in T. hemsleyanum with multiple pharmacological activities, showing diversity in the spatial distribution between the aerial parts and underground parts (Fig. S3 and Fig. 4). For example, as shown in Fig. 4, vitexin-2′'-O-glucoside (m/z 593.15) exhibited antioxidant and other pharmacological effects (Wei et al., 2014) and mainly accumulated in the epidermis and xylem of TRs, whereas a small amount was distributed in the xylem of the leaf margin and FRs. Compared with the underground parts, more types of compounds were detected in the aerial parts, among which organic acids and phenolic acids were the main compounds. Phenolic acids show significant pharmacological activities such as antitumor, anti-inflammatory, antiviral, and immunoregulatory effects, enriched on the leaf surface (Zhang et al., 2014). Flavonoids are rich in the blade, apex, and margin of leaves because they contribute to protecting plants against oxidation and ultraviolet radiation (Peng et al., 2017; Dai et al., 2019). The inconsistent spatial distribution of different compounds reveals that their biosynthetic pathways may differ in T. hemsleyanum (Tong et al., 2022). Notably, the principle of DESI-MSI is to record the spatial intensity distribution directly from tissue sections without the need for further separation process under LC; therefore, it is not able to differentiate isomers that have the same fragments in the same pixel (Liao et al., 2019). This is one of the DESI-MSI technique issues that need to be solved in the future.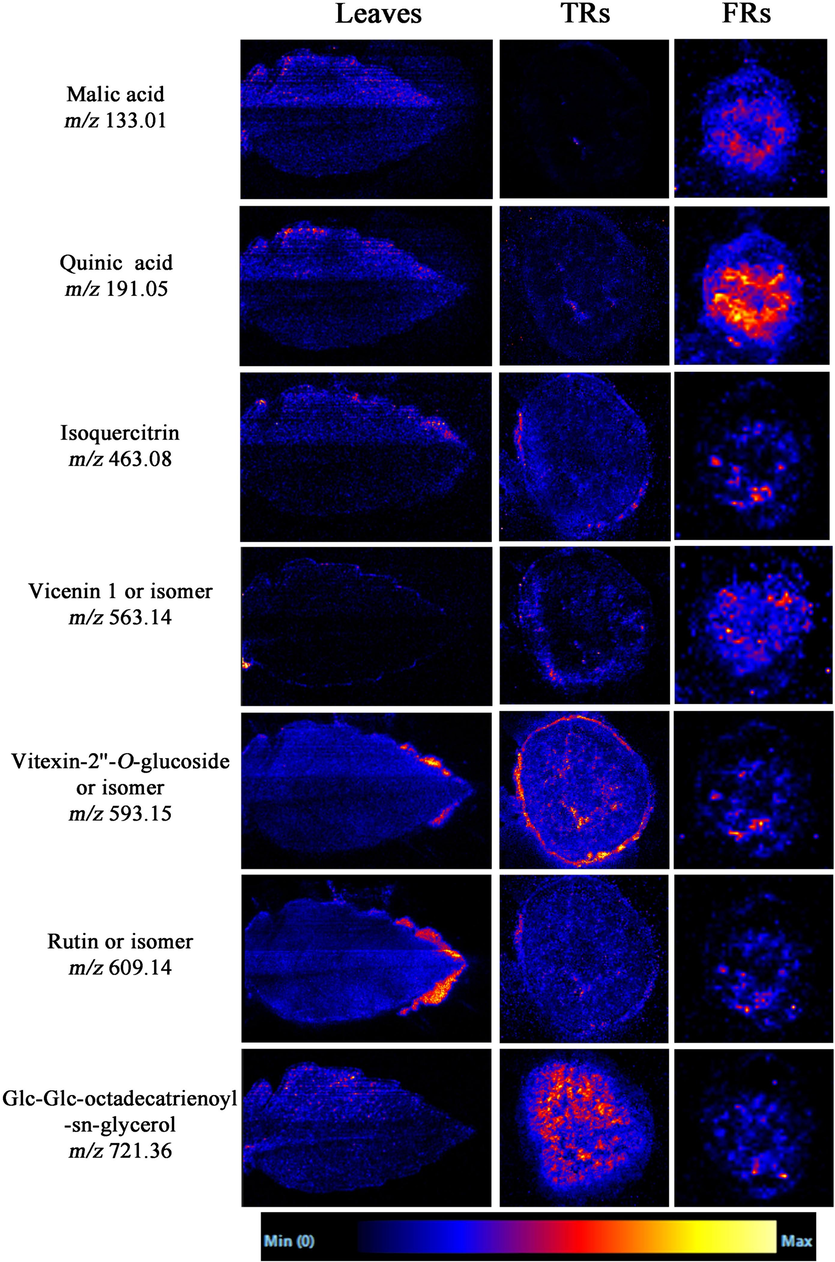
MS images of some common compounds in aerial and underground parts detected by DESI-MS in the negative ion mode.
3.3 Spatial distribution difference of between the metabolites in different parts of T. hemsleyanum
Chemometrics analysis was applied to quantify the metabolic differences between different parts of T. hemsleyanum. Six regions of interest were selected for each section (leaves, TRs, and FRs) to extract the raw ion intensity data, and then, recognition chemometrics was performed via PCA and OPLS-DA (Worley and Robert, 2013). As an unsupervised dimensionality reduction algorithm, PCA can transform multiple indicators into a few principal components while preserving as much of the variability of the original data as possible. In the score plot of PCA (Fig. S4), the samples of FRs and leaves were tightly clustered around the center region, which could indicate good quality of the multibatch data. Within the 95 % confidence interval, there was an outlier (TR-6) in the TR sample data, but it did not affect the distinction between the three groups of samples. Three remarkable clusters representing leaves, TRs, and FRs were well grouped, demonstrating their significant chemical differences. The values of R2X (cum) = 0.831 and Q2 (cum) = 0.639 could show the acceptability, fitness, and predictability of the PCA model. OPLS-DA is a supervised statistical method for discriminant analysis. It uses partial least squares regression to establish a model of the relationship between the expression of metabolites and sample categories, so as to predict the sample categories. Supervised OPLS-DA (Fig. 5a) was further applied for the discovery of potential markers. Results showed that the OPLS-DA analysis could clearly distinguish the three parts of T. hemsleyanum, and the fitted OPLS-DA exhibited good fitness (Q2 = 0.978) and predictability (R2X = 0.812; R2Y = 0.991). Furthermore, the models were validated using 200 permutations (Fig. 5b). The R2 and Q2 values of all substitution tests were lower than the original values of the established model, and the intercept of the regression line of the Q2 points on the y-axis was negative, indicating that the OPLS-DA model was not overfitted. VIP can reveal the importance of each variable to the observed clustering so that potential markers can be discovered. The difference markers between any two groups were screened via VIP analysis results combined with the S-plot. The result of the S-plot is shown in Fig. 5c. A total of 269 ions showed VIP > 1, and when VIP was set at 1.0 and P < 0.05, 167 major differential ions were obtained. By comparing the LC–MS data, 167 differential ions could be assigned as 19 potential marker compounds. Detained information for these 19 potential markers is provided in Table S2. A heatmap showing the content variations of these 19 differential compounds is provided to highlight differences in the compound levels among samples. By contrast, these differences were mainly concentrated in organic acids, flavonoids, and other compounds. These compounds were found in different parts of T. hemsleyanum, but their contents and types were obviously different. As shown in Fig. 5d, flavonoids were detected in all the plant parts as the major bioactive metabolites. However, the contents of some flavonoids were upregulated in leaves and FRs and downregulated in TRs. However, differences in the contents of the three parts should be quantitatively elucidated using other techniques.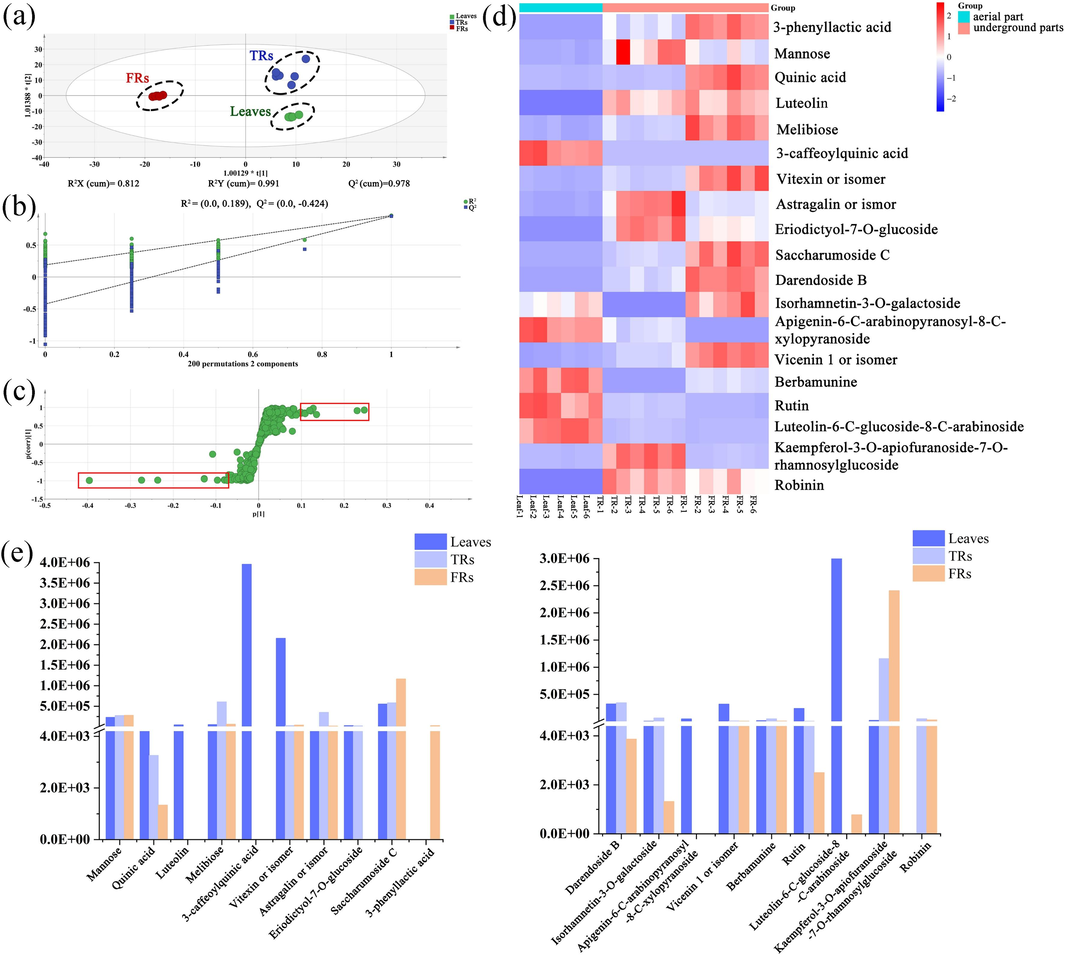
Multivariate statistical analysis of different sample parts of T. hemsleyanum to unveil differentiated ions. (a) Score plots of OPLS-DA. (b) 200 random permutation tests of the OPLS-DA model. (c) S-plot of OPLS-DA. (d) Heatmap visualizing 19 differentiated ions. (e) Relative intensities of 19 representative metabolites in leaves, FRs, and TRs based on UHPLC–ESI/MS.
Because MSI is a semiquantitative technique, the contents of differential compounds were analyzed by UHPLC–ESI/MS for determination of relative contents in different parts of T. hemsleyanum. As there are no pure standards for absolute quantitation, the LC–MS/MS results are expressed as relative peak areas of the different compounds. The bar chart of the 19 different metabolites analyzed by LC–MS (Fig. 5e) showed a higher abundance of most organic acids and flavonoids, such as quinic acid, 3-caffeoylquinic acid, luteolin, vitexin, and rutin in the leaves than in the underground parts. However, some flavonoids showed no content differences in FRs and TRs, but the levels of most compounds were significantly higher in FRs than in TRs, such as saccharumoside C, 3-phenyllactic acid, and kaempferol-3-O-apiofuranoside-7-O-rhamnosylglucoside. These results thus confirm the findings from the DESI images. However, the results of some differential compounds in UHPLC were slightly different from DESI, which may be related to the thickness of the sample. The results of UHPLC–ESI/MS and DESI-MSI showed that most differential metabolites of leaves revealed a more abundant content and types than those of the underground parts. Notably, FRs are not inferior to TRs with regard to the types and contents of flavonoids, and the contents of some flavonoids are much higher in FRs than in TRs.
3.4 Network pharmacological analysis of dominant differential metabolites in T. hemsleyanum
By analyzing 19 different metabolites, the active metabolites of T. hemsleyanum were screened using SwissADME. Seven prominent differential metabolites with high contents and activities were screened in the FRs and leaves. These seven prominent differential metabolites may have advantages in the development of medicinal parts; therefore, their potential anti-inflammatory effects were predicted via network pharmacology. The target proteins of seven differential metabolites in T. hemsleyanum were predicted using SwissTargetPrediction (https://swisstargetprediction.ch/) with probability > 0. After removing all repeated genes, a total of 164 predicted targets were obtained. The GeneCards database (https://www.genecards.org) was used to identify potential anti-inflammatory targets with a correlation score of ≥ 3.50, and 1,723 related targets were obtained. Combined with OMIM (https://www.omim.org/) and DrugBank (https://go.drugbank.com/) databases, related targets were supplemented, and 1,808 anti-inflammatory targets were finally obtained. The “component–target” network of T. hemsleyanum was visualized using Cytoscape (3.10.0) to process the effective compound–target information for the prominent differential metabolites of T. hemsleyanum (Fig. S5a). The PPI network map was visualized using Cytoscape (3.10.0), and the results showed that targets with ≥ 60 degrees were TNF, AKT1, CXCL8, EGFR, ESR1, GSK3B, HSP90AA1, MMP2, MMP9, PTGS2, SRC, FGF2, and KDR, revealing that these targets play an important role in the PPI network map and may be the key targets for T. hemsleyanum to exert its anti-inflammatory effects (Fig. S5b).
A total of 88 common targets were obtained by intersecting the active component targets of T. hemsleyanum with the anti-inflammatory targets. The DAVID database (https://david.ncifcrf.gov/) was used to perform GO functional enrichment and KEGG pathway enrichment analysis for the 88 targets. GO function analysis and KEGG pathway analysis were statistically significant at P < 0.01. The GO functional analysis generated a total of 568 entries, of which 244 entries were statistically significant, with 169 entries for biological process (BP), 26 entries for cellular component (CC), and 49 entries for molecular function (MF). As shown in Fig. 6a, the top 15 entries were selected for bioinformatics visualization based on the combined criteria of p-value and gene-enrichment count. The results indicated that BP was primarily involved in signal transduction, positive regulation of transcription from RNA polymerase II promoter, negative regulation of the apoptotic process, positive regulation of cell proliferation, positive regulation of protein kinase B signaling, and so on. The nucleus, plasma membrane, cytoplasm, cytosol, membrane, nucleoplasm, extracellular space, etc., were the primary components of CC in the GO functional analysis. MF mainly comprised protein binding, ATP binding, identical protein binding, enzyme binding, protein homodimerization activity, zinc ion binding and protein kinase activity. A total of 71 pathways were obtained via KEGG pathway enrichment analysis, and the top 20 pathways were visualized. As shown in Fig. 6b, the majority of KEGG pathway analysis topics include cancer pathways, PI3K-AKT signaling pathway, chemical carcinogenesis–receptor activation, EGFR tyrosine kinase inhibitor resistance, Rap1 signaling pathway, etc. Rap1 signaling pathway plays an important role in cell biology, involving many key processes such as cell growth, differentiation, cytokine synthesis and chemotaxis. Rap1 is related to fatty acid metabolism and cardiac pathology related to aging, and may be a therapeutic target to prevent or alleviate cardiac aging (Cai et al., 2021). Optimized New Shengmai Powder could regulate the effect of Rap1A on cAMP/Rap1A signaling pathway, thus inhibiting the proliferation of cardiac fibroblasts and reducing the excessive secretion of collagen, and effectively improving the cardiac function and ventricular remodeling in rats with heart failure (Zhang et al., 2024).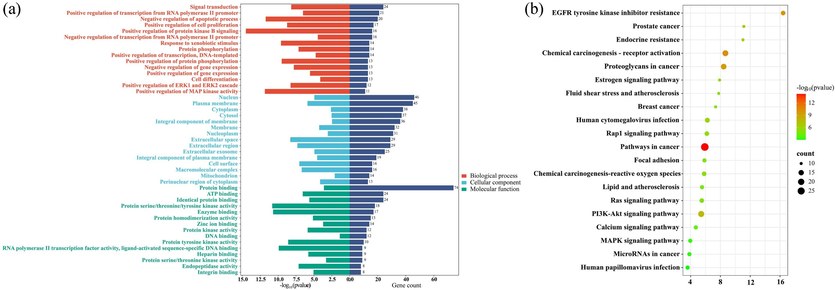
(a) GO biofunctional enrichment analysis of key targets of anti-inflammatory effect of T. hemsleyanum; (b) Bubble map of KEGG enrichment pathways.
According to the screening of 19 differential metabolites of T. hemsleyanum, seven metabolites with significant differences in content were screened out from FRs and leaves, and the main active differential metabolites in different parts of T. hemsleyanum were flavonoids and phenolic acids. The key targets and possible pathways of seven prominent differential metabolites of T. hemsleyanum were analyzed via network pharmacology, showing that it might act on TNF, AKT1, CXCL8, EGFR, ESR1, GSK3B, HSP90AA1, MMP2, MMP9, PTGS2, SRC, FGF2, and KDR to exert their anti-inflammatory effects. However, the difference between the composition and pharmacological activities of the effective substances, as well as the anti-inflammatory pathway targets of T. hemsleyanum, still requires further experimental validation.
4 Conclusion
All in all, results of this study show that the quality of leaves, TRs, and FRs of T. hemsleyanum is obviously different and the contents of some metabolites in these parts are significantly different. A total of 132 compounds were tentatively characterized in the three parts of T. hemsleyanum by UHPLC–ESI/MS, including 73 common components. The distribution of some metabolites was characterized by DESI-MSI, revealing tissue specificity in T. hemsleyanum. Some metabolites exhibited different distributions and abundance between the three parts. In the underground parts, most phenolic acids and flavonoids were found in the cortex and xylem and showed tissue-specific localization. Furthermore, through PCA, OPLS-DA, VIP values and S-plot analysis, 19 compounds could be used as active ingredient markers to distinguish the different parts. The relative quantitative analysis of 19 different compounds by UHPLC–ESI/MS showed that the contents of many flavonoids and phenolic acids in leaves were significantly higher than those in the underground parts, and the contents of some flavonoids were much higher in FRs than in TRs. Then, network pharmacology was used to predict the pharmacological mechanisms of the high-content metabolites in FRs and leaves. Seven prominent active metabolites were identified, revealing that the seven metabolites may be closely related to TNF, AKT1, CXCL8, EGFR, ESR1, GSK3B, HSP90 AA1, MMP2, MMP9, PTGS2, SRC, FGF2, and KDR to exert anti-inflammatory effects.
In conclusion, a novel method for identifying other medicinal parts of T. hemsleyanum was established by combining spatially resolved metabolomics with LC–MS. The results show that rich types of active metabolites exist in each part of the plant and the leaves and FRs may be considered as the medicinal parts of T. hemsleyanum. The results of this study provide reference for developing the resources of T. hemsleyanum promoting quality control of metabolites in different parts of T. hemsleyanum as well as lay a foundation for rational development and utilization of its resources.
CRediT authorship contribution statement
Sijian Chen: Formal analysis, Methodology, Visualization, Writing – original draft. Hui Zhang: Conceptualization, Methodology. Xiaosong Wang: Methodology. Yisheng Xu: Software, Visualization. Xiaoshuang Li: Methodology, Software. Yong Jiang: Conceptualization, Writing – review & editing. Yingyuan Lu: Conceptualization, Supervision, Writing – review & editing. Pengfei Tu: Conceptualization, Funding acquisition, Project administration, Supervision.
Acknowledgments
This work was supported by the National Key Research and Development Program of China (No. 2022YFC3501600), and the National Natural Science Foundation of China (No. 82030114, 82104543 and 22177005).
Declaration of Competing Interest
The authors declare that they have no known competing financial interests or personal relationships that could have appeared to influence the work reported in this paper.
References
- Graphene coated silica applied for high ionization matrix assisted laser desorption/ionization mass spectrometry: a novel approach for environmental and biomolecule analysis. Talanta. 2014;126:27-37.
- [CrossRef] [Google Scholar]
- Piceatannol: a natural stilbene for the prevention and treatment of cancer. Pharmacol. Res.. 2020;153:104635
- [CrossRef] [Google Scholar]
- Deficiency of telomere-associated repressor activator protein1 precipitates cardiac aging in mice via p53/PPARα signaling. Theranostics. 2021;11(10):4710-4727.
- [CrossRef] [Google Scholar]
- Antibacterial mechanism of Tetrastigma hemsleyanum Diels et Gilg's polysaccharides by metabolomics based on HPLC/MS. Int. J. Biol. Macromol.. 2019;140:206-215.
- [CrossRef] [Google Scholar]
- Facile detection of pesticides using atmospheric pressure matrix-assisted laser desorption ionization mass spectrometry with multi-walled carbon nanotubes-based matrix. Chin. Chem. Lett.. 2023;34:107286
- [CrossRef] [Google Scholar]
- Resveratrol treats UVB-induced photoaging by anti-MMP expression, through anti-inflammatory, antioxidant, and antiapoptotic properties, and treats photoaging by upregulating VEGF-B expression. Oxid. Med. Cell. Longev. 20226037303
- [CrossRef] [Google Scholar]
- The OsmiR396-OsGRF8-OsF3H-flavonoid pathway mediates resistance to the brown planthopper in rice (Oryza sativa) Plant Biotechnol. J.. 2019;17:1657-1669.
- [CrossRef] [Google Scholar]
- SwissTargetPrediction: updated data and new features for efficient prediction of protein targets of small molecules. Nucleic Acids Res.. 2019;47:W357-W364.
- [CrossRef] [Google Scholar]
- Physicochemical characterizations of starches isolated from Tetrastigma hemsleyanum Diels et Gilg. Int. J. Biol. Macromol.. 2021;183:1540-1547.
- [CrossRef] [Google Scholar]
- Oleanane glycosides from Astragalus tauricolus: isolation and structural elucidation based on a preliminary liquid chromatography-electrospray ionization tandem mass spectrometry profiling. Phytochemistry. 2013;86:184-194.
- [CrossRef] [Google Scholar]
- Spatially resolved metabolomics combined with bioactivity analyses to evaluate the pharmacological properties of two Radix Puerariae species. J. Ethnopharmacol.. 2023;313:116546
- [CrossRef] [Google Scholar]
- Understanding the Molecular Signatures in Leaves and Flowers by Desorption Electrospray Ionization Mass Spectrometry (DESI MS) Imaging. J. Agric. Food Chem.. 2013;61:7477-7487.
- [CrossRef] [Google Scholar]
- The research progresses and future prospects of Tetrastigma hemsleyanum Diels et Gilg: a valuable Chinese herbal medicine. J. Ethnopharmacol.. 2021;271:113836
- [CrossRef] [Google Scholar]
- Development of capabilities for imaging mass spectrometry under ambient conditions with desorption electrospray ionization (DESI) Int. J. Mass Spectrom.. 2007;259:8-15.
- [CrossRef] [Google Scholar]
- A comprehensive review on traditional uses, chemical compositions, pharmacology properties and toxicology of Tetrastigma hemsleyanum. J. Ethnopharmacol.. 2021;264:113247
- [CrossRef] [Google Scholar]
- Characterization of ginsenosides from Panax japonicus var. major (Zhu-Zi-Shen) based on ultra-high performance liquid chromatography/quadrupole time-of-flight mass spectrometry and desorption electrospray ionization-mass spectrometry imaging. Chin. Med.. 2023;18(1):115.
- [CrossRef] [Google Scholar]
- Based on microstructure, antioxidant activity and chemical composition of feasibility study on the use of Tetrastigma hemsleyanum Diels et Gilg root in medicine (in Chinese) Lishizhen Medicine and Materia Medica Research. 2020;31:2492-2494.
- [CrossRef] [Google Scholar]
- HPLC fingerprinting-based multivariate analysis of chemical components in Tetrastigma Hemsleyanum Diels et Gilg: correlation to their antioxidant and neuraminidase inhibition activities. J. Pharm. Biomed. Anal.. 2021;205:114314
- [CrossRef] [Google Scholar]
- Tetrastigma hemsleyanum leaf flavones have anti-NSCLC ability by triggering apoptosis using the Akt-mTOR pathway. Food Biosci.. 2021;41:100914
- [CrossRef] [Google Scholar]
- Reactive DESI-MS imaging of biological tissues with dicationic ion-pairing compounds. Anal. Chem.. 2015;87:3286-3293.
- [CrossRef] [Google Scholar]
- Direct plant tissue analysis and imprint imaging by desorption electrospray ionization mass spectrometry. Anal. Chem.. 2011;83:5754-5761.
- [CrossRef] [Google Scholar]
- Differentially evolved glucosyltransferases determine natural variation of rice flavone accumulation and UV-tolerance. Nat. Commun.. 2017;8:1975.
- [CrossRef] [Google Scholar]
- Spatial distribution and comparative analysis of Aconitum alkaloids in Fuzi using DESI-MSI and UHPLC-QTOF-MS. Analyst. 2023;148:1603-1610.
- [CrossRef] [Google Scholar]
- Bioactivities of phenolics by focusing on suppression of chronic diseases: a review. Int. J. Mol. Sci.. 2018;19:1573.
- [CrossRef] [Google Scholar]
- DAVID: a web server for functional enrichment analysis and functional annotation of gene lists (2021 update) Nucleic Acids Res.. 2022;50:W216-W221.
- [CrossRef] [Google Scholar]
- The GeneCards suite: from gene data mining to disease genome sequence analyses. Curr. Protoc. Bioinformatics 2016 1.30.1-1.30.33
- [CrossRef] [Google Scholar]
- Rapid characterization of chemical constituents in Radix Tetrastigma, a functional herbal mixture, before and after metabolism and their antioxidant/antiproliferative activities. J. Funct.. 2015;18:300-318.
- [CrossRef] [Google Scholar]
- The phenolic profiles of Radix Tetrastigma after solid phase extraction (SPE) and their antitumor effects and antioxidant activities in H22 tumor-bearing mice. Food Funct.. 2017;8:4014-4027.
- [CrossRef] [Google Scholar]
- The phytochemical composition, metabolites, bioavailability and in vivo antioxidant activity of Tetrastigma hemsleyanum leaves in rats. J. Funct. Foods. 2017;30:179-193.
- [CrossRef] [Google Scholar]
- The STRING database in 2023: protein-protein association networks and functional enrichment analyses for any sequenced genome of interest. Nucleic Acids Res.. 2023;51:D638-D646.
- [CrossRef] [Google Scholar]
- Biosynthesis-based spatial metabolome of Salvia miltiorrhiza Bunge by combining metabolomics approaches with mass spectrometry-imaging. Talanta. 2022;238:123045
- [CrossRef] [Google Scholar]
- Gut microbiota and transcriptome profiling revealed the protective effect of aqueous extract of Tetrastigma hemsleyanum leaves on ulcerative colitis in mice. Curr. Res. Food Sci.. 2023;6:100426
- [CrossRef] [Google Scholar]
- Three new constituents from the aerial parts of Tetrastigma hemsleyanum. Phytochem. Lett.. 2018;27:25-29.
- [CrossRef] [Google Scholar]
- Effects of vitexin-2″-O-rhamnoside and vitexin-4″-O-glucoside on growth and oxidative stress-induced cell apoptosis of human adipose-derived stem cells. J. Pharm. Pharmacol.. 2014;66:988-997.
- [CrossRef] [Google Scholar]
- DrugBank 5.0: a major update to the DrugBank database for 2018. Nucleic Acids Res.. 2017;46:D1074-D1082.
- [CrossRef] [Google Scholar]
- Multivariate Analysis in Metabolomics. Curr. Metabolomics. 2013;1:92-107.
- [CrossRef] [Google Scholar]
- Enhanced Coverage and Sensitivity of Imprint DESI Mass Spectrometry Imaging for Plant Leaf Metabolites by Post-photoionization. Anal. Chem.. 2022;94:15108-15116.
- [CrossRef] [Google Scholar]
- Bioactives and their metabolites from Tetrastigma hemsleyanum leaves ameliorate DSS-induced colitis via protecting the intestinal barrier, mitigating oxidative stress and regulating the gut microbiota. Food Funct.. 2021;12(23):11760-11776.
- [CrossRef] [Google Scholar]
- Tetrastigma hemsleyanum leaf extracts ameliorate NAFLD in mice with low-grade colitis via the gut-liver axis. Food Funct.. 2023;14:500-515.
- [CrossRef] [Google Scholar]
- Comprehensive Review of Recent Advances in Chiral A-Ring Flavonoid Containing Compounds: Structure, Bioactivities, and Synthesis. Molecules. 2023;28:365.
- [CrossRef] [Google Scholar]
- Chemical imaging reveals diverse functions of tricarboxylic acid metabolites in root growth and development. Nat. Commun.. 2023;14:2567.
- [CrossRef] [Google Scholar]
- Investigations of the fragmentation behavior of 11 isoflavones with ESI-IT-TOF-MSn. J. Chin. Pharm. Sci.. 2014;23:631-641.
- [CrossRef] [Google Scholar]
- Optimized New Shengmai Powder modulation of cAMP/Rap1A signaling pathway attenuates myocardial fibrosis in heart failure. Chin. Med.. 2024;19(1):30.
- [CrossRef] [Google Scholar]
- Spatial Distribution and Characterization of the Small-Molecule Metabolites and In Situ Hydrolyzed Oligosaccharides in the Rhizome of Glycyrrhiza uralensis by Desorption Electrospray Ionization-Mass Spectrometry Imaging and High-Resolution Liquid Chromatography-Mass Spectrometry. J. Agric. Food Chem.. 2023;71(50):20372-20385.
- [CrossRef] [Google Scholar]
- Integration of ion-mobility high-resolution liquid chromatography/mass spectrometry-based untargeted metabolomics and desorption electrospray ionization-mass spectrometry imaging to unveil the ginsenosides variation induced by steaming for Panax ginseng, P. quinquefolius and P. notoginseng. Arab. J. Chem.. 2024;17:105781
- [CrossRef] [Google Scholar]
Appendix A
Supplementary data
Supplementary data to this article can be found online at https://doi.org/10.1016/j.arabjc.2024.105900.
Appendix A
Supplementary data
The following are the Supplementary data to this article:Supplementary Data 1
Supplementary Data 1


