

Translate this page into:
Spectrophotometric determination of Mercury(II) ions in laboratory and Zamzam water using bis Schiff base ligand based on 1,2,4-Triazole-3,5-diamine and o-Vaniline
⁎Corresponding authors. haelghamry@uqu.edu.sa (Hoda A. El-Ghamry), alhefny@uqu.edu.sa (Amr L. Saber), alshefny@yahoo.com (Amr L. Saber), dede12397@hotmail.com (Gharam I. Mohammed)
-
Received: ,
Accepted: ,
This article was originally published by Elsevier and was migrated to Scientific Scholar after the change of Publisher.
Peer review under responsibility of King Saud University.
Abstract
Highly sensitive spectrometric method for mercury determination. Promising limit of detection i.e 0.016 µg/L was obtained. mercury reaction chemistry with HMBT is discussed. Analytical applications, validation and successful literature comparison was performed. Future trends: Clear superiority over literature methods and as an alternative routine analysis method.
Abstract
The current study presents the development of a simple and direct spectrophotometric approach for Hg(II) ions determination. This method has the significant advantage of being a simple procedure where no further solvent purification or pre-concentration is needed. The concentration of Hg(II) ions was determined in the presence of the Schiff base ligand named 2-((5-(2-hydroxy-3-methoxybenzylideneamino)–2H-1,2,4-triazole-3-ylimino)methyl)-6-methoxyphenol (HMBT), at pH 10 using Briton Robinson Buffer. The method Obey Beer's law in concentration range 0.1–6 µg mL- 1 of Hg with (LOD) 0 0.016 µg L -1 and (LOQ) 0.051 µg/L. The molar ratio ensured the formation of a metal complex between HMBT and Hg ions was in the molar ratio 2:1 (HMBT: Hg2+). The method was used for the determination of mercury ions in tap water and Zamzam water samples. The applied method has many advantages, such as simplicity, low cost, ease of operation, rapid detection, low-ligand consumption, and high sensitivity. The analytical method sensitivity was confirmed via the suitable selection of experimental circumstances. More information about the structure and stoichiometry of the complex formed in solution between Hg(II) and HMBT ligand has been gained through the isolation and investigation of solid complex (HMBT-Hg). The structure of the solid complex, HMBT-Hg, has been elucidated by applying analytical routes such as elemental analysis and the spectral mass, UV–vis spectra, and thermal analysis.
Keywords
Schiff bases
Mercury(II) complex
Water analysis
Spectral studies

1 Introduction
Environment pollution is not a recent phenomenon; it is the most significant challenge facing humanity nowadays. Heavy metal contamination in the aquatic system has become a worldwide environmental issue, which causes a severe threat to the whole ecosystem and human health even in a very low level [1–4]. Among the heavy metal ions, one of the most significant harmful pollutants is mercury that can be aggregated in the human body via the food chain and drinking water. Mercury is one of the most toxic metal ions; it exists in different forms, metallic, organic, and inorganic Mercury [5,6]. Mercury exists in the environment naturally, the main source of volcanic eruption activity, forest fires, and weathering of rocks [7–9]. Human Activities and industrial waste products occur a huge amount of Mercury in the environment, like, pharmaceutical industries, pesticides, paper, cellulose plastic industries, and paint [6,7]. Contaminants of mercury assume to be extremally dangerous among other environmental pollutants, which enter the human food cycle via water and marine life, and daily food such as fish, cereals, and other types of foodstuff may result in numerous poisoning [7–9]. A high level of mercury consumption leads to several serious diseases [10] such as leukemia [6,11], heart disease, and kidney damage; Mercury disrupts the nervous and immune system [10] and damages brain function allergic reactions [12,13]. Mercury species can be associated with organic and inorganic ligands to produce a variety of complexes. According to the United States Environmental Protection Agency (USEPA 2010), World Health Organization (WHO), and Bureau of Indian Standards (BIS), the allowed limit of Mercury in drinking water must be less than 2 ppb [8]. Mercury is classified into three super highly toxic forms at relatively low concentration and can produce several health effects [14,15]. There are three forms of mercury, elemental/ Metallic mercury (Hg0), inorganic mercury (Hg2+) (2 + Oxidation State) and organic mercury compounds such as methylmercury (MeHg) and ethylmercury (EtHg). Nowadays, mercury was an environmental pollutant that has a massive risk to health due to its high toxicity and mobility in ecosystems. Therefore, mercury forms' toxicity depends on the form of mercury, dose and rate of exposure. To meet the environment management and procedure of environmental risk assessment, it is required to improve fast, sensitive, simple, inexpensive, and accurate analytical methods to determine trace metals in environmental samples.
The determination and removal of mercury ions from water have become a worldwide concern. One of the most common techniques and widely used is the direct visible absorption spectrophotometric method due to the availability of the instrumentation and procedure simplicity in addition to cheapness, speed, precision, and accuracy of the technique that makes it a suitable method [16–19]. This work aims to improve simple, cost-effective, and fast approach for colorimetric determination of mercury ions the complex matrix using the Schiff base ligand abbreviated as HMBT which have been obtained by the condensation reaction of o-vaniline with 1,2,4-triazole-3,5-diamine. The solid Hg (II) complex has been isolated and its structure has been identified as well.
2 Experimental
2.1 Reagents and chemicals
All reagents as well as the solvents used in the current study were highly pure of analytical grade and used directly as delivered. 3,5-Diamino-1,2,4-triazole, o-vaniline and HgCl2 were purchased from Aldrich. All used laboratory material was preciously washed with 10 % HNO3 solution (Germany) prior to use. A stock solution of mercury (1000 µg mL−1) was prepared by dissolving an accurate weight (1.35 g) of mercury (II) chloride in ultra-pure water. More diluted standard (0.1–7.0 µg mL−1) Hg(II) solutions were the prepared by dilution. A stock solution of ligand was prepared by dissolving an appropriate weight (0.092 g) in 100 mL of mixture of (DMF) and methanol (Hayman, England).
A serious of Britton–Robinson (B–R) buffer (pH 3–12) were prepared by using a mixture of CH3COOH, H3PO4, and H3BO3 (0.12 mol/L) and adjusted the pH by using NaOH (0.2 mol/L)[20].
2.2 Instrumentation
Absorption spectra were recorded using UV–vis spectrophotometer (Shimadzu UV-1800, UV–Vis spectrophotometer) with 1 cm quartz cells. Adjustment of solutions’ pH was achieved using (Mettler Toledo-model MP220 pH meter). The molar conductance was determined in a DMSO solvent (10-3 mol L-1) using a JENWAY (model 4070) conductance bridge. FT-IR spectra were measured using Bruker Tensor 27 spectrophotometric. Elements’ percentage was recorded using Perkin-Elmer 2400 CHN Elemental analyzer and the molecular weight was determined by electron impact mass spectra measurement recorded on Finnigan-MAT8222 spectrometer at 70 eV. Thermogravimetric analysis (TGA) of the mercury complex have been recorded on Schimadzu DTG-60 model instrument under the rate of heating of 10 °C/min and inert environment from RT to 800 °C.
2.3 Synthesis of ligand (HMBT)
The ionophore bis Schiff base ligand (HMBT) were prepared as reported previously[21] as shown in scheme 1. The composition and purity of the ligand has been checked by means of elemental analysis and FTIR spectra.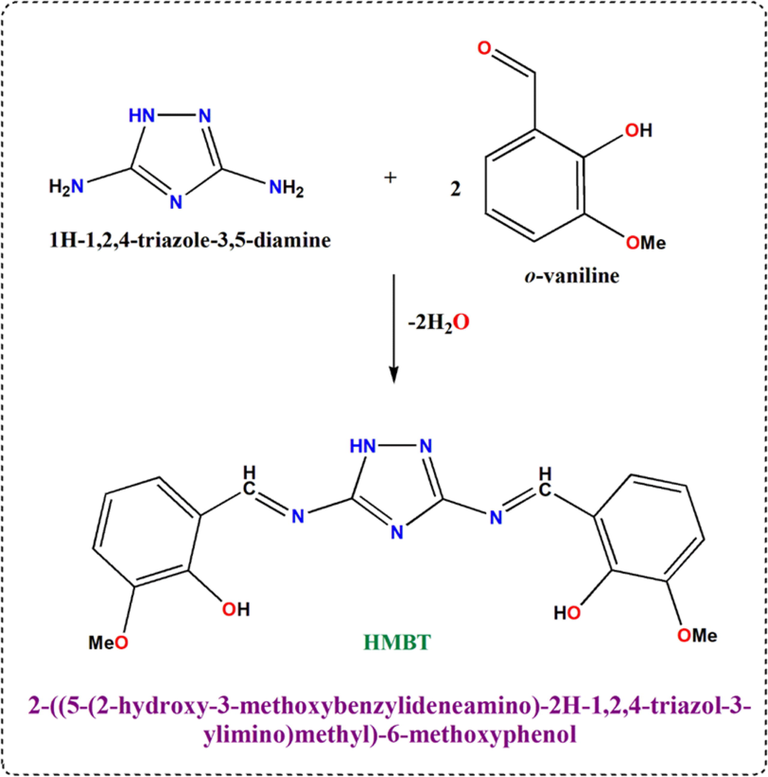
Schematic illustration of HMBT synthesis.
2.4 Synthesis of Hg(II) complex (HMBT-Hg)
Hg(II) complex (abbreviated as HMBT-Hg) has been prepared through adding hot methanol solution involving 0.543 g of HgCl2 (0.002 mol & 10 mL) to methanol/DMF mixture (90/10 %, 20 mL) having 0.367 g (0.001 mol) of HMBT ligand; the addition has been done in a slow rate. Few drops of triethyl amine have been then added to the reaction mixture The produced solution was kept under reflux upon stirring for 2 h in which faint greenish yellow yield has been obviously appeared. The reaction has been extended 1 h more after precipitation to ensure the complete precipitation of the product. The precipitate has been then separated from the solvent through filtration followed by rinsing several times by hot methanol followed by ether and the last step was keeping the product under vacuum to be dried over non-hydrous CaCl2 Yield: 58.5 %. Color: greenish yellow. Conductivity (ohm−1 cm2 mol−1, 10-3 M in DMSO): 18.3. ESI-MS m/z = 933.29 g/mol [M−H2O], f = 933.86. Anal. Calcd for HMBT-Hg; [(HMBT)2Hg]·(H2O) (C36H34N10O9Hg; 951.31 g mol−1): C, 45.45; H, 3.60; N, 14.72. Found: C, 45.61; H, 3.55; N, 14.79. IR (cm−1, KBr phase): 3424, 3215, 1613, 1568, 1256, 1084, 579, 442.
2.5 Recommended procedures
An appropriate concentration of Hg(II) solution (0.1–7.0 µg mL−1) and 0.6 mL of HMBT(2.50 X10⁻³ mol/L) were added to a series of 10 mL volumetric flasks. The pH of the resulting solutions was adjusted to pH = 10 by adding 2 mL of B-R buffer solution of pH 10 then the volume completed to the mark using 70 % methanol. The absorbance of each solution was measured at 475 nm against blank solution prepared under similar conditions.
2.6 Analysis of Hg(II) ions in tap- and Zamzam water samples
Tap and Zamzam water samples were collected from the laboratory of chemistry Department, Umm Al- Qura university and from markets in Makkah city, KSA. In a previous stage to analysis, the water samples were filtered using a membrane filter (0.40 μm). After that, such samples were examined for the existence Hg(II) content applying the above indicated recommended procedures. Alternatively, the following standard addition method was used: in volumetric flask (10.0 mL) tap water (1.0 mL) and Zamzam water and adjusted the pH to 10. Then a volume (0.6 mL) of ligand (2.50 X10⁻³ mol/L) was added into the mixture solution and made up to the mark with methanol (70 %). Reiterate the same procedure after adding varied concentration (from 0.1 to 7.0 µgmL−1) of Hg (II). The procedure described above was used to determine the absorbance of the complex produced in these solutions.
3 Result and discussion
3.1 Characterization of HMBT-Hg complex
3.1.1 Stoichiometry and composition
The results of elements content (C, H, N) of Hg (II) complex in addition to its molar conductance recorded from 10-3 M DMSO solution are depicted in experimental section. These results suggested the formula of the complex to be [(HMBT)2Hg] · (H2O); where HMBT is the organic ligand in the mono deprotonated form. Such results also supported the composition of the complex HMBT-Hg to be 1:2 (M:L). The conductivity of the solution was found to be 18.3 Ω−1 cm2 mol−1 which lies within the values corresponding to non-electrolytic complexes [22,23].
3.1.2 FTIR spectrum
IR spectra supply adequate data to clarify the nature of interaction of the organic ligands to the metal ions. So, through comparing the spectra of both of HMBT and HMBT-Hg, advantageous knowledge about the ligand function groups that directly connected to the metal center can be concluded. Fig. 1 represents the IR spectra of the ligand, HMBT, and its Hg (II) chelate. The ligand bands existent at 3462, 3217, 1636, 1584, 1230 and 1064 m−1 have been previously assigned to the stretching vibrations of OH, NH, C⚌N (imine), C⚌N (triazole ring) C—O and N—N bonds, successively [24,25]. Upon inspection of the IR spectrum of synthesized chelate, HMBT-Hg, the spectral peaks centered at 3424, 3215, 1613, 1568 1256 and 1084 cm−1 have been observed. The bands appearing at 1613, 1568, 1256 and 1084 were assigned to the stretching wavenumbers of C⚌N (imine), C⚌N (triazole ring), C—O and N—N bonds, successively [26]. The considerable shifting in the place of such bands relevant to their position in the spectrum of free ligand is strong evidence for the coordination of both azomethine groups in addition to the deprotonated OH to the Hg center resulting in the complex formation. The position of NH band did not show significant change in its place appearing almost at the same place in the spectra of ligand and its Hg(II) complex supporting the noninvolvement of NH group in coordination to Hg ion. Additional demonstration for the previous findings is the appearance of two new non ligand bands in the spectrum of HMBT-Hg at 576 and 442 cm−1 that have been assigned to υ(Hg-O) and υ (Hg-N), successively, and ensured the involvement of C⚌N and deprotonated OH in ligation to Hg ion.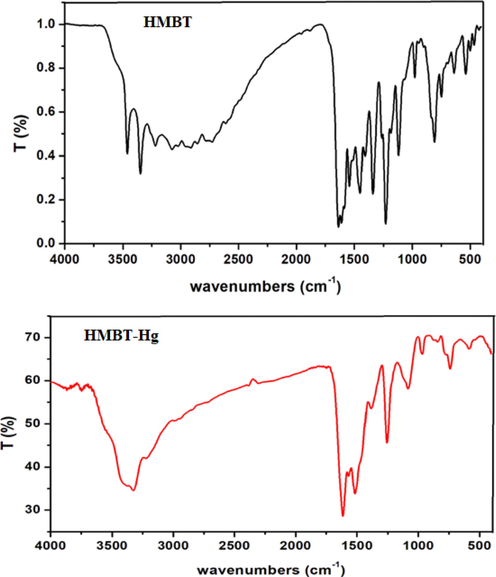
FTIR spectra of HMBT and its complex, HMBT-Hg.
3.1.3 Mass spectra
The molecular weight of HMBT-Hg complex has been inferred from the results of mass spectrum shown in Fig. 2. From this spectrum it is obvious that the molecular ion peak appears at m/z = 933.86 which attributed to the calculated value the complex excluding the hydration water (calculated molecular weight = 934.21). Additionally, the peaks appearing at m/z = 918.43, 858.72, 682.27, 482.89, 324.07 and 213.43 are consistence with the fragments shown in Scheme 2 & 3 and hence support the predicted structure.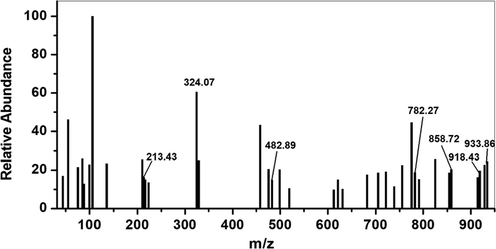
EI-mass spectrum of HMBT-Hg complex.
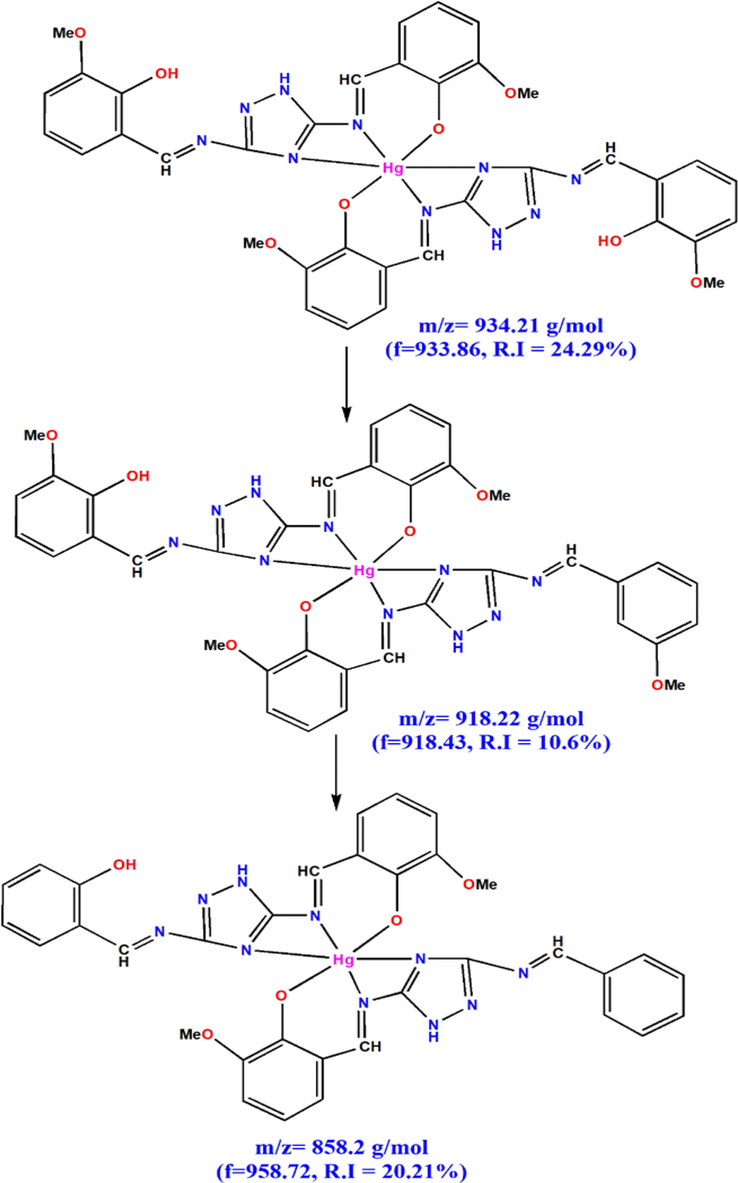
Mass fragmentation patterns of HMBT-Hg complex.
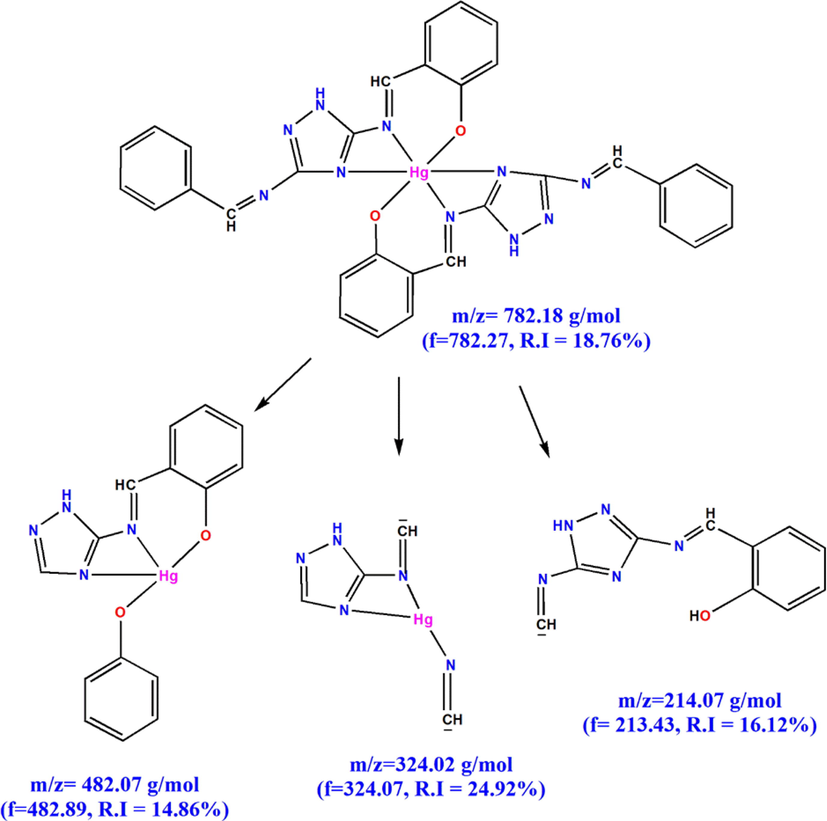
Other fragments of HMBT-Hg complex.
3.1.4 Thermal analysis
Thermal analysis and stability of HMBT-Hg complex can be concluded by investigation of the TG/DTG thermograms (Fig. 3) recorded from room temperature up to 800 °C under inert conditions. From the TG thermogram, the first step occurred between room temperature and 98 °C with weight loss of 2.01 % (calcd 1.89 %) attributing to the removal of lattice water molecule with DTG temperature at 64 °C. The following step started at 98 °C and ended at 341 °C within which partial decomposition of the ligand took place with loss of 64.60 % (calcd 64.18 %) and the DTG temperature appeared at 251 °C. Complete decomposition of the ligand with partial loss of the HgO content occurred within the following two steps up to 800 °C.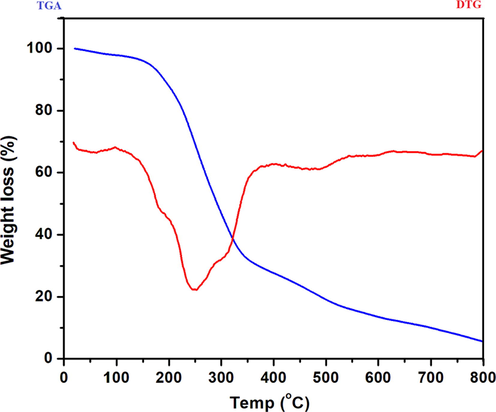
TG/DTG thermograms of HMBT-Hg complex.
Thus, and relaying on all the previous findings, the structure of HMBT-Hg complex is shown in Fig. 4.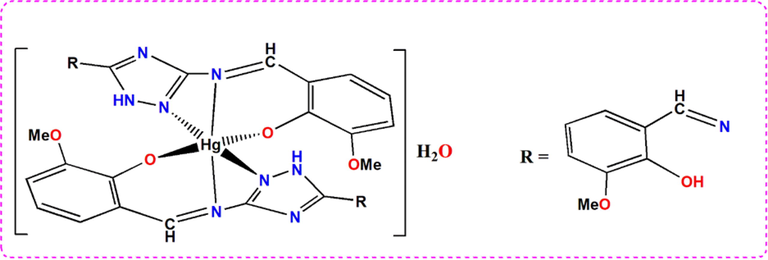
Concluded structure of HMBT-Hg (II) complex.
3.1.5 UV–vis spectrophotometer
The absorption spectrum of HMBT and Hg(II) chelate, HMBT-Hg, have been recorded in methanol. The spectrum of HMBT ligand exhibited the maximum absorption peak appearing at 388 nm whereas the Hg complex exhibited absorbs the absorption maximum at the wavelength of 475 nm as shown in Fig. 5. Therefore, 475 nm was chosen as the analytical wavelength at which the detection of Hg ions was performed.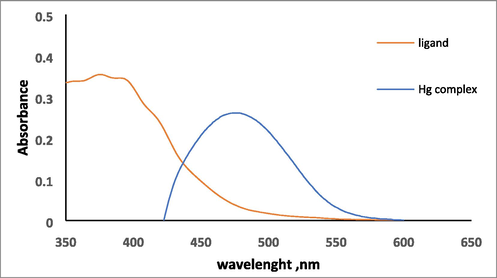
Absorption spectra of 1.5 X10⁻⁴ mol/L of HMBT and 3.0 µg mL−1 HMBT-Hg complex.
3.2 Optimizing of analytical parameters
pH plays a unique role in metal complexes formation and hence it is the most important parameter. So, the pH of the measurement solutions has been changed over the rang of pH 3–12 using B-R buffer (Fig. 6). It is clearly that maximum absorbance of 5.0 µg mL−1 Hg(II) complex was obtained at pH 10 as shown in Fig. 7.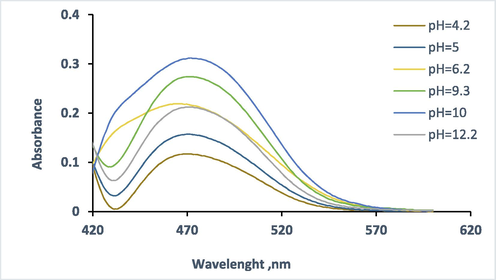
Absorbance spectra of HMBT-Hg complex. Conditions: 5.0 µg ml−1 Hg (II) in 1.25 X 10⁻⁴ mol L-1 of ligand at 475 nm.
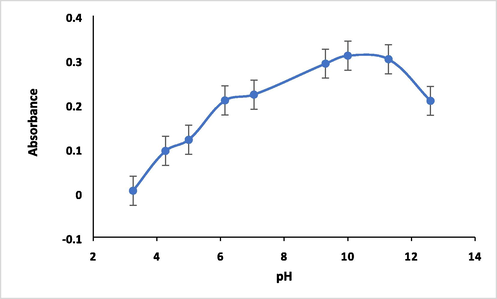
Effect of pH on absorbance of HMBT-Hg complex. Conditions: 5.0 µg ml−1 Hg (II) in 1.25 X 10⁻⁴ mol/L of ligand at 475 nm.
As obvious in this figure, the absorbance of the formed Hg complex gradually increases while increasing the of pH of the solution reaching the maximum absorbance at pH 10. The reason can be explained based on the fact that the complex formed between analyte and chelating reagent depends on the availability of ligand binding sites and as the pH increases, deprotonation of the phenolic OH groups of the chelating agent become easier as the concentration of H+ ions decreases and the concentration of OH– ions increases and hence facilitate the coordination of the Hg2+ to the chelating agent [27]. The stability of the produced complex was examined at optimized analytical parameters. The effect of time on the formation of complex was studied over the time from 5 to 60 min. The absorbance of formed complex was observed to decrease with time increasing and while the maximum absorbance was observed after 5 min after that the absorbance significantly and clearly declined as illustrated in Fig. 8. So, the maximum absorbance was obtained within 5 min of mixing the reactants at optimized parameters and hence that that time was chosen as stability time of the complex formation.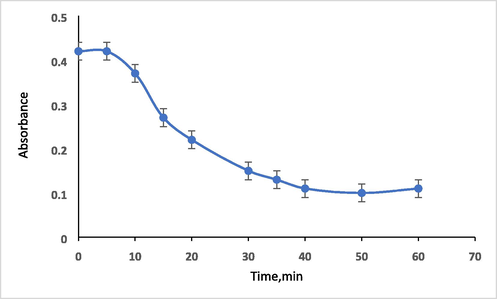
Plot of true absorbance of the HMBT-Hg complex versus time. Conditions: 5 µg ml−1 Hg (II) in presence of ligand with concentration 1.5 X 10⁻⁴ mol/L at 475 nm and pH 10.
The effect of concentration of ligand on analytical response is also investigated. At pH 10, series of concentrations of HMBT ligand solutions in the range of (1.0 x10⁻⁴ – 3.5 × 10⁻⁴ mol L-1) were added to the mixture test solution. The ligand concentration of 1.5 x10⁻⁴ mol L-1 was selected to be the sufficient optimum concentration of ligand as deduced from Fig. 9.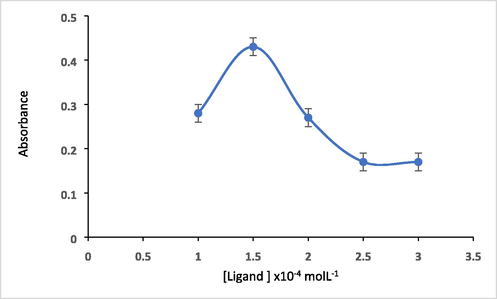
Effect of ligand concentration on absorbance of 5 µg ml−1 Hg(II) at pH = 10 and at 475 nm.
3.3 Analytical performance
The analytical performance of the proposed method to produce the yellow species of mercury complex in aqueous solution was investigated under ideal conditions. Fig. 10. Represents the absorption spectra of Hg(II) complex at various concentration of Hg(II) ions (0.1–7.0 µg mL−1) under optimum conditions. The plot of the absorbance of the Hg (II) complex at 475 nm against Hg(II) concentrations was found to obey Beer’s–Lambert law; the precision and accuracy of the procedure was estimated by the recovery studies.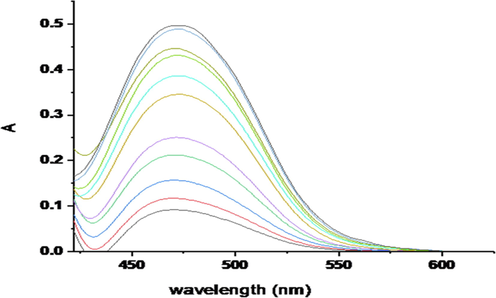
Absorption spectra of Hg (II) complex at various concentration of Hg (II) ions (0.1–7.0 µg mL−1) in 1.5 X10⁻⁴ mol/L of ligand and pH 10 at 475 nm.
Plot of absorbance of formed Hg (II) complex at 475 nm against Hg (II) ions concentration was linear in the concentration range of (0.1–6.0 µg mL−1) with correlation coefficient of 0.9896 (Fig. 11).![Calibration curve of mercury complex at optimum conditions. [hg (ii)]: 0.1 – 6.0 µg mL−1 in 1.5x10⁻⁴ mol/L ligand and pH = 10 at λ max = 475 nm.](/content/184/2023/16/1/img/10.1016_j.arabjc.2022.104418-fig14.png)
Calibration curve of mercury complex at optimum conditions. [hg (ii)]: 0.1 – 6.0 µg mL−1 in 1.5x10⁻⁴ mol/L ligand and pH = 10 at λ max = 475 nm.
The linear plot is expressed by the following equation:
The molar absorptivity of Hg(II) complex calculated from Beer’s–Lambert plot was 1.59x10⁴ L mol−1 cm−1. Also, Sandell’s sensitivity index [28] of the Hg(II) complex eas equal to 0.0126 μg cm−2. Ringbom’s plot [28] is applied as a standard method adopted to determine the optimum range of concentration for a system that obeys Beer’s law. The plot was between log Hg (II) concentration and transmittance. The linear concentration rang of Hg (II) ion as estimate from Ringbom's plot was linear in the range (0.8–5.0 µg mL−1).
The sensitivity of the analytical method can be characterizing by value of LOD and LOQ. Based on the calibration curve, the limit of detection (LOD) and (LOQ) [29] has been evaluated by using the following equations
MCPE: Micro cloud point extraction, DLLME: dispersive liquid /liquid microextraction, VALLM: vortex-assisted liquid /liquid Microextraction,VA-SMS-LLME: vortex-assisted supramolecular solvent liquid–liquid microextraction, Spect: spectrophotometric.
Parameters
Values
pH
10
λmax
475 nm
Molar ratio (Reagent-Hg)
2:1
Beer,s law limits (µg mL−1)
0.1–6.0
Molar absorptivity (L/molcm−1)
1.59 x10⁴
Sandell’s sensitivity index (μg cm−2)
0.0127
Regression equation
A = 0.0805C + 0.0409
Intercept
0.0409
Slope
0.0805
Correlation coefficient (r)
0.9939
Ringbom Range (µg mL−1)
0.8–5.0
RSD %
0.51
Detection limit LOD (µg mL−1)
0.016
Detection limit LOQ (µg mL−1)
0.051
Method
ligand
RSD%
LOD µgmL−1
LOQ µgmL−1
Matrix
Ref.
MCPE/UV–vis
4(2-pyridylazo) resorcinol
6.06
13.1
–
Water
[30]
DLLME
Dithizone
1.9
2.8
–
Water(mineral-tap)
[31]
DLLME
2–2-benzothiazolylazo-p-cresol
–
3.3
11.1
Water (sea-drinking)
[32]
VALLM
Astrazon red 6B dye
2.5
1.5
–
Water (thermal tap)
[33]
VA-SMS-LLME
Quinalizarin
1.80
0.30
–
water
[34]
Direct spect
2-((5-(2-hydroxy-3-methoxybenzylideneamino)–2H-1,2,4-triazol-3-ylimino) methyl)-6-methoxyphenol
0.51
0.016
0.051
Water (Zamzam- tap)
Personal work
3.4 Stoichiometry of Hg(II) complex
Job method of continuous variation and the molar ratio method [35] were utilized to assign the composition of the Hg chelate. Equimolar solutions of both Hg (II) ion and ligand (2.50 x10⁻⁴ mol L-1) have been prepared. The absorbances of all the measurement solutions have been recorded at 475 nm against the suitable blanks. Fig. 12 represents the plot the absorbance of the peak appearing at 475 nm and VM/VL + VM (where VL and VM are the volumes of the ligand and the metal, respectively). Investigation of such plot indicates that one mols of Hg (II) react with tow mols of HMBT ligand and the complex obtained is formed in 2:1 (L:M) ratio.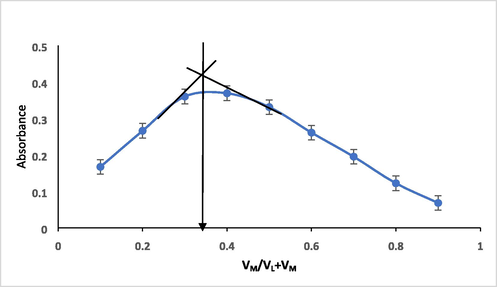
Job́s method of continuous variation of HMBT-Hg complex formation; 2.50x10⁻⁴ mol/L of both Hg(II) and HMBT solutions and λ of 475 nm.
The stoichiometry of produced mercury complex was also determined from the molar ratio method. It like job method but the only different between them is that the total analytical concentration of mercury or ligand is held constant rather the sum of the ligand and metal concentration. The results added more conformation of 2:1 M ratio of ligand: Mercury in the complex formed. Thus, it is clearly that 2.0 mols of ligand chelates1.0 mol of Hg(II) ions. The results are plotted in Fig. 13.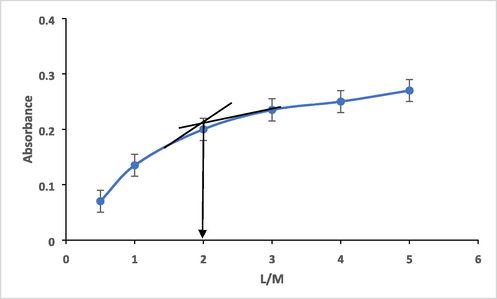
molar ratio plot of HMBT-Hg complex formation, 2.50 x10⁻⁴ molL-1 at 475 nm.
The, the results of Job’s method of continuous variation and the molar-ratio method were found to be correlated to each other confirming the stoichiometric composition of the complex to be 2:1 (HMBT: Hg(II)).
The method of molar ratio [35] was successfully used for the determine of stability constant of the colored HMBT-Hg complex at pH 10, the extrapolated value of the absorbance (A extp) near to the equivalence point on the molar ratio plot corresponds to the total absorbance of the HMBT-Hg complex. As shown in Fig. 12 with 2:1 (L:M) ration of the complex species according to the following equation:
Where X is the ligand and Mn+ is the Hg (II). The concentration of complex (MX) can be calculated from the next equation:
Where C is the total analytical concentration of Hg (II) or ligand. Thus, the concentration of produce complex (MX) can be determining through the following equation:
The stability constant (K) of the formed complex calculated by the following equation:
The stability constant value was found to be (3.69X 10³ mol−1 L).
3.5 Analysis of Hg (II) complex in tap and Zamzam water samples
The proposed method was tested by the analysis of Hg(II) ions in tap Zamzam and water samples. To estimate the method's accuracy and recovery, the tests were performed by adding analyte in different concentration (0.2–0.6 μg L−1) of Hg (II) ion. According to the results in Table3, the recovery values of sample spike found to be varied from 91.6 % to 110 % and from 90 % to 100 % for the determination of Hg2+ in tap water and Zamzam water sample, respectively.
Sample (water)
Concentration of Hg(II)Added (µg mL 1)
Concentration of Hg(II)found (µg mL 1) a
Recovery (%) b
Tap
0.0
–
–
Tap
4.0
4.4 ± 0.04
110 ± 0.04
Tap
5.0
4.8 ± 0.16
96.8 ± 0.17
Tap
6.0
5.5 ± 0.55
91.6 ± 0.60
Zamzam
0.0
–
–
Zamzam
4.0
4.0 ± 0.07
100 ± 0.07
Zamzam
5.0
4.5 ± 0.04
90 ± 0.54
According to the U.S. Environmental protection agency (USEPA) and World Health Organization (WHO) the permissible limit of mercury in drinking water is 2 parts per billion (ppb):USEPA 0.002, WHO 0.001 mg/L [36]. The U.S. EPA set a maximum contaminant level (MCL) for all forms of mercury in water MCL = 0.002 µg mL−1, high levels than this level can damage the brain, kidneys, and developing fetus [37].
4 Conclusion
The applied method in the current work was an efficient and simple spectrophotometric method for the determination of Hg(II) ions in water sample using 2-((5-(2-hydroxy-3-methoxybenzylideneamino)–2H-1,2,4-triazol-3-ylimino) methyl)-6-methoxyphenol Schiff base as analytical ligand through the formation of Hg complex. The composition of the complex has been proved by analytical and spectroscopic methods to be to be formed in the molar ration 2:1 (L:M). The proposed method provides a great advantage, due to simple and reliable means of determining trace amounts of mercury (II) ions in aqueous media. using spectrophotometry; beside it is rapid, safe, and inexpensive. Hence, HMBT is a possible choice ligand for the spectrophotometric determination of Mercury (II) in low and trace levels in a water sample. The developed method gives a low (LOD) and can be applying to the determination of other metals in water samples. In addition, the method did not require any complex pre-treatment and/or pre-concentration step of the analyte. The structure and stoichiometry of the complex formed between Hg(II) and HMBT ligand has been confirmed by the isolation and investigation of solid complex (HMBT-Hg). The structure of the solid complex, HMBT-Hg, has been elucidated by applying analytical routes such as elemental analysis and the spectral mass, UV–vis spectra, and thermal analysis.
Declaration of Competing Interest
The authors declare that they have no known competing financial interests or personal relationships that could have appeared to influence the work reported in this paper.
References
- Estimation of Mercury in soil, water and plants spectrophotometrically. Orient. J. Chem.. 2019;35(6):1718-1721.
- [CrossRef] [Google Scholar]
- U. B. Barache , A. B. Shaikh ,S. A. Deodware ,P. C. Dhale ,T.N. Lokhande, S.H. Gaikwad. A new experimental approach for liquid-liquid extractive spectrophotometric determination of chromium(VI) in tannery waste water and alloy samples International Journal of Environmental Analytical Chemistry 99 (2019) 621-640 (Taylor and Francis, UK). Doi: 10.1080/03067319.2019.1607316.
- Acid switched efficient, cost effective, selective separation and determination ofselenium(IV) J. Environ. Chem. Eng.. 2017;5(5):4828-4840.
- [CrossRef] [Google Scholar]
- An efficient, cost effective, sensing behaviour liquid-liquid extraction and spectrophotometric determination of copper(II) incorporated with 4-(4′-chlorobenzylideneimino)-3-methyl-5-mercapto-1, 2, 4-triazole: Analysis of food samples, leafy vegetables, fertilizers and environmental samples. Spectrochim. Acta - Part A Mol. Biomol. Spectrosc.. 2018;189(Ii):443-453.
- [CrossRef] [Google Scholar]
- Selective and sensitive liquid-liquid extraction and spectrophotometric determination of tellurium(IV) using sulfur containing reagent. Chem. Data Collect.. 2019;19(Iv):11-13.
- [CrossRef] [Google Scholar]
- A new experimental approach for liquid-liquid extractive spectrophotometric determination of chromium(VI) in tannery wastewater and alloy samples. Int. J. Environ. Anal. Chem.. 2019;99(7):621-640.
- [CrossRef] [Google Scholar]
- Synthesis, characterization and biological properties of thienyl derived triazole Schiff bases and their oxovanadium(IV) complexes. J. Enzyme Inhib. Med. Chem.. 2012;27(2):187-193.
- [CrossRef] [Google Scholar]
- Synthesis, characterization, and catalytic activity of new Cu(II) complexes of schiff base: effective catalysts for decolorization of acid red 37 dye solution. Int. J. Chem. Kinet.. 2015;47(3):162-173.
- [CrossRef] [Google Scholar]
- U.S. EPA, “National Primary Drinking Water Guidelines,” Epa 816-F-09-004, vol. 1, p. United States Environmental Protection Agency. 7p, 2009, [Online]. Available: https://www.epa.gov/sites/production/files/2016-06/documents/npwdr_complete_table.pdf.
- B. Fernandes Azevedo, L. Barros Furieri, F. Peçanha, G. Wiggers, P. Frizera Vassallo “Toxic effects of mercury on the cardiovascular and central nervous systems,” J. Biomed. Biotechnol., vol. 2012, 2012, doi: 10.1155/2012/949048.
- Experimentally validated extractive spectrophotometric determination method of osmium(VIII) from environmental samples: sequential separation of osmium(VIII), rhodium(III) and ruthenium(III) Int. J. Environ. Anal. Chem. (Viii):1-21.
- [CrossRef] [Google Scholar]
- Determination of zinc, copper, and mercury in water samples by using novel micro cloud point extraction and UV-Vis spectrophotometry. Eurasian J. Anal. Chem.. 2017;12(4):313-324.
- [CrossRef] [Google Scholar]
- Development of green vortex-assisted supramolecular solvent-based liquid–liquid microextraction for preconcentration of mercury in environmental and biological samples prior to spectrophotometric determination. Microchem. J.. May 2020;157:105108
- [CrossRef] [Google Scholar]
- T. R. Gundala, H. D. Limited, C. Gangi, and R. Nallagondu, “Spectrophotometric determination of mercury (II) in environmental samples Spectrophotometric determination of mercury (II) in environmental samples and synthetic mixtures using N ’ - (1- (pyridin-2-yl) ethylidene) isonicotinohydrazide as sensitive,” no. January, 2015.
- Estimation of trace-mercury concentration in water using a smartphone. Measurement. 2020;154:107507
- [CrossRef] [Google Scholar]
- Water quality for drinking: WHO guidelines. Encycl. Earth Sci. Ser. 2012:876-883.
- [CrossRef] [Google Scholar]
- S. B Kharade , R. K Chougale , U. B Barache , K. R Sanadi , K. C Rathod , S. H. Gaikwad , Y-C. Ling , M. A Anuse , G. S Kamble. Design and optimization of sensitive analytical spectrophotometric method for micro determination of copper(II) from e-waste by using of novel chromogenic extractatnt. Spectrochimica Acta A 267 (2020) 120502 (Elsevier, UK).Doi: 10.1016/j.saa.2021.120502
- Sources and toxicity of Mercury in the San Francisco Bay Area, Spanning California and beyond. J. Environ. Public Health. 2020;2020
- [CrossRef] [Google Scholar]
- Mercury removal from simulated waste water by chitosan nano composite embedded with leaf extract of Brassica Gongylodes. Mater. Today Proc.. 2019;26:728-739.
- [CrossRef] [Google Scholar]
- Spectrophotometric determination of mercury in water samples after preconcentration using dispersive liquid-liquid microextraction. J. AOAC Int.. 2012;95(1):227-231.
- [CrossRef] [Google Scholar]
- Separation and spectrophotometric detarmination of elements. John Wiley and Sons; 1986. 2ndEdn.,
- Statistics and Chemometrics for Analytical Chemistry (Sixth Edition). Pearson Education Limited Prentice Hall; 2009.
- Rapid, sensitive, and selective copper (II) determination using sensitive chromogenic azo dye based on sulfonamide. Spectrochim. Acta A. 2021;247:119103
- [Google Scholar]
- Ni(II)-selective PVC membrane sensor based on 1,2,4-triazole bis Schiff base ionophore: Synthesis, characterization and application for potentiometric titration of Ni2+ ions against EDTA. Arab. J. Chem.. Jul. 2021;14(7)
- [CrossRef] [Google Scholar]
- A critical review of mercury speciation, bioavailability, toxicity and detoxification in soil-plant environment: ecotoxicology and health risk assessment. Sci. Total Environ.. 2020;711:134749
- [CrossRef] [Google Scholar]
- Preconcentration and simultaneous spectrophotometric determination of copper and mercury by dispersive liquid-liquid microextraction and orthogonal signal correction-partial least squares. Arab. J. Chem.. Sep. 2015;8(5):706-714.
- [CrossRef] [Google Scholar]
- Human exposure and health effects of inorganic and elemental Mercury. J. Prev. Med. Public Heal.. 2012;344
- [CrossRef] [Google Scholar]
- S. Picco,L.Villegas,F.Tonelli,Franc Pomerlo, Mario Rigau “We are IntechOpen , the world ’ s leading publisher of Open Access books Built by scientists , for scientists TOP 1 %,” Intech, no. tourism, p. 13, 2016, [Online]. Available: https://www.intechopen. com/books/advanced-biometric-technologies/liveness-detection-in-biometrics.
- Chemical composition and source apportionment of PM2.5 and PM2.5–10 in Trombay (Mumbai, India), a coastal industrial area. Particuology. 2018;37:143-153.
- [CrossRef] [Google Scholar]
- Nano-synthesis, biological efficiency and DNA binding affinity of new homo-binuclear metal complexes with Sulfa Azo Dye based ligand for further pharmaceutical applications. J. Inorg. Organomet. Polym. Mater.. 2019;29(4):1337-1348.
- [CrossRef] [Google Scholar]
- Chemistry experiments for instrumental methods. John Wiley & Sons; 1994.
- 4-4’-nitrobenzylideneimino)-3-methyl-5-mercapto-1, 2, 4-triazole, a new chromogenic reagent for extractive spectrophotometric determination of copper (II) in pharmaceutical and alloy samples. South African J. Chem.. 2016;69:157-165.
- [CrossRef] [Google Scholar]
- In vitro antibacterial, antifungal and cytotoxic activities of some triazole Schiff bases and their oxovanadium(IV) complexes. J. Enzyme Inhib. Med. Chem.. 2013;28(6):1291-1299.
- [CrossRef] [Google Scholar]
- T. Antolov́a, S. Zaruba, J. Janaˇ, J. šandrejov́a, L. Koćurov́a, A. Vishnikin , Y. Bazel , V. Andruch , L. Balogh “Spectrophotometric determination of mercury using vortex-assisted liquid-liquid microextraction” Turk J Chem, (2016) 40: 965 – 973, doi: 10.3906/kim-1605-63.
- Inorganica Chimica Acta A novel carbonothioate-based benzothiazole fluorescent probe for trace detection of mercury (II) in real water samples. Inorg. Chim. Acta. February 2021;521:120349
- [CrossRef] [Google Scholar]
- Quantitative Inorganic Analysis (third ed.). England: Longmans Group Ltd; 1966.
- How does soil pollution risk perception affect farmers’ pro-environmental behavior? the role of income level. J. Environ. Manage.. May 2020;270:110806
- [CrossRef] [Google Scholar]


