

Translate this page into:
Spectroscopic investigation of La7Ta3W4O30:Sm3+ orange-red phosphor for white LEDs
⁎Corresponding authors at: College of Chemical Biological and Environmental Engineering, Xiangnan University, Chenzhou, Hunan 423043, PR China (B. Deng). ddhbyjs@126.com (Bin Deng), yuruijin@nwsuaf.edu.cn (Ruijin Yu)
-
Received: ,
Accepted: ,
This article was originally published by Elsevier and was migrated to Scientific Scholar after the change of Publisher.
Peer review under responsibility of King Saud University.
Abstract
The novel orange-red light emitting La7Ta3W4O30:xSm3+ (x = 0.005–0.20) phosphors were synthesized via the solid-state reaction method. The crystal structure, photoluminescence (PL) properties, optimum concentration, color purity, decay life, and thermal stability of the samples were systematically studied. Under the excitation of 404 nm, La7Ta3W4O30:Sm3+ emits intense orange-red light at 597 nm. The PL spectra of La7Ta3W4O30:Sm3+ phosphors are ascribed to the 4G5/2 to 6HJ (J = 5/2, 7/2, 9/2, and 11/2) transitions of Sm3+ ions. The concentration quenching occurs at the doping level of 1 mol%. The quenching temperature is higher than 500 K. Finally, a white LED (w-LED) with the Commission Internationale de L'Eclairage (CIE) chromaticity coordinates of (0.312, 0.296) and good color rendering index (Ra) of 86 was fabricated. As a consequence, all the results suggest that the orange-red phosphors La7Ta3W4O30:Sm3+ have potential applications in w-LEDs structures.
Keywords
Luminescence
Tungstate
La7Ta3W4O30:Sm3+
Phosphor

1 Introduction
At present, w-LEDs, as new ideal lighting sources, rapidly substitute the traditional fluorescent and incandescent lamps owing to its excellent advantages, such as environment-friendly, lower power consumption, robustness, durability, long operation time, high brightness and small size (Cao et al., 2019; Xu et al., 2013; Zhao et al., 2017; Min et al., 2017). Currently, the major way to manufacture w-LEDs is to merge the InGaN blue-emitting chip with yellow phosphor Y3Al5O12:Ce3+ (YAG) (Tang et al., 2017; Atuchin et al., 2015; Ji et al., 2016; Galashov et al., 2017). Nonetheless, this product has some drawbacks, such as the high correlated color temperature (CCT) and low Ra, and these shortcomings make it difficult to develop the w-LEDs in the future (Wang et al., 2019). To resolve these problems, red-emitting phosphors can be applied to decrease CCT and improve the Ra value. As to commercial red phosphors of YVO4:Eu3+, Y2O2S:Eu3+ and Y2O3:Eu3+, they absorb insufficiently in the NUV (near ultraviolet) region (Tang et al., 2014; Guo et al., 2008; Al-Mamun and Ishigaki, 2014). For some red nitride phosphors, such as CaAlSiN3:Eu2+, Sr2Si5N8:Eu2+, and SrxCa1-xAlSiN3:Eu2+, the high pressure and high temperature conditions are needed for synthetic (Li et al., 2015; Wang et al., 2018; Zou et al., 2016). Hence, in w-LEDs production, it is significant to investigate new red phosphors.
In a large number of rare-earth ions doped phosphors, Sm3+ ions are considered to be among the most popular and effective doped ions due to its outstanding luminescence properties. Sm3+ ions exhibit intensity emission in reddish orange region due to its 4G5/2 → 6HJ (J = 5/2, 7/2, 9/2, and 11/2) transitions in such phosphors Sr2MgTeO6:Sm3+, LiCa3MgV3O12:Sm3+ and Y1−x−yGdxVO4:ySm3+ (Zhao et al., 2019; Huang and Guo, 2018; Jaiswal et al., 2020).
In a general way, the selection of appropriate host materials are particularly significant for efficient luminescence of rare-earth ions. Rare-earth tungstates demonstrate high thermal and chemical stability, have good absorption in the NUV region and widely used in laser technology (Zhang et al., 2016; Atuchin et al., 2008, 2005). Hence, the preparation and properties of tungstate doped rare earth luminescent materials have aroused more and more interests. For instance, Y6WO12:Dy3+, Lu2–xSmxWO6 and KLaMgWO6:Mn4+ can be pointed (Yu et al., 2014; Zhang et al., 2018; Liang et al., 2019). Recently, the columnar-perovskite-type La7W4M3O30 (M = Nb, Ta) tungstate has been found to be a member of the A7B7O30 (A = La, B = Mo) family (Lacorre and Corbel, 2019). However, up to now, there were no reports on the optical properties of Sm3+ ions doped in La7Ta3W4O30 tungstate phosphor.
In this work, the novel orange-red emitting La7Ta3W4O30:xSm3+ (LTWO:xSm3+) phosphors were synthesized. The structural characterization, PL excitation (PLE) and PL properties, optimum concentrations, thermal stability and CIE chromaticity coordinates of the LTWO:xSm3+ phosphors were studied systematically. At final, a white LED with good Ra was fabricated by using LTWO:0.01Sm3+ phosphor.
2 Experimental procedure
2.1 Preparation
LTWO:xSm3+ (x = 0.005, 0.01, 0.02, 0.05, 0.10, 0.15 and 0.20) phosphors were prepared by the method of solid-state synthesis method. The raw materials were La2O3 (99.99%), WO3 (99.8%), Ta2O5 (99.5%), and Sm2O3 (99.99%), which were from Sigma-Aldrich. The powder was weighed on the basis of the stoichiometric ratio and then ground appropriately in an agate mortar. Then, the mixtures were preheated at 700 °C for 2 h in the air, then reground and sintered at 1350 °C for 10 h in the air. Eventually, the phosphor powders of white color were obtained. The equation for this reaction is as follows:
2.2 Measurements
The X-ray diffraction (XRD) patterns were recorded by a Bruker D2 PHASER X-ray diffractometer with use of Cu Kα radiation (λ = 0.15405 nm) in the 2θ angle range of 10–70°. The morphology of LTWO:Sm3+ samples was measured by a Nova Nano SEM-450 field emission scanning electron microscopy (SEM). The size distribution was examined by a Malvern MS2000 laser particle size analyzer. The PL spectra at different temperatures (300–500 K) and the decay times were studied with the use of an Edinburgh FLS 980 spectrometer. The electroluminescence spectrum (EL) of the w-LED fabricated with LTWO:Sm3+ phosphor was examined by a fiber optic spectrometer Ocean Optics, USB 4000.
3 Results and discussion
3.1 Phase analysis
Fig. 1 (a) is the crystal structure of LTWO, which belongs to the trigonal crystal system, with R-3 (No.148) space group. The cell parameters are a = b = 17.0701(2) Å, c = 6.8851(1) Å, V = 1737.45(5) Å3, and Z = 3 (Goutenoire et al., 2005; La7Ta3W4O30 Crystal Structure). The new compound LTWO has the same structure type as La7Mo7O30 and it belongs to the A7B7O30 family. This type is a columnar-perovskite-type arrangement, which is formed by the isolated hexagonal perovskite building units (Goutenoire et al., 1999). In this structure, the 3b site is occupied by Ta(1), it coordinated with six oxygen atoms, and all the Ta(1)-O distances are equal to 1.9922 Å but the bond angles are different. Thus, the coordination polyhedron [Ta(1)O6] is an almost regular octahedron as shown in Fig. 1 (b). The coordination of Ta(2)/W(1) is similar to Ta(1), and the coordination polyhedron [Ta(2)/W(1)O6] is also an octahedron with six oxygen atoms, but with a strong distortion, the bond length is between 1.8824 and 2.2401 Å. The coordination polyhedron of La(1) and La(2) are different. La(1) occupies the 3a site which coordinates with twelve oxygen atoms and the coordination polyhedron [La(1)O12] is a quasi-normal icosahedron with La-O distances ranging from 2.5619 to 2.7318 Å. La(2) is coordinated with nine oxygen atoms, and the coordination polyhedron [La(2)O9] is more distorted, with the minimum bond length of 2.4231 Å3 and the maximum bond length of 2.8605 Å. The atom coordinates in LTWO structure are listed in Table 1. Moreover, with the purpose of further studying the substituted ions (La3+) in LTWO host lattices, the result can be estimated by this equation (Sun et al., 2018):
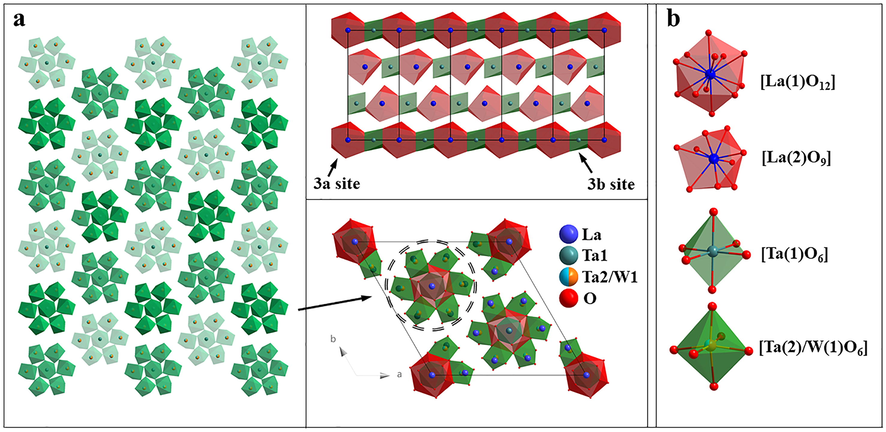
(a) The crystal structure of LTWO. (b) The coordination environment of La(1), La(2), Ta(1) and Ta(2)/ W(1) atoms.
Atom
Site
Occupancy
x
y
z
La1
3a
1
0
0
0
Ta1
3b
1
0
0
0.5
La2
18f
1
0.7766(2)
−0.0173(2)
0.3443(4)
W1/Ta2
18f
0.66/0.33
0.1998(2)
0.0151(2)
0.1596(5)
O1
18f
1
0.2460(2)
0.1006(2)
0.3563(5)
O2
18f
1
0.2930(2)
0.0431(2)
−0.0074(5)
O3
18f
1
0.1691(2)
0.1118(2)
0.0454(5)
O4
18f
1
0.2044(3)
−0.0726(2)
0.3067(4)
O5
18f
1
0.0348(2)
0.1049(2)
0.3237(5)
In this equation, Dr is the radius percentage difference, R1 and R2 are the radius of the substituted ions and doped ions, respectively. CN is the coordination number. In this work, Sm3+ ions can replace La(1) and La(2), the coordination numbers are 12 and 9, respectively. When CN = 12, the radius of La(1) and Sm3+ ions are 1.032 Å and 0.958 Å, the Dr value is equal to 7.17% (Shannon, 1976). When CN = 9, the radius of La(2) and Sm3+ ions are 1.1 Å and 1.02 Å, the value of Dr is 7.27%. In both cases, the Dr Values are less than 30%, indicating that Sm3+ ions can replace La3+ ions without damaging the crystal structure, and the Dr value of La(1) is less than that of La(2), manifesting that Sm3+ ions occupy La(1) site first.
The XRD patterns of LTWO:xSm3+ (x = 0.005–0.20) phosphors are shown in Fig. 2 (a). The simulated pattern for LTWO host is obtained according to the study of F. Goutenoire et al. (Goutenoire et al., 2005). By comparison, it is clearly that the peaks of all samples fit well with the simulated pattern of LTWO. It also matches well with the La7Mo7O30 standard card (PDF 89-4366), which indicated that the structure of LTWO is the same as La7Mo7O30. But there are two small impure peaks in the XRD patterns, which are ascribed to La0.33TaO3 admixture (PDF 42-0061) (Trunov et al., 1968). Therefore, the experimental conditions will be further optimized. For the purpose of further studying the Sm3+ environment, the Rietveld refinement of the LTWO:0.01Sm3+ phosphor by GSAS software was carried out and the different pattern is presented in Fig. 2(b). As obtained by Rietveld analysis, the LTWO:0.01Sm3+ compound crystallized with unit cell parameters of a = b = 17.1125 Å, c = 6.9177 Å, V = 1754.376 Å3, and Z = 3 (Rwp = 15.19%, Rp = 9.30%). The appropriate Rwp and Rp values indicate that the Sm3+ ions have successfully replaced La3+ ions. Furthermore, the refinement parameters of the sample are listed in Table 2.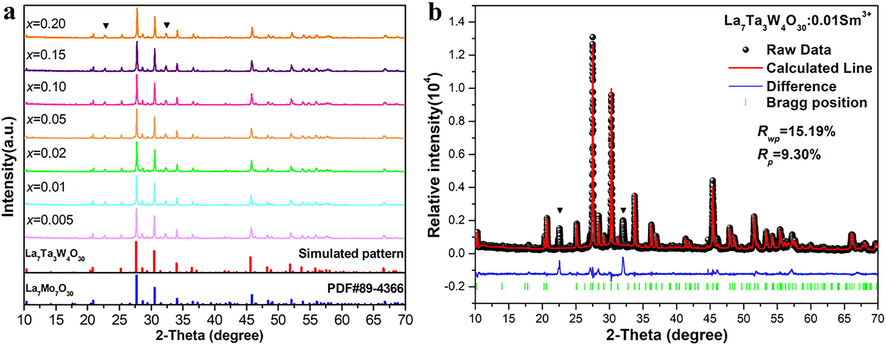
(a) The XRD patterns of LTWO:xSm3+ (x = 0.005–0.20) phosphors. (b) The Rietveld refinement of the LTWO:0.01Sm3+ phosphor.
Formula
La7Ta3W4O30:0.01Sm3+
Space group
R-3 (No.148)
Cell parameters
a = 17.1125 Å
b = 17.1125 Å
c = 6.9177 Å
α = β = 90°
γ = 120°
Z = 3
Cell Volume (Å)
1754.376
χ2
7.818
Rwp
15.19%
Rp
9.30%
The particle sizes and surface morphology are significant for the phosphor properties. The SEM micrographs of the samples with doping concentrations of 2 and 20 mol%, which are monitored at the magnification of 20,000 times are shown in Fig. 3(a) and (b), respectively. It is obvious that the samples are mainly composed of partly coalescent particles and the particle diameters are very small and evenly distributed. It could be mentioned that such particle morphology is formed due to intense grain interdiffusion and it is typically observed in oxide compounds subjected to high temperature treatment (Atuchin et al., 2008; Lim et al., 2015). Comparing the panels, it can be concluded that the Sm3+ ion concentration has little effect on the particle size. The particle size distribution in LTWO:0.20Sm3+ is presented in Fig. 3(c). The highest peak value of the particle size distribution is 21.678 µm, indicating the particle size of samples is mainly distributed around 21 µm. Therefore, this sample has the potential to be used in industrial w-LEDs.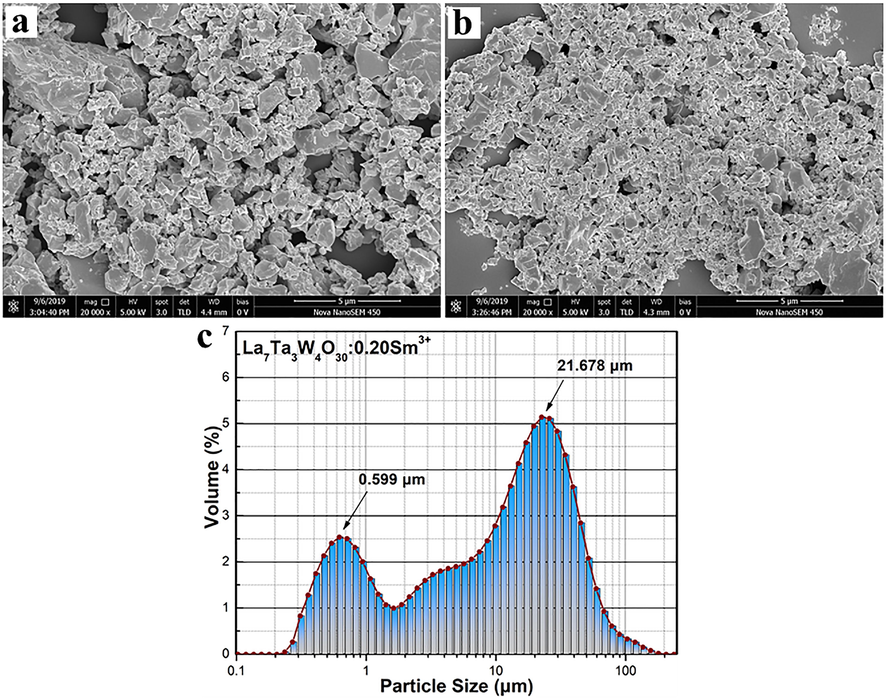
(a) and (b) The SEM micrographs of LTWO:0.01Sm3+ and LTWO:0.20Sm3+. (c) The particle size distribution of LTWO:0.20Sm3+.
In Fig. 4, the optical band gap (Eg) determination in the LTWO and LTWO:0.01Sm3+ compounds is shown. The samples have a strong absorption between 200 and 350 nm. Based on the relation between (αhν)2 and hν, the Eg value can be obtained by this formula (Devi et al., 2019):
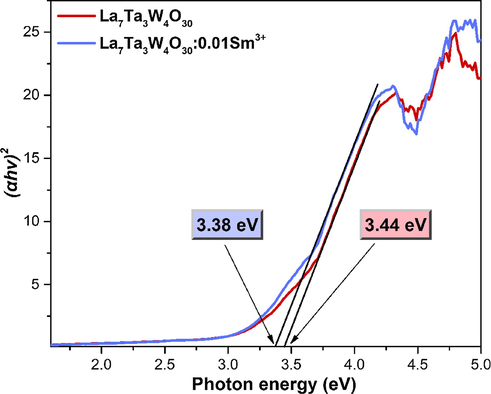
The relationship between the (αhν)2 and photon energy for LTWO and LTWO:0.01Sm3+.
3.2 Optical properties
The excitation spectrum of LTWO:0.01Sm3+, as monitored at 597 nm at room temperature, is shown in Fig. 5. It is mainly composed of two components. The first component is a broad band of CTB (charge transfer band) between 200 and 350 nm. By Gaussian fitting, it is be found that the wide band consists of two broads (a) and (b), which are due to the electron transition of O2–-Sm3+ and O2–-W6+, respectively (Li et al., 2017, 2011). The second component is a set of several sharp peaks appeared between 350 and 500 nm by the 4f-4f transitions of Sm3+ ions, which from the ground state 6H5/2 to the excited states 4D3/2, 4D1/2, 4F7/2, (6P,4P)5/2, 4G9/2, 4I13/2 and 4I11/2 at 361, 376, 404, 419, 439, 463 and 480 nm, respectively (Deng et al., 2015). Among these peaks, the highest one is located at 404 nm, manifesting that the samples can sufficiently be excited by the NUV chips and have a potential in w-LED manufacturing.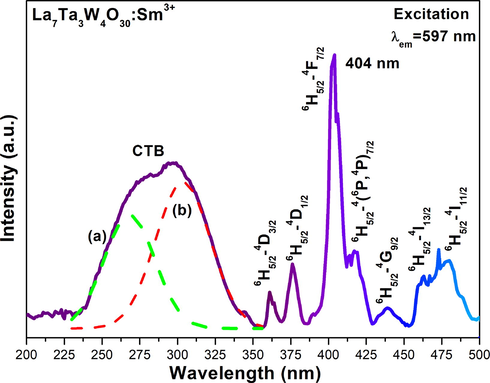
Excitation spectrum of LTWO:0.01Sm3+ (λem = 597 nm).
In Fig. 6(a), the emission spectrum is shown for LTWO:0.01Sm3+ phosphor excited at 404 nm, which revealed four obvious peaks between 500 and 750 nm. Distinctly, the peak at 597 nm, owing to 4G5/2 → 6H7/2 transition, has the highest intensity. Simultaneously, other characteristic peaks are centered at 561, 644 and 703 nm, which are in line with the 4f-4f electronic forbidden transitions of Sm3+ ions from the 4G5/2 level to 6HJ (J = 5/2, 9/2 and 11/2) levels (Guo et al., 2017; Atuchin et al., 2015, 2017). Among these peaks, the first peak at 561 nm is of MD (magnetic-dipole) natured, and the highest peak at 597 nm is combined MD and ED (electric-dipole) transition. The third peak at 644 nm is due to ED transition, which is sensitive to the crystal field. Based on Judd–Ofelt theory, the comparison of ED/MD ratio is a good way to judge the environment around the Sm3+ ions in LTWO host. The stronger the ED transition, the greater the asymmetry property, and vice versa. In this study, the ED transition (644 nm) is significantly stronger than the MD transition (561 nm) that indicates the asymmetry nature of Sm3+ ions in LTWO lattice. In Fig. 6(b), the Sm3+ energy level diagram, illustrating the Sm3+ ions energy transfer process in the LTWO host lattice, is given. Under the 404 nm excitation, Sm3+ ions at 6H5/2 ground state level absorb photon energy, and the electrons excite to 4F7/2 level, and, then the electrons of Sm3+ ions relax without radiation to the 4G5/2 level. At final, the radiative transition of Sm3+ ions from 4G5/2 level to 6HJ (J = 5/2, 7/2, 9/2 and 11/2) levels are corresponding to four sharp peaks at 561, 597, 644 and 703 nm, respectively.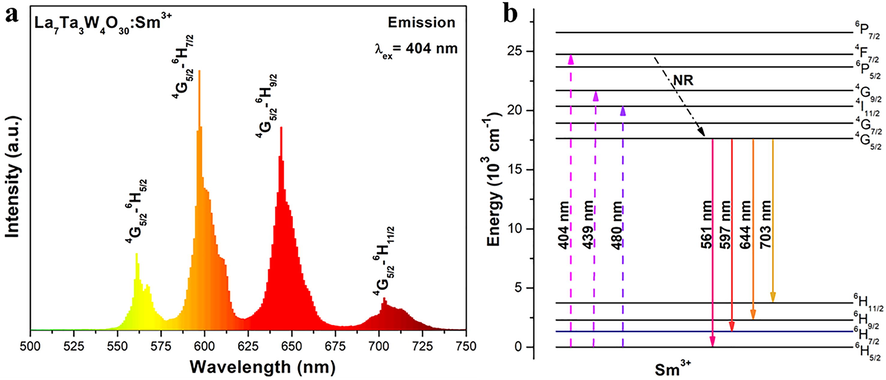
(a) Emission spectrum of LTWO:0.01Sm3+ (λex = 404 nm). (b) The Sm3+ energy level diagram.
The emission spectra of LTWO:xSm3+ (x = 0.005–0.20) phosphors are shown in Fig. 7(a). It is evident that the characteristic peaks of all phosphors are of similar shape except for the intensity, and no wavelength shift is detected at high dopant concentrations. With the doping level increases, the emission intensity first increases. When the doping content is higher than 1%, the emission intensity gradually decreases owing to concentration quenching, as shown in the upper right corner of Fig. 7(a). The luminescence intensity quenching is resulted from the energy transfer between activators. The critical transfer distance (Rc) can be calculated by this formula (Xia and Liu, 2012):
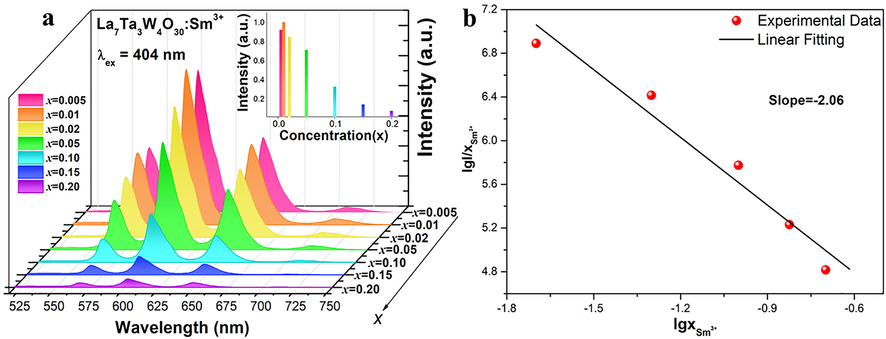
(a) Emission spectra of several LTWO:xSm3+ (x = 0.005–0.20) phosphors (λex = 404 nm). (Inset: The normalized intensity of the emission spectra). (b) The lgI/x ∼ lgx diagram of LTWO:xSm3+ (x = 0.005–0.20) phosphors.
Based on the theory of Dexter, the multipole interaction can be judged by the change of emission intensity (I) between the emission level and the multipole interaction. The value of I can be obtained by this equation (Chen et al., 2016):
The relation between lgI/x and lgx of LTWO:Sm3+ phosphors is displayed in Fig. 7(b), which indicates that the slope of lgI/x to lgx is −2.06. Afterward, Q is equal to 6.18, which is close to 6. This result manifests that the dipole-dipole interaction is the main mechanism of concentration quenching of Sm3+ ions emission in LTWO host.
3.3 CIE chromaticity coordinate and color purity
The CIE color coordinates of LTWO:xSm3+ (x = 0.005–0.20) phosphors can be calculated on the basis of PL spectra, and the formula is as follows (Robertson, 1968):
(In this study, the integral is obtained by summing in the range of 500–750 nm with the unit of 1 nm). Where X, Y, and Z are the tristimulus values that can be acquired from the P(λ). P(λ) means the PL spectral intensity at wavelength λ.
,
, and
are the color-matching functions. The CIE color coordinates of LTWO:Sm3+ phosphors are shown in Fig. 8(a). It is clear that all the coordinate points of phosphors are located at the boundary of the CIE graph, suggesting the samples have good color purity. Furthermore, the color purity can be calculated by this formula (Seeta Rama Raju et al., 2011):
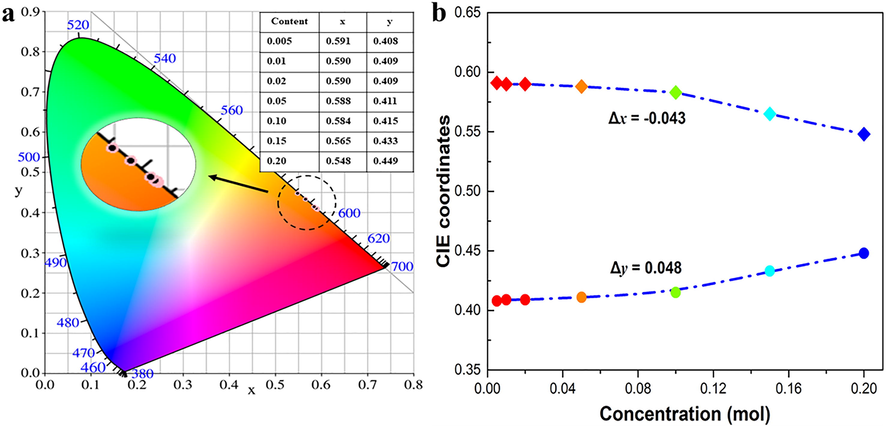
(a) The CIE chromaticity graph of LTWO:xSm3+ (x = 0.005–0.20) phosphor. (b) The movement of color coordinates x and y of LTWO:xSm3+ (x = 0.005–0.20).
In this equation,
are the color coordinates of the optical source point (0.333, 0.333).
are the color coordinates value of the phosphor.
are the CIE color coordinates of the extension of the line that connects
to
to the boundary. For the LTWO:0.01Sm3+ phosphor,
are (0.590, 0.409),
are (0.590, 0.410). The obtained color purity is 99.9% by fitting the formula. The color purity and the CIE color coordinates of other doping concentrations are given in Table 3. In Fig. 8(b), the extension of Fig. 8(a) is shown, reflecting the color coordinates movement of LTWO:xSm3+ (x = 0.005–0.20) phosphors. In the process of gradually increasing the doping concentration, the x-coordinate shift is Δx = −0.043 and the y-coordinate shift is Δy = 0.048. The Δx and Δy values are small, indicating that the color purity is less affected by Sm3+ doping concentration. Therefore, the LTWO:Sm3+ phosphors have a potential to replace the common red phosphors in the w-LEDs application.
Concentration × (mol)
CIE (x, y)
Color purity
0.005
(0.591, 0.408)
99.9%
0.01
(0.590, 0.409)
99.9%
0.02
(0.590, 0.409)
99.9%
0.05
(0.588, 0.411)
99.9%
0.10
(0.584, 0.415)
99.9%
0.15
(0.565, 0.433)
99.6%
0.20
(0.548, 0.449)
99.3%
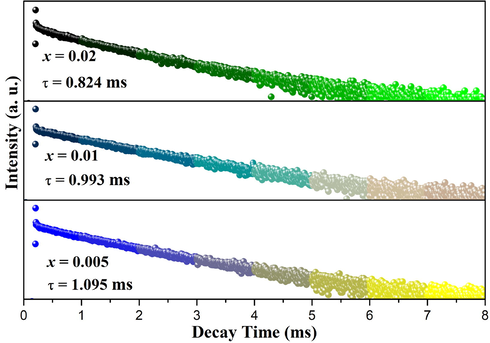
3.4 Luminescence decay curves
The decay curves of LTWO:xSm3+ (x = 0.005, 0.01, and 0.02) phosphors, which are monitored at 597 nm and excited under 404 nm, are shown in Fig. 9. The decay curves can be well fitted by this formula (Huang et al., 2018):
The decay curves of LTWO:xSm3+ (x = 0.005, 0.01, and 0.02) phosphors.
In this equation, I(t) is the luminescence intensity at time t. I0 is system noise which exactly is the background of the fluorescence intensity (Zhang et al., 2018). A is a constant and τ is the decay lifetime. When the Sm3+ ions contents are 0.5; 1 and 2 mol%, the lifetime of Sm3+ ions in LTWO samples are 1.095, 0.993, and 0.824 ms, respectively. With the increase of doped Sm3+ ions, the critical distance decreases gradually, which makes the decay time shorten gradually.
3.5 Thermal stability
The phosphor thermal stability is an essential factor for w-LEDs application. Good phosphors are required to have good thermal stability to avoid thermal quenching at high temperature. The PL spectra of LTWO:0.01Sm3+ recorded from 300 to 500 K under 404 nm excitation are presented in Fig. 10(a). It is clear that all spectra have the same peak shape and position. With the temperature increase, the emission intensity of the phosphor decreases gradually. The emission intensity of the sample is 85% of the initial intensity at normal working temperature (420 K) of LED. T0.5 is the quenching temperature while the emission intensity reduced to 50% of the initial intensity. It can be observed from the inset in Fig. 10 (a) that the T0.5 of LTWO:0.01Sm3+ phosphor is greater than 500 K and the luminescence intensity decreased slightly. In Fig. 10 (b), the contour map of the strongest emission peak changing with temperature is shown. With the temperature increasing, the intensity of the emission peak at 597 nm decreases slowly.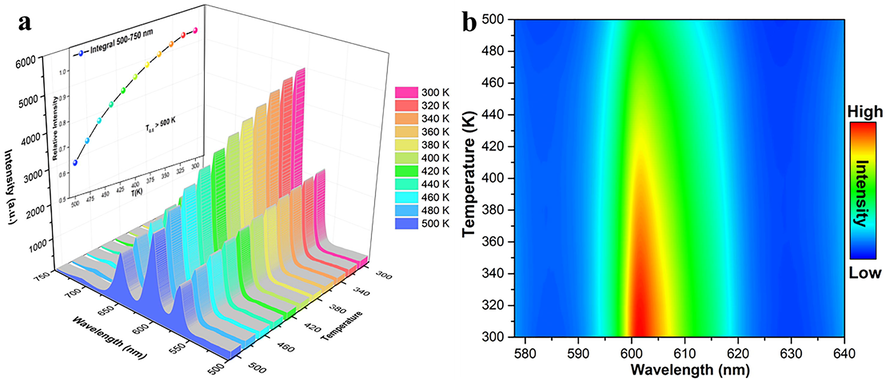
(a) The PL spectra of LTWO:0.01Sm3+ detected from 300 to 500 K under 404 nm excitation. Iinset: The relationship between PL intensity and temperature). (b) The intensity of the strongest peak (597 nm) changing with temperature of LTWO:0.01Sm3+ phosphor.
The activation energy (Ea) of LTWO:Sm3+ can be obtained by the Arrhenius formula (Qiao et al., 2019):
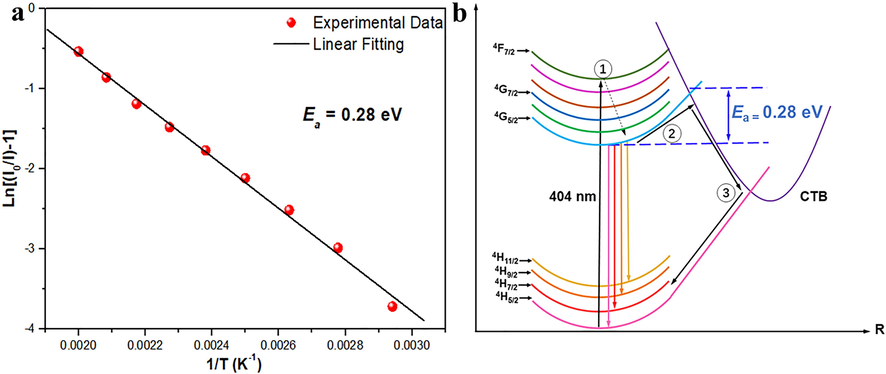
(a) The activation energy photograph of LTWO:0.01Sm3+ phosphor for the thermal quenching process. (b) Thermal quenching mechanism of Sm3+ in LTWO host.
3.6 Fabrication of w-LED
For the purpose of investigating the application of LTWO:Sm3+ phosphors, a w-LED was fabricated by merging a NUV 407 nm chip with BaMgAl10O17:Eu2+ (BAM, blue phosphor), (Ba, Sr)2SiO4:Eu2+ (green phosphor) and the synthesized LTWO:0.01Sm3+ (orange-red phosphor). The EL spectrum of the w-LED is shown in Fig. 12(a). Several main peaks of the w-LED are located at 560, 595, 641, and 702 nm, which are basically consistent with previous spectroscopic data. The fabricated w-LED has high Ra (86) and good CCT (6818 K) that are comparable with the parameters of those of w-LED structures based on different phosphors (Xia et al., 2013; Ji et al., 2014; Leaño et al., 2016). Ra plays an important role in the application of w-LEDs, which is the average value of the special color rendering index from R1 to R8. R9 is the saturated red special color rendering index. R1 to R14 are special color rendering indexes, representing the color rendering performance of different colors (Wang et al., 2017). Fig. 12(b), the Ra value histogram is given for the fabricated w-LED and the commercial w-LED (blue chip + YAG phosphor), it can be observed that the fabricated w-LED has higher Ra (86) and R9 (94) than Ra (80) and R9 (14) of the commercial w-LED (Zhang et al., 2008). These results indicate that the fabricated w-LED has stronger white light rendering performance than the commercial w-LED. The LTWO:Sm3+ phosphors can help to overcome the lack of red light in traditional commercial w-LEDs.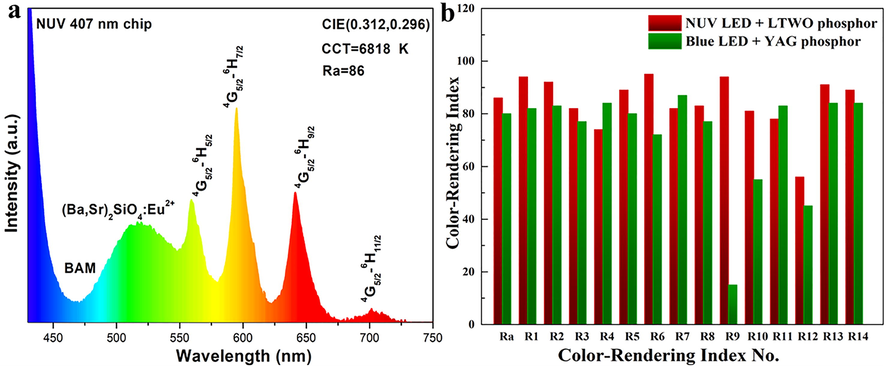
(a) The EL spectrum of the w-LED fabricated by a NUV 407 nm chip with BAM, (Ba, Sr)2SiO4:Eu2+ and LTWO:0.01Sm3+. (b) The Ra histogram of the w-LED manufactured by combining NUV chip with LTWO:0.01Sm3+ phosphor and the commercial w-LED made by blue chip and YAG phosphor.
The CIE chromaticity coordinates and actual pictures of LTWO:0.01Sm3+ phosphor and the fabricated w-LED are shown in Fig. 13. The CIE chromaticity coordinates of LTWO:0.01Sm3+ are (0.590, 0.409), which fall in the orange-red region. The CIE chromaticity coordinates of the fabricated w-LED are (0.312, 0.296), which are in the centre of the white region. The real sample of LTWO:0.01Sm3+ phosphor emits bright orange-red light under the exposure of ultraviolet lamp. The fabricated w-LED shows a dazzling white light driven by a current of 300 mA and a voltage of 3.2 V. Therefore, all the results manifest that the LTWO:Sm3+ phosphors can be well applied in w-LEDs manufacture.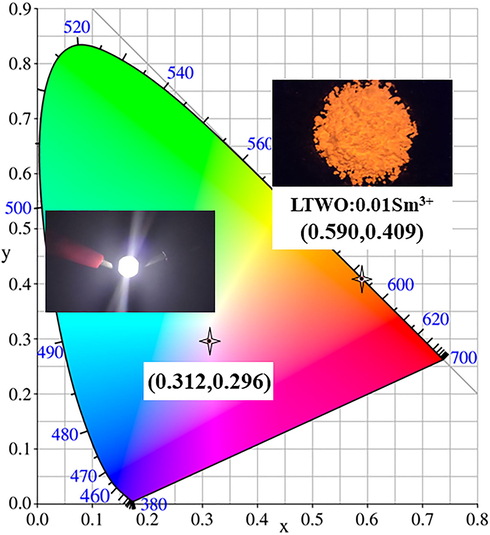
The CIE chromaticity coordinates and actual pictures of LTWO:0.01Sm3+ phosphor and the fabricated w-LED.
4 Conclusion
In summary, the novel orange-red light emitting LTWO:Sm3+ phosphors were successfully prepared via the solid-state reaction. The Rietveld refinement manifested that the samples belong to the trigonal crystal structure of space group R-3 (No.148), and Sm3+ ions replace La3+ ions in the LTWO lattice. The PLE spectrum demonstrates that the LTWO:Sm3+ phosphors can be availably excited by the O2–-Sm3+ CTB, O2–-W6+ CTB, and NUV light. The LTWO:Sm3+ phosphors emit intense orange-red light at 597 nm under 404 nm excitation, owing to the 4G5/2→6H7/2 transition. The quenching concentration of LTWO:Sm3+ phosphors is approximately 1 mol%. The main quenching mechanism of Sm3+ ions in LTWO host lattice is the dipole-dipole interaction. The quenching temperature is higher than 500 K, and the Ea is as high as 0.28 eV. By merging a NUV 407 nm chip with BAM blue phosphor, (Ba, Sr)2SiO4:Eu2+ green phosphor and LTWO:0.01Sm3+ orange-red phosphor, a w-LED with the CIE chromaticity coordinates of (0.312, 0.296) and Ra of 86 was obtained. All the results suggest that the orange-red LTWO:Sm3+ phosphors have the potential value to replace the commercial red phosphors in w-LEDs application.
Acknowledgments
The work was supported by the Natural Science Foundation of Shaanxi Province (Grant No. 2018JM5055), the Fundamental Research Funds for the Central Universities (2452019076), the Hunan Provincial Key Laboratory of Xiangnan Rare-Precious Metals Compounds and Applications (2019XGJSKFJJ01), the Construction Program of the key discipline in Hunan Province, the Projects of the Education Department of Hunan Province (No.18A465), the Science and Technology Plan Project of Chenzhou city (jsyf2017014) and Undergraduate Innovation Fund of Northwest A&F University, China (201910712037).
References
- Influence of hydrogen peroxide addition on photoluminescence of Y2O3:Eu3+ nanophosphors prepared by laser ablation in water. J. Am. Ceram. Soc.. 2014;97:1083-1090.
- [Google Scholar]
- Core level spectroscopy and RHEED analysis of KGd(WO4)2 surface. Solid State Commun.. 2005;133:347-351.
- [Google Scholar]
- Surface crystallography and electronic structure of potassium yttrium tungstate. J. Appl. Phys.. 2008;104 033518
- [Google Scholar]
- Pressure-stimulated synthesis and luminescence properties of microcrystalline (Lu, Y)3Al5O12:Ce3+ garnet phosphors. ACS Appl. Mat. Interfaces. 2015;7:26235-26243.
- [Google Scholar]
- Electronic structure of β-RbSm (MoO4)2 and chemical bonding in molybdates. Dalton Trans.. 2015;44:1805-1815.
- [Google Scholar]
- Structural and spectroscopic properties of self-activated monoclinic molybdate BaSm2(MoO4)4. J. Alloys Compd.. 2017;729:843-849.
- [Google Scholar]
- Synthesis and photoluminescence properties of Ca2LaTaO6:Mn4+ phosphor for plant growth LEDs. J. Alloys Compd.. 2019;780:749-755.
- [Google Scholar]
- Preparation and spectroscopic investigation of novel NaAlP2O7:Eu2+ phosphors for white LEDs. J. Alloys Compd.. 2016;680:20-25.
- [Google Scholar]
- Photoluminescence properties of a new orange-red emitting Sm3+ doped Y2Mo4O15 phosphor. J. Solid State Chem.. 2015;228:110-116.
- [Google Scholar]
- A novel Eu3+-doped garnet-type tellurate red-emitting phosphor with high thermal stability and color purity. J. Lumin.. 2017;192:684-689.
- [Google Scholar]
- Near-ultraviolet excited down-conversion Sm3+-doped Ba5Zn4Gd8O21 reddish-orange emitting nano-diametric rods for white LEDs. Ceram. Int.. 2019;45:7397-7406.
- [Google Scholar]
- Synthesis of Y3Al5O12:Ce3+ phosphor in the Y2O3-Al metal-CeO2 ternary system. J. Mater. Sci.. 2017;52:13033-13039.
- [Google Scholar]
- Ab Initiodetermination of the novel perovskite-related structure of La7Mo7O30 from powder diffraction. J. Solid State Chem.. 1999;142:228-235.
- [Google Scholar]
- Extension of the La7Mo7O30 structural type with La7Nb3W4O30 and La7Ta3W4O30 compounds. J. Solid State Chem.. 2005;178:2811-2817.
- [Google Scholar]
- Preparation of Y2O2S:Eu3+ phosphors by a novel decomposition method. Mater. Lett.. 2008;62:600-602.
- [Google Scholar]
- Luminescence investigations of novel orange-red fluorapatite KLaSr3(PO4)3F:Sm3+ phosphors with high thermal stability. J. Am. Ceram. Soc.. 2017;100:2221-2231.
- [Google Scholar]
- LiCa3MgV3O12:Sm3+: A new high-efficiency white-emitting phosphor. Ceram. Int.. 2018;44:10340-10344.
- [Google Scholar]
- High-brightness and high-color purity red-emitting Ca3Lu(AlO)3(BO3)4:Eu3+ phosphors with internal quantum efficiency close to unity for near-ultraviolet-based white-light-emitting diodes. Opt. Lett.. 2018;43:1307-1310.
- [Google Scholar]
- Luminescence properties of yttrium gadolinium orthovanadate nanophosphors and efficient energy transfer from VO43− to Sm3+ via Gd3+ ions. Arab. J. Chem.. 2020;13:474-480.
- [Google Scholar]
- New yellow-emitting whitlockite-type structure Sr1. 75Ca1. 25 (PO4)2:Eu2+ phosphor for near-UV pumped white light-emitting devices. Inorg. Chem.. 2014;53:5129-5135.
- [Google Scholar]
- Structure evolution and photoluminescence of Lu3(Al, Mg)2(Al, Si)3O12:Ce3+ phosphors: new yellow-color converters for blue LED-driven solid state lighting. J. Mater. Chem. C. 2016;4:6855-6863.
- [Google Scholar]
- La7Ta3W4O30 Crystal Structure: Datasheet from “PAULING FILE Multinaries Edition – 2012” in SpringerMaterials (https://materials.springer.com/isp/crystallographic/docs/sd_1210382), in: P. Villars, K. Cenzual (Eds.), Springer-Verlag Berlin Heidelberg & Material Phases Data System (MPDS), Switzerland & National Institute for Materials Science (NIMS), Japan.
- Extension of the AnBnO3n+2 slicing/oxidizing process from 2D layered to 1D columnar perovskites: the La7W7-xMxO30 structural family with Di-, Tri-, and tetravalent transition metal m substitutes to tungsten. Inorg. Chem.. 2019;58:4289-4299.
- [Google Scholar]
- Green light-excitable Ce-doped nitridomagnesoaluminate Sr[Mg2Al2N4] phosphor for white light-emitting diodes. Chem. Mater.. 2016;28:6822-6825.
- [Google Scholar]
- Red-emission enhancement of the CaAlSiN3:Eu2+ phosphor by partial substitution for Ca3N2 by CaCO3 and excess calcium source addition. RSC Adv.. 2015;5:76507-76515.
- [Google Scholar]
- Photoluminescence properties, energy transfer and thermal stability of the novel red-emitting CaGd2(WO4)4:Eu3+, Sm3+ phosphors. Mater. Res. Bull.. 2017;95:86-94.
- [Google Scholar]
- Crystal structure, eectronic structure, and optical and photoluminescence properties of Eu(III) ion-doped Lu6Mo(W)O12. Inorg. Chem.. 2011;50:12522-12530.
- [Google Scholar]
- Mn4+-activated KLaMgWO6: A new high-efficiency far-red phosphor for indoor plant growth LEDs. Ceram. Int.. 2019;45:4564-4569.
- [Google Scholar]
- Microwave sol-gel synthesis and upconversion photoluminescence properties of CaGd2(WO4)4:Er3+/Yb3+ phosphors with incommensurately modulated structure. J. Solid State Chem.. 2015;228:160-166.
- [Google Scholar]
- Temperature sensing based on the up-conversion emission of Tm3+ in a single KLuF4 microcrystal. J. Alloys Compd.. 2017;728:1037-1042.
- [Google Scholar]
- Tuning of the compositions and multiple activator sites toward single-phased white emission in (Ca9-xSrx)MgK(PO4)7:Eu2+ phosphors for solid-state lighting. Inorg. Chem.. 2019;58:5006-5012.
- [Google Scholar]
- Computation of correlated color temperature and distribution temperature. J. Opt. Soc. Am.. 1968;58:1528-1535.
- [Google Scholar]
- Blue and green emissions with high color purity from nanocrystalline Ca2Gd8Si6O26:Ln (Ln=Tm or Er) phosphors. J. Alloys Compd.. 2011;509:7537-7542.
- [Google Scholar]
- Revised effective ionic radii and systematic studies of interatomic distances in halides and chalcogenides. Acta Crystallographica Section A: Crystal Phys., Diffraction, Theoretical General Crystallography. 1976;32:751-767.
- [Google Scholar]
- Synthesis and photoluminescence properties of novel far-red-emitting BaLaMgNbO6:Mn4+ phosphors for plant growth LEDs. RSC Adv.. 2018;8:28538-28545.
- [Google Scholar]
- Ion exchanged YVO4:Eu3+ nanocrystals and their strong luminescence enhanced by energy transfer of thenoyltrifluoroacetone ligands. J. Alloys Compd.. 2014;590:277-282.
- [Google Scholar]
- The Cr-doping effect on white light emitting properties of Ce: YAG phosphor ceramics. J. Am. Ceram. Soc.. 2017;100:2590-2595.
- [Google Scholar]
- Concentration-dependent luminescence and energy transfer of flower-like Y2(MoO4)3:Dy3+ phosphor. J. Alloys Compd.. 2011;509:6096-6101.
- [Google Scholar]
- Excitation pathway and temperature dependent luminescence in color tunable Ba5Gd8Zn4O21:Eu3+ phosphors. J. Mater. Chem. C. 2013;1:2338-2344.
- [Google Scholar]
- Enhanced performance of Sr2Si5N8:Eu2+ red afterglow phosphor by co-doping with boron and oxygen. J. Lumin.. 2018;204:36-40.
- [Google Scholar]
- Ce-doped La3Si6.5Al1.5N9.5O5.5, a rare highly efficient blue-emitting phosphor at short wavelength toward high color rendering white LED application. ACS Appl. Mat. Interfaces. 2017;9:22665-22675.
- [Google Scholar]
- A novel red phosphor Ba2La4Y4(SiO4)6O2:Eu3+ with high quantum yield and thermal stability for warm white LEDs. J. Alloys Compd.. 2019;789:381-391.
- [Google Scholar]
- Tunable blue-green color emission and energy transfer of Ca2Al3O6F:Ce3+, Tb3+ phosphors for near-UV white LEDs. J. Phys. Chem. C. 2012;116:15604-15609.
- [Google Scholar]
- Structural and luminescence properties of yellow-emitting NaScSi2O6:Eu2+ phosphors:Eu2+ site preference analysis and generation of red emission by codoping Mn2+ for white-light-emitting diode applications. J. Phys. Chem. C. 2013;117:20847-20854.
- [Google Scholar]
- White-light long persistent and photo-stimulated luminescence in CaSnSiO5:Dy3+. J. Alloys Compd.. 2013;574:22-26.
- [Google Scholar]
- Photoluminescence properties of novel Host-sensitized Y6WO12:Dy3+ phosphors. J. Am. Ceram. Soc.. 2014;97:2170-2176.
- [Google Scholar]
- Photoluminescence characteristics of high thermal stable fluorosilicate apatite Ba2Y3(SiO4)3F:Sm3+ orange-red emitting phosphor. Ceram. Int.. 2015;41:6030-6036.
- [Google Scholar]
- Temperature effects on photoluminescence of YAG:Ce3+ phosphor and performance in white light-emitting diodes. J. Rare Earths. 2008;26:446-449.
- [Google Scholar]
- Monoclinic Lu2-xSmxWO6 based white light-emitting phosphors: from ground-excited-states calculation prediction to experiment realization. Inorg. Chem.. 2018;57:507-518.
- [Google Scholar]
- A universal approach for calculating the Judd-Ofelt parameters of RE3+ in powdered phosphors and its application for the beta-NaYF4:Er3+/Yb3+ phosphor derived from auto-combustion-assisted fluoridation. PCCP. 2018;20:15876-15883.
- [Google Scholar]
- High-brightness Sm3+ doped La0.67Mg0.5W0.5O3 red phosphor for NUV light-emitting diodes application. J. Alloys Compd.. 2016;654:146-150.
- [Google Scholar]
- Tunable emitting phosphors K3Gd(PO4)2:Tm3+-Dy3+ for lightemitting diodes and field emission displays. J. Alloys Compd.. 2017;728:564-570.
- [Google Scholar]
- Synthesis and photoluminescence properties of Sm3+ and Dy3+ ions activated double perovskite Sr2MgTeO6 phosphors. J. Lumin.. 2019;207:520-525.
- [Google Scholar]
- Effect of Sr/Ca substitution on phase structure and photoluminescence properties of micro-SrxCa1-xAlSiN3:Eu2+ phosphor for high CRI white LEDs. Ceram. Int.. 2016;42:14956-14962.
- [Google Scholar]


