

Stir bar sorptive extraction for central nervous system drugs from biological fluids
-
Received: ,
Accepted: ,
This article was originally published by Elsevier and was migrated to Scientific Scholar after the change of Publisher.
Available online 15 June 2010
Abstract
A review with 75 references is presented that deals with the reported methods for analysis of some important central nervous system (CNS) drugs in biological fluids utilizing stir bar sorptive extraction (SBSE) technique covering the years from 2000 to 2008. The theoretical aspects of SBSE, as well as an significant number of applications have been published, showing the advantages of this technique over the classical extraction techniques (liquid–liquid extraction (LLE) and solid-phase extraction (SFE). In this review, recent SBSE developments and a focus on the development of new instrumental approaches and sorbent phases are presented.
Keywords
Stir bar sorptive extraction
Central nervous system drugs
Biological fluids

1 Introduction
Most common techniques for extraction drugs from biological fluids have been liquid–liquid extraction (Vlase et al., 2005; Malfará et al., 2007; Titier et al., 2003) and solid-phase extraction (Juan et al., 2005; Sabbiono et al., 2004; Frahnert et al., 2003). However, modern trends in analytical chemistry are towards the simplification, in miniaturization of sample preparation, minimization of sample preparation, minimization of organic solvent used and sample volumes. In particular the reduction of solvent consumption in analytical laboratories is expected to contribute significantly to reduction of analytical costs (Melo et al., 2009).
New solventless sample-enrichment techniques that allow direct extraction of solutes from biological fluids have recently been introduced such as stir bar sorptive extraction (SBSE) (Tienpont et al., 2002; Benijts et al., 2001; Fernandes et al., 2006; Tiepont et al., 2003; Kawaguchi et al., 2004a,b; Lambert et al., 2005; Chaves et al., 2007), solid-phase microextraction (SPME) (Silva et al., 2007; Alves et al., 2007) and in tube SPME (Silva et al., 2008; Queiroz et al., 2007). The techniques combine extraction and concentration of analytes in a single step, thereby reducing the time required to prepare the samples. In SBSE, a stir bar coated with polydimethylsiloxane (PDMS) phase is added to a vial containing the sample as shown in Fig. 1; this is stirred until analytes partition equilibrium time reached with sorbent. After the extraction, the analytes can be introduced quantitatively into the analytical system by thermal or liquid desorption (Tienpont et al., 2002).
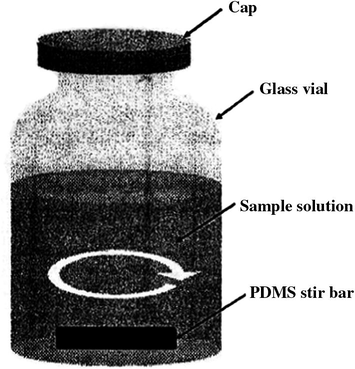
- Schematicatic of SBSE set-up.
The PDMS (non-polar phase) is the only commercially available polymer for coating stir bars. More recently, in-house procedures for stir bar coating have been developed to increase the versatility of SBSE technique. Bicchi et al. (2005) developed dual-phase twisters using different carbons as an additional concentrating phase. The successful combination of two concentrating phases enhanced the recovery of volatile and/or polar compounds compared with conventional PDMS stir bars. Liu et al. (2004) described the use of a compact and thermally stable porous hydroxy-terminated phase for the extraction of polycyclic aromatic hydrocarbons, n-alkanes, and phosphorus pesticides from water samples.
Lambert et al. (2005) prepared a biocompatible stir bar sorptive extraction device using an alkyl-diol-silica (ADS) restricted access material (RAM) as the SBSE coating. The ADS-RAM SBSE was able to simultaneously fractionate the protein component from a biological sample, while directly extracting caffeine and its metabolites, overcoming the present disadvantages of direct sampling in biological matrices, such as fouling of the extracting coating by proteins. Nogueira and Silva (Silva and Nogueira, 2008) proposed polyurethane foams as new polymeric phases for SBSE. It was demonstrated that these polymers present remarkable stability and excellent mechanical resistance for the enrichment of organic compounds from aqueous samples. Huang et al. (2008) developed a monolithic new phase, poly(methacrylic acid stearyl ester-ethylene dimethacrylate), for simultaneous SBSE/LC determination of six steroid sex hormones in urine.
Polypyrrole has been used as an extraction phase due to its permeability (porous structure), and multifunctional properties, which result in intermolecular interactions like acid-base, π-π, dipole-dipole, hydrophobic hydrogen bonding, and ion exchange between the polymer and analyte (Wu and Pawliszyn, 2001; Pawliszyn and Wu, 2001).
A new polymeric coating consisting of a dual-phase dimethylsiloxane (PDMS) and polypyrrole (PPY) was developed for stir bar sorptive extraction (SBSE) of second generation antidepressants from plasma samples for therapeutic drug monitoring (Melo et al., 2009). In this review article the author focused on the novel methods that involve SBSE and their applications in CNS drugs analysis.
2 Stir bar sorptive extraction (SBSE) principle
Sorptive extraction by nature is an equilibrium technique, and for a water samples the extraction of solutes from aqueous phase into the extraction medium is controlled by the partitioning coefficient of the solutes between the silicone phase and the aqueous phase (Lord and Pawliszyn, 2000). Studies have correlated this partitioning coefficient with the octanol–water distribution coefficients (Ko/w). Although not fully correct, the octanol–water distribution coefficient gives a good indication if and how well a given solute can be extracted with solid-phase micro-extraction (SPME) or stir bar sorptive extraction (Baltussen et al., 1999a,b; Pasche and Popp, 1999).
Moreover, it is very important to realize that the sorption equilibrium is also depend upon the phase ratio, and thus on the amount of polydimethylsiloxane applied. This relationship is shown in Eq. (1).
The distribution coefficient between polydimethylsiloxane and water (KPDMS/w) is defined as the ratio between the concentration of a solute in the polydimethylsiloxane phase (CPDMS) over the concentration in the water (Cw) at equilibrium. This ratio is equal to the ratio of the mass of the solute in the polydimethylsiloxane phase (mPDMS) over the mass of the solute in the aqueous phase (mw) times the phase ratio β (with β = Vw/VPDMS).
The recovery, expressed as the ratio of the extracted amount of solute (mPDMS) over the original amount of solute in the water (mo = mPDMS + mw) thus is determined by the distribution coefficient KPDMS/w and by the phase ratio β, as described in Eq. (2):
Using this equation, the theoretical recovery for a solute with a known partition coefficient and a given phase ratio can be calculated. The obtained value, however, is only obtained under full equilibrium conditions. From Eq. (2), it is clear that the extraction efficiency increases with increasing KPDMS/w. Since KPDMS/w is similar to the octanol–water distribution coefficient (Ko/w), extraction efficiency on PDMS, in general, decreases with increasing polarity. Besides the KPDMS/w factor, the phase ratio β (volume sample/volume polydimethylsiloxane) also is important. The higher the dimethylsiloxane concentration, the lower the β factor and higher the extraction efficiency.
Fig. 2 shows the influence of Ko/w and phase ratio on extraction efficiency. For a given phase ratio (sample volume/PDMS volume) an “S-shape” curve is obtained, whereby the position of the curve depends on the β ratio (David et al., 2003). For SPME, the volume of polydimethylsiloxane is 0.5 μL. For a sample of 10 mL, the phase ratio is thus 20,000. This results in poor recoveries for solutes with low Ko/w values. A solute with log Ko/w = 3 (e.g. naphthalene, Ko/w = 3.17) is only recovered for 4.8%.
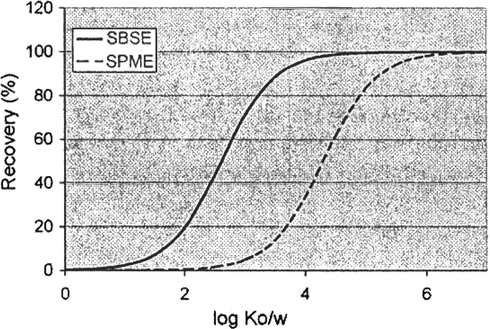
- Theoretical recovery (%) in function of solute log Ko/w for SPME (100 μm fiber, 0.5 μL PDMS) and SBSE (1 cm × 0.5 mm df, 25 μL PDMS) and 10 mL sample volume. Equilibrium sampling is assumed.
Using SBSE with a 1 cm stir bar coated with 0.5 mm phase (film-thickness df = 0.5 mm), the PDMS volume is 25 μL the β ratio 417 (also for a 10 ml sample volume). For a solute with Ko/w = 3, the recovery increases to 71%. From Fig. 2, it is clear that in SBSE quantitative extraction (100%) is reached at much lower Ko/w values than in SPME. The increased recovery obtained by SBSE in comparison to SPME has been demonstrated by different groups using pesticides (Popp et al., 2003; Blasco et al., 2004) as test solutes. Also, in headspace sampling, the larger PDMS volume results in higher recovery in comparison to SPME, as demonstrated by Tienpont et al. (2000).
If the experimental recoveries obtained for a mixture of volatile organic compounds are plotted versus the octanol–water partitioning coefficient of the solutes, an “S-shape” curve is obtained showing good correlation between experimental and theoretical values. The theoretical recoveries (at equilibrium) can thus calculated for a given sample volume selected stir bar dimensions, and a solute using the Ko/w WIN Software Program (Syracuse Research Corp., Syracuse, New York), which is based upon a log Ko/w calculator.
For trace analysis, not only the theoretical recovery is important, but also the enrichment factor and the total absolute amount that can be introduced in the analytical system (GC or LC) and detector. This amount can be predicted from the theoretical recovery and sample volume (Lord and Pawliszyn, 2000).
In addition to these thermodynamics, controlling the extraction under equilibrium conditions, the kinetic aspect is also important. During extraction, the solute, should migrate from the sample into PDMS coating. The uptake rate is controlled by diffusion constant, stirring conditions, sample volume, etc. (Bicchi et al., 2003).
This relationship is quite complex, but it is clear that the time needed to reach equilibrium drastically increases with increasing sample volume and PDMS volume. The influence of Ko/w, sample volume PDMS volume and extraction times was studied by Bicchi et al. (2003), using three pesticides (methyl-parathion, β-endosulfan and buprofezin) with log Ko/w values of 2.87, 3.83 and 4.30, respectively. Three PDMS volumes (20, 40 and 110 μL), sample volumes ranging from 4 mL to 1 L and extraction times from 40 min up to 24 h were tested. Water samples were spiked at concentrations below water solubility and constant solute amounts were used in different sample volumes in order to avoid PDMS overloading.
The results showed that for β values between 36 (4 mL sample/110 μL PDMS) and 500 (10 mL sample/20 μL PDMS) good correlation between experimental and predicted recoveries were obtained using a 40 min extraction time. For β values between 1000 and 5000 (100 mL sample/20, 40 and 110 μL PDMS) deviations increased with increasing β value.
This confirms that the extraction mechanism is based on sorption. For a 100 mL sample and smallest β value, equilibration was reached only after 6 h. Finally, for a 1 L sample, β value up to 50,000) up to 24 h is needed to reach equilibrium depending on Ko/w. This study also demonstrated that the sample volume/PDMS volume can be optimized for a given application taking into account a practically acceptable extraction time (Bicchi et al., 2003). As in SPME, often non-equilibrium conditions are used in practical SBSE using an appropriate internal standard and calibrated condition, excellent quantification is possible.
3 SBSE with derivatization
3.1 SBSE with in situ derivatization
In the biochemical/life science application area, special attention should be paid to the possibilities of in situ derivatization combined with SBSE, since often the target compounds are quite polar (e.g. metabolites) (David and Sandra, 2007).
Since the PDMS phase is a non-polar liquid phase, it is preferable that the polarity of the analyte be low. Relatively high polar compounds, such as phenolic compounds, are not well recovered. Therefore, SBSE with in situ derivatization, wherein derivatization and SBSE are performed at the same time, was developed (Ochiai et al., 2003; Kawaguchi et al., 2005, 2004c). The derivatization of a phenolic hydroxyl group with acetic acid anhydride (Melo et al., 2009; Fernandes et al., 2006; Kawaguchi et al., 2004a; Ochiai et al., 2003; Ito et al., 2005), a carboxyl group with ethylchloroformate (Melo et al., 2009; Fernandes et al., 2006; Ochiai et al., 2003), and carbonyl compounds with O-(2,3,4,5,6-penta-fluorobenzyl) hydroxylamine (Ochiai et al., 2003) has been reported.
In addition, the determination of organotin in water sample by SBSE with in situ derivatization using sodium tetrethylborate has been reported (Vercauteren et al., 2001). As shown in Eq. (2) when log Ko/w is increased, the theoretical recovery is increased. Moreover, in the analysis by gas chromatography (GC), decreasing the polarity leads to improved sensitivity. In addition, the derivative of an analyte with high log Ko/w reaches equilibrium rapidly, whereas the analyte with low Ko/w reaches equilibrium slowly (Kawaguchi et al., 2004b,c, 2005). Therefore, SBSE with in situ derivatization can be accomplished at a shorter time compared with conventional SBSE.
3.2 Thermal desorption (TD) with in tube derivatization
Because of SBSE with in situ derivatization involves derivatization in a water sample, the silylation agent that can derivatize various functional group is limited (Kawaguchi et al., 2006). Therefore, there is a limitation in the derivatization of the functional groups. To solve this problem, TD with in tube derivatization, in which the target compound is derivatized during TD from the PDMS-coated stir bar, was developed (Kawaguchi et al., 2005).
As a result for examining various silylation agents, N,O-bis (trimethylsilyl)trifluoroacetamide (BSTFA) was chosen because of its high volatility, and TD with in tube derivatization was achieved. Because BSTFA is able to derivatize various functional groups, the application of TD with in tube derivatization to the measurement of various analytes is expected. The outline of TD with in tube derivatization was reported (Kawaguchi et al., 2004c, 2006).
4 SBSE with in situ deconjugation
Many compounds are metabolized into gluconic acid or sulfate conjugate in the human body. In order to determine such compounds in biological samples, SBSE is performed prior to deconjugation (Ochiai et al., 2003; Kawaguchi et al., 2005, 2004c). However, the deconjugation process is tedious and time-consuming. Recently, Kawaguchi and co-workers (Kawaguchi et al., 2004c, 2006) developed SBSE with in situ deconjugation, wherein SBSE and deconjugation are performed at the same time as a result, the separation time was successfully shortened.
The common protocol for SBSE with situ de-conjugation is as follows: A biological sample, such as urine, or plasma, is added to a vial. Since the enzymatic activity is susceptible to pH, a suitable buffer solution is added. Then β-gluconidase is added for the deconjugation. A PDMS-coated stir bar is added and the sample is stirred for 30-240 min. After extraction, the stir bar is removed, and very gently wiped with lint-free tissue to remove water droplets. Then, it is subjected to TD-GC–MS.
5 SBSE application for CNS drugs analysis
5.1 SBSE/LC–UV analysis of antidepressants in plasma samples
A new polymeric coating consisting of a dual-phase, polydimethylsiloxane (PDMS) and polypyrrole (PPY) was developed by Melo et al. (2009) for stir bar sorptive extraction (SBSE) of antidepressants (mirtazapine, citalopram, paroxetine, duloxetne, fluoxetine and sertraline) (Fig. 3) from plasma samples, followed by liquid chromatography analysis (SBSE/LC–UV). The extractions were based on both adsorption (PPY) and sorption (PDMS) mechanisms. SBSE variable, such as extraction time, temperature, pH of the matrix and desorption time were optimized, in order to achieve suitable analytical sensitivity in a short time period.
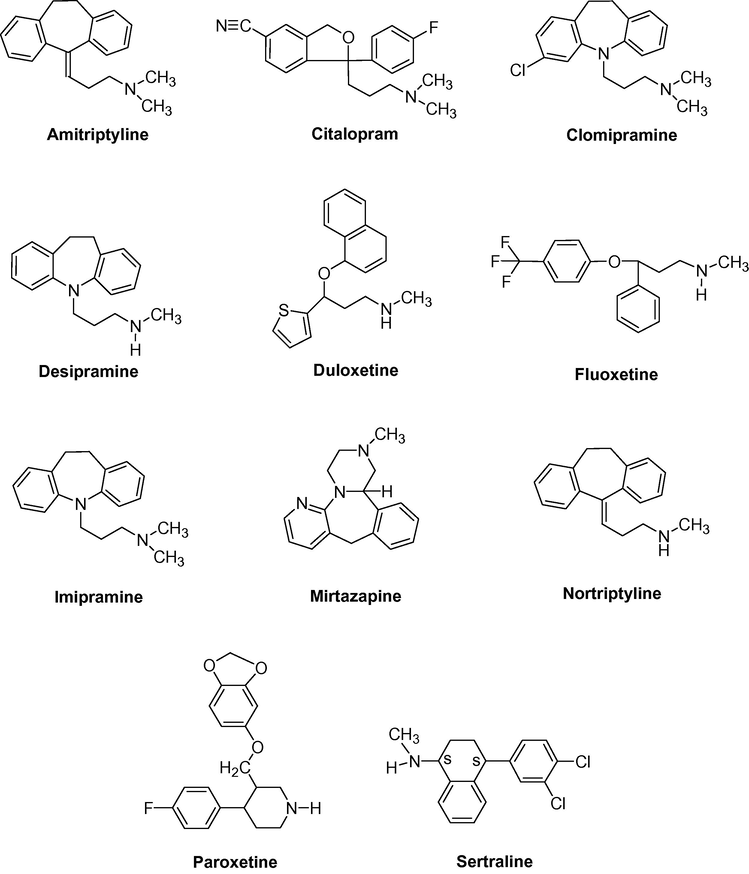
- Structure of some selected antidepressant drugs.
The PDMS/PPY coated stir bar showed high extraction efficiency (sensitivity and selectivity) toward the target analytes. The quantification limits (LOQ) of the reported SBSE/LC–UV method ranged from 20 to 50 ng/mL, and the linear range was from LOQ to 500 ng/mL with a determination coefficient higher than 0.99. The inter-day precision of the SBSE/LC-UV method presented a variation coefficient lower than 15%. The efficiency of the SBSE/LC–UV method was proved by the analysis of plasma samples from elderly depressed patients.
On the bases of the data obtained (Table 1).
| Antidepressants | Linear regression (LOQ-500 ng/mL) | r2 | LOQa (ng/mL) | LODb (ng/mL) |
|---|---|---|---|---|
| Mirtazapine | y = 0.109 + 0.0014x | 0.9935 | 20.0 | 5.0 |
| Citalopram | y = 0.0183 + 0.0013x | 0.9974 | 20.0 | 5.0 |
| Paroxetine | y = 0.0473 + 5.37 × 10⁻⁴x | 0.9942 | 30.0 | 10.0 |
| Duloxetine | y = 0.1205 + 0.0023x | 0.9947 | 20.0 | 5.0 |
| Fluoxetine | y = 0.0241 + 0.0022x | 0.9980 | 30.0 | 10.0 |
| Sertraline | y = 0.1192 + 9.12 × 10⁻⁴x | 0.9981 | 50.0 | 20.0 |
Melo et al. (2009) concluded that the best SBSE experimental conditions for the antidepressant assays were 1.0 mL plasma sample modified with 4 mL borate buffer (pH 9.0); extraction temperature of 40 °C, stirring for 40 min followed by the drug liquid desorption by immersion of the PDMS/PPY stir bar on 200 μL of mobile phase at a temperature at 25 °C, under sonication for 15 min. The selectivity of the reported method (Melo et al., 2009) is demonstrated by representative chromatograms of a drug-free human plasma sample, and a drug-free human plasma spiked with antidepressants at the therapeutic concentration (Fig. 4).
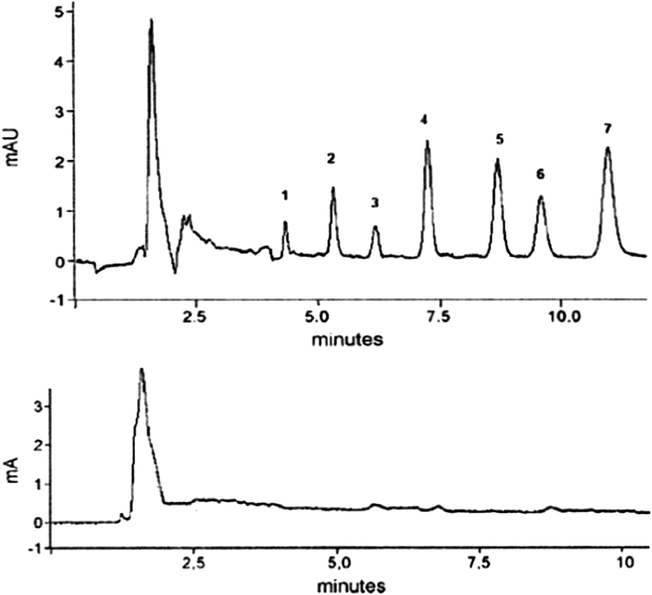
- Chromatogram of the antidepressant (a) blank plasma spiked with antidepressants at a concentration of 500 ng/mL (1) mirtazapine, (2) citalopram, (3) paroxetine, (4) duloxetine, (5) fluoxetine, (6) sertraline, (7) clomipramine; (b) blank plasma sample.
The commercial stir bar Twister for sorptive extraction was used by Chaves et al. (2007) for extraction and determination of sertraline, mirtazapine, fluoxetine, citalopram, paroxetine, imipramine, nortriptyline, amitriptyne and desipramine (Fig. 3) in plasma after oral administration of these antidepressants by (SBSE/LC–UV) method. Important factors in the optimization of SBSE efficiency were discussed, such as extraction time, pH, ionic strength, influence of plasma proteins and desorption conditions: solvents, modes (magnetic stir, ultrasonic), time and desorption steps. The SBSE/LC-UV method (Table 2) showed to be linear in a concentration ranging from the limit of quantification (LOQ) to 1000.0 ng/mL. The LOQ values ranged from 10.0 to 40.0 ng/mL.
| Drugs | Linear regression (LOQ-1000 ng/mL) | r2 | LOQa (ng/mL) |
|---|---|---|---|
| Paroxetine | y = −16693.58 + 1186.827x | 0.9973 | 40.0 |
| Citalopram | y = 42655.79 + 1390.24x | 0.9987 | 10.0 |
| Mirtazapine | y = 15432.48 + 1194.314x | 0.9953 | 40.0 |
| Fluoxetine | y = 6343.09 + 1091.106x | 0.9986 | 25.0 |
| Sertraline | y = 55986.42 + 411.72x | 0.9960 | 35.0 |
| Imipramine | y = 39466.7 + 792.67x | 0.9958 | 35.0 |
| Amitriptyline | y = 2089.3 + 8.9x | 0.9975 | 15.0 |
| Nortriptyline | y = 1958.92 + 8.2x | 0.9996 | 15.0 |
| Desipramine | y = 4886.56 + 7.69x | 0.9965 | 35.0 |
The inter-day precision of the reported SBSE/LC-UV method (Melo et al., 2009) presented coefficient of the variation lower than 15%. Based on figures of the merit results, the SBSE/LC–UV methodology showed to be adequate to the antidepressants analyses from therapeutic to toxic therapeutic levels. In order to evaluate the reported method for clinical use, SBSE/LC–UV method was applied to analysis of plasma samples from elderly depressed patients (Melo et al., 2009).
The comparison between PDMS/PPY SBSE/LC-UV analyses and commercial PDMS SBSE/LC-UV analyses was also addressed (Melo et al., 2009; Chaves et al., 2007). The optimal SBSE conditions for commercial PDMS phase were very similar to conditions established for PDMS/PPY phase. Fig. 5 illustrates the comparison between the LC peak areas obtained from PDMS/PPY and PDMS SBSE/LC analyses on plasma spiked with antidepressants (500 ng/mL). As can be observed for the majority of the analytes, the PDMS/PPY phase presented LC peak areas higher than PDMS commercial phase.
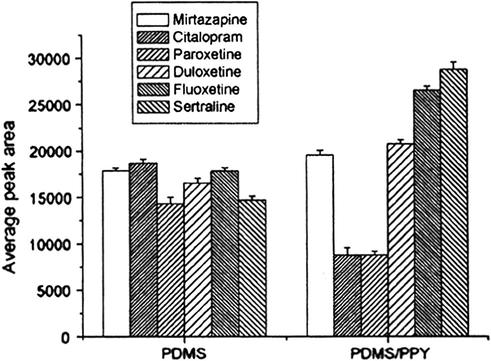
- Comparison between LC areas peaks of analytes extracted by PDMS/PPY and commercial PDMS phase, SBSE conditions: plasma samples spiked with antidepressants at concentrations of 500 ng/mL−1 and diluted with borate buffer solution pH 9.0, time: 40 min, and temperature: 40 °C. Desorption procedure: 200 μL mobile phase, time: 15 min, under sonication.
5.2 SBSE/GC–MS determination of fluoxetine in plasma
Stir bar sorptive extraction (SBSE) with in situ derivatization, in combination with either thermal or liquid desorption on-line coupled to gas chromatography–mass spectrometry was employed by Lanças and co-workers Fernandes et al. (2007) for the analysis of fluoxetine in plasma samples. Ethylchloroformate was employed as derivatizing agent producing symmetrical peaks. Parameters such as solvent polarity, time for analyte desorption and extraction time were evaluated. During the validation process, the developed method presented specificity, linearity (R2 > 0.99), precision (RSD < 15%) and limits of quantification (LOQ) of 30 and 1.37 pg/mL, when liquid and thermal desorption were employed, respectively.
This simple and highly sensitive method (Fernandes et al., 2007) compared with methods previously published for analysis of fluoxetine in plasma samples showed to be adequate for the measurement of fluoxetine in typical and trace concentration levels (Table 3).
| Sample preparation technique | Solvent consumption on sample preparation (mL) | Approximate analysis time (min) | Detection mode | LOQ (pg mL−1) | LOD (pg mL−1) | References | ||
|---|---|---|---|---|---|---|---|---|
| Sample preparation | Chromatography | Total | ||||||
| LLE | 1.3 | 60 | 10 | 70 | Fluorescence | 2.5 | 1.0 | Raggi et al. (1999) |
| LLE | 5.7 | 30 | 20 | 50 | UV | 10.0 | 3.0 | Zarghi et al. (2001) |
| LLE | 2.1 | 50 | 10 | 60 | UV | 4.3 | 3.1 | Llerena et al. (2003) |
| LLE | 7.2 | 35 | 8 | 43 | Fluorescence | 8.0 | 2.5 | Atta-Politou et al. (2004) |
| LLE | 7.3 | 40 | 8 | 48 | Fluorescence | 1.0 | 0.4 | Vlase et al. (2005) |
| SPE | 13.0 | 30 | 15 | 45 | Fluorescence | 30.9 | n.a. | Kristoffersen et al. (1999) |
| SPE | 13.0 | 45 | 60 | 105 | UV | 30.9 | 9.3 | Molander et al. (2002) |
| SPE | 3.75 | 30 | 7 | 37 | UV | 30.0 | 15.0 | Sabbiono et al. (2004) |
| SPE | 3.5 | 40 | 10 | 50 | UV | 3.1 | 3.1 | Li et al. (2004) |
| SPE | 6.2 | 40 | 7 | 47 | MS | 5.0 | 0.5 | Juan et al., 2005 |
| Column-switching | 0 | n.a. | n.a. | 5 | MS | 25.0 | n.a. | Souverain et al., 2003 |
| Column-switching | 0 | n.a. | n.a. | 30 | UV | 20.0 | n.a. | Santos-Neto et al. (2006) |
| SPME | 0 | 40 | 15 | 55 | MS | 1.0 | 0.25 | Salgado-Petinal et al. (2005) |
| SPME | 0.05 | 45 | 10 | 55 | UV | 25.0 | 10.0 | Fernandes et al. (2007) |
| SBSE | 0.09 | 45 | 7 | 52 | MS | 10.0 | 3.0 | Fernandes et al. (2006) |
n.a., not available.
Lanças et al. Fernandes et al. (2007) study demonstrated that he coupling of SBSE with GC–MS is an appropriate technique for fluoxetine determination in plasma samples. The reported method had many practical advantages over other methods described in the literature (Vlase et al., 2005; Juan et al., 2005; Sabbiono et al., 2004; Fernandes et al., 2006; Raggi et al., 1999; Zarghi et al., 2001; Llerena et al., 2003; Atta-Politou et al., 2004; Kristoffersen et al., 1999; Molander et al., 2002; Li et al., 2004; Souverain et al., 2003; Santos-Neto et al., 2006; Salgado-Petinal et al., 2005), including: simplicity of the extraction method, small sample volume (1.0 mL), solventless (utilization of a negligible amount of solvent in the case of liquid desorption and specificity due to the use of MS detection, and high sensitivity. The derivatization technique using ethyl chloroformate could be easily performed in situ and permits symmetrical peaks. The developed method using liquid desorption showed linearity over the range of 1-500 ng/mL (R2 > 0.99), precision (RSD < 15%), and LOQ and LOD of 30.0 and 10.0 pg/mL, respectively.
Thermal desorption also demonstrated precision (RSD < 12%), and LOQ and LOD of 1.37 and 0.46 pg/ mL, respectively. The LOD and LOQ (in the order of pg/ mL) obtained by Lanças et al. method (Fernandes et al., 2007) showed better detectability when compared with methods described in previously published studies (Vlase et al., 2005; Juan et al., 2005; Sabbiono et al., 2004; Fernandes et al., 2006; Raggi et al., 1999; Zarghi et al., 2001; Llerena et al., 2003; Atta-Politou et al., 2004; Kristoffersen et al., 1999; Molander et al., 2002; Li et al., 2004; Souverain et al., 2003; Santos-Neto et al., 2006; Salgado-Petinal et al., 2005) for analysis of fluoxetine in plasma samples. Although thermal desorption had demonstrated to produce higher sensitivity to analyze fluoxetine in typical concentration ranges (80-300 ng/ mL) in plasma samples. Furthermore, the higher sensitivity obtained with thermal desorption makes this method appropriate for the measurement of fluoxetine at ultra trace level.
5.3 SBSE/LC–UV methods for analysis of antiepileptic drugs in plasma
Several methods have been published for the determination of one or more antiepileptic drugs in biological fluids for therapeutic drug monitoring (TDM) or for toxicology purposes. There are various high-performance liquid chromatography (HPLC) methods for the simultaneous determination of phenytoin (PHT), phenobarbital (PHB), CBZ and their metabolites (Van Rooven et al., 2002; Yoshida et al., 2006; Wahl et al., 2002; Patil and Bodhankar, 2005; Liu et al., 1993; Romanyshyn et al., 1994; Kishore et al., 2003; Levert et al., 2002; Kouno et al., 1993). Recently, Queiroz et al. (2008) described a stir bar sorptive extraction and high-performance liquid chromatography–UV detection (SBSE/HPLC-UV) method for therapeutic drug monitoring (TDM) of antiepileptic drugs (carbamazepine, carbamazepine 10,11-epoxide, phenytoin and phenobarbital) (Fig. 6) in plasma samples and compared with a liquid–liquid extraction (LLE/HPLC-UV) method.
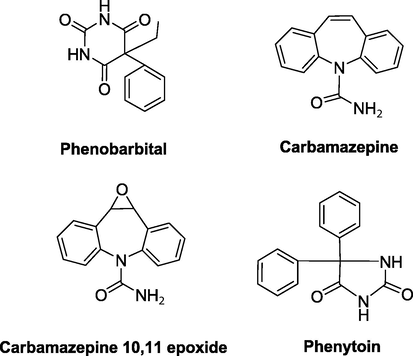
- Chemical structures of some antiepileptic drugs.
Important factors in optimization of SBSE efficiency such as pH, extraction time and desorption conditions (solvents, mode magnetic stir, mode ultrasonic stir, time and number of steps) assured recoveries ranging from 72% to 86%, except for phenytoin (62%). Separation was obtained using a reverse phase C18 column with UV detection (210 nm). The mobile phase composed of water–acetonitrile (78:22, v/v).
The SBSE/HPLC–UV method was linear over a working range of 0.08-40.0 μg/mL for phenytoin (Table 4).
| Linearity SBSE/LLE (μg mL−1) | Linear regression SBSE vs. LLE | LOQ (μg mL−1) SBSE vs. LLE | Recovery SBSE vs. LLE | |
|---|---|---|---|---|
| Concentration (μg mL−1) | Results (%) (n = 5) | |||
| Phenobarbital |
y = 0.1372x − 0.0117 0.999 |
20 | 78.2 vs. 89.1 | |
| (0.08–40) vs.(0.05–40) | y = 0.00109x + 0.03189 | 0.08/0.06 | 8 | 72.0 vs. 90.0 |
| 0.998 | 0.5 | 76.0 vs. 88.3 | ||
| Carbamazepine |
y = 0.3159x − 0.1157 0.999 |
20 | 86.7 vs. 95.3 | |
| (0.08–40) vs. (0.05–40) | y = 0.00148x + 0.105 | 0.08/0.06 | 8 | 86.9 vs. 95.2 |
| 0.999 | 0.5 | 86.2 vs. 93.1 | ||
| CBZ-E |
y = 0.2014x − 0.0366 0.999 |
20 | 80.3 vs. 90.3 | |
| (0.08–40) vs. (0.05–40) | y = 0.00107x + 0.04896 | 0.08/0.06 | 8 | 81.6 vs. 91.0 |
| 0.999 | 0.5 | 84.9 vs. 91.3 | ||
| Phenytoin | y = 0.0.0423x − 0.0104 | 20 | 62.9 vs. 76.8 | |
| 0.999 | 0.125/0.08 | 8 | 65.6 vs. 76.3 | |
| (0.125–40) vs. (0.09–40) |
y = 0.00078x + 0.01877 0.999 |
0.5 | 63.3 vs. 78.6 | |
The intra-assay and inter-assay precision and accuracy (Table 5) were studied at three concentrations (1.0, 4.0 and 20.0 μg/mL). The intra-assay coefficients of variation (CVs) for all compounds were less than 8.8% and all inter-CVs were less than 10%. The specificity (selectivity) of the reported method (Queiroz et al., 2008) is demonstrated by representative chromatograms from drug-free human plasma sample, and the same sample spiked with antiepileptic drugs in therapeutic interval concentrations (Fig. 7A and B), which showed the ability of the method to measure the drugs unequivocally in the presence of endogenous plasma components. Additional drug-free human plasma samples from several individuals were tested and showed no significant interference at the retention times of the analytes.
| Drugs (μg mL−1) | Precision intra-assay CV (%) n = 10; SBSE vs. LLE | Precision inter-assay CV (%) n = 5; SBSE vs. LLE | Accuracy error (%); SBSE vs. LLE |
|---|---|---|---|
| Phenobarbital | |||
| 20 | 6.3 vs. 3.5 | 6.5 vs. 7.7 | 6.4 vs. 4.2 |
| 4 | 5.2 vs. 4.5 | 6.8 vs. 6.6 | 6.0 vs. 3.5 |
| 1 | 7.6 vs. 7.8 | 6.3 vs. 5.8 | 8.2 vs. 8.2 |
| Carbamazepine | |||
| 20 | 3.7 vs. 5.4 | 7.8 vs. 6.9 | 4.3 vs. 3.3 |
| 4 | 6.8 vs. 5.2 | 9.5 vs. 8.9 | 3.7 vs. 5.2 |
| 1 | 8.8 vs. 6.3 | 9.0 vs. 9.6 | 9.2 vs. 8.6 |
| CBZ-E | |||
| 20 | 6.4 vs. 4.2 | 9.5 vs. 8.9 | 9.2 vs. 8.5 |
| 4 | 7.7 vs. 6.2 | 7.1 vs. 8.8 | 8.6 vs. 9.1 |
| 1 | 8.5 vs. 5.8 | 8.4 vs. 7.8 | 9.2 vs. 8.9 |
| Phenytoin | |||
| 20 | 5.9 vs. 3.6 | 7.2 vs. 9.8 | 9.3 vs. 8.5 |
| 4 | 5.9 vs. 6.6 | 5.0 vs. 5.9 | 6.5 vs. 8.2 |
| 1 | 8.3 vs. 9.7 | 9.7 vs. 8.3 | 9.4 vs. 9.6 |
CV, coefficient of variation; LLE, liquid:liquid extraction; SBSE, stir bar sorptive extraction.
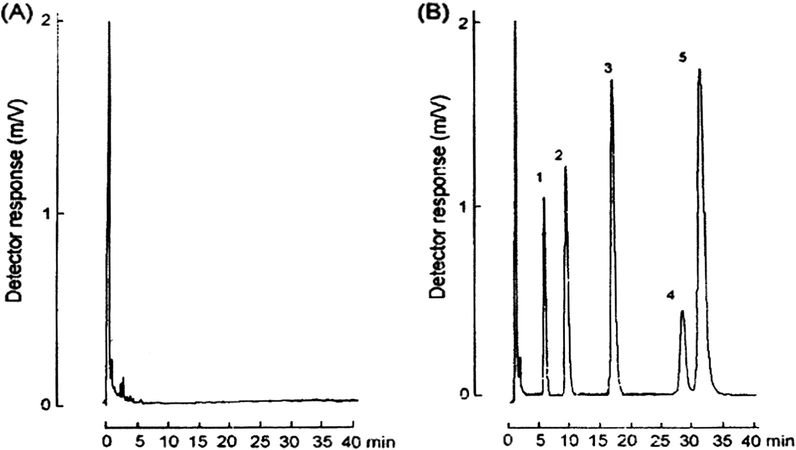
- (A) Chromatogram obtained from a blank (without internal standard) and (B) chromatogram obtained from plasma spiked with 0 μg/mL. (1) Phenobarbital, (2) carbamazepine-10,11-poxide, (3) internal standard (5-ethyl-5-p-tolylbarbituric acid), (4) phenytoin and (5) carbamazepine.
Limits of quantification were 0.08 μg/mL for carbamazepine, carbamazepine-10,11-epoxide and phenobarbital and 0.125 μg/mL for phenytoin. No interference of drugs normally associated with antiepileptic drugs such as primidone, lamotrigine, zonizamide, haloperidol, chlorpromazine, risperidone, moclobemide and several benzodiazepines and also for methyldopa, captopril, furosemide, hydrochlorothiazide, methoclopramide, acetaminophen, caffeine, salicylic acid, diclophenac, indomethacin, sulphamethoxazole, metoprolol, propranolol, amiodarone, cimetidine, ranitidine and prednisone, were observed.
Based on figures of merit results, the SBSE/HPLC-UV technique, (Queiroz et al., 2008), proved adequate data for antiepileptic drugs analyses from therapeutic levels. This method was successfully applied to the analysis of real samples and was as effective as the LLE/HPLC method.
5.4 Analysis of caffeine and its metabolites in biological fluids
Stir bar sorptive extraction based on restricted access material (RAM) for the direct extraction of caffeine and its metabolites (Fig. 8) in biological fluids was reported by Lambert et al. (2005). Restricted access materials (RAM) are a class of biocompatible absorbent particles enabling the direct extraction of analytes from biological fluid (e.g. plasma and urine) (Souverain et al., 2004).
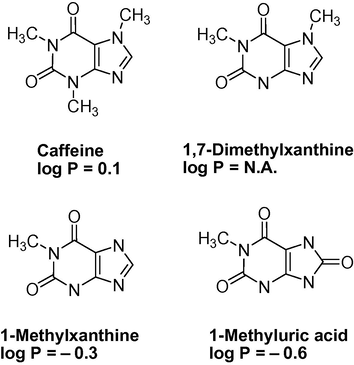
- Chemical structure of caffeine and three of its metabolites.
In particular, alkyl-diol silica (ADS) RAM particles are able to fractionate a sample into the protein matrix and the analytes with a controlled pore size that acts are physical barrier to exclude macromolecules (15,000 molecular weight). Simultaneously with the size exclusion process, low molecular weight compounds are extracted and enriched via-partition, into the phase’s interior (Mullett and Pawliszyn, 2002). Various extraction cartlages, such as C4, C8, C18 and ion exchange (Rbeida et al., 2004, 2003) are available to provide a wide range of selectivity. The exterior of the silica based particles have been modified with diol moieties to prevent irreversible adsorption of protein and hence acts as a biocompatible surface, enabling direct exposure to biological fluids.
To extend the effectiveness and robustness of SBSE approach to biological fluids, a glass stir bar enclosing a magnet was coated with RAM particles. The novel RAM SBSE device could be directly stirred in biological fluids for analyte extraction without fouling of the coating from proteins. Its ability to directly extracted caffeine and various metabolites from plasma, followed by liquid desorption and HPLC-UV analysis was studied. In contrast to existing methods for caffeine analysis in biological fluids such as liquid–liquid extraction (Krul and Hageman, 1998; Bendriss et al., 2000) solid-phase extraction (SPE) (Zydron et al., 2004; Caubet et al., 2002; Baud-Camus et al., 2001; Georga et al., 2001) and solid-phase microextraction (Kumazawa et al., 1999), the main advantage of the novel RAM-SBSE extraction was the ability to perform direct extractions, minimizing long and complicated sample preparation procedures. It was observed that this novel RAM-SBSE device enabled caffeine and selected metabolites to be extracted from spiked plasma with minimum sample preparation (Lambert et al., 2005).
A biocompatible stir bar sorptive extraction (SBSE) device was prepared by Lambert et al. (2005) using an alkyl-diol silica (ADS) restricted access material (RAM) as the SBSE coating. The RAM-SBSE bar was able to simultaneously fractionate the protein component from a biological sample, while directly extracting caffeine and its metabolites, overcoming the present disadvantages of direct sampling in biological matrices by SBSE, such as fouling of the extraction coating by proteins.
Desorption of the analytes was performed by stirring the bar in a water/ACN mixture (3/1, v/v) and subsequently reconcentrating the sample solution in water to enable HPLC–UV analysis to be performed. The limit of detection, based on a signal to noise ratio of 3, for caffeine was 25 ng/mL in plasma. The method was confirmed to be linear over the range of 0.5-100 μg/mL of caffeine with an average linear coefficient (R3) value of 0.9981.
The injection repeatability and intra-assay precision of the method were evaluated over 10 injections, resulting in a % RSD of ≈8%. Caffeine recovery was also discussed as follows: after performing RAM–SBSE with caffeine spiked rat plasma, it was observed that extraction produced a lower recovery of caffeine relative to caffeine standards in PBS. One possibility for lower recoveries in plasma is the high protein binding of caffeine with plasma protein (Lucas et al., 2003), which would prevent the absorption of caffeine in the C18 phase of the RAM-SBSE bar. To prevent this phenomenon, 10% v/v of methanol was added to each sample prior to sample extraction to help disrupt any protein binding.
The small addition of methanol did not cause any observable precipitation of the biological material but did ensure a full recovery in plasma. Blank extractions from plasma were performed to make sure that no interference from the biological matrix extracted by the RAM-SBSE bar co-eluted. Fig. 9 shows a typical chromatogram of caffeine extraction from blank and spiked plasma using the RAM–SBSE device.
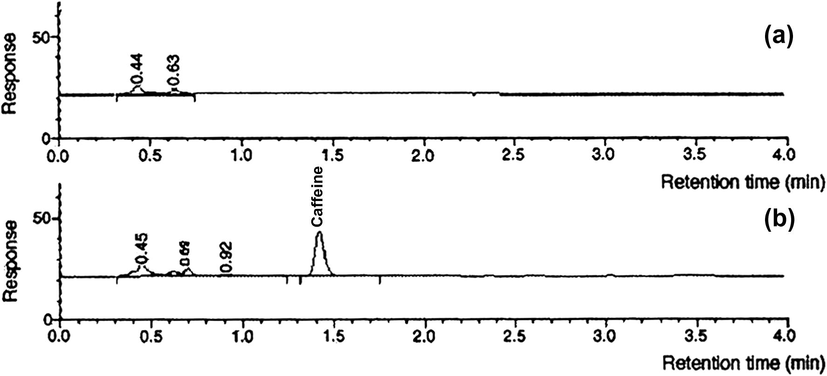
- HPLC RAM–SBSE sample chromatograph for (a) plasma/10% methanol and (b) plasma/10% methanol spiked with 25 μg/mL caffeine.
The absence of chromatographic peaks at the elution time for caffeine in the blank plasma sample confirmed the absence of any interference being co-extracted and eluted with caffeine. The impact of plasma dilution was also tested by performing RAM-SBSE extraction from whole plasma (containing 10% methanol, v/v) spiked with 10 μg/mL caffeine. No significant difference in the recovery was observed and no additional matrix components were detected in the HPLC chromatogram, confirming the ability of the RAM–SBSE device to provide a very clean extract in this complex biofluid.
The RAM-SBSE device was robust to withstand the frictional forces associated with stir rig at high RPM and could be re- used for over 50 times extraction in plasma without significant loss in extraction efficiency (Lambert et al., 2005) and simple use, providing many direct extraction and subsequent determination of caffeine and its metabolites in biological fluids. In contrast to existing sample preparation methods (Krul and Hageman, 1998; Bendriss et al., 2000; Baud-Camus et al., 2001; Georga et al., 2001) for the analysis of caffeine and selected metabolites in biological fluids, this feasibility study using a biocompatible SBSE approach was advantageous in terms of simplifying the sample preparation procedures.
6 Conclusion
In the present review, several aspects of SBSE are reviewed, including the basic theory, experimental parameters optimizations, applications (specially for central nervous system drugs), and limitations. As well-known limitation of this technique is the fact that only one sorbent (PMDS) is commercially available until this manuscript was written. This limits the application of this technique to the analysis of non-polar and some intermediate polarity compounds, requiring other steps such as derivatization for the analysis of the more polar ones.
On the other hand, in-house polar phases have been successfully used with SBSE, being presented and described in this review. New approaches such as RSE, based upon SBSE concepts introduced. Considering its applications in biological analysis, described in this review, joined with developments of new sorbents, interfaces, and analytical approaches, it can be concluded that SBSE certainly will occupy an important role as a major sample preparation micro technique in the near future.
References
- J. Mass Spectrom.. 2007;42(10):1342-1347.
- J. Liq. Chromatogr. Relat. Technol.. 2004;27:2957-2972.
- J. Microcolumn Sep.. 1999;11(10):737-747.
- Anal. Chem.. 1999;71:5213.
- J. Chromatogr. B: Biomed. Sci. Appl.. 2001;760(1):55-63.
- J. Chromatogr. B. 2000;746:331-338.
- J. Chromatogr. B. 2001;755:137-142.
- J. Sep. Sci.. 2003;26:1650-1656.
- J. Chromatogr. A. 2005;1094:9-16.
- J. Chromatogr. A. 2004;1030:77-85.
- J. Pharm. Biomed. Anal.. 2002;27:261.
- J. Chromatogr. B: Anal. Technol. Biomed. Life Sci.. 2007;850(1–2):295-302.
- J. Chromatogr. A. 2007;1152:54-69.
- LCGC North Am.. 2003;21(2):108. 111–112, 114, 116–118, www.chromatographyonline.findanalytichem.com
- Chromatographia. 2006;64:517-521.
- J. Chromatogr. B. 2007;847:217-223.
- J. Chromatogr. B. 2003;794:35-47.
- J. Chromatogr. B. 2001;759:209-218.
- Talanta. 2008;75:172-177.
- Anal. Chim. Acta. 2005;535:243-250.
- J. Chromatogr. B. 2005;820:33-39.
- J. Chromatogr. A. 2004;1049:1-8.
- J. Chromatogr. B. 2004;799:119-125.
- J. Chromatogr. B. 2004;805:41-48.
- J. Chromatogr. B. 2005;820:49-57.
- J. Chromatogr. A. 2005;1062:23-29.
- J. Pharm. Biomed. Anal.. 2006;40:500-508.
- Arzneimittel-Forschung. 2003;53(11):763-768.
- J. Chromatogr. B.. 1993;622(1):47-52.
- J. Chromatogr. B. 1999;734:229-246.
- J. Chromatogr. B. 1998;709:27-34.
- Anal. Chim. Acta. 1999;387:53.
- J. Chromatogr. A. 2005;1075:43-49.
- Biomed. Chromatogr.. 2002;16:19-24.
- J. Chromatogr. B. 2004;804:319-326.
- J. Chromatogr. Biomed. Appl.. 1993;616(1):105-115.
- J. Chromatogr. A. 2004;1045:15-22.
- J. Chromatogr. B. 2003;783:25-31.
- J. Chromatogr. A. 2000;902:17-63.
- Anal. Chem.. 2003;75:627.
- J. Pharm. Biomed. Anal.. 2007;44:955-962.
- J. Anal. Chim. Acta. 2009;633:57-64.
- J. Chromatogr. B. 2002;766:77-87.
- J. Anal. Chem.. 2002;74:1081.
- J. Chromatogr. A. 2003;986:101-110.
- Pasche, A., Popp, P., 1999. In: J. Pawliszyn (Ed.), Applications of Solid Phase Microextraction, RSC Chromatography Monographs. In: Smith, R.M. (Series Ed.), Royal Society of Chemistry, Cambridge, pp. 140-155.
- J. Pharm. Biomed. Anal.. 2005;39:181-186.
- Anal. Chem.. 2001;73:55-63.
- J. Sep. Sci.. 2003;26:961-967.
- J. Chromatogr. A. 2007;1174:72-77.
- J. Pharm. Biomed. Anal.. 2008;48:428-434.
- Chromatographia. 1999;50:423-428.
- J. Pharm. Biomed. Anal.. 2003;32:829-838.
- J. Chromatogr. A. 2004;1030:95.
- Ther. Drug Monit.. 1994;16(1):90-99.
- J. Pharm. Biomed. Anal.. 2004;36:351.
- Anal. Bioanal. Chem.. 2005;382:1351-1359.
- J. Chromatogr. A. 2006;1105:71-76.
- Talanta. 2008;74:1498-1504.
- J. Anal. Toxicol.. 2007;31:313-320.
- J. Chromatogr. B. 2008;862:181-188.
- Anal. Bioanal. Chem.. 2003;377:880-885.
- J. Chromatogr. B. 2004;801:141-156.
- J. Microcolumn Sep.. 2000;12:577-584.
- Anal. Bioanal. Chem.. 2002;373:46-55.
- J. Pharm. Biomed. Anal.. 2003;32:569-579.
- Ther. Drug Monit.. 2003;25:581-587.
- J. Chromatogr. B: Anal. Technol. Biomed. Life Sci.. 2002;769(1):1-7.
- Anal. Chem.. 2001;73:1509-1514.
- Talanta. 2005;66:659-663.
- Clin. Chem.. 2002;48:B10.
- J. Chromatogr. A. 2001;909:37-52.
- J. Pharm. Biomed. Anal.. 2006;41:1386-1390.
- J. AOAC Int.. 2001;84(6):1735-1737.
- J. Sep. Sci.. 2004;27:1166.


