

Structurally diverse brefeldin A derivatives as potent and selective acetylcholinesterase inhibitors from an endophytic fungus Penicillium brefeldianum F4a
⁎Corresponding author. panhq@iae.ac.cn (Huaqi Pan)
-
Received: ,
Accepted: ,
This article was originally published by Elsevier and was migrated to Scientific Scholar after the change of Publisher.
Abstract
Abstract
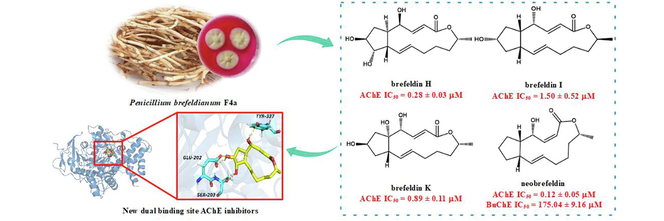
Nine previously undescribed brefeldin A (BFA) derivatives (1–9), together with one known compound 4-epi-brefeldin A (10), were isolated from an endophytic fungus Penicillium brefeldianum F4a. The chemical structures were elucidated using NMR and HRESIMS. ECD analysis and Mosher's method were used to confirm the absolute configurations of 1–9. The inhibitory activity of all isolated BFA derivatives (1–10) on acetylcholinesterase (AChE) and butyrylcholinesterase (BuChE) was evaluated in vitro. The bioassay results suggested that neobrefeldin (1) and brefeldin H (2) exhibited higher potent and selective AChE inhibitory activity (IC50 = 0.12 and 0.28 μM) than the therapeutic drug galantamine for Alzheimer's disease (AD) (IC50 = 0.66 µM), whereas only neobrefeldin (1) displayed weak inhibitory activity against BuChE (IC50 = 175.04 µM). Moreover, a molecular docking analyses was performed and showed compounds 1 and 2 were dual binding site AChE inhibitors. It is worth noting that neobrefeldin (1) showed a better binding affinity with the peripheral anionic site through the hydrogen bonding interaction with Tyr124 than brefeldin H (2), resulting in better AChE inhibitory activity. These findings not only provide a promising AChE inhibitor neobrefeldin (1) for developing agents against early AD, but also provide a valuable perspective for better understanding its AChE inhibition activity.
Keywords
Cholinesterase inhibitors
Endophytic fungi
Penicillium brefeldianum
Brefeldin A derivatives
Molecular docking

1 Introduction
Alzheimer's disease (AD) is a prevalent neurodegenerative disorder that results in language impairment, diminished intellectual ability, memory loss, and irreversible cognitive decline (Alzheimer's Association, 2023; Gomez-Ramirez and Wu, 2014). According to World Alzheimer Report 2021, AD affects more than 50 million people worldwide, costing more than a trillion US dollars per year. As the global population ages, AD was officially listed as the seventh-leading cause of death (Gustavsson et al., 2023). Up to now, the pathogenesis of AD remains unclear. Several theories have been proposed, such as the degradation of cholinergic neurons, the deposition of amyloid beta (Aβ), and the aggregation of Tau protein in the central nervous system (Hardy and Selkoe, 2002; Giacobini, 2003; Buee et al., 2000). At present, most of the treatments for AD are predicated on the cholinergic hypothesis that implies a deficiency in the neurotransmitter acetylcholine (ACh) and a massive loss of cholinergic neurons lead to the progressive development of AD (Hampel et al., 2018). In the early onset of AD, approximately 80 % of ACh is hydrolyzed by acetylcholinesterase (AChE). However, during the later stage of AD, as AChE expression is decreased, butyrylcholinesterase (BuChE) levels are increased that led to amyloid protein plaques formation (Douchamps and Mathis, 2017; Greig et al., 2005). Therefore, inhibition of AChE and BuChE is an effective approach for the treatment different stages of AD. At present, the U.S. Food and Drug Administration (FDA) has approved four AChE inhibitors, including galantamine, donepezil, rivastigmine, and tacrine (Bortolami et al., 2021). However, the therapeutic outcomes of these inhibitors are still not entirely satisfactory (Cummings et al., 2019). Thus, a ChEs inhibitor that possesses both more significant activity and higher selectivity would be the preferred choice for AD treatment.
Endophytic fungi represent a highly promising source of undescribed bioactive natural products (Hamed et al., 2023). Due to their unique structures, a wide array of endophytic secondary metabolites displays anti-Alzheimer's, anti-inflammatory, antibiotic, antioxidant, and antiviral effects, among others (Wen et al., 2022; Zheng et al., 2021; Gakuubi et al., 2021; Ancheeva et al., 2020). Especially, approximately 468 compounds with anti-AD activities have been isolated from endophytic fungi over the past two decades (2002–2022) (Zhu et al., 2023). And these compounds primarily exhibit anti-AD activity by targeting anti-AChE and anti-BuChE functions. It was worth noting that nearly half of these compounds were polyketides (217, 46.4 %) (Zhu et al., 2023). Therefore, endophytic fungi are promising sources of valuable lead compounds for developing anti-AD agents by inhibiting the activity of ChE.
Brefeldin A (BFA), a 16-membered macrolide, was initially isolated from Penicillium decumbens in 1958 (Singleton et al., 1958). BFA has displayed various biological activities, including antifungal, antiviral, antitumor, and AChE inhibitory activity (Bai et al., 2022; Hayashi et al., 1974; Takatsuki et al., 1969; Small et al., 1993). In our previous study, numerous BFA derivatives were detected in Penicillium brefeldianum F4a through LC-MS/MS analysis (Bai et al., 2022). Further screening found that the crude extract displayed significant anti-AChE activity (IC50 = 3 μg/mL) and anti-BuChE activity (IC50 = 13.73 mg/mL). Thus, in order to investigate diverse BFA derivatives with anti-ChEs activities from the strain F4a, nine new brefeldin A (BFA) derivatives (1–9), and one known compound (10) (Fig. 1) were isolated and their anti-ChEs activities were evaluated. Molecular docking was also carried out to identify the potential active sites and compounds' putative binding modes.
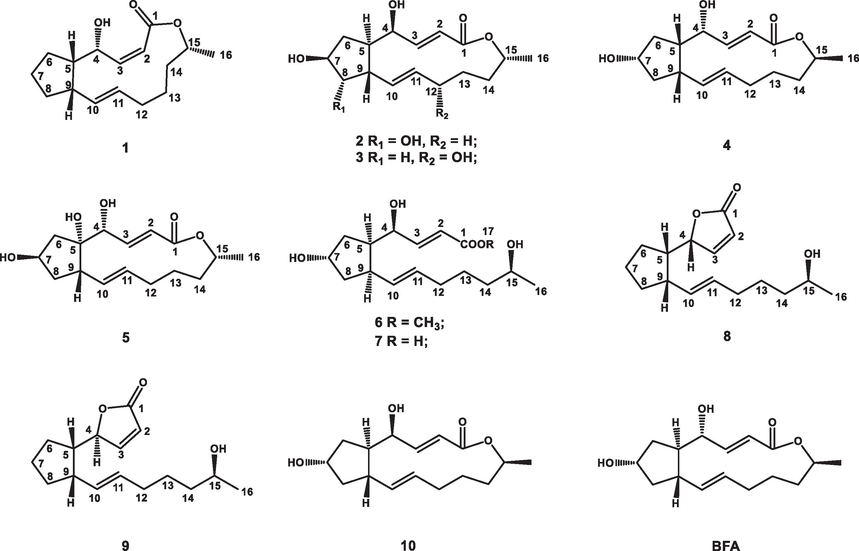
- Chemical structures of compounds 1–10 and BFA.
2 Material and methods
2.1 General experimental procedures
High performance liquid chromatography (HPLC) was recorded by Dionex UltiMate 3000 system. High-resolution mass spectrometry (HR-MS) data were analyzed through a Thermo Scientific Q Exactive mass spectrometer. Nuclear magnetic resonance (NMR) data were given using a Bruker-AV-600 NMR spectrometer. The Electronic circular dichroism (ECD) spectra were measured using a JASCO J-815 CD spectrometer. A JASCO P-2000 polarimeter was used to afford optical rotations. A Thermo fisher Nicolet 6700 FT-IR spectrometer was used to acquire the IR spectra.
2.2 Fermentation and extraction
The study strain Penicillium brefeldianum F4a was isolated from the Houttuynia cordata Thunb. (Saururaceae), collected from Longkong countryside, Hunan province (26°46′17.4″N, 109°38′27.6″E). The fermentation and extraction of the endophytic Penicillium brefeldianum F4a was described according to our previous study (Bai et al., 2022).
2.3 Isolation and purification
A 35 g extract was subjected to silica gel chromatographic column (CC) and eluted with CH2Cl2-MeOH gradient system (100:0–0:100, v/v), resulting in the separation of nine fractions (A-I). Fraction B (4.5 g) underwent Sephadex LH-20 and two subfractions (B1 and B2) were afforded. Subfraction B2 (2.5 g) was fractionated by C18 reversed-phase CC eluted with MeOH-H2O (30:70-55:45, v/v) to given four subfractions (B2a-B2d). Subfraction B2d was separated by Sephadex LH-20 and then subjected to further purification through semipreparative HPLC with MeOH-H2O (65:35, v/v) to afford 1 (5.9 mg, tR: 108.3 min), 8 (3.0 mg, tR: 32.6 min), and 9 (3.0 mg, tR: 31.1 min). Fraction C (2.2 g) was divided into two parts (C1 and C2) followed by Sephadex LH-20. Subfraction C2 (1.5 g) underwent C18 reversed-phase column eluting with MeOH-H2O gradient system (30:70–60:40, v/v) to acquire four subfractions (C2a-C2d). Subfractions C2a and C2b were fractionated by Sephadex LH-20 and further purified through semipreparative HPLC with MeOH-H2O (60:40 and 45:55, v/v) to obtain 3 (6.3 mg, tR: 14.8 min) and 7 (4.7 mg, tR: 16.2 min), respectively. 2 (5.6 mg, tR: 19.3 min), 4 (8.2 mg, tR: 20.8 min), 5 (5.4 mg, tR: 20.0 min), 6 (13.1 mg, tR: 18.6 min), and 10 (21.0 mg, tR: 21.6 min) were isolated from subfraction C2c, which was separated by Sephadex LH-20 and then subjected to further purification through semipreparative HPLC with MeOH-H2O (55:45, v/v).
Neobrefeldin (1): colorless crystals,
| NO. | 1 | 2 | 3 | |||
|---|---|---|---|---|---|---|
| δC, type | δH, mult (J/Hz) | δC, type | δH, mult (J/Hz) | δC, type | δH, mult (J/Hz) | |
| 1 | 165.7, C | 165.2, C | 165.1, C | |||
| 2 | 120.1, CH | 5.78, d (11.4) | 118.6, CH | 5.84, dd (15.5, 2.2) | 118.5, CH | 5.86, dd (15.5, 2.2) |
| 3 | 146.6, CH | 5.87, dd (11.4, 10.0) | 153.2, CH | 6.84, dd (15.5, 1.9) | 153.3, CH | 6.83, dd (15.5, 1.9) |
| 4 | 67.8, CH | 4.48, td (9.6, 5.3) | 69.9, CH | 4.34, q (2.0) | 70.0, CH | 4.36, q (2.3) |
| 5 | 50.0, CH | 1.71, m | 45.7, CH | 2.15, m | 47.3, CH | 2.07, m |
| 6 | 26.9, CH2 | 1.83, m 1.52, m |
34.4, CH2 | 2.15, m 1.49, m |
37.9, CH2 | 1.96, m 1.61, m |
| 7 | 21.9, CH2 | 1.65, m | 76.4, CH | 3.73, m | 71.5, CH | 4.06, m |
| 8 | 33.1, CH2 | 1.71, m 1.36, m |
79.9, CH | 3.57, dd (5.1, 1.5) | 43.0, CH2 | 1.64, m 1.36, m |
| 9 | 44.7, CH | 2.31, m | 44.1, CH | 2.29, m | 39.0, CH | 2.40, m |
| 10 | 130.7, CH | 5.26, dd (15.4, 9.4) | 131.5, CH | 5.39, dd (15.4, 9.8) | 131.3, CH | 5.45, dd (15.1, 9.5) |
| 11 | 130.0, CH | 5.14, m | 132.1, CH | 5.12, m | 133.4, CH | 5.19, dd (15.1, 2.9) |
| 12 | 31.8, CH2 | 2.03, m 1.71, m |
32.5, CH2 | 1.98, m 1.79, m |
68.8, CH | 3.75, m |
| 13 | 21.5, CH2 | 1.52, m 1.39, m |
22.9, CH2 | 1.61, m 1.38, m |
31.5, CH2 | 1.70, m 1.41, m |
| 14 | 31.7, CH2 | 1.65, m 1.52, m |
31.4, CH2 | 1.55, m | 27.6, CH2 | 1.59, m 1.34, m |
| 15 | 70.4, CH | 4.89, m | 69.4, CH | 5.08, m | 68.7, CH | 5.11, m |
| 16 | 18.3, CH3 | 1.15, d (6.5) | 17.7, CH3 | 1.14, d (6.7) | 17.4, CH3 | 1.13, d (6.6) |
Brefeldin H (2): colorless crystals,
Brefeldin I (3): colorless crystals,
Brefeldin J (4): colorless crystals,
| NO. | 4 | 5 | 6 | |||
|---|---|---|---|---|---|---|
| δC, type | δH, mult (J/Hz) | δC, type | δH, mult (J/Hz) | δC, type | δH, mult (J/Hz) | |
| 1 | 166.4, C | 165.4, C | 166.3, C | |||
| 2 | 117.8, CH | 5.86, dd (15.7, 2.5) | 119.4, CH | 5.88, dd (15.7, 2.3) | 118.6, CH | 5.91, dd (15.5, 1.7) |
| 3 | 155.9, CH | 7.03, dd (15.7, 2.5) | 151.9, CH | 7.23, dd (15.7, 1.7) | 152.6, CH | 6.90, dd (15.5, 4.1) |
| 4 | 71.4, CH | 4.21, q (2.7) | 74.1, CH | 4.02, t (1.9) | 69.9, CH | 4.09, t (5.0) |
| 5 | 47.3, CH | 2.45, m | 82.5, C | 45.8, CH | 2.13, m | |
| 6 | 38.9, CH2 | 1.96, m 1.68, m |
48.2, CH2 | 2.11, dd (13.9, 3.9)1.81, dd (13.9, 5.6) |
36.1, CH2 | 1.72, m 1.51, m |
| 7 | 70.9, CH | 4.18, m | 69.8, CH | 4.12, m | 70.3, CH | 4.15, m |
| 8 | 43.5, CH2 | 1.56, m 1.43, m |
42.3, CH2 | 1.60, m 1.53, m |
42.9, CH2 | 1.65, m 1.56, m |
| 9 | 43.6, CH | 2.87, m | 43.4, CH | 2.42, m | 43.2, CH | 2.73, m |
| 10 | 135.9, CH | 5.35, dd (15.6, 9.7) | 132.1, CH | 5.31, dd (15.4, 9.8) | 131.4, CH | 5.49, dd (15.2, 9.2) |
| 11 | 127.9, CH | 5.29, m | 131.7, CH | 5.02, m | 130.6, CH | 5.38, m |
| 12 | 28.9, CH2 | 2.01, m 1.74, m |
32.6, CH2 | 1.92, m 1.78, m |
32.1, CH2 | 1.93, m |
| 13 | 24.5, CH2 | 1.48, m 1.38, m |
23.1, CH2 | 1.53, m 1.46, m |
25.4, CH2 | 1.38, m 1.29, m |
| 14 | 33.5, CH2 | 1.54, m | 32.1, CH2 | 1.53, m | 38.5, CH2 | 1.29, m |
| 15 | 71.2, CH | 4.75, m | 69.5, CH | 5.04, m | 65.6, CH | 3.54, m |
| 16 | 20.8, CH3 | 1.19, d (6.4) | 18.0, CH3 | 1.14, d (6.5) | 23.7, CH3 | 1.00, d (6.1) |
| 17 | 51.3, CH3 | 3.64, s | ||||
Brefeldin K (5): colorless crystals,
seco-4-epi-9-epi-BFA methyl ester (6): colorless and transparent oil,
4-epi-9-epi-BFA seco-acid (7): colorless and transparent oil,
| NO. | 7 | 8 | 9 | |||
|---|---|---|---|---|---|---|
| δC, type | δH, mult (J/Hz) | δC, type | δH, mult (J/Hz) | δC, type | δH, mult (J/Hz) | |
| 1 | 167.3, C | 173.1, C | 172.8, C | |||
| 2 | 119.9, CH | 5.82, dd (15.5, 1.6) | 120.7, CH | 6.21, dd (5.7, 1.9) | 120.7, CH | 6.19, dd (5.7, 1.9) |
| 3 | 151.6, CH | 6.81, dd (15.5, 4.1) | 158.3, CH | 7.76, dd (5.7, 1.1) | 158.5, CH | 7.80, dd (5.7, 1.2) |
| 4 | 69.9, CH | 4.07, q (5.0) | 84.7, CH | 5.00, dt (6.3, 1.8) | 84.4, CH | 4.93, dt (9.0, 1.8) |
| 5 | 45.9, CH | 2.11, m | 45.1, CH | 2.05, m | 47.3, CH | 1.87, m |
| 6 | 36.2, CH2 | 1.72, m 1.51, m |
25.7, CH2 | 1.65, m 1.29, m |
25.3, CH2 | 1.68, m 1.41, m |
| 7 | 70.3, CH | 4.15, m | 23.4, CH2 | 1.67, m 1.47, m |
22.3, CH2 | 1.70, m 1.56, m |
| 8 | 42.9, CH2 | 1.66, m 1.57, m |
32.2, CH2 | 1.71, m 1.40, m |
31.4, CH2 | 1.73, m 1.48, m |
| 9 | 43.2, CH | 2.72, m | 44.7, CH | 2.68, m | 44.2, CH | 2.69, m |
| 10 | 131.4, CH | 5.48, dd (15.2, 9.2) | 130.3, CH | 5.47, dd (15.2, 9.0) | 129.5, CH | 5.44, dd (15.2, 9.0) |
| 11 | 130.5, CH | 5.38, m | 131.4, CH | 5.54, m | 131.3, CH | 5.46, m |
| 12 | 32.1, CH2 | 1.94, m | 32.1, CH2 | 1.98, m | 32.2, CH2 | 1.96, m |
| 13 | 25.4, CH2 | 1.38, m 1.29, m |
25.3, CH2 | 1.40, m 1.29, m |
25.2, CH2 | 1.41, m 1.29, m |
| 14 | 38.5, CH2 | 1.29, m | 38.6, CH2 | 1.29, m | 38.5, CH2 | 1.29, m |
| 15 | 65.6, CH | 3.55, m | 65.6, CH | 3.54, m | 65.5, CH | 3.54, m |
| 16 | 23.7, CH3 | 1.00, d (6.1) | 23.7, CH3 | 1.00, d (6.1) | 23.7, CH3 | 1.00, d (6.1) |
5-epi-7-dehydrobrefeldin F (8): colorless and transparent oil,
9-epi-7-dehydrobrefeldin F (9): colorless and transparent oil,
2.4 Preparation of Mosher ester derivatives 6s and 6r
Compound 6 (1.5 mg) was dissolved in dry CH2Cl2 (0.5 mL), subjected to a catalytic amount of 4-N, N-dimethylaminopyridine (DMAP) 10 mg and an excess of (S)-(−)-α-methoxy-α-(trifluoromethyl) phenylacetic acid (MTPA) 33.72 mg. The mixture was maintained with stirring for 8 h at room temperature. (S)-MTPA ester 6s (3.2 mg) was isolated from the reaction mixture by semipreparative HPLC after solvent removal. (R)-MTPA ester 6r (3.6 mg) was prepared by (R)-MTPA under the same conditions described above.
2.5 NMR and ECD calculations
First of all, conformational analyses of 1–9 were implemented using Merck Molecular Force Field (MMFF) and the conformers with Boltzmann-population >1 % were selected to consecutively reoptimize. Then, geometry optimizations and frequency analyses were conducted at the B3LYP/6-311G (d, p) level by density functional theory (DFT) and the conformers were checked the consistency with NOESY correlations and 1H–1H coupling constants. Subsequently, Gauge Independent Atomic Orbital (GIAO) calculations of 13C NMR chemical shifts used DFT at the B3LYP/6-311G (d, p) level with the PCM model in DMSO. The 13C NMR chemical shifts for TMS were used as the reference and calculated by the same procedures. The data were evaluated by linear correlation coefficients (R2) and the improved probability DP4+ method (Marcarino et al., 2022). Finally, ECD calculations of the stable conformers were carried out by time-dependent DFT (TDDFT) at the B3LYP/6-311G (d, p) level in methanol solution. ECD spectra were simulated by the software SpecDis 1.71 (Bruhn et al., 2013).
2.6 Cholinesterase enzyme assay in vitro
The inhibitory activities of 1–10 against ChEs were performed by Ellman's method in a 96-well plate with slight modifications (Ellman et al., 1961). AChE (EC3.1.1.7) from Electrophorus electricus (electric eel) and BuChE (EC3.1.1.8) from equine serum were purchased from Macklin. Acetylthiocholine iodide (ATChI) and butyrylthiocholine iodide (BuTChI) as substrates. Stock solutions of the tested compounds and positive control were prepared in DMSO to 2 mM. These solutions were gradually diluted in phosphate buffer saline (PBS) (pH = 7.4, 0.1 M). Briefly, 20 μL enzyme solution (AChE or BuChE, 1.0 U/mL), 20 μL various concentrations compounds, and 130 μL PBS was mixed and incubated at room temperature for 15 min. The reaction was initiated by adding 10 μL 5, 5′-dithiobis-2-nitrobenzoic acid (DTNB) as well as 20 μL substrates, and incubated at 37 °C for 15 min. The OD values were recorded with microplate reader at 412 nm. Galantamine was used as positive control. The IC50 values were determined from triplicate logarithmic concentration inhibition curves. The inhibition rate of ChEs was calculated as the equation:
2.7 Molecular docking
To investigate the potential active sites and putative binding modes of compounds 1, 2, and galantamine, molecular docking studies were performed by the Autodock 4.2 program (https://autodock.scripps.edu/). The X-ray crystal structure of AChE (PDB ID: 4EY6) was downloaded from the Protein Data Bank (PDB). Co-crystallized ligand galantamine, free ions, and water molecules were removed from the receptor using the PyMOL. The receptor AChE was further optimized through the Autodock Tools 1.5.4 (Morris et al., 2009). The ligands (1, 2, and galantamine) were sketched in the Chem 3D and further optimized using the Autodock Tools 1.5.4. The binding pocket was selected as reported cognate ligands previously (Cheung et al., 2012). The poses exhibiting most likely binding mode with the lowest binding free energy were selected and visualized using PyMOL.
3 Results and discussion
3.1 Structure elucidation
Neobrefeldin (1) was obtained as colorless crystals with molecular formula C16H24O3 by HRESIMS (m/z 263.1652 [M–H]−, calcd for C16H23O3, 263.1647). Based on the analysis of NMR data, 1 was identified as a BFA analogue (Bai et al., 2022) (Table S1). Comparing the 1H NMR data of 1 with those of BFA revealed that the primary distinctions between them existed in the coupling constants of H-2/H-3 (J = 11.4 Hz) of 1 (Table 1). These changes suggested generation of a cis-arranged double bond between C-2 and C-3. Then, the planar construction was further confirmed by HMBC and 1H–1H COSY spectra (Fig. 2). The coupling constant between H-10 and H-11 (J = 15.4 Hz) indicated a trans-arrangement of the double bond. The NOESY correlations between H-4 and H-5, as well as H-5 and H-9, suggested that H-4, H-5, and H-9 were all orientated in the β-configuration (Fig. 3). Based on the literature, when Me-16 is α-oriented, δC-16 is 18 ppm. On the contrary, when Me-16 is β-oriented, δC-16 is 21 ppm (Zeng et al., 2019). Thus, Me-16 (δC 18.3 ppm) of 1 was deduced to be α-oriented (Table 1). The absolute configuration of 1 was confirmed as 1a (2Z, 4R, 5S, 9S, 10E, 15R) by comparing the calculated ECD curve with the experimental ECD spectrum of 1 (Fig. 4). Since the cis-arranged double bond between C-2 and C-3 of 1 have been reported for the first time in BFA analogues with 16-membered lactone, 1 is named as neobrefeldin.
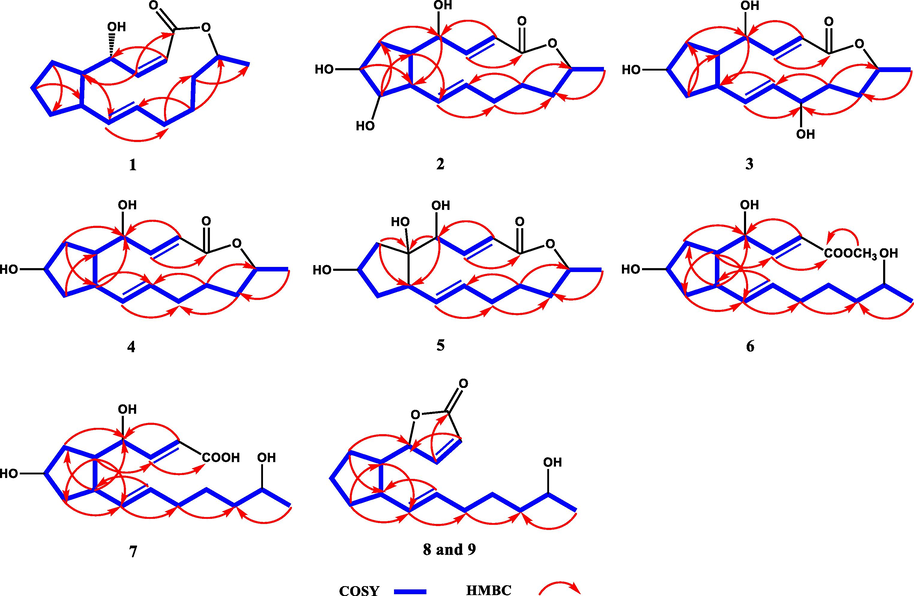
- Key 1H–1H COSY and HMBC correlations of compounds 1–9.
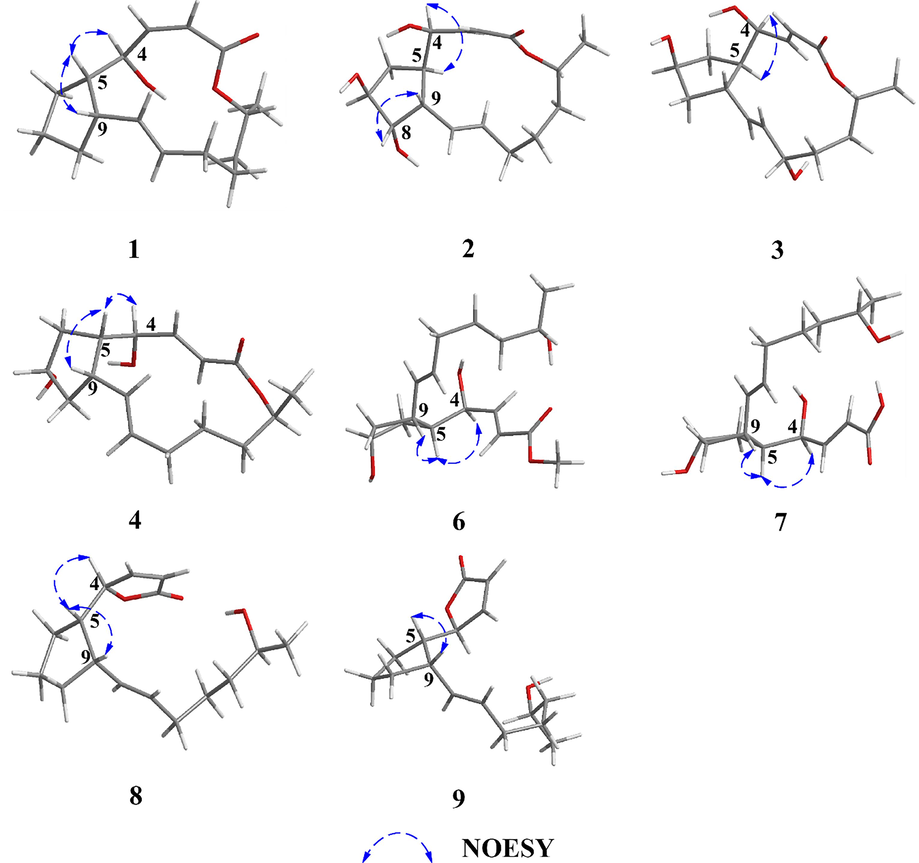
- Key NOESY correlations of compounds 1–9.
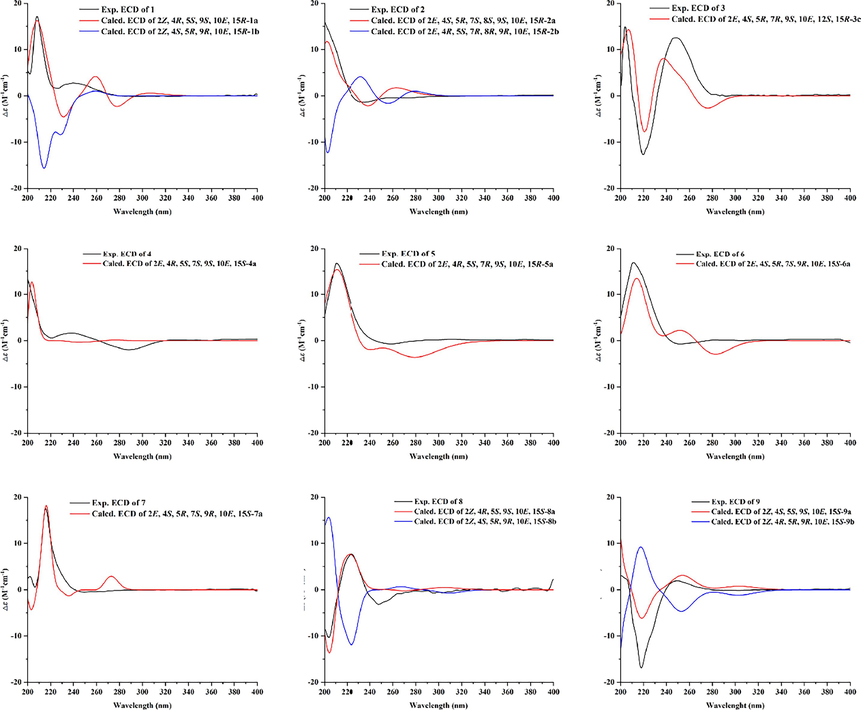
- Calculated ECD spectra and experimental ECD spectra of 1–9.
Brefeldin H (2), isolated as colorless crystals, was determined to have a molecular formula C16H24O5 by HRESIMS (m/z 295.1545 [M–H]−, calcd for C16H23O5, 295.1546). Comparison of the 1D NMR data of 2 with 4-epi-15-epi-BFA indicated that their structures were similar (Bai et al., 2022). However, the chemical shift of C-8 (δC 79.9 ppm) in 2 was significantly downfield shifted compared to that of C-8 (δC 43.0 ppm) in 4-epi-15-epi-BFA (Tables 1 and S2). Considering that 2 had a molecular weight (MW) 16 Daltons higher than 4-epi-15-epi-BFA, it could be inferred that a hydroxyl group was linked at C-8 of 2. This putative structure was further confirmed on the basis of the HMBC correlations of H-8/C-5, 6 and the 1H–1H COSY correlations of H-2∼ H-16 (Fig. 2). The small J value H-4/H-5 (J = 2.0 Hz) revealed that H-4 and H-5 were on the same side (Table 1). The NOESY correlations of H-4/H-5 and H-8/H-9, together with the absence of correlations between H-5/H-9 and H-7/H-8 indicated that H-4, H-5, H-7, H-8, and H-9 were α-, α-, α-, β-, and β-orientated, respectively (Fig. 3).
Brefeldin I (3), isolated as colorless crystals, was determined to have a molecular formula of C16H24O5 on the basis of its HRESIMS (m/z 295.1545 [M–H]−, calcd for C16H23O5, 295.1546). The NMR data of 3 closely resembled those of 4-epi-15-epi-BFA (Bai et al., 2022), with the prime difference being the dramatically shifted downfield chemical shift of C-12 (δC 68.8 ppm) in 3, compared to that of C-12 (δC 32.0 ppm) in 4-epi-15-epi-brefeldin A (Tables 1 and S2). Due to the MW of 3 was 16 Dalton greater than that of 4-epi-15-epi-BFA, this indicated that 3 had a hydroxyl group linked at C-12. The HMBC correlations of H-10, 14/C-12 and the 1H–1H COSY correlations of H-2 ∼ H-16 further confirmed this speculated structure (Fig. 2). The coupling constant of H-4/H-5 (J = 2.3 Hz) was small, suggesting H-4 and H-5 were located on the same side (Table 1). The NOESY correlation of H-4/H-5 and the non-correlation between H-5/H-9 indicated that H-4, H-5, and H-9 were α-, α-, and β-orientated, respectively (Fig. 3). However, the relative configurations of C-7 and C-12 were not identified by NOESY spectrum. To assignment the relative configuration of compound 3, the calculated NMR of four possible conformers (2E, 4S*, 5R*, 7R*, 9S*, 10E, 12R*, 15R*)-3a, (2E, 4S*, 5R*, 7S*, 9S*, 10E, 12S*, 15R*)-3b, (2E, 4S*, 5R*, 7R*, 9S*, 10E, 12S*, 15R*)-3c, and (2E, 4S*, 5R*, 7S*, 9S*, 10E, 12R*, 15R*)-3d were compared with experimental NMR. The linear correlation analysis towards the experimental and the calculated 13C NMR and DP4+ probability analysis results were shown in Fig. 5A. With a DP4+ probability of 96.61 %, the relative configuration of compound 3 was assigned as (2E, 4S*, 5R*, 7R*, 9S*, 10E, 12S*, 15R*)-3c.
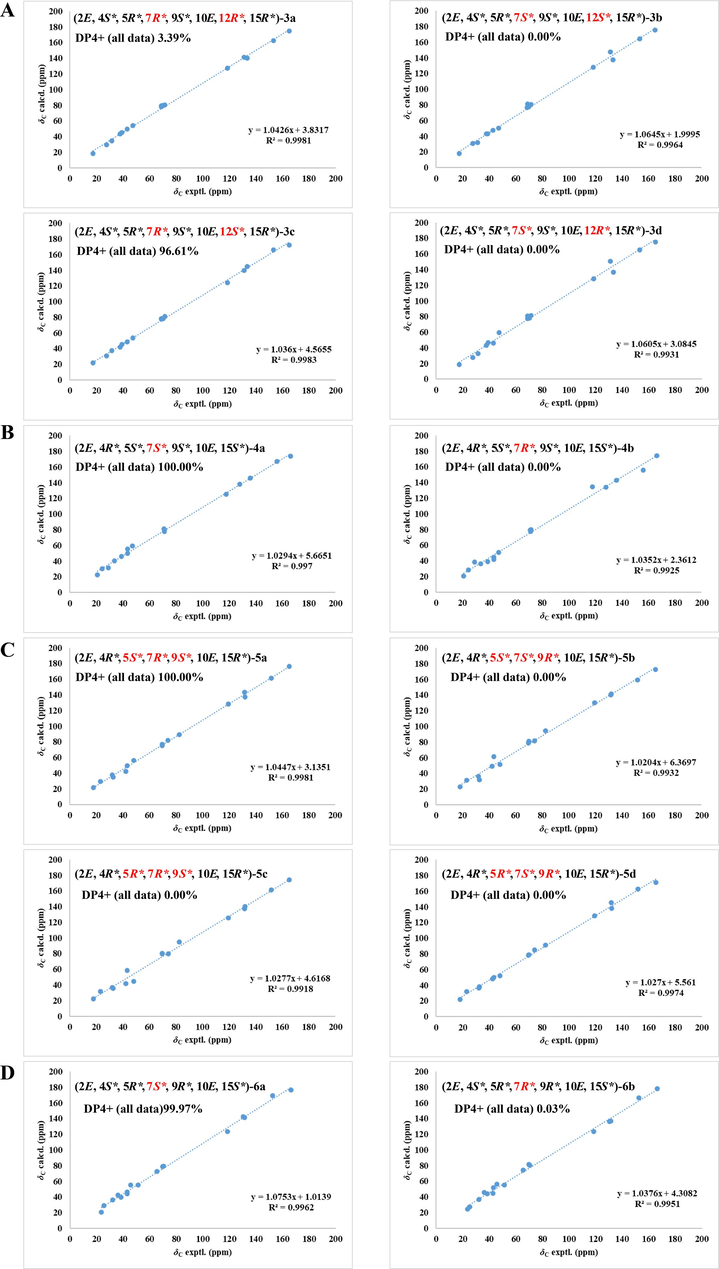
- NMR calculations with DP4+ analyses. (A) Linear correlations between the scaled calculated and experimental 13C NMR chemical shifts for compound 3 and DP4+ probability of 13C NMR chemical shifts of 3. (B) Linear correlations between the scaled calculated and experimental 13C NMR chemical shifts for compound 4 and DP4+ probability of 13C NMR chemical shifts of 4. (C) Linear correlations between the scaled calculated and experimental 13C NMR chemical shifts for compound 5 and DP4+ probability of 13C NMR chemical shifts of 5. (D) Linear correlations between the scaled calculated and experimental 13C NMR chemical shifts for compound 6 and DP4+ probability of 13C NMR chemical shifts of 6.
Brefeldin J (4) was isolated as colorless crystals. Based on the HRESIMS (m/z 281.1743 [M+H]+, calcd for C16H25O4, 281.1753), its molecular formula was assigned as C16H24O4. The NMR data of 4 closely resembled that of BFA, suggested that they shared a common planar structure and were likely stereoisomers (Table S1 and Fig. 2). The small J value H-4/H-5 (J = 2.7 Hz) revealed that H-4 and H-5 were on the same side (Table 2). The NOESY correlations between H-4 and H-5, H-5 and H-9, suggested that H-4, H-5, and H-9 were β-, β-, and β-orientated, respectively (Fig. 3). However, no effective NOE correlations can confirm the relative configuration of C-7. Thus, a calculated 13C NMR method was operated and the 13C NMR data of (2E, 4R*, 5S*, 7S*, 9S*, 10E, 15S*)-4a and (2E, 4R*, 5S*, 7R*, 9S*, 10E, 15S*)-4b were calculated. As shown in Fig. 5B, with a DP4+ probability of 100 %, the relative configuration of compound 4 was assigned as (2E, 4R*, 5S*, 7S*, 9S*, 10E, 15S*)-4a.
Brefeldin K (5) was isolated as colorless crystals. Based on the HRESIMS (m/z 295.1545 [M–H]−, calcd for C16H23O5, 295.1546), the molecular formula C16H24O5 was assigned. Comparing the 1D NMR data of 5 with 4 indicated that their structures were similar (Table 2). However, the chemical shift of C-5 (δC 82.5 ppm) in 5 showed a significant downfield shift compared to that of C-5 (δC 47.3 ppm) in 4 (Table 2). The MW of 5 was 16 Daltons higher than that of 4, indicating the presence of a hydroxyl group linked at C-5 of 5. The 1H–1H COSY correlations and the HMBC correlations from H-4 to C-5 and from H-6 to C-5 further confirmed this putative structure (Fig. 2). The relative configuration of 5 was fixed from NMR calculation and four possible conformers (2E, 4R*, 5S*, 7R*, 9S*, 10E, 15R*)-5a, (2E, 4R*, 5S*, 7S*, 9R*, 10E, 15R*)-5b, (2E, 4R*, 5R*, 7R*, 9S*, 10E, 15R*)-5c, and (2E, 4R*, 5R*, 7S*, 9R*, 10E, 15R*)-5d were calculated. The results fully matched the 5a configuration for compound 5 with 100.00 % probability (Fig. 5C).
The double bond configurations of H-2/H-3 and H-10/H-11 in compounds 2–5 were trans-arranged based on the coupling constants (J = 15–16 Hz). According to the description above, the configuration of Me-16 can be determined by the chemical shift of methyl carbon (Zeng et al., 2019). Thus, the Me-16 of 2 (δC 17.7 ppm), 3 (δC 17.4 ppm), 4 (δC 20.8 ppm), 5 (δC 18.0 ppm) was determined to be α, α, β, α-oriented, respectively (Table 1).
seco-4-epi-9-epi-BFA methyl ester (6), obtained as a colorless and transparent oil, its molecular formula was C17H28O5 based on m/z 313.2006 [M+H]+ (calcd for C17H29O5, 313.2015). The NMR data of 6 closely resembled those of seco-4-epi-7-epi-BFA methyl ester, suggested that they shared a common planar structure and were likely stereoisomers (Bai et al., 2022) (Table 2 and Fig. 2). The trans-arrangement of the double bonds of H-2/H-3 and H-10/H-11 were inferred according to the coupling constants (J = 15.5 and 15.2 Hz). The small J value H-4/H-5 (J = 5.0 Hz) indicated that H-4 and H-5 were on the same side (Table 2). The NOESY correlations between H-4 and H-5, H-5 and H-9 suggested that H-4, H-5, and H-9 were α-, α-, and α-orientated, respectively (Fig. 3). However, no effective NOE correlations can confirm the relative configuration of C-7. Thus, the calculated NMR of two possible conformers (2E, 4S*, 5R*, 7S*, 9R*, 10E, 15S*)-6a and (2E, 4S*, 5R*, 7R*, 9R*, 10E*, 15S*)-6b were calculated. The results fully matched the 6a configuration for compound 6 with 99.97 % probability (Fig. 5D).
4-epi-9-epi-BFA seco-acid (7), isolated as a colorless and transparent oil, was given a molecular formula C16H26O5 according to the HRESIMS (m/z 297.1706 [M–H]−, calcd for C16H25O5, 297.1702). Comparing the NMR data of 7 with 6 revealed the substitution of the methyl ester from 6 with a methanoic acid in 7 (Table 3 and Fig. 2). Therefore, the planar structure of 7 was the same as the known BFA analogue 4-epi-7-epi-BFA seco-acid (Bai et al., 2022). A combination of 1H–1H coupling constants and NOESY spectrum indicated that the relative configuration of 7 was the same as that of 6 (Fig. 3).
5-epi-7-dehydrobrefeldin F (8) was afforded as a colorless and transparent oil. According to the HRESIMS (m/z 263.1651 [M–H]−, calcd for C16H23O3, 263.1647), the molecular formula of C16H24O3 was assigned. Based on NMR data, 8 was speculated to be a 7 analogue. The comparison of the 13C NMR data for 8 and 7 unveiled notable disparities, particularly in the downfield shifted resonances observed at C-1 (δC 173.1), C-2 (δC 120.7), C-3 (δC 158.3), and C-4 (δC 84.7) (Table 1). In addition, 8 (Ω = 5) had one more unsaturation than 7 (Ω = 4). The observed changes indicated an α, β-unsaturated γ-lactone ring was formed between C-1 and C-4. Then, the 1H–1H COSY and HMBC spectra further confirmed this putative structure (Fig. 2). According to the coupling constants (J = 5.7 and 15.2 Hz), the double bond configurations of H-2/H-3 and H-10/H-11 were confirmed to be cis and trans, respectively. The small J value of H-4/H-5 (J = 6.3 Hz) revealed that H-4 and H-5 were on the same side. The NOESY correlations of H-4/H-5 and H-5/H-9 suggested that H-4, H-5, and H-9 were all orientated in the β-configuration (Fig. 3).
9-epi-7-dehydrobrefeldin F (9) was given as a colorless and transparent oil. According to the HRESIMS (m/z 263.1652 [M–H]−, calcd for C16H23O3, 263.1647), the molecular formula of C16H24O3 was assigned. Comparing NMR data of 9 with 8 suggested that 9 shared a common planar structure with 8 and they were likely stereoisomers. (Table 3 and Fig. 2). In addition, the large J value H-4/H-5 (J = 9.0 Hz) indicated that H-4 and H-5 oriented to the different direction. The NOESY correlations H-5/H-9 and the absence of correlations between H-4 and H-5 revealed that H-4, H-5, and H-9 were orientated in the β-, α-, and α-configuration, respectively (Fig. 3).
According to the modified Mosher's method, the absolute configuration of C-15 was unambiguously confirmed to be S, based on the ΔδH values observed between the (S)- and (R)-MTPA esters of 6 (Fig. 6). The comparison of 1D NMR data revealed that the absolute configuration of C-15 in 7 (δH-15 3.55, δC-15 65.6), 8 (δH-15 3.54, δC-15 65.6), and 9 (δH-15 3.54, δC-15 65.6) was the same as that of 6 (δH-15 3.54, δC-15 65.6).
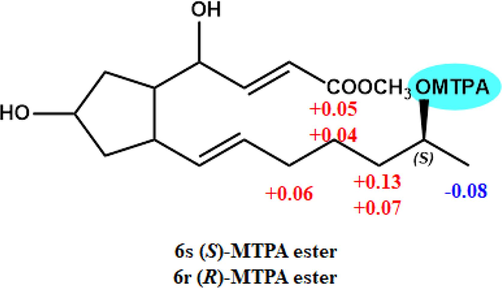
- ΔδH values obtained for (S)- and (R)-MTPA esters of 6.
In order to define the absolute configurations of 2–9, TDDFT ECD calculations were conducted at the PCM/B3LYP/6-311G (d, p) level of theory. The calculated ECD spectra of compounds 2a (2E, 4S, 5R, 7S, 8S, 9S, 10E, 15R), 3c (2E, 4S, 5R, 7R, 9S, 10E, 12S, 15R), 4a (2E, 4R, 5S, 7S, 9S, 10E, 15S), 5a (2E, 4R, 5S, 7R, 9S, 10E, 15R), 6a (2E, 4S, 5R, 7S, 9R, 10E, 15S), 7a (2E, 4S, 5R, 7S, 9R, 10E, 15S), 8a (2Z, 4R, 5S, 9S, 10E, 15S), and 9a (2Z, 4S, 5S, 9S, 10E, 15S) demonstrated excellent consistency with those of the experimental ECD curves (Fig. 4). Hence, the absolute configurations of 1–9 were defined as depicted.
The known compound 10 were identified as 4-epi-brefeldin A by comparing spectroscopic data with literature values (Xiong and Hale, 2016).
3.2 In vitro cholinesterase enzyme assay
The anticholinesterase activity against AChE and BuChE of 1–10 were tested to evaluate the potential anti-AD activity (Table 4). The results suggested that 1–5 and 10 displayed significant inhibitory activity against AChE. It's worth noting that 1 and 2 showed more potent AChE inhibitory activity (IC50 = 0.12 and 0.28 µM) than the positive control galantamine (IC50 = 0.66 µM). Notably, neobrefeldin (1) exhibited the most significant inhibitory activity against AChE, surpassing that of the therapeutic AD drug galantamine by over 5.5-fold. However, besides 1 showed weak inhibitory BuChE activity (IC50 = 175.04 µM), others displayed no inhibitory BuChE activity (IC50 > 200 μM) (Table 4). Comparing the AChE inhibitory activity of 6–9 (the ring opened BFA derivatives) with 1–5 and 10 (Table 4), it was found that the AChE activities of BFA derivatives were significantly influenced by the conformational rigidity of their 16-membered lactone. Due to 80 % of ACh is regulated by AChE in the early stages of AD, 1 and 2 may be as potent and selective AChE inhibitors for developing early anti-AD agents.
| NO. | IC50 (μM)a | ||
|---|---|---|---|
| AChE | BuChE | SIb | |
| 1 | 0.12 ± 0.05 | 175.04 ± 9.16 | 0.0007 |
| 2 | 0.28 ± 0.03 | >200 | n.c. |
| 3 | 1.50 ± 0.52 | >200 | n.c. |
| 4 | 0.99 ± 0.29 | >200 | n.c. |
| 5 | 0.89 ± 0.11 | >200 | n.c. |
| 6 | >200 | >200 | n.c. |
| 7 | >200 | >200 | n.c. |
| 8 | >200 | >200 | n.c. |
| 9 | >200 | >200 | n.c. |
| 10 | 3.19 ± 0.94 | >200 | n.c. |
| Galantaminec | 0.66 ± 0.18 | 70.71 ± 4.54 | 0.0093 |
3.3 Molecular docking studies
The active site of the AChE lies near the bottom of a deep and narrow gorge, which comprises a peripheral anionic site (PAS) and a catalytic anionic site (CAS) (Sussman et al., 1991). CAS catalytic triad is composed of Ser203, His447, and Glu334. PAS contains amino acids Tyr72, Trp86, Tyr124, and so on (Wang and Bi, 2014). To investigate the putative binding mode of the compounds 1 and 2 interactions within the AChE active site, docking analysis was performed. As Fig. 7 and Table 5 showed compound 1 interacted with Tyr124 through hydrogen bonding (HB), together with Trp86, Phe295, Phe297, Tyr337, and Phe338 through hydrophobic-hydrophobic interaction. Compound 2 exhibited several key HB with Glu202, Ser203, and Tyr337, along with hydrophobic-hydrophobic interactions with Tyr124, Phe297, Tyr337, and Phe338. Galantamine showed key HB with Ser203 and His447, as well as hydrophobic-hydrophobic interactions with Phe297 and Tyr337. Thus, compounds 1 and 2 are dual binding site (CAS and PAS) AChE inhibitors, which are different with single binding site (CAS) AChE inhibitor galantamine.
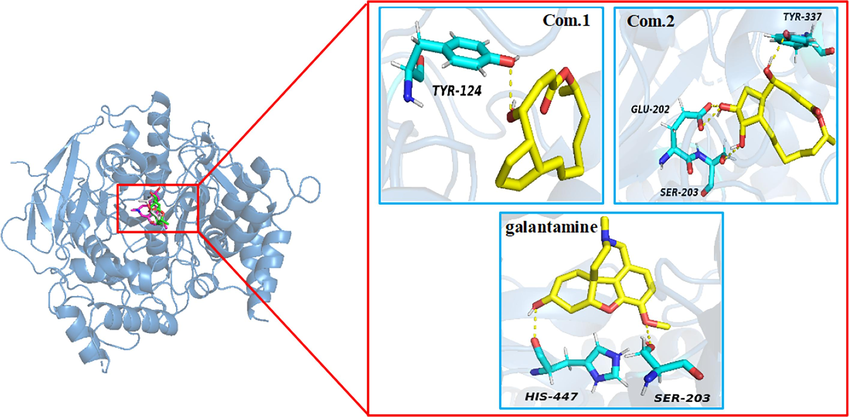
- Visual representation of compounds 1, 2 and galantamine (yellow) docked with AChE (PDB ID: 4EY6), hydrogen bonds are shown with yellow dotted lines, important amino acid residues involved in the enzyme-ligand interaction in light-blue.
| Compounds | Docked Energy (kcal/mol) | CAS relevant amino acids | PAS relevant amino acids | ||
|---|---|---|---|---|---|
| Hydrogen bonds interacting residues and bonding distance | Hydrophobic interactions and bonding distance | Hydrogen bonds interacting residues and bonding distance | Hydrophobic interactions and bonding distance | ||
| 1 | −8.23 | Phe295 (3.96 Å), Phe297 (3.33 Å), Tyr337 (3.43 Å), Phe338 (3.50 Å) | Tyr124 (1.95 Å) | Trp86 (3.35 Å) | |
| 2 | −8.14 | Glu202 (1.77 Å), Ser203 (2.07 Å), Tyr337 (1.87 Å) | Phe297 (3.13 Å), Tyr337 (3.62 Å), Phe338 (3.09 Å) | Tyr124 (3.59 Å) | |
| Galantamine | −7.68 | Ser203 (2.88 Å), His447 (1.97 Å) | Phe297 (3.85 Å), Tyr337 (3.57 Å) | ||
ACh binds to PAS, which is the first step in the process of catalytic hydrolysis, and then interacts with CAS. Even though compound 2 displays similarly binding site (CAS) compared to galantamine, the higher inhibition potency of compound 2 can be attributed to docking with PAS (Tyr124). Compound 1 shows a better binding affinity with the PAS through the HB interactions with Tyr124 (1.95 Å) than compound 2, docked with PAS through the hydrophobic-hydrophobic interactions with Tyr124 (3.59 Å) at the mouth of the gorge (Fig. 7 and Table 5). Maybe this is the reason compound 1 has the strongest AChE inhibitory activity (IC50 = 0.12 μM). Thus, the AChE inhibitory activity maybe significantly improved by increasing binding affinity with the PAS, which need to be verified by kinetic inhibition tests and enzyme co-crystallization experiments et al.. Most important of all, these findings provide new ideas for the design of AChE inhibitor and the structure optimization of BFA compounds.
4 Conclusions
In conclusion, nine previously undescribed BFA derivatives (1–9) and 4-epi-brefeldin A (10) were isolated from an endophytic fungus P. brefeldianum F4a. Compounds 1 and 2 showed more potent and selective AChE inhibitory activity than the positive control galantamine, whereas only 1 displayed weak inhibitory activity against BuChE. After that, molecular docking analyses showed 1 and 2 were dual binding site AChE inhibitors. Interestingly, 1 showed a better binding affinity with the PAS than 2, resulting in better AChE inhibitory activity. These findings suggested that 1 might be exploited as promising lead compound against AChE for developing agents against early AD.
Acknowledgements
This work was funded by the National Key Research and Development Program of China (2020YFA0907800), the Liaoning Province Applied Basic Research Program (2022JH2/101300185 and 2022JH2/101300186), the Youth Innovation Promotion Association CAS (Y2022063), and the National Natural Science Foundation of China (31872036 and 41576136).
Declaration of Competing Interest
The authors declare that they have no known competing financial interests or personal relationships that could have appeared to influence the work reported in this paper.
References
- Bioactive secondary metabolites from endophytic fungi. Curr. Med. Chem.. 2020;27:1836-1854.
- [Google Scholar]
- Penipentenone A and brefeldin A derivatives potently inhibit KRAS mutant cancer cells from an endophytic fungus Penicillium brefeldianum F4a. Phytochemistry. 2022;200:113243
- [Google Scholar]
- Acetylcholinesterase inhibitors for the treatment of Alzheimer’s disease – a patent review (2016–present) Expert Opin Ther. Pat.. 2021;31:399-420.
- [Google Scholar]
- SpecDis: Quantifying the comparison of calculated and experimental electronic circular dichroism spectra. Chirality. 2013;25:243-249.
- [Google Scholar]
- Tau protein isoforms, phosphorylation and role in neurodegenerative disorders. Brain Res. Rev.. 2000;33:95-130.
- [Google Scholar]
- Structures of human acetylcholinesterase in complex with pharmacologically important ligands. J. Med. Chem.. 2012;55:10282-10286.
- [Google Scholar]
- Alzheimer’s disease drug development pipeline: 2019. Alzheimer’s Dement.. 2019;5:272-293.
- [Google Scholar]
- A second wind for the cholinergic system in Alzheimer’s therapy. Behav. Pharmacol.. 2017;28:112-123.
- [Google Scholar]
- A new and rapid colorimetric determination of acetylcholinesterase activity. Biochem. Pharmacol.. 1961;7:88-95.
- [Google Scholar]
- Fungal endophytes: A promising frontier for discovery of novel bioactive compounds. J. Fungi. 2021;7:786.
- [Google Scholar]
- Cholinergic function and Alzheimer’s disease. Int. J. Geriatr. Psychiatry. 2003;18:S1-S5.
- [Google Scholar]
- Network-based biomarkers in Alzheimer’s disease: review and future directions. Front. Aging Neurosci.. 2014;6:1-9.
- [Google Scholar]
- Selective butyrylcholinesterase inhibition elevates brain acetylcholine, augments learning and lowers Alzheimer beta-amyloid peptide in rodent. PNAS. 2005;102:17213-17218.
- [Google Scholar]
- Global estimates on the number of persons across the Alzheimer’s disease continuum. Alzheimer’s Dement.. 2023;19:658-670.
- [Google Scholar]
- Cholinesterase inhibitors from an endophytic fungus Aspergillus niveus Fv-er401: metabolomics, isolation and molecular docking. Molecules. 2023;28:2559.
- [Google Scholar]
- The cholinergic system in the pathophysiology and treatment of Alzheimer’s disease. Brain. 2018;141:1917-1933.
- [Google Scholar]
- The amyloid hypothesis of Alzheimer’s disease: progress and problems on the road to therapeutics. Science. 2002;297:353-356.
- [Google Scholar]
- A critical review on the use of DP4+ in the structural elucidation of natural products: the good, the bad and the ugly. A practical guide. Nat. Prod. Rep.. 2022;39:58-76.
- [Google Scholar]
- AutoDock4 and AutoDockTools4: automated docking with selective receptor flexibility. J. Comput. Chem.. 2009;30:2785-2791.
- [Google Scholar]
- Decumbin, a new compound from a species of Penicillium. Nature. 1958;181:1072-1073.
- [Google Scholar]
- Regulation of acetylcholinesterase secretion from perfused bovine adrenal gland and isolated bovine chromaffin cells. J. Autonom. Nerv. Syst.. 1993;42:131-142.
- [Google Scholar]
- Atomic structure of acetyicholinesterase from Torpedo calfornica: A prototypic acetyicholine-binding protein. Science. 1991;253:872-879.
- [Google Scholar]
- Correlation between the anti-animal and anti-plant-virus activities of several antibiotics. J. Antibiot.. 1969;22:442-445.
- [Google Scholar]
- Theoretical studies on the interactions of acetylcholinesterase and newly coumarin dimmers inhibitors. J. Zaozhuang Univ.. 2014;31:59-65.
- [Google Scholar]
- Endophytic fungi: An effective alternative source of plant-derived bioactive compounds for pharmacological studies. J. Fungi. 2022;8:205.
- [Google Scholar]
- Total synthesis of the antitumor macrolides, (+)-brefeldin A and 4-epi-brefeldin A from D-glucose: Use of the Padwa anionic allenylsulfone [3 + 2]-cycloadditive elimination to construct trans-configured chiral cyclopentane systems. Org. Lett.. 2016;18:4254-4257.
- [Google Scholar]
- Dibrefeldins A and B, A pair of epimers representing the ffrst brefeldin A dimers with cytotoxic activities from Penicillium janthinellum. Bioorg. Chem.. 2019;86:176-182.
- [Google Scholar]
- Biological activities of some new secondary metabolites isolated from endophytic fungi: A review study. Int. J. Mol. Sci.. 2021;22:959.
- [Google Scholar]
- Anti-Alzheimer’s natural products derived from plant endophytic fungi. Molecules. 2023;28:2259.
- [Google Scholar]
Appendix A
Supplementary material
Supplementary material to this article can be found online at https://doi.org/10.1016/j.arabjc.2023.105388.
Appendix A
Supplementary material
The following are the Supplementary material to this article:


