

Translate this page into:
Studies on the antibacterial activities and molecular mechanism of GyrB inhibitors by 3D-QSAR, molecular docking and molecular dynamics simulation
⁎Corresponding author. yu100288@163.com (Fangfang Wang)
-
Received: ,
Accepted: ,
This article was originally published by Elsevier and was migrated to Scientific Scholar after the change of Publisher.
Abstract
DNA gyrase B (GyrB) plays a critical role in DNA replication, repair, recombination, and transcription and has become an attractive target for a number of antibacterial agents. In the present work, to better comprehend the structure–activity relationship and mechanism of action of novel series of GyrB inhibitors, a theoretical study of three-dimensional-quantitative structure–activity relationship (3D-QSAR), molecular docking, molecular dynamics (MD) simulations, and binding free energy analysis were performed. The results showed that CoMFA (R2cv = 0.591, R2pred = 0.7698) and CoMSIA (R2cv = 0.629, R2pred = 0.6848) models possessed robust stability and predictability. The derived contour maps of steric, electrostatic, and hydrogen bond donor field further displayed the modified information of these inhibitors. Molecular docking was further conducted to provide the initial binding conformation for MD simulations. Subsequently, MD simulations were applied to explore the key amino acids and binding modes at the active site. The binding free energy decomposition analysis further indicates that the residues Ile54, Glu55, Arg83, Ala85, Val86 and Thr128 are essential for the high selectivity of inhibitors. Overall, these results would serve as a significant guideline for the discovery and design of novel GyrB inhibitors.
Keywords
GyrB
CoMFA
CoMSIA
Molecular docking
Molecular dynamics

1 Introduction
The emergence of antibiotics is one of the great achievements in the field of medicine in the 20th century, which are known as “panacea” in medicine (Nikaido, 1994; Veselinović et al., 2018; Richmond et al., 2019). Furthermore, antibiotics are extensively used in the prevention and treatment of related diseases caused by microbial infections. However, problems such as multi-drug resistance caused by irrational use of antibiotics and death caused by drug-resistant bacterial infections have arisen (Klahn and Brönstrup, 2016; Chan et al., 2017). Therefore, it is urgent to find new antibiotics that can resist multi-drug resistant bacteria. Nowadays, the development of novel potent drugs mainly relied on the structure and function of related proteins specific to bacteria (Gradišar et al., 2007).
In 1976, researchers reported the discovery of DNA supercoiling enzyme DNA gyrase (a bacterial type II topoisomerase), which is specific to prokaryotes, including Escherichia coli, Borrelia burgdorferi, Pseudomonas putida, Bacillus subtilis and Staphylococcus aureus (Caron and Wang, 1994). DNA gyrase controls the topology of DNA through the process of transcription, replication, and recombination by introducing negative supercoils, or catenation and decatenation, knotting and unknotting reactions to DNA molecules (Tomašić and Peterlin Masic, 2014; Champoux, 2001). All these actions required the binding and hydrolysis of DNA (Gellert et al., 1976; Kreuzer and Cozzarelli, 1980). Therefore, DNA gyrase has been selected as the target for antibacterial drugs.
DNA gyrase is composed of two subunits, DNA gyrase A (GyrA) and DNA gyrase B (GyrB) proteins. The GyrA subunit is composed of an N-terminal domain (59–64 kDa) and a C-terminal domain (33 kDa), the N-terminal domain plays an important role in DNA breakage and reunion of the supercoiling reaction, the C-terminal domain is essential for DNA-protein interactions (Reece and Maxwell, 1989; Reece and Maxwell, 1991). The GyrB subunit also contains the N-terminal domain (43 kDa) and the C-terminal domain (47 kDa), which have a pivotal role in ATP hydrolysis and DNA binding, respectively (Caron and Wang, 1994; Chatterji et al., 2000). Several researches have indicated that the two proteins are all investigated as targets for antibacterial drugs. For example, a series of inhibitors acting on GyrA have been discovered (Kampranis and Maxwell, 1998; Maxwell, 1997). Evidence suggests that the catalytic supercoiling of DNA requires ATP hydrolysis. However, gyrase would relax DNA without ATP. Therefore, either the DNA or ATP binding cavities can be blocked by inhibitors, indicating that the GyrB protein is the main target for antibacterial agents. Many inhibitors such as Aminocoumarin (Alt et al., 2011), Simocyclinone D8 (Verghese et al., 2013), Cyclothialidines (Götschi et al., 1996), Catechin-based polyphenols (Gradišar et al., 2007), Haloemodin (Duan et al., 2014), Chebulinic acid (Patel et al., 2015), Quinolones (Emmerson and Jones, 2003), Microcin B17 (Davagnino et al., 1986), CcdB (Critchlow et al., 1997), ParE (Yuan et al., 2010), Pyridine-3-carboxamide-6-yl-ureas (Yule et al., 2014), Benzothiazinone-piperazine derivatives (Chandran et al., 2015), N-benzyl-3-sulfonamidopyrrolidines (Mukherjee et al., 2007), 1,4-Dihydro (Nikaido, 1994; Tomašić and Peterlin Masic, 2014) naphthyridine derivatives (Gençer et al., 2017), and Pentapeptide repeat proteins (Pachanon et al., 2020) have been discovered. However, the known inhibitors of GyrB are not in general medical use due to the toxicity in eukaryotic systems, and the mode of action of these inhibitors on gyrase is not yet clear. Therefore, more potent and selective GyrB inhibitors are still in need.
Generally, structure–activity relationship (SAR) can be obtained from intensive synthesis and biological assays. However, the process requires more time and effort. Nevertheless, computational approaches would predict the SAR with reduced physical effort. Recently, a series of GyrB inhibitors were identified as antibacterial agents. To obtain detailed information on the correlation between GyrB and its inhibitors, three dimensional quantitative structure–activity relationship/3D-QSAR (include comparative molecular field analysis (CoMFA) and comparative molecular similarity indices analysis (CoMSIA)) (Hong et al., 2003; Klebe et al., 1994) was conducted. Furthermore, different CoMFA and CoMSIA fields were further mapped onto the GyrB binding pocket to illustrate the detailed inhibitor-receptor interactions. In addition, molecular docking and molecular dynamics (MD) simulations were also employed to predict the detailed binding conformation and key amino acid residues responsible for the binding process. Overall, the results will provide structural insights to design more potent inhibitors of GyrB.
2 Materials and methods
2.1 Data collection
A dataset of various antibacterial agents along with their GyrB inhibitory activities was extracted from literature (Xue et al., 2020). The IC50 (μM) value of these inhibitors was converted to the corresponding pIC50 (pIC50 = -log IC50), it is because that the pIC50 is more refined. Additionally, the employed inhibitors were divided into the training set (30 inhibitors) for building models and the test set (8 inhibitors) for validating the derived models. The test set inhibitors were chosen considering that the training and test set of compounds covered the same range of binding activity (Zhang and Zhong, 2010). The structural details of the employed inhibitors along with the activities are listed in Table S1.
2.2 Molecular modeling
In this work, the three-dimensional structures of all inhibitors were constructed by Sybyl software (Biotech Ltd, Shanghai, China). The Gasteiger-Hückel charges were added to the inhibitors, then the conformations were minimized by the standard Tripos force field (Clark et al., 1989) with a distance-dependent dielectric and the Powell conjugate gradient algorithm. Finally, the conformations were selected when the energy gradient convergence criterion was reached to 0.05 kcal/mol or 1000 step minimization cycle limit.
2.3 Molecular alignment
Molecular alignment is a significant step in construction of 3D-QSAR models (AbdulHameed et al., 2008; Li et al., 2012). Considering the structural similarities of the employed GyrB inhibitors, the common atoms of these inhibitors were selected for alignment (using the module “database alignment”). In this work, two alignment approaches were investigated: the template ligand-based alignment (Alignment 1) and the docking-based alignment (Alignment 2).
Alignment 1: the most potent inhibitor (Cpd 01) was used as the template to overlap the remaining inhibitors based on the common substructure (Fig. 1A), and the result of alignment is depicted in Fig. 1B.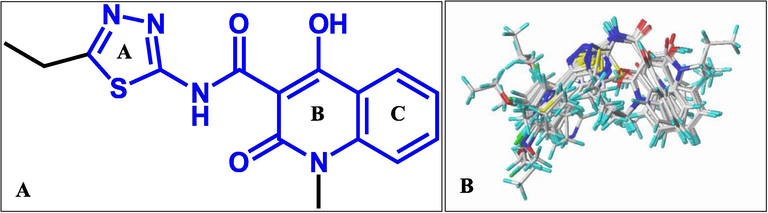
(A) The most potent inhibitor 1 is used as the template for Alignment 1. (B) The result of Alignment 1.
Alignment 2: the binding poses derived from molecular docking were used for model development, which have been selected manually based on the docking score. The result is shown in Figure S1.
2.4 3D-QSAR studies
Initially, the overlapped inhibitors were placed in a 3D cubic box with grid spacing of 2.0 Å. A sp3 carbon probe atom with a van der Waals radius of 1.52 Å and + 1 charge were used to calculate the CoMFA steric (Lennard-Jones 6–12 potential) and electrostatic (Coulombic potential) field energies (Lu et al., 2010; Buolamwini, 2009). A default cutoff energy of 30 kcal/mol was employed for steric and electrostatic fields. The column filtering was set to 2.0 kcal/mol to accelerate analysis and reduce noise. In addition, the CoMFA fields were scaled by the CoMFA-STD method. The CoMSIA properties (steric, electrostatic, hydrophobic, hydrogen bond donor, and hydrogen bond acceptor fields) were calculated using a probe of a radius of 1.0 Å, charge + 1, hydrophobicity + 1, hydrogen bond donor + 1, and hydrogen bond acceptor + 1, and attenuation factor of 0.3.
As an extension of multiple regression analysis, the partial least-squares (PLS) method (Wold et al., 1984; Clark and Cramer, 2010; Bush and Nachbar, 1993) was used to generate the 3D-QSAR models. Cross-validation was initially done by the leave-one-out (LOO) method where one inhibitor was removed from the dataset and its activity was predicted using the derived model. Then, the optimal number of components (ONC) and the cross-validated coefficient R2cv were generated to check the quality of the model. The ONC was further employed to produce the final 3D-QSAR model using non-cross-validation analysis (Cruciani et al., 1992; Baroni et al., 1992). The non-cross-validated model was assessed by following parameters: the non-cross-validated correlation coefficient (R2ncv) and the standard error of estimate (SEE).
Additionally, the test set was employed to evaluate the predictive power of the 3D-QSAR model (Tropsha et al., 2003; Golbraikh and Tropsha, 2002). The predictive R2pred was defined as:
Where SD is the sum of squared deviations between the inhibitory activities of the test set and mean activity of the training set inhibitors, and PRESS is the sum of squared deviation between the actual and predicted activities of the test set compounds.
2.5 Applicability domain (AD) analysis
To apply the derived 3D-QSAR models for predicting novel inhibitors, the applicability domain should be calculated, only those inhibitors situating within the AD domain would be considered statistically reliable. Therefore, we calculated the AD of the developed 3D-QSAR model. Although researches have indicated that there are various approaches can be used to determining the AD, a simple approach (https://dtclab.webs.com/softwaretools or https://teqip.jdvu.ac.in/QSAR_Tools/) was conducted in the present work.
2.6 Molecular docking
Molecular docking was carried out using the AutoDock software (The Scripps Research Institute, La Jolla, USA) (Morris et al., 1998). The crystal structure of GyrB was selected from the protein data bank ( http://www.rscb.org/pdb) with PDB entry of 4URO (Lu et al., 2014). Initially, all the inserted waters and ligand were deleted. The side chains and terminal chains of the receptor were repaired, while the hydrogen atoms and Kollman charges (Weiner et al., 1984) were added. For the inhibitors, Gasteiger partial charges and non-polar hydrogen atoms (Gasteiger and Marsili, 1980) were assigned, and all single bonds were set to flexible.
A box of 60 × 60 × 60 Å with a grid spacing of 0.375 Å was formed. Additionally, the translation, the quaternion and torsion, the maximum number of energy evaluation, the maximum number of generations, the rate of gene nutation, the rate of crossover, the number of cycles were set to 0.2 Å, 25-degree, 250 000, 27 000, 0.02, 0.8 and 10, respectively. Finally, configuration possessing the lowest empirical binding free energy was chosen for the construction of 3D-QSAR models.
2.7 MD method
The docked systems were further refined by thermos-dynamic simulations in order to search the most stable binding pose, which would be employed for further binding free energy calculation.
2.7.1 MD inputs
MD simulations were performed on energy-minimized GyrB protein-Cpd01/Cpd29 docked complexes. For the inhibitors (Cpd01 and Cpd29), the force field parameters were generated by GAFF using the Antechamber program of Ambertools 21 (Case et al., 2018; Wang et al., 2006; Wang et al., 2004), and the partial atomic charges for the inhibitor atoms were derived using the RESP protocol (Bayly et al., 1993) after calculating the electrostatic potential at the B3LYP/6-31G* level (Stephens et al., 1994; Frisch et al., 2009). The parameters of GyrB protein were defined by AMBER 14SB force field (Maier et al., 2015). Each system was neutralized by adding counter ions (Na+) and solvated in a periodic solvent box TIP3P with thickness of 16 Å in layer (Jorgensen et al., 1983). The final system of GyrB-Cpd01 and GyrB-Cpd29 is 98.26 × 107.39 × 96.46 Å3 (85564 atoms) and 98.26 × 107.39 × 96.46 Å3 (85569 atoms), respectively.
2.7.2 MD process
MD simulations were performed by AMBER v 20 (PMEMD) software (Case et al., 2018). Minimization was used to the solvated systems for 10,000 steps, then the systems were equilibrated with three steps (50 ps of heating, 50 ps of density equilibration, and 500 ps of constant pressure at 1 atm) at 300 K. The SHAKE (Ryckaert et al., 1977) was applied to constrain the hydrogen atoms. Finally, the production phase was simulated for 200 ns with three replicates for each system and the conformations were sampled every 10 ps.
2.7.3 Local principal component analysis (PCA)
PCA was performed by Gromacs v 5.11 in order to search stable binding pose with minimum local free energy (Abraham et al., 2015). The displacement matrix of PCA was generated using the heavy atoms of the receptor and the inhibitor. In the essential dynamic analysis (EDA), the PC vectors (more than 50% of overall covariance) were used for distinguishing the top two significant movements of the system, then the production phase trajectories (600 ns for each system) were projected onto a subspace defined by PC1 and PC2. Finally, the possibility of the microstates found in the subspace were computed for the following local free energy landscape analysis.
2.7.4 Local free energy landscape
The local free energy
of each microstate
was estimated by weighted-histogram analysis (WHAM) approach (Kumar et al., 1992; Marinelli et al., 2009), in which the
of
given number of microstates that represented the configurations observed by the PC1&2 subspace. Therefore, the local free energy of a microstate
was described as:
Where is the frequency of the microstate that observed in the trajectory . The is the normalization constants, which is self-consistently determined as in the WHAM method (Marinelli et al., 2009). The correction method was applied to describe the variation of the bias over different conformations that assigned to the same cluster (Marinelli et al., 2009). The is the bias potential acting on microstate , which is estimated as follows:
Where is total production simulation time; is the beginning of production phase, which is the last time frame of equilibrium when the bias potentials become stable. Therefore, according to eq.1&2, the 2D map is converted to the 2D local free energy landscape (LFEL) heat map and 3D LFEL surface map by Gromacs v5.11 (Abraham et al., 2015) and Mathematica v11.3 (Wolfram, 2018).
2.7.5 Binding free energy calculation
For each system, the binding free energies (
) were calculated on the nearest poses (100 frames) around the one with lowest local free energy using MM/PB&GBSA method (Kollman et al., 2000; Wang et al., 2001) with MMPBSA.py.MPI (Miller et al., 2012) according to:
Where , and are the free energies of the complex, the receptor and the inhibitor, respectively (eq. 3). The enthalpy is derived by adding the internal energy from gas phase ( ) and the solvation free energy ( ) (eq. 5). , and represents the temperature of the simulated environment, the entropy of the molecule, and the conformational entropy, respectively (Kollman et al., 2000). The term as the standard gas phase energy is composed of internal ( ), van Der Waals ( ), and electrostatic energies ( ) (eq. 6). The is set to 0 since only complex MD simulations were performed in the present work. The solvation energy is the sum of non-ploar energy ( ) and electrostatic energy ( ) (eq. 7). The can be obtained by solving the Poisson-Boltzmann function with the default cavity radii from AMBER pomtop files. The dielectric constant is set to 1 and 80 for the interior solute and exterior solvent, respectively. The is computed using Hawkins, Cramer, and Truhlar pairwise generalized Born model (Hawkins et al., 1996; Hou et al., 2006) with the parameters described by Tsui and Case (Onufriev et al., 2000). The solvent accessible surface area (SASA) is determined by the LCPO approach (Weiser et al., 1999). The surface tension and is set to 0.00542 kcal/mol*Å2 and 0.92 kcal/mol, respectively (Hermann, 1972; Sitkoff et al., 1994).
3 Results and discussion
3.1 Analysis of CoMFA and CoMSIA models
The optimum models are based on Alignment 1, as shown in Table 1 (different combinations of CoMSIA fields are listed in Table S2). R2cv = Cross-validated correlation coefficient using the leave-one-out methods; R2ncv = Non-cross-validated correlation coefficient; SEE = Standard error of the estimate; F = Ratio of R2ncv explained to unexplained = R2ncv/(1-R2ncv); R2pred = Predicted correlation coefficient for the test set of compounds; SEP = Standard error of prediction; ONC = Optimal number of principal components.
Parameters
CoMFA
CoMSIA
R2cv
0.591
0.629
R2ncv
0.716
0.864
SEE
0.249
0.186
F
70.554
80.591
R2pred
0.7698
0.6848
SEP
0.299
0.307
ONC
1
5
Field contribution
Steric
0.662
–
Electrostatic
0.338
0.620
Hydrophobic
–
–
Hydrogen bond donor
–
0.380
Hydrogen bond acceptor
–
–
In the CoMFA model, the optimum number of components is 1, and the cross-validated R2cv value is 0.591 (greater than 0.5), suggesting that the derived CoMFA model possesses good predicting ability. In addition, the standard error of the estimate (SEE) is 0.249, F value is 70.554, the non-cross-validated R2ncv is 0.716, indicating that this model has good fitting ability. In order to validate the predictive ability of the CoMFA model, the values of the test inhibitors were predicted by the constructed model, and the predicted correlation coefficient R2pred is 0.7698, and SEP is 0.299, suggesting that the CoMFA model is a reliable predictor. The contributions of steric and electrostatic fields are 66.2% and 33.8%, respectively, which indicate that the steric field is predominant in CoMFA model. The plot of the predicted versus the experimental inhibitory activities is shown in Fig. 2A.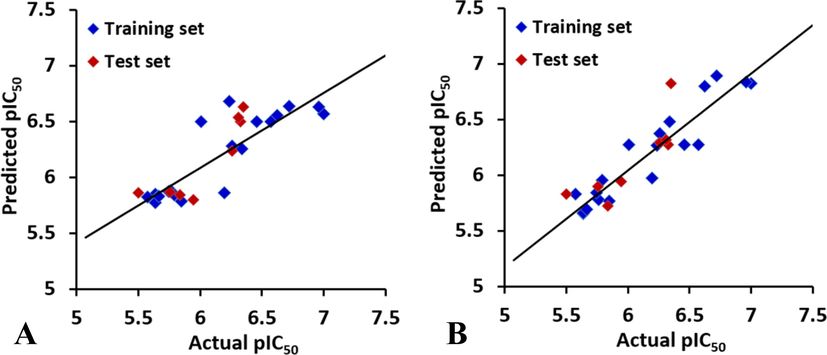
Plot of the predicted activity against the experimental activity by the optimal (A) CoMFA model and (B) CoMSIA model.
Using the electrostatic and hydrogen bond donor descriptors, the CoMSIA model gives a cross-validated R2cv of 0.629 with 5 optimal components. PLS analysis with non-cross-validation gives the R2ncv of 0.864, F value of 80.591 and SEE of 0.186. Furthermore, the model has an R2pred value of 0.6848 (higher than 0.5), indicating that the best CoMSIA model is reliable. The electrostatic and hydrogen bond donor fields has contributions of 62.0% and 38.0%, respectively. The result suggests that the contribution of electrostatic is predominant in CoMSIA model. The experimental versus predictive activity graph for the CoMSIA model is produced to visualize whether there is an adequate linear distribution of the predictive results (Fig. 2B). A well data distribution along the line y = x in the whole data set is observed.
3.2 Contour maps analysis and its comparison with ligand-receptor interactions
To visualize the field effects on the inhibitors in 3D space, the contour maps were analyzed with reference to the template molecule (Cpd01), as depicted in Fig. 3 and Fig. 4. Furthermore, the ligand-receptor interactions derived from MD simulation were analyzed to verify the accuracy of the developed 3D-QSAR models.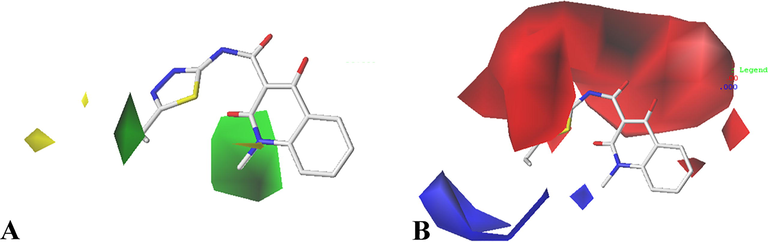
CoMFA contour maps in combination of Cpd01. (A) Steric contour maps, green and yellow contours with 80% contribution and 20% contribution, respectively. (B) Electrostatic contour maps, blue and red contours with 80% contribution and 20% contribution, respectively.
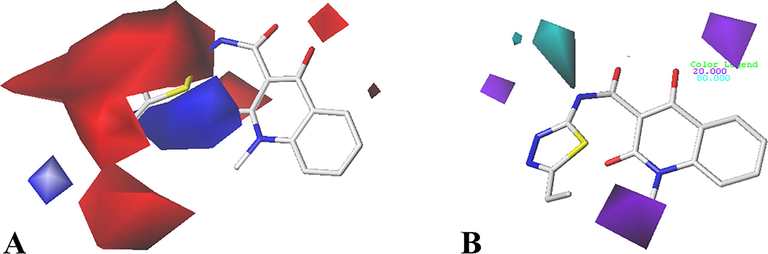
CoMSIA contour maps in combination of Cpd01. (A) Electrostatic contour maps, blue and red contours with 80% contribution and 20% contribution, respectively. (B) Hydrogen bond donor contour maps, cyan and purple contours with 80% contribution and 20% contribution, respectively.
The conformation of Cpd01 in the binding site of GyrB is shown in Fig. 5. As illustrated in Fig. 5A, amino acid residues Ile38, Asn41, Ser42, Glu45, Val66, Thr67, Asp68, Arg71, Gly72, Ile73, Pro74, Ile89, Thr160, Val161, and Ile162 surround the most potent Cpd01. Additionally, two hydrogen bonds (the black dash lines) are observed between the hydroxyl group of ring B with Glu45 (-O···HO, 2.30 Å, 110.8°) (H-1), the carbonyl group of ring B with Asn41 (-O···HN, 2.02 Å, 136.2°) (H-2), listed in Fig. 5B.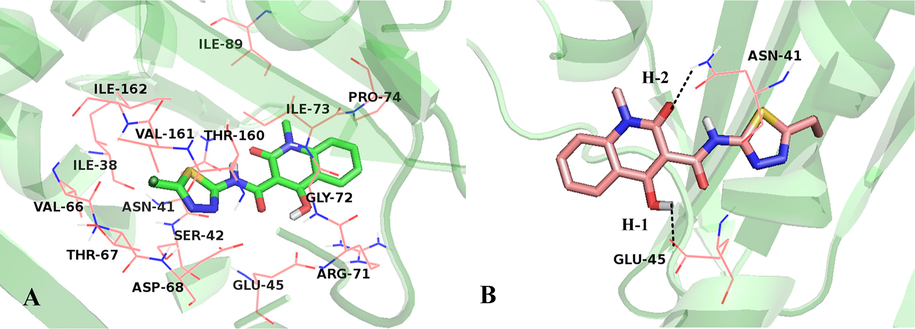
(A) Binding geometry of Cpd01 determined by MD simulation. (B) Hydrogen bond interaction with binding site residues, Cpd01 is displayed in stick, hydrogen bonds are shown as dotted black lines, and the nonpolar hydrogens were removed for clarity.
3.2.1 CoMFA contour maps
The CoMFA steric contour maps are indicated by green (80% contribution) and yellow (20% contribution) colors. The green contour maps indicate that the activity would be increased with the increase of substituents, while the yellow contour maps indicate the opposite. A medium-sized green contour around R1 substituent suggests that increasing the volume at this position is conducive to improve the activity. For instance, Cpd01 (pIC50 = 7.0000) has –CH2CH3 in R1, and its activity is higher than Cpd02 (pIC50 = 6.7212) with hydrogen atom at this area. As illustrated in Fig. 5A, the pocket formed by amino acids Val66, Thr67, Asp68, Thr160, Val161, and Ile162 can hold bulky substituent, which is in agreement with the green contour at this location. There is a large contour at R2 group, illustrating that increasing the volume here is useful for the improvement of activity, such as the arrangement of the activities: Cpd03 (–CH2CH3) > Cpd02 (–CH3). Ligand-receptor interactions further display that the R2 group almost sticks out the binding pocket, suggesting that larger group at this area is favorable for the inhibitory activity.
The CoMFA electrostatic contour maps are shown in Fig. 3B. The red contours (20% contribution) mean that electronegative substituents are favorable, while the blue contours (80% contribution) mean the electropositive groups are favorable. A large red contour covers the R1 substitution of Cpd01, which suggests that electronegative group selection is required in this region. For the most active Cpd01, a positively charged group is situated, thus modifications can be made at this position. In addition, there is a blue graph distributed around the red contour map, indicating that if the group at this place extends to the blue graph, the positively charged group is beneficial to the activity. That is why the activity of Cpd20 (
 ) is higher than that of Cpd19 (
 ). The detailed interacting mode of Cpd01 in the binding site suggests that neutral amino acid residues Val66, Thr67, Thr160, Val161, and electronegative residue Asp68 are located near R1 substituent, further indicating that electropositive groups at Cpd01 would favor electrostatic interaction with receptor GyrB. A small blue contour near R2 substituent indicates the region where the introduction of more positive electrostatic potential would increase the activity. This is consistent with all compounds cited in the article, where positively charged groups are observed at this area.
3.2.2 CoMSIA contour maps
The CoMSIA electrostatic contours (Fig. 4A) closely resemble the CoMFA results. For example, a red contour is seen near R1 substituent, a blue contour is positioned around the red contour, and a blue contour is located at R2 group.
The hydrogen bond donor field is presented in Fig. 4B. The cyan indicates that hydrogen bond donor group (80% contribution) here is beneficial to the activity, and the purple area (20% contribution) reflects that it is better to replace it with a hydrogen bond acceptor group. There is a purple contour around R2 substituent, which means that the addition of hydrogen bond acceptor group can enhance the activity. Therefore, substituents here can be modified to improve the activity. Furthermore, purple and cyan contour maps are also distributed at the common skeleton at the same time. For example, the carboxyl of ring B is oriented within the purple contour, indicating that hydrogen bond donor substituent at this area is not favor the inhibitory activity, which match well with the hydrogen bond interactions (Fig. 5B). Additionally, the –NH group between ring A and ring B is projected into a cyan polyhedron, suggesting that hydrogen bond donor group at this position may increase the inhibitory activity. The carbonyl group of ring B is also touching the purple contour map, indicating that hydrogen bond acceptor groups are beneficial to the activity.
3.3 AD analysis
For the 3D-QSAR models, no outlier for the training set and the test set is observed, meaning that the derived 3D-QSAR models are reliable. Furthermore, AD analysis also indicates that the optimum CoMFA and CoMSIA models can be applied for predicting novel inhibitors possessing common substructure.
3.4 Molecular docking
To validate the accuracy of molecular docking, the co-crystallized ligand NOV was re-docked into the active site of GyrB with Root Mean Square Deviation (RMSD) of 0.631 Å. The superimposed conformation between the original crystal structure and the docked structure is illustrated in Fig. 6. High resemblance between them is observed and it is representative for the bioactive conformation to dock all GyrB inhibitors, which the docked conformations with lowest binding energies would be further employed for 3D-QSAR construction and MD simulations.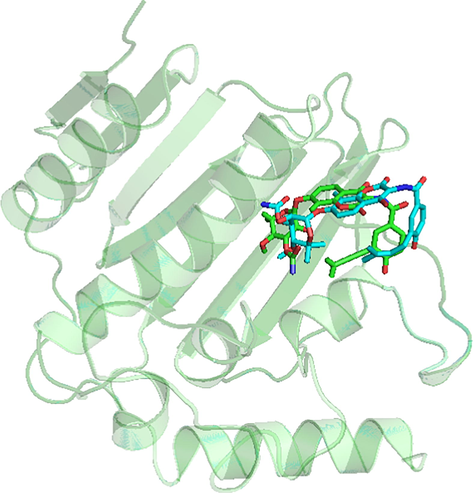
Superimposition of the original pose and the re-docked pose (Cyan = Original, Green = Docked).
3.5 MD simulations
MD simulations of the two docked complexes (GyrB-Cpd01 and GyrB-Cpd29) were used to examine the reliability of molecular docking and gain insight into the stability and dynamics properties of the complexes.
3.5.1 Plasticity of the MD systems
The RMSD of each inhibitor-GyrB complex is depicted in Fig. 7. The curve shows that the GyrB protein in the Cpd29 system fluctuates higher (2.78 ± 0.52 Å) than that in the Cpd01 system (2.43 ± 0.34 Å). Additionally, the RMSD of Cpd01 (0.53 ± 0.17 Å) is slightly lower than Cpd29 (0.77 ± 0.25 Å). In run3 of the GyrB-Cpd29 system, the considerably higher RMSD value is presented (3.24 ± 0.45 Å), indicating that Cpd29 has smaller influence on structural stability than Cpd01.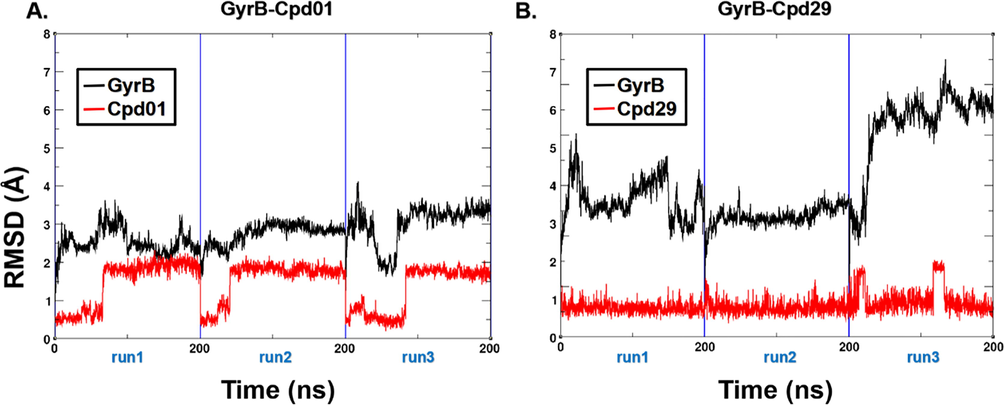
The RMSD of the backbone atoms relative to the docking structures as function of time. (A) The three replicates of GyrB-Cpd01. (B) The three replicates of GyrB-Cpd29.
Additionally, detailed analysis of root-mean-square fluctuation (RMSF) versus the residue number is shown in Fig. 8. In the two systems, the RMSF shows larger fluctuation in flexible loop, Gly109 to Gly112 of domain II (7.58 ± 1.18 Å for GyrB-Cpd01, 9.44 ± 1.25 Å for GyrB-Cpd29). Secondly, the peek at the rim of the protein is also seen at residues Phe99-Gly101 (5.74 ± 0.22 Å) for both systems, which is corresponding to the missing 21 residues region. Thirdly, for the ligand binding domain (Thr158-Ile162), the RMSF in Cpd01 system (1.23 ± 0.14 Å) is lower than that in Cpd29 system (1.56 ± 0.34 Å), suggesting that the binding of Cpd29 is not as stable as that of Cpd01.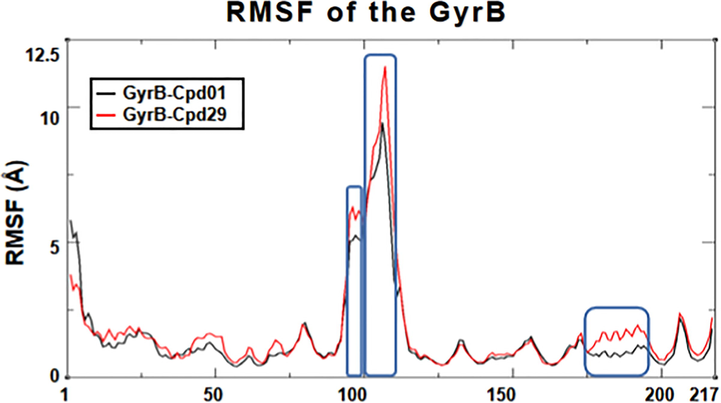
The RMSF plot of the two MD systems. Replicate trajectories were combined.
3.5.2 Essential dynamics (ED) and free energy landscape (FEL)
PCA was applied to identify the main eigenvectors along which the majority of the complex motion is defined. Since PC1 and PC2 hold more than 50% of the overall covariance of the atomic displacements, therefore, the major movements are mainly derived by analyzing the ED, which can be computed by projecting the trajectories only upon PC1 and PC2 per MD system. Additionally, the most stable binding states would be identified by calculating the probability based kinetic FEL.
In the GyrB-Cpd29 system (Fig. 9), the structural changes described by PC1 are dominated at the modeled missing loop (Val92-Gly112) and the loop (Pro74-Arg83) of LBD. The structural changes defined by PC2 (Fig. 9B) are observed prior to H6 helix (Gly114-Leu121), 5 Å far to the left of inhibitor Cpd29 (rotated up and down by 3.7 Å), which might be the reason destabilized the ligand binding.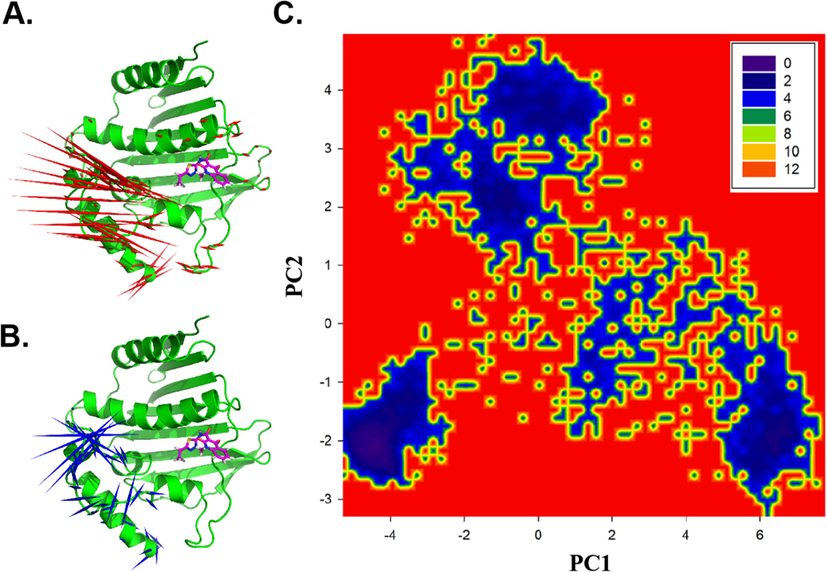
The ED, FEL of GyrB-Cpd29. (A) The ED derived from PC1. (B) The ED derived from PC2. Red and green arrows are proportional to the movement scale of the Cα atoms in GyrB. (C) The FEL on the same PC1&PC2 defined subspace of GyrB-Cpd29.
The original docked and minimized structures were weighted 4.1 kT in the PC1 and PC2 defined FEL. Three metastable states: −51.2, 66.6, 0.31 kT, −63.2, −54.3, 0.21 kT and 76.4, −18.9, 0.1 kT (the most stable state) are discovered (Fig. 9C), which are further selected for binding free energy calculations.
In the GyrB-Cpd01 system, little swing movements are mainly found at domain Ι (<0.75 Å) and LBD domain (along around 0.2 Å) in PC1 (Fig. 10A); large movements are observed at the modeled missing loop in PC1&2. Furthermore, the movements along PC2 are much smaller than those in PC1. Compared with Cpd29 system, the movement in the LBD domain is smaller for Cpd01 complex. The converted FEL analysis indicates that the most metastable state is located around (47.5, −9.3), with the reference free energy of 0.1 kT.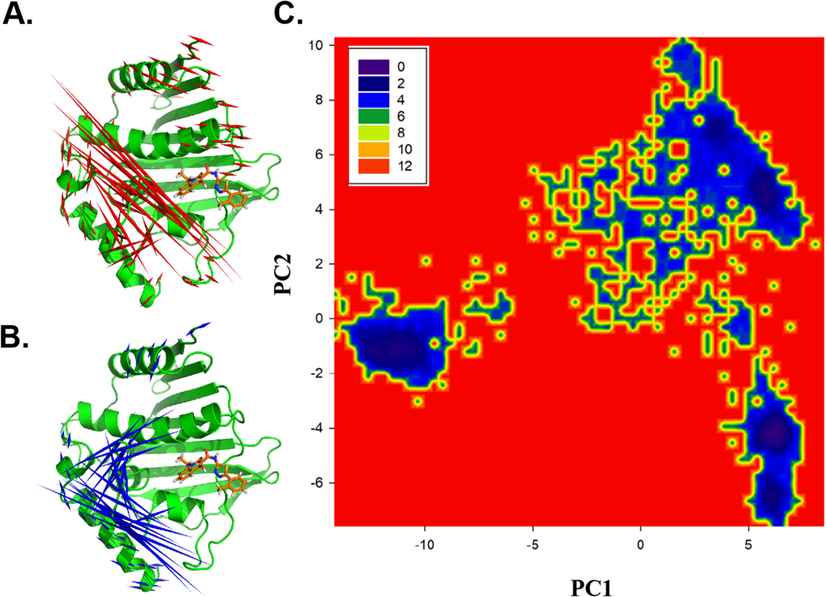
The ED, FEL of GyrB-Cpd01. (A) The ED derived from PC1 (B). The ED derived from PC2. Color representations were kept same with Fig. 10. (C). The FEL on the same PC1&PC2 defined subspace of GyrB-Cpd01.
3.5.3 MM/PB&GBSA analysis
To gain insight into the interactions between inhibitors and receptor GyrB, the binding free energy of GyrB-Cpd01/29 was elaborately calculated using the snapshots extracted from the most stable states discovered by FEL.
The results of binding free energy using MM-GBSA and MM-PBSA method are shown in Table S4. The calculated binding free energy for Cpd01 and Cpd29 is −14.24 kcal/mol and −14.12 kcal/mol, respectively (GBSA), and −2.2 kcal/mol, −1.2 kcal/mol for PBSA (Cpd01 and Cpd29) (Table S4), indicating that Cpd01 is somewhat a better ligand for GyrB compared to Cpd29. Indeed, the binding free energy of Cpd29 and Cpd01 is consistent with the predicted values calculated from the developed 3D-QSAR models, further validating the reliability of the constructed models. It can be seen from the binding free energy components that the van der Waals interactions are pivotal for ligand binding (-36.92 kcal/mol and −51.11 kcal/mol for Cpd01 and Cpd29, respectively). On the other hand, the gas phase energy (DELTA G gas) also contributes largely to the binding free energy (-37.8 kcal/mol and −71.68 kcal/mol for Cpd29 and Cpd01, respectively), illustrating that hydrophobic interactions are also important in stabilization of the binding site. Additionally, the polar part of solvation free energy is unfavorable to the binding affinity of the complexes, owing to large volume of the ligand binding pocket, which exposes to the massive solvent.
3.5.4 Binding free energy decomposition
To get the detailed effects of individual residues on binding affinity of the simulated systems, the binding free energy (GBSA) was decomposed (Fig. 11). For Cpd29, major favorable energy contributions are predominantly originated from amino acids Asn41, Ser42, Glu45, Asp68, Arg71, Gly72, Ile73, Pro74, Ile89 and Thr160. Interestingly, these amino acids are found higher contributions to the binding of Cpd01. Notably, the unfavorable contributions can be detected at residues Lys65, Lys105 and Arg131 in the two systems, suggesting that the structure of Cpd01 can still be altered at the dihydroquinolin ring to improve the activity.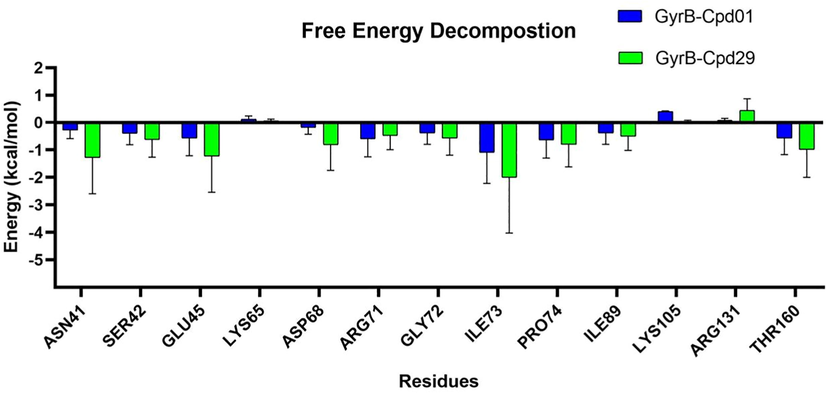
Per residue average energy contributions to binding free energy.
3.6 Design novel GyrB inhibitors
Based on the constructed CoMFA and CoMSIA 3D-QSAR models and MD results, several new compounds have been designed to improve the activity (Table 2). The inhibitory activities are then predicted by the developed models.
No
Structure
Predicted activity (pIC50)
R1
R2
CoMFA
CoMSIA
D1
–CH2COOH
–OCH3
7.108
7.132
D2
-SO2CH3
-OPh
7.523
7.487
D3
–CH2CH2OH

7.351
7.362
4 Conclusions
In this work, predictive 3D-QSAR models (using CoMFA and CoMSIA methods) were constructed for a series of GyrB inhibitors. The CoMFA and CoMSIA models displayed satisfactory results according to several statistical parameters: R2cv and R2pred for the internal and external data set. The comparison of CoMFA and optimal CoMSIA model suggests that the CoMSIA model is superior to the CoMFA model, highlighting the significance of electrostatic and hydrogen bond donor fields toward GyrB inhibitory activity of these inhibitors. The contour maps further give sufficient information for illustrating the structure–activity relationship, which would be helpful in further design of novel and potent GyrB inhibitors. In addition, molecular docking and MD simulations were synergistically applied to study the interactions of this series of inhibitors within the binding pocket. The detailed interactions of the ligand-receptor and the information prompted by contour maps confirmed each other. At the same time, key amino acids affecting the activity of these inhibitors, such as Asn41, Ser42, Glu45, Asp68, Arg71, Gly72, Ile73, Pro74, Ile89 and Thr160 were identified. Additionally, amino acids Asn41 and Glu45 could form hydrogen bonds to maintain the stability of inhibitor in the binding site. Overall, this research will make a significant contribution in the field of GyrB inhibitors discovery.
Acknowledgements
The study was supported by the National Natural Science Foundation of China (No. 32001699).
References
- Combined 3D-QSAR modeling and molecular docking study on indolinone derivatives as inhibitors of 3-phosphoinositide-dependent protein kinase-1. J. Chem. Inf. Model.. 2008;48:1760-1772.
- [Google Scholar]
- GROMACS: High performance molecular simulations through multi-level parallelism from laptops to supercomputers. SoftwareX. 2015;1:19-25.
- [Google Scholar]
- An artificial pathway to 3, 4-dihydroxybenzoic acid allows generation of new aminocoumarin antibiotic recognized by catechol transporters of E. coli. Chem. Biol.. 2011;18:304-313.
- [Google Scholar]
- Predictive ability of regression models Part II: Selection of the best predictive PLS model. J. Chemometrics. 1992;6:347-356.
- [Google Scholar]
- A well-behaved electrostatic potential based method using charge restraints for deriving atomic charges: the RESP model. J. Phys. Chemistry. 1993;97:10269-10280.
- [Google Scholar]
- CoMFA and CoMSIA 3D-QSAR studies on S6-(4-nitrobenzyl)mercaptopurine riboside (NBMPR) analogs as inhibitors of human equilibrative nucleoside transporter 1 (hENT1). Bioorganic & medicinal chemistry letters; 2009.
- Sample-distance partial least squares: PLS optimized for many variables, with application to CoMFA. J. Computer Aided Molecular Design. 1993;7:587-619.
- [Google Scholar]
- Appendix II: Alignment of primary sequences of DNA topoisomerases. Adv. Pharmacol.. 1994;29:271-297.
- [Google Scholar]
- I.Y.B.-S. D.A. Case, S.R. Brozell, D.S. Cerutti, T.E. Cheatham, III, V.W.D. Cruzeiro, T.A. Darden, R.E. Duke, D. Ghoreishi, M.K. Gilson, H. Gohlke, A.W. Goetz, D. Greene, R Harris, N. Homeyer, S. Izadi, A. Kovalenko, T. Kurtzman, T.S. Lee, S. LeGrand, P. Li, C. Lin, J. Liu, T. Luchko, R. Luo, D.J. Mermelstein, K.M. Merz, Y. Miao, G. Monard, C. Nguyen, H. Nguyen, I. Omelyan, A. Onufriev, F. Pan, R. Qi, D.R. Roe, A. Roitberg, C. Sagui, S. Schott-Verdugo, J. Shen, C.L. Simmerling, J. Smith, R. Salomon-Ferrer, J. Swails, R.C. Walker, J. Wang, H. Wei, R.M. Wolf, X. Wu, L. Xiao, D.M. York and P.A. Kollman,, AMBER 18, University of California, San Francisco., 2018.
- DNA topoisomerases: structure, function, and mechanism. Annu. Rev. Biochem.. 2001;70:369-413.
- [Google Scholar]
- Thiophene antibacterials that allosterically stabilize DNA-cleavage complexes with DNA gyrase. Proc. Natl. Acad. Sci.. 2017;114:E4492-E4500.
- [Google Scholar]
- Benzothiazinone-piperazine derivatives as efficient Mycobacterium tuberculosis DNA gyrase inhibitors. International journal of mycobacteriology. 2015;4:104-115.
- [Google Scholar]
- The additional 165 amino acids in the B protein of Escherichia coli DNA gyrase have an important role in DNA binding. J. Biol. Chem.. 2000;275:22888-22894.
- [Google Scholar]
- The Probability of Chance Correlation Using Partial Least Squares (PLS) QSAR Comb. Sci.. 2010;12:137-145.
- [Google Scholar]
- Van Opdenbosch, Validation of the general purpose Tripos 5.2 force field. J. Comput. Chem.. 1989;10:982-1012.
- [Google Scholar]
- The interaction of the F plasmid killer protein, CcdB, with DNA gyrase: induction of DNA cleavage and blocking of transcription. J. Mol. Biol.. 1997;273:826-839.
- [Google Scholar]
- Predictive ability of regression models. Part I: Standard deviation of prediction errors (SDEP) J. Chemom.. 1992;6:335-346.
- [Google Scholar]
- The DNA replication inhibitor microcin B17 is a forty-three-amino-acid protein containing sixty percent glycine, Proteins: Structure. Function, and Bioinformatics. 1986;1:230-238.
- [Google Scholar]
- Haloemodin as novel antibacterial agent inhibiting DNA gyrase and bacterial topoisomerase I. J. Med. Chem.. 2014;57:3707-3714.
- [Google Scholar]
- The quinolones: decades of development and use. J. Antimicrob. Chemother.. 2003;51:13-20.
- [Google Scholar]
- Gaussian 09. Wallingford, CT, USA: Gaussian Inc; 2009.
- Iterative partial equalization of orbital electronegativity—a rapid access to atomic charges - ScienceDirect. Tetrahedron. 1980;36:3219-3228.
- [Google Scholar]
- DNA gyrase: an enzyme that introduces superhelical turns into DNA. Proc. Natl. Acad. Sci.. 1976;73:3872-3876.
- [Google Scholar]
- New 1, 4-dihydro [1, 8] naphthyridine derivatives as DNA gyrase inhibitors. Bioorg. Med. Chem. Lett.. 2017;27:1162-1168.
- [Google Scholar]
- Green tea catechins inhibit bacterial DNA gyrase by interaction with its ATP binding site. J. Med. Chem.. 2007;50:264-271.
- [Google Scholar]
- Parametrized models of aqueous free energies of solvation based on pairwise descreening of solute atomic charges from a dielectric medium. J Phys Chem-Us. 1996;100:19824-19839.
- [Google Scholar]
- Theory of hydrophobic bonding. II. Correlation of hydrocarbon solubility in water with solvent cavity surface area. J. Physical Chemistry. 1972;76:2754-2759.
- [Google Scholar]
- Comparative molecular field analysis (CoMFA) model using a large diverse set of natural, synthetic and environmental chemicals for binding to the androgen receptor. SAR QSAR Environ. Res.. 2003;14:373-388.
- [Google Scholar]
- Computational analysis and prediction of the binding motif and protein interacting partners of the Abl SH3 domain. PLoS Comput. Biol.. 2006;2:e1
- [Google Scholar]
- Comparison of simple potential functions for simulating liquid water. J. Chem. Phys.. 1983;79:926-935.
- [Google Scholar]
- The DNA gyrase-quinolone complex: ATP hydrolysis and the mechanism of DNA cleavage. J. Biol. Chem.. 1998;273:22615-22626.
- [Google Scholar]
- New structural templates for clinically validated and novel targets in antimicrobial drug research and development. How to Overcome the Antibiotic Crisis, DO. 2016;I:365-417.
- [Google Scholar]
- Molecular similarity indices in a comparative analysis (CoMSIA) of drug molecules to correlate and predict their biological activity. J. Med. Chem.. 1994;37:4130-4146.
- [Google Scholar]
- Calculating structures and free energies of complex molecules: combining molecular mechanics and continuum models. Acc. Chem. Res.. 2000;33:889-897.
- [Google Scholar]
- The weighted histogram analysis method for free-energy calculations on biomolecules. I. The method. J. Comput. Chem.. 1992;13:1011-1021.
- [Google Scholar]
- Combined 3D-QSAR, molecular docking and molecular dynamics study on thyroid hormone activity of hydroxylated polybrominated diphenyl ethers to thyroid receptors β. Toxicol. Appl. Pharmacol.. 2012;265:300-307.
- [Google Scholar]
- Structures of kibdelomycin bound to Staphylococcus aureus GyrB and ParE showed a novel U-shaped binding mode. ACS Chem. Biol.. 2014;9:2023-2031.
- [Google Scholar]
- CoMFA and CoMSIA studies on HIV-1 attachment inhibitors. Eur. J. Med. Chem.. 2010;45:1792-1798.
- [Google Scholar]
- ff14SB: Improving the Accuracy of Protein Side Chain and Backbone Parameters from ff99SB. J. Chem. Theory Comput.. 2015;11:3696-3713.
- [Google Scholar]
- A kinetic model of trp-cage folding from multiple biased molecular dynamics simulations. PLoS Comput. Biol.. 2009;5:e1000452
- [Google Scholar]
- B.R. Miller III, T.D. McGee Jr, J.M. Swails, N. Homeyer, H. Gohlke, A.E. Roitberg, MMPBSA. py: an efficient program for end-state free energy calculations, Journal of chemical theory and computation, 8 (2012) 3314-3321.
- Automated docking using a Lamarckian genetic algorithm and an empirical binding free energy function. J. Comput. Chem.. 1998;19:1639-1662.
- [Google Scholar]
- N-Benzyl-3-sulfonamidopyrrolidines as novel inhibitors of cell division in E. coli. Bioorg. Med. Chem. Lett.. 2007;17:6651-6655.
- [Google Scholar]
- Prevention of drug access to bacterial targets: permeability barriers and active efflux. Science. 1994;264:382-388.
- [Google Scholar]
- Modification of the generalized Born model suitable for macromolecules. J. Phys. Chem. B. 2000;104:3712-3720.
- [Google Scholar]
- Interaction of the plasmid-encoded quinolone resistance protein QnrB19 with Salmonella Typhimurium DNA gyrase. J. Infection Chemotherapy. 2020;26:1139-1145.
- [Google Scholar]
- Identification of chebulinic acid as potent natural inhibitor of M. tuberculosis DNA gyrase and molecular insights into its binding mode of action. Comput. Biol. Chem.. 2015;59:37-47.
- [Google Scholar]
- Tryptic fragments of the Escherichia coli DNA gyrase A protein. J. Biol. Chem.. 1989;264:19648-19653.
- [Google Scholar]
- The C-terminal domain of the Escherichia coli DNA gyrase A subunit is a DNA-binding protein. Nucleic Acids Res.. 1991;19:1399-1405.
- [Google Scholar]
- An informed public's views on reducing antibiotic overuse. Health Serv. Res.. 2019;54:1283.
- [Google Scholar]
- Numerical integration of the cartesian equations of motion of a system with constraints: molecular dynamics of n-alkanes. J. Comput. Phys.. 1977;23:327-341.
- [Google Scholar]
- Accurate calculation of hydration free energies using macroscopic solvent models. J. Physical Chemistry. 1994;98:1978-1988.
- [Google Scholar]
- Ab initio calculation of vibrational absorption and circular dichroism spectra using density functional force fields. J. Phys. Chemistry. 1994;98:11623-11627.
- [Google Scholar]
- Prospects for developing new antibacterials targeting bacterial type IIA topoisomerases. Curr. Top. Med. Chem.. 2014;14:130-151.
- [Google Scholar]
- The importance of being earnest: validation is the absolute essential for successful application and interpretation of QSPR models. QSAR Comb. Sci.. 2003;22:69-77.
- [Google Scholar]
- Flavone-based analogues inspired by the natural product simocyclinone D8 as DNA gyrase inhibitors. Bioorg. Med. Chem. Lett.. 2013;23:5874-5877.
- [Google Scholar]
- Design and development of novel antibiotics based on FtsZ inhibition–in silico studies. New J. Chem.. 2018;42:10976-10982.
- [Google Scholar]
- Use of MM-PBSA in reproducing the binding free energies to HIV-1 RT of TIBO derivatives and predicting the binding mode to HIV-1 RT of efavirenz by docking and MM-PBSA. J. Am. Chem. Soc.. 2001;123:5221-5230.
- [Google Scholar]
- Development and testing of a general amber force field. J. Comput. Chem.. 2004;25:1157-1174.
- [Google Scholar]
- Automatic atom type and bond type perception in molecular mechanical calculations. J. Mol. Graph. Model.. 2006;25:247-260.
- [Google Scholar]
- A new force field for molecular mechanical simulation of nucleic acids and proteins. J. Am. Chem. Soc.. 1984;106:765-784.
- [Google Scholar]
- Approximate atomic surfaces from linear combinations of pairwise overlaps: LCPO. J. Comput. Chem.. 1999;20:217-230.
- [Google Scholar]
- S. Wold, A. Ruhe, H. Wold, I. Dunn, W. J., The Collinearity Problem in Linear Regression. The Partial Least Squares (PLS) Approach to Generalized Inverses, Siam Journal on Scientific & Statistical Computing, 5 (1984) 735-743.
- I. Wolfram Research, Mathematica, Wolfram Research, Inc., Champaign, Illinois, 2018.
- N-thiadiazole-4-hydroxy-2-quinolone-3-carboxamides bearing heteroaromatic rings as novel antibacterial agents: Design, synthesis, biological evaluation and target identification. Eur. J. Med. Chem.. 2020;188:112022
- [Google Scholar]
- Vibrio cholerae ParE2 poisons DNA gyrase via a mechanism distinct from other gyrase inhibitors. J. Biol. Chem.. 2010;285:40397-40408.
- [Google Scholar]
- Pyridine-3-carboxamide-6-yl-ureas as novel inhibitors of bacterial DNA gyrase: structure based design, synthesis, SAR and antimicrobial activity. Eur. J. Med. Chem.. 2014;86:31-38.
- [Google Scholar]
- Docking and 3D-QSAR studies of 7-hydroxycoumarin derivatives as CK2 inhibitors. Eur. J. Med. Chem.. 2010;45:292-297.
- [Google Scholar]
Appendix A
Supplementary data
Supplementary data to this article can be found online at https://doi.org/10.1016/j.arabjc.2022.103872.
Appendix A
Supplementary data
The following are the Supplementary data to this article:Supplementary data 1
Supplementary data 1


