

Studies on the mixed ligand complexes of copper(II) involving a sulfa drug and some potentially bi or tridentate ligands under physiological conditions
*Corresponding author. Tel.: +91 462 2333887; fax: +91 462 23334363 msnairchem@rediffmail.com (M. Sivasankaran Nair)
-
Received: ,
Accepted: ,
This article was originally published by Elsevier and was migrated to Scientific Scholar after the change of Publisher.
Available online 30 December 2010

Peer review under responsibility of King Saud University.
Abstract
The stability constants of mixed ligand complexes formed in the Cu(II)-sulfathiazole(stz)(A)-glycine(gly), dl-2-aminobutanoic acid(2aba), dl-3-aminobutanoic acid(3aba), 1,2-diaminopropane(dp), 1,3-diaminopropane(tp), dl-2,3-diaminopropanoic acid(dapa), dl-2,4-diaminobutanoic acid(daba), dl-2,5-diaminopentanoic acid(ornithine, orn)(B) systems have been determined pH-metrically at 37 °C and I = 0.15 mol dm−3 (NaClO4) using SCOGS program. Analysis of experimental data indicates the presence of CuABH, CuAB, CuAB2H2 or CuAB2 species. The Δlog K values demonstrate higher stabilities for the mixed ligand complexes compared to the binary analogues. The CuAB complexes with B = gly, 2aba, dapa & orn systems were isolated and characterized using micro analytical, magnetic moment, ESR, electrochemical studies, TG/DTA, power XRD and SEM analysis. Magnetic susceptibility and electronic spectral studies suggest square planar geometry for the CuAB complexes. The g values indicate that the unpaired electron lies in the
Keywords
Sulfathiazole
Stability constants
Powder XRD
SEM
ESR
Cyclic voltagram
Microbial activity

1 Introduction
Metal complexes of sulfa drugs play a vital role in metabolic and toxicological functions in biological systems (Anacona et al., 2009; Azza Abu-Husse et al., 2009). The studies on metal sulfanilamide compounds have received much attention due to the fact that sulfanilamides were the first effective chemotherapeutic agents to be employed for the prevention and cure of bacterial infections in humans (Chohan et al., 2004; Anacona et al., 2002; Alvarez et al., 2004). The sulfanilamides exert their antibacterial action by the competitive inhibition of the enzyme dihydropterase synthetase towards the substrate p-amino benzoate (Mukta et al., 2003). Several authors have reported the antimicrobial activity of sulfanilamides and their metal complexes (Plateeuw, 2006; Christiane et al., 2005; Anacona and Patino, 2009). With a view to throw more light upon the interaction of the sulfa drug with the transition metal ions, a systematic study on the interaction of Cu(II) with the commonly used sulfa drug viz. sulfathiazole(stz)(A) in the presence of glycine(gly), dl-2-aminobutanoic acid(2aba), dl-3-aminobutanoic acid(3aba), 1,2-diaminopropane(dp) 1,3-diaminopropane(tp), dl-2,3-diaminopropanoic acid(dapa), dl-2,4-diaminobutanoic acid(daba), and dl-2,5-diaminopentanoic acid (ornithine)(orn)(B) (Fig. 1) has been undertaken in the solution state. The 1:1:1 Cu(II)-stz(A)-gly, 2aba, dapa & orn(B) complexes have been synthesized and characterized using micro analytical, conductance, magnetic susceptibility, electronic and vibrational spectral analysis. The ESR, TG and DTA, powder XRD, SEM and electrochemical studies of Cu(II)-stz(A)-gly & orn(B) complexes have also been carried out. The biological activity of all these complexes were tested against bacteria Salmonella typhi, yeast Saccharomyces cerevisae and fungi Lapsiodiplodia theobrome and Fusarium oxysporum using DMF as control. The DNA cleavage activities of these complexes were tested against CT DNA using gel electrophoresis in the presence of H2O2.
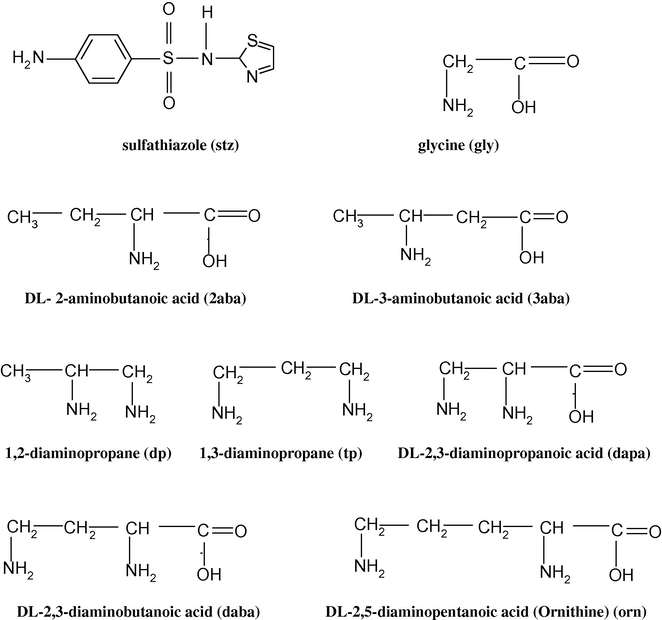
- Structure of ligands.
2 Experimental
2.1 Materials and physical measurements
All the ligands used were extra pure Sigma products. Double distilled conductivity water was used for the preparation of all solutions. The pH titrations were carried out at 37 °C and I = 0.15 mol dm−3 (NaClO4) under nitrogen with a digital pH meter with glass and calomel combined electrode assembly as described earlier (Irving et al., 1967; Nair et al., 1999; Nair et al., 1982; Nair and Santappa, 1981). Titrations on the mixed ligand complex systems were done on 50 ml portions of solutions containing low concentrations (0.002 & 0.0025 M) of Cu(ClO4)2, stz (A) and ligand (B) in 1:1:1 and 1:1:2 ratios with known volumes of standard CO2− free NaOH. The auxiliary data in all the binary systems have been taken from the literature (Nair and Regupathy, 2010; Nair et al., 1980, 1997). The pH profiles obtained for the mixed ligand complex systems were processed using SCOGS computer program (Sayce, 1968; Sayce and Sharma, 1972) and the results are given in Tables 1 and 2.
| Parameters | Ligand B | ||||||||
|---|---|---|---|---|---|---|---|---|---|
| stz*a | glyb | 2abac | 3abac | dpc | tpc | dapac | dabac | ornc | |
| log βHB | 7.17(3) | 9.45(2) | 9.43(1) | 9.95(1) | 9.87(9) | 9.99(8) | 9.37(2) | 9.93(2) | 10.22(1) |
|
|
9.23(8) | 12.10(4) | 11.54(1) | 13.30(1) | 17.01(9) | 18.31(9) | 15.97(3) | 18.02(4) | 18.85(2) |
|
|
– | – | – | – | – | – | 17.37(5) | 19.88(6) | 20.99(4) |
| log βCuBH | – | – | – | – | – | – | 15.37(4) | 16.99(3) | 17.67(2) |
| log βCuB | 4.67(9) | 8.45(4) | 8.10(2) | 7.16(2) | 10.45(3) | 9.47(8) | 10.61(4) | 10.94(3) | – |
|
|
– | – | – | – | – | 30.16(5) | 32.92(4) | 34.32(3) | |
|
|
– | – | – | – | – | 22.12(9) | 25.32(6) | 26.89(4) | 26.12(6) |
|
|
8.69(9) | 15.54(5) | 15.13(9) | 12.90(4) | 19.33(5) | 16.92(9) | 20.18(5) | 19.15(9) | – |
| Parameters | Ligand B | |||||||
|---|---|---|---|---|---|---|---|---|
| gly | 2aba | 3aba | dp | tp | dapa | daba | orn | |
| log βCuABH | – | – | – | – | – | 20.55(8) | 22.19(12) | 22.85(8) |
| log βCuAB | 13.57(9) | 13.11(9) | 12.19(9) | 15.38(8) | 14.36(8) | 15.65(8) | 16.04(9) | – |
|
|
– | – | – | – | – | 34.98(9) | 37.70(9) | 39.12(8) |
|
|
20.50(8) | 19.98(9) | – | 24.12(9) | 21.68(9) | – | – | – |
|
|
– | – | – | – | – | 4.90 | 6.15 | – |
|
|
– | – | – | – | – | 4.82 | 4.78 | 4.80 |
|
|
8.90 | 8.44 | 7.52 | 10.71 | 9.69 | 10.98 | 11.37 | – |
|
|
5.12 | 5.01 | 5.03 | 4.93 | 4.89 | 5.04 | 5.10 | – |
|
|
– | – | – | – | – | 5.28 | 5.20 | 5.18 |
|
|
6.93 | 6.87 | – | 8.74 | 7.32 | – | – | – |
| Δlog KCuABH | – | – | – | – | – | 0.61 | 0.53 | 0.51 |
| Δlog KCuAB | 0.45 | 0.34 | 0.36 | 0.26 | 0.22 | 0.37 | 0.43 | – |
|
|
– | – | – | – | – | 0.15 | 0.11 | 0.11 |
|
|
0.29 | 0.18 | – | 0.12 | 0.11 | – | – | – |
2.2 Preparation of complexes
The CuAB complexes in Cu(II)-stz(A)-gly, 2aba, dapa and orn(B) systems were prepared by mixing 5 mmol of copper acetate in 20 ml of water, 5 mmol of stz in 20 ml aqueous ethanol and 5 mmol each of gly/2aba/dapa/orn in 20 ml water. The pH of the reaction mixture was maintained at 6.0 by adding few drops of 0.002 M NaOH. The contents were kept in a water bath maintained at 60 °C with constant stirring. The precipitated solid complexes were filtered, washed with water and ether. It was further recrystallised using ethanol and the products were dried in vacuum over fused calcium chloride.
The microanalysis was performed using Heraeus micro analyzer. Magnetic susceptibility measurements were carried out using the Gouy balance at 304 K using mercury tetra(thiocyanato)cobaltate(II) as a calibrant. Conductivity measurements were carried out at room temperature on freshly prepared 10−3 M DMSO solution using Systronics 305 conductivity meter. The electronic spectra of the complexes were recorded on Perkin–Elmer 402 spectrometer. The IR spectra of the samples were recorded on a Perkin–Elmer 783 spectrometer as KBr discs. The ESR spectrum of the complexes was recorded in DMSO on Varian ESR spectrometer. Powder XRD was performed using Shimadzu XD-3 diffractometer. SEM measurements were carried out using JSM-5610 scanning electron microscope. TGA and DTA were recorded on Perkin–Elmer 7 series thermal analyzer equipped with Pyres software under a dynamic flow of nitrogen (10 l/min) and heating rate of 10 °C/min from ambient temperature to 700 °C. Cyclic voltammetric data of the complexes in MeCN were collected using BAS C.V 50 electrochemical analyzer. The three-electrode cell contains a reference Ag/AgCl electrode, Pt wire auxiliary electrode and glassy carbon working electrode. [Me4N]ClO4 was used as supporting electrolyte and all the potentials are referred to Ag/AgCl.
The in vitro growth inhibitory activity of the Cu(II)-stz(A)-gly, 2aba, dapa and orn(B) complexes were tested against bacteria S. typhi, yeast S. cerevisae by agar diffusion method (Pelczar et al., 1998) and fungi L. theobrome and F. oxysporum by potato dextrose agar method (Pelczar et al., 1998) using agar as the nutrient. The standard drug ampicillin dissolved in DMF, which acts as a control was also tested at the same concentration under conditions similar to that of the complexes. The liquid medium containing the bacterial subcultures were auto claved for 20 min at 121 °C at 15 lb pressure before incubation. The bacteria were incubated in Nutrient Broth at 37 °C for 24 h, and the fungi and yeast were incubated in Sabouraud Dextrose Broth (SDB) at 25 °C for 48 h. The bacteria, fungi and yeast were injected into petri dishes (100 × 70 mm) in the amount of 0.01 cm3, 15 ml of potato dextrose agar were homogenously distributed onto the sterilized petri dishes. All the complexes were injected into empty sterilized antibiotic discs having the diameter of 6 mm in the amount of 30 ml. The complexes were dissolved in DMF to a final concentration of 2000 ppm and soaked in filter paper. The petri dishes were kept at 4 °C for 2 h, plates inoculated with fungi and yeast was incubated at 25 °C for 24 h. The width of the growth inhibition zone around the disc was measured after 24 h incubation and the activity of each treatment was made in duplicate.
The cleavage of CT DNA by the Cu(II)-stz(A)-gly, 2aba, dapa and orn(B) complexes were determined by agarose gel electrophoresis experiments by incubation of the samples containing CT DNA and H2O2 in Tris–HCl/NaCl buffer at 37 °C for 2 h. After incubation, the samples were electrophoresed for 2 h at 50 V on 1% agarose gel using tris-acetic acid-EDTA buffer. The gel was then stained using ethidium bromide and photographed under ultraviolet light at 360 nm.
3 Results and discussion
3.1 Mixed ligand complex equilibria
The Cu(II)-stz(A)-gly, 2aba, dp and tp(B) systems showed the presence of CuAB and CuAB2 species, while in the Cu(II)-stz(A)-3aba, dapa and daba(B) systems CuABH and CuAB species were detected. The Cu(II)-stz(A)-orn(B) system showed the presence of CuABH and CuAB2H2 species.
3.2 Structure and stability of CuAB, CuABH, CuAB2 and CuAB2H2
The
The CuABH and CuAB2H2 species were identified in Cu(II)-stz(A)-dapa, daba and orn(B) systems. No protonated binary species has been detected in the Cu(II)-stz(A) binary system. The
3.3 Species distribution diagram
The species distribution diagrams for all the systems under investigation have been obtained for different metal to ligand A and B ratio solutions. The CuABH species have been found to be in maximum concentration in the pH range of 4.5–5.5 and accounted for ∼50% of total metal ion. The CuAB2H2 species in Cu(II)-stz(A)- dapa, daba and orn (B) were found to be present in the pH region of 4–6 and accounted for upto 15% of the total metal ion. As the pH increases the CuAB species has been found to be generally favored and accounted for ∼70% of the metal ion in 1:1:1 system. The CuAB2 species in gly/2aba/dp/tp (B) systems has been found to be favored above pH 6.0 and accounted for 20% of the total metal ion in 1:2:2 systems. In order to show the qualitative trends found in the species distribution diagrams, the plot obtained in the Cu (II)-stz(A)-daba(B) system is given in the Fig. 2
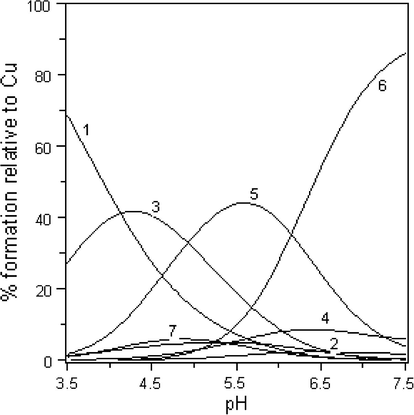
- Species distribution diagram of Cu(II)-stz(A)-daba(B) complex system in 1:1:1 solution. (1) Free Cu(II). (2) CuA. (3) CuBH. (4) CuB. (5) CuABH. (6) CuAB. (7) CuAB2H2 (curves for CuA2, CuB2 and CuB2H2 could not be drawn due to their very low concentrations).
3.4 Solid state studies
All the complexes prepared are insoluble in water and common non polar solvents like benzene and ether. They are soluble in methanol, ethanol, dimethyl sulphoxide and acetonitrile. The color, melting point, elemental analytical data, magnetic susceptibility data and molar conductance of the complexes are given in the Table 3. Elemental analysis data are consistent with the formulations of CuAB in the Cu (II)-stz(A)-gly,2aba,dapa and orn (B) systems. This is reasonable, because the species distribution diagrams in all these systems demonstrate that CuAB species is predominantly formed at around the pH 6.0. The molar conductance of the complexes in DMSO for ≈10−3 M solutions at room temperature is low which indicates the non electrolytic nature of the complexes. The μeff values for the Cu(II)-stz(A)-gly,2aba,dapa and orn(B) complexes fall in the range 1.78–1.82 BM, which are characteristic of d9 Cu(II) complexes (Figgis, 1965). The magnetic moment values observed indicate that they are monomeric and paramagnetic.
| Species | Color | Empirical Formula | Yield (%) | Found (calcd.) % | μeff (B.M.) |
|
Melting point (°C) | |||
|---|---|---|---|---|---|---|---|---|---|---|
| C | H | N | M | |||||||
| Cu(II)-stz(A) –gly(B) | Purple | CuC11H12N4S2O4 | 72 | 33.58 (33.71) |
2.98 (3.06) |
14.15 (14.30) |
16.08 (16.21) |
1.76 | 0.78 | 225–227 |
| Cu(II)-stz(A) –2aba(B) | Purple | CuC13H16N4S2O4 | 74 | 37.62 (37.81) |
3.72 (3.81) |
13.08 (13.34) |
14.98 (15.13) |
1.75 | 0.85 | 232–235 |
| Cu(II)-stz(A) –dapa(B) | Pale Purple | CuC12H16N5S2O4 | 78 | 34.04 (34.16) |
3.69 (3.79) |
16.46 (16.60) |
14.96 (15.06) |
1.78 | 0.96 | 238–241 |
| Cu(II)-stz(A) –orn(B) | Purple | CuC14H20N5S2O4 | 76 | 37.12 (37.37) |
4.31 (4.49) |
15.42 (15.57) |
13.96 (14.12) |
1.82 | 0.88 | 244–247 |
3.4.1 IR spectra of complexes
The ligand stz(A) shows bands at 1360 and 1170 cm−1, which are characteristics of asymmetric and symmetric vibrations of sulphonyl group (Nakamoto, 1986). These bands are shifted to 1328 and 1135 cm−1 in the CuAB complexes indicating the coordination of oxygen atom of sulphonyl group to Cu (II) in the complex. Again, the ligand stz shows an absorption band in the region of 1600, 1020, 927 and 874 cm−1 characteristic of the thiozolidine ring. They are shifted to 1570, 1028, 925 and 870 cm−1 indicating that nitrogen atom of the thiazolidene ring (Nakamoto, 1986) is involved in coordination with the metal ion in CuAB complexes. The bands at 1595 and 1316 cm−1 for the CuAB respectively with B = gly & 2aba are typical for the asymmetric and symmetric vibrations of the coordinated carboxylato group of the amino acid. The difference between these two frequencies is ∼280 cm−1 indicating the monodentate binding of carboxylato group (Ragot et al., 2002). The ligand dapa/orn(B) shows absorption bands in the region of 1320 and 1565 cm−1. These are the characteristic of carboxylic acid group of the ligands (Nakamoto, 1986; Ragot et al., 2002). They remain unaltered in the CuAB complexes in Cu(II)-stz(A)-dapa & orn(B) systems suggesting the non-involvement of carboxylic acid group in coordination. However, in the solution state the results indicate that the dapa (B) ligand binds the metal in tridentate manner in the CuAB complexes, probably in a very weak mode. The CuAB complexes with B = gly, 2aba, dapa & orn show a broad band at 3285, 3280, 3270 and 3260 cm−1, indicating the involvement of an amino group in coordination with the metal ion (Nakamoto, 1986; Sonmez and Sekerci, 2004). In the low frequency region, the band observed in all the mixed ligand complexes in the 438–410 cm−1 region is attributed to (Cu–N) and in the 505–516 cm−1 region to (Cu–O) stretches (Abd El.Fatah Ouf et al., 2010; Shebi, 2009).
3.4.2 Electronic absorption spectra
The electronic absorption spectra of the CuAB complexes in the Cu(II)-stz(A)- gly, 2aba, dapa & orn(B) systems were recorded at 300 K using DMSO as solvent. The absorption region assignment and geometry of mixed ligand complexes are given in Table 4. The complexes display a broad band in 565–590 nm region for the electronic transition 2B1g → 2A1g favoring square planar geometry (Dunn, 1960; Lever, 1971). The probable structures for the CuAB species in the Cu(II)-stz(A)-gly/dapa(B) systems based on the magnetic, IR and electronic data in the solid state are given in Fig. 3.
| Systems |
|
Band assignments | Geometry |
|---|---|---|---|
| Cu(II)-stz(A)-gly(B) | 586 | 2B1g → 2A1g | Square planar |
| Cu(II)-stz(A)-2aba(B) | 566 | 2B1g → 2A1g | Square planar |
| Cu(II)-stz(A)-dapa(B) | 558 | 2B1g → 2A1g | Square planar |
| Cu(II)-stz(A)-orn(B) | 579 | 2B1g → 2A1g | Square planar |
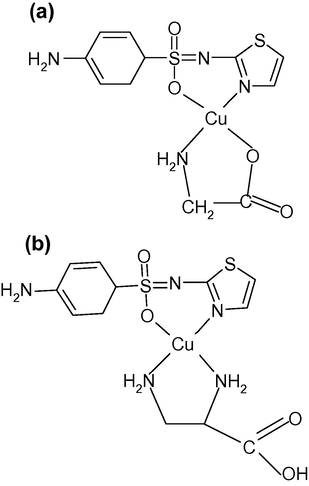
- Proposed structure of CuAB species in (a) Cu(II)-stz(A)-gly(B) and (b) Cu(II)-stz(A)-dapa(B) systems in solid state.
3.4.3 ESR spectra
The X band ESR spectra of the Cu(II)-stz(A)-gly & orn(B) complexes were recorded in DMSO at 300 and 77 K. The spin Hamiltonian parameters calculated are given in Table 5. The spectra of the complexes at 300 K show one intense absorption band in the high field and are isotropic due to the tumbling motion of the molecules. However, four well resolved peaks with low intensities in the low field region and one intense peak in the high field region are observed in the frozen state (Fig. 4). No band corresponding to ms = ±2 transition was observed in the spectra, ruling out any Cu–Cu interaction. The values in Table 5 show that A|| >
| Systems | Hyperfine constant | ||||||||||||
|---|---|---|---|---|---|---|---|---|---|---|---|---|---|
| A|| | A⊥ | Aiso | g|| | g⊥ | giso | α2 | β2 | γ2 | Kll | K⊥ | g||/A|| | G | |
| ×10−4 cm−1 | |||||||||||||
| Cu(II)-stz(A)–gly(B) | 134 | 84 | 104 | 2.28 | 2.07 | 2.02 | 0.75 | 0.93 | 0.96 | 0.69 | 0.72 | 170 | 4.1 |
| Cu(II)-stz(A)–orn(B) | 135 | 95 | 116 | 2.26 | 2.06 | 2.04 | 0.69 | 0.86 | 0.75 | 0.59 | 0.52 | 167 | 4.5 |
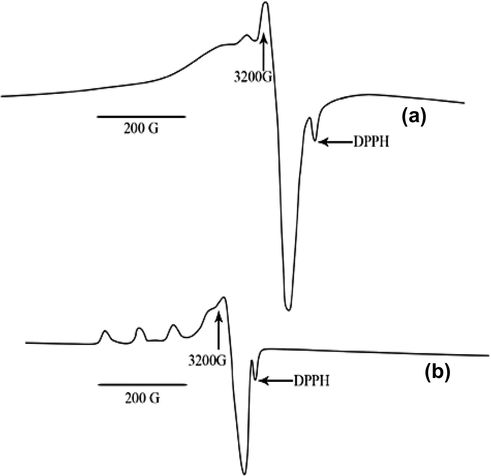
- ESR spectrum of CuAB species in Cu(II)-stz(A)-gly(B) system at (a) 300 K (b) 77 K.
3.4.4 Powder XRD analysis and SEM analysis
The representative diffractogram of Cu(II)-stz(A)-gly(B) and Cu(II)-stz(A)-orn(B) complexes are shown in Fig. 5(a) and (b) and the d-values of the complexes and the ASTM data d-values are listed in Table 6. Powder XRD data (d-values) of these complexes match with the ASTM data d – value. The Cu (II)-stz(A)-gly/orn(B) complexes confirm the presence of copper in α-form. The ASTM data of sulfathiazole matches with the d-values of the complexes, which confirm the presence of sulfathiazole moiety in the complex. Similar observation is noted with the ASTM data d-values in the Cu (II)-stz(A)-gly & orn(B) complexes. It showed the incorporation of gly & orn moiety in the complex. From the figure, it is evident that the strong and broad peak at 2θ = 12.5° and 19.5° confirms the complex formation and the appearance of large feeble peaks indicates that the complex is microcrystalline (Abd et al., 2004). The grain size dXRD of the ternary complexes was calculated using Scherre’s formula (Cullity, 1977). The grain sizes have an average values of 43 and 49 nm, respectively in Cu(II)-stz(A)-gly/orn(B) systems suggesting that the complexes are in nanocrystalline state. The surface morphology of Cu (II)-stz(A)-gly)/orn(B) complexes were studied using SEM and the respective figures are shown in the Fig. 5(a) and (b). The Cu(II)-stz(A)-gly(B) shows a disc-like morphology, while Cu(II)-stz(A)-orn(B) shows monoclinic shaped microcrystalline structure. The particle size of the complexes was in the diameter range of 45 and 50 μm.
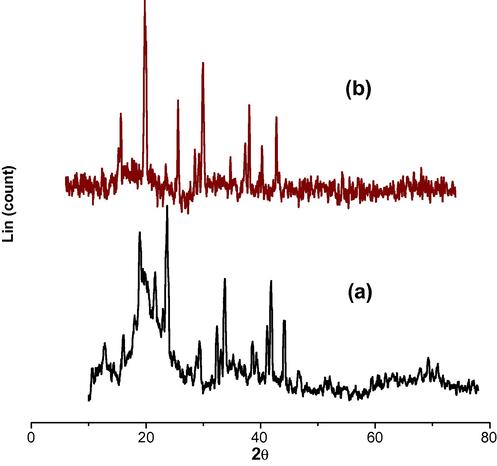
- XRD pattern of CuAB in (a) Cu(II)-stz(A)-gly(B) and (b) Cu(II)-stz(A)-orn(B) systems.
| Systems Exp. Data [d Ao] | ASTM DATA [d A°] | |||||
|---|---|---|---|---|---|---|
| Cu(II)-stz(A)-gly(B) | Cu(II)-stz(A)-orn(B) | Cu-acetate | α-Cu | stz | gly | orn |
| 12.89 | 13.01 | 5.87 | 12.79 | 7.77 | 4.95 | 7.50 |
| 10.33 | 10.38 | 4.28 | 8.63 | 5.80 | 4.43 | 5.60 |
| 8.54 | 8.58 | 3.45 | 4.79 | 5.46 | 4.05 | 4.95 |
| 7.44 | 8.15 | 2.61 | 4.79 | 3.73 | 3.78 | |
| 5.80 | 7.47 | 4.31 | 3.19 | 3.24 | ||
| 5.57 | 5.54 | 4.01 | 2.54 | 3.09 | ||
| 4.89 | 4.93 | |||||
| 4.47 | 4.72 | |||||
| 4.30 | 4.48 | |||||
| 4.05 | 4.31 | |||||
| 3.78 | 4.07 | |||||
| 3.46 | 3.76 | |||||
| 3.18 | 3.19 | |||||
| 3.07 | ||||||
| 2.55 | ||||||
3.4.5 TGA and DTA studies
The thermal studies of the Cu(II)–stz(A)-gly/orn(B) complexes were carried out and the thermatogram of Cu(II)-stz(A)-gly(B) as a representative example is shown in Fig. 6. The results show that the complexes decompose in two steps. These complexes did not show any change upto 250 °C suggesting hydrated and coordinated water molecules are not present in the complex (Abd et al., 2004). The CuAB (B = gly/orn) complexes within the temperature range 425–475 °C undergo decomposition with a mass loss of 19.5% (20.0) and 16.8% (17.3), respectively corresponding to the elimination of gly/orn ligand attached to the metal. In the final step these complexes undergo complete decomposition in the temperature range 500–580 °C with a mass loss of 51.8 % (52.4) and 53.6% (54.5) corresponding to the removal of remaining ligand with the formation of metal oxide (28%) as residue (El-Baradie et al., 1994). The analysis suggests the formation of metal oxide as the end product from which the metal content can be calculated and compared with that obtained from analytical determination.
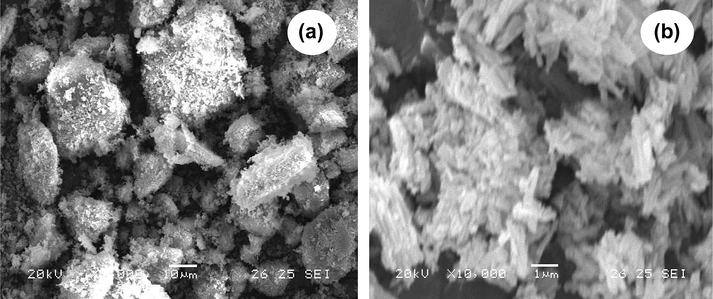
- SEM photograph of CuAB in (a) Cu(II)–stz(A)-gly(B) and (b) Cu(II)–stz(A)-orn(B) systems.
3.4.6 Electrochemical behaviour
The cyclic voltammograms of Cu(II)-stz(A)-gly/orn(B) complexes were recorded in MeCN solution at room temperature in the absence of molecular oxygen in the potential range of 1.2–1.6 V. The scan rate used was 100 mV s−1. The cyclic voltammetric data obtained for these complexes are given in Table 7. The cyclic voltammograms show a well defined quasi reversible redox peak corresponding to the formation of CuII → CuIII at Epa = 0.88 V and the associated cathodic peak for CuIII → CuII at Epc = 0.62 V. It exhibits two irreversible peaks characteristics for CuII → CuI (Epc = −0.58 V) and CuI → Cu0 (Epc = −1.06 V). After an initial scan, if the potential is reversed from −1.60 V, a stripping peak was observed and is due to the oxidation of deposited metal Cu to CuII (Roositer and Hamilton, 1986; Jeyasubramanian et al., 1996). The cyclic voltammogram of the complexes Cu(II)-stz(A)-gly(B) and Cu(II)-stz(A)-orn(B) are shown in Fig. 7(a) and (b).
| Systems | Couple | Epc (V) | Epa (V) | Ipc (μA) | Ipa (μA) | Ipc/Ipa |
|---|---|---|---|---|---|---|
| Cu(II)-stz(A)-gly(B) | Cu(II)/Cu(III) | – | 0.88 | – | 11.17 | – |
| Cu(III)/Cu(II) | – | – | 12.08 | – | – | |
| Cu(II)/Cu(I) | 0.62 | – | 11.18 | – | 1.08 | |
| Cu(I)/Cu(0) | −0.58 | – | 11.04 | – | 1.07 | |
| Cu(0)/Cu(II) | −1.06 | −0.16 | – | 10.46 | 1.06 | |
| Cu(II)-stz(A)-orn(B) | Cu(II)/Cu(III) | – | 0.78 | – | 10.90 | – |
| Cu(III)/Cu(II) | 0.52 | – | 12.24 | – | – | |
| Cu(II)/Cu(I) | −0.62 | – | 11.56 | – | 1.12 | |
| Cu(I)/Cu(0) | −1.10 | – | 11.14 | – | 1.10 | |
| Cu(0)/Cu(II) | – | 0.18 | – | 10.48 | 1.06 | |
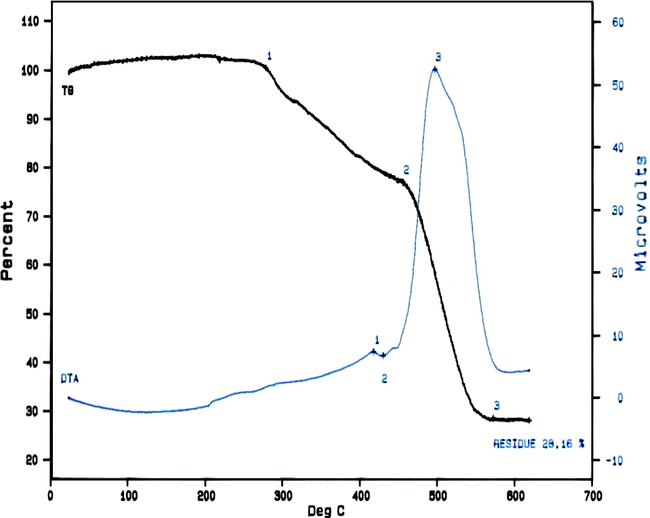
- Thermal analytical curve of CuAB in Cu(II)-stz(A)-gly(B) system.
3.4.7 Antimicrobial studies
The biological activity of the Cu(II)-stz(A) and Cu(II)-stz(A)-gly, 2aba, dapa & orn(B) complexes in vitro were tested against bacteria S. typhi, yeast S. cerevisae by agar diffusion method and fungi L. theobrome and F. oxysporum. The zone of inhibition against the growth of bacteria, yeast and fungi for the mixed ligand complexes are given in Table 8 within the error limit ± 1 mm. The results show that the inhibition zones of mixed ligand complexes are higher than that of the binary complex, ligand and control. The increased activity of mixed ligand complexes compared to that for binary complex, ligand and control can be explained on the basis of chelation theory (Prakash and Patel, 2003). On chelation, the polarity of Cu(II) ion will be reduced to a greater extent due to the overlap of ligand orbital and partial sharing of the positive charge of the Cu(II) ion with donor groups. Further, it increases the delocalization of π-electrons over the whole chelate ring and enhances lipophilicity of the complexes. This increased lipophilicity enhances the penetration of the complexes into lipid membranes and blocking of the metal binding sites in the enzymes of the microorganism. These complexes also disturb the respiration process of the cell and thus block the synthesis of protein that restricts further growth of the organism. Also, the normal cell process may be affected by the formation of hydrogen bond, through the amino group with the active centers of cell constituents (Mishra and Singh, 1997).
| Species | Inhibition zone formation (mm) (±1 mm) | |||
|---|---|---|---|---|
| S. typhi | S. cerevisae | L. theobrome | F. oxysporum | |
| stz | 24 | 21 | 18 | 21 |
| gly | 28 | 19 | 17 | 16 |
| 2aba | 26 | 28 | 16 | 14 |
| dapa | 22 | 26 | 18 | 12 |
| orn | 21 | 22 | 19 | 13 |
| Control (solid ampicillin + DMF) | 55 | 43 | 36 | 39 |
| CuA2 in Cu(II)-stz(A) | 61 | 52 | 42 | 48 |
| CuAB in Cu(II)-stz(A)-gly(B) | 64 | 56 | 49 | 59 |
| CuAB in Cu(II)-stz(A)-2aba(B) | 63 | 54 | 46 | 54 |
| CuAB in Cu(II)-stz(A)-dapa(B) | 65 | 57 | 47 | 53 |
| CuAB in Cu(II)-stz(A)-orn(B) | 68 | 59 | 51 | 62 |
3.4.8 DNA studies
The oxidative CT DNA cleavage activity of Cu(II)-stz(A) and Cu(II)-stz(A)-gly/2aba/orn(B) complexes were studied using gel electrophoresis and the respective photographs are shown in Fig. 8. The cleavage efficiency of the complexes is compared with the control DNA to study the binding ability. The experiment with the control DNA does not show any significant cleavage of CT DNA. From Fig. 8, it is clear that the metal complexes show higher ability to cleave the CT DNA than the control and the mixed ligand complexes show higher ability to cleave the CT DNA than the binary complex. This is due to higher binding ability of mixed ligand complexes with DNA. Further, the presence of smear in the gel diagram indicates the radical cleavage (Zhang and Lippard, 2003) by the abstraction of hydrogen from sugar units of DNA. The metal complexes were able to convert super coiled DNA into open circular DNA (Zhang and Lippard, 2003). The reaction is modulated by the metallocomplexes bound hydroxyl or peroxo radical generated from the oxidant H2O2. (See Fig. 9)
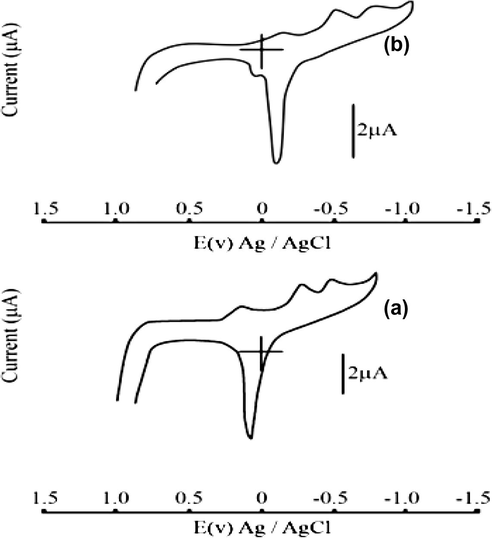
- Cyclic voltamogram of CuAB in (a) Cu(II)-stz(A)-gly(B) and (b) Cu(II)-stz(A)-orn(B) systems.
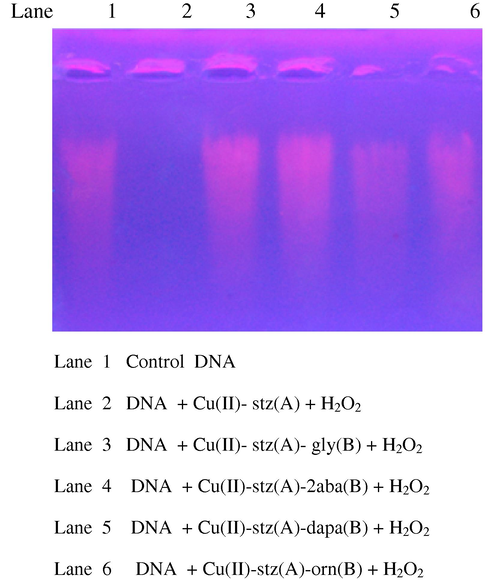
- Changes in the agarose gel electrophoretic pattern of calf-thymus DNA induced by mixed ligand complexes in presence of H2O2. Lane 1 Control DNA. Lane 2 DNA + Cu(II)-stz(A) + H2O2. Lane 3 DNA + Cu(II)-stz(A)-gly(B) + H2O2. Lane 4 DNA + Cu(II)-stz(A)-2aba(B) + H2O2. Lane 5 DNA + Cu(II)-stz(A)-dapa(B) + H2O2. Lane 6 DNA + Cu(II)-stz(A)-orn(B) + H2O2.
4 Conclusion
The present work on the stability of Cu(II) mixed ligand complexes containing a sulfa drug, sulfathiazole (stz) and some amino acids/diamine in solution suggests higher stability for the mixed ligand complexes compared to the binary analogues. The 1:1:1 type mixed ligand complexes were synthesized and characterized using micro analytical and spectroscopic methods. The results suggest square planar geometry for the complexes. The thermal studies show that the complexes are non hydrated and possess high stability. Powder XRD data show that these complexes are micro crystalline with an average grain size of 43 and 49 nm. SEM analysis of these complexes show that the particle size of the complexes was in the diameter range of 45–50 μm. The antimicrobial studies and CT-DNA cleavage analysis show higher activity for the mixed ligand complexes than binary complexes.
Acknowledgements
One of the authors (SR) wishes to express his gratitude to Dr. M.A. Neelakantan, Head, Department of Chemistry, National Engineering College, Kovilpatti, India and to Dr. T.P.D. Rajan, Scientist, NIIST (RRL), CSIR, Thiruvananthapuram, Kerala, India for providing the necessary laboratory facilities and constant support.
References
- J. Mol. Struct.. 2010;973:69.
- J. Serb. Chem. Soc.. 2004;69:225.
- J. Inorg. Biochem.. 2004;98:189.
- J. Coord. Chem.. 2009;62(4):613.
- J. Coord. Chem.. 2009;62(6):951.
- Spectrochim. Acta. 1999;55A:135.
- J. Coord. Chem.. 2009;62(9):1388.
- J. Enzyme Inhib. Med. Chem.. 2004;19:417.
- Cullity B.D., 1977, Elements of X-Ray Diffraction, Addison Wesely.
- J. Am. Chem. Soc.. 1983;105:2287.
- Dunn, T.M., 1960, The Visible and Ultraviolet Spectra of Complex Compounds in Modern Coordination Chemistry, Interscience, New York.
- Ther. Chim. Acta. 1994;246:175.
- Inrog. Chem.. 1965;6:37.
- Coord. Chem. Rev.. 1970;5:1.
- Anal. Chim. Acta. 1967;38:475.
- Trans. Met. Chem.. 1996;20:76.
- Inorganic Electronic Spectroscopy. New York: Elsevier; 1971.
- Ind. J. Chem.. 1997;32A:446.
- J. Ind. Chem. Soc.. 1999;76:288.
- Main Group Meta Chem.. 2003;26:99.
- Ind. J. Chem.. 1997;36A(10):879.
- Nair, M.S., Kalalakshimi, G., Pillai, M.S., 1999,76, 6, 310.
- Ind. J.Chem.. 1980;19A:1106.
- J. Coord. Chem.. 2010;63(2):361.
- J. Chem. Soc., Dalton Trans.. 1981;4:992.
- Infrared and Raman Spectra of Inorganic and Coordination Compounds. New York: Wiley; 1986.
- Microbiology. 1998;5:1998.
- Tropical Med. Int. Health. 2006;11:804.
- J. Ind. Coun. Chem.. 2003;20:21.
- Mat. Sci.. 2002;20:3.
- Physical Methods of Chemistry – Electrochemical Methods, vol. 2. New York: Wiley; 1986.
- Talanta. 1968;15:1397.
- Talanta. 1972;19:831.
- J. Coord. Chem.. 2009;62(19):3217.
- Siegel, H., 1971–1997, Metal Ions in Biological Systems, 1–37, New York.
- Angew. Chem., Int. Ed.. 1975;14:394.
- Met. Org. Chem.. 2004;34(3):485.
- J. Inorg. Nucl. Chem.. 1984;43:3169.
- Curr. Opin. Chem., Biol.. 2003;7:481.


