

Translate this page into:
Study on electrosorption behavior of weak metal cyanide complex ions based on coal-based electrode
⁎Corresponding author. syh1231@126.com (Yonghui Song)
-
Received: ,
Accepted: ,
This article was originally published by Elsevier and was migrated to Scientific Scholar after the change of Publisher.
Abstract
Using the electrosorption technology treatment the cyanide wastewater has a good treatment effect, but the mechanism is not completely clear. In this paper, we conducted electrosorption experiments using simulated cyanide solutions to study the adsorption kinetics, thermodynamics, adsorption isotherms and analyze the reaction mechanism of zinc-cyanide and copper–cyanide complex ions. The results show that the electrosorption process of weak metals cyanide complexes treated by coal-based (CB) electrode conforms to the second-order kinetic model and follow the Langmuir model, affected by the dipole force and exchange of coordination groups. The equilibrium adsorption amounts of the two species at 2 V were 1.53 and 1.74 times higher than those at open circuit, respectively. During the electrosorption process, affected by the pseudo-capacitance, pore structure of CB electrodes and the charges of complex ions, the zinc-cyanide complex is bound in the double electric layer on the anode surface by the electric field, but partly decomposed to produce zinc ions and forms Zn(OH)2 in alkaline solution then generates ZnO precipitates, a small amount of Zn2+ were electrostatically adsorbed on the cathode surface for reduction deposition. However, the majority of the copper–cyanide complexes were purified by electrostatic adsorption to the double layer near the anode, while a small amount of decomposition occurred to produce Cu(OH)2 in the alkaline system, and almost no copper was deposited by reduction. This research results can enable us to better understand the removal characteristics of the weak metal cyanide complex ions in the process of electrosorption by CB electrode, and have great significance for the application of electrosorption technology to the treatment of cyanide wastewater.
Keywords
Zinc-cyanide complex
Copper–cyanide complex
Electrosorption
Adsorption kinetics
Thermodynamics
Adsorption isotherms

1 Introduction
Cyanide was widely used in industries such as precious metal extraction, electroplating and synthetic medicine (Mudder and Botz, 2004), the cyanide wastewater usually contains large amounts of free cyanide and metal cyanide complex ions of copper, zinc and iron, which were complex in composition and great difficult to treat (Li et al., 2016). Copper and zinc were the associated metals of gold and present in large quantities in the leach solution during the cyanidation of gold. The free cyanide and thiocyanate in the leach solution with strong complexation properties, makes a large amount of metal ions in solution to form metal cyanide complexes.
Electrosorption technology, also known as capacitive deionization technology (CDI) or electro-enhanced adsorption technology, is a water treatment technology that has been gradually paid attention and researched in recent years at home and abroad (Kim et al., 2015; Kang et al., 2014; Minhas et al., 2014). Compared with traditional water treatment methods, electrosorption technology has the characteristics of low energy consumption, no secondary pollution, long service life of the electrode and easy to regenerate, etc., is a cost-effective new electrochemical water treatment method (Porada et al., 2013; Oren, 2008; Chen and Hu, 2005). As the society attaches great importance to environmental protection, the development and application of electrosorption technology has always been the focus of researchers. At present, many scientific research institutes and large enterprises were conducting research on the development and industrial application of electrosorption technology (Datar et al., 2021; You et al., 2020; Dai et al., 2018; Ziati and Hazourli, 2019).
Huang et al. (Huang and He, 2013) used sucrose as raw material self-made ordered mesorporous carbon (OMC) electrode, adsorption/ electrosorption of Cu2+ in the solution, the equilibrium adsorption capacity of 56.62 mg/g when the voltage of 0.9 V and pH = 4. The adsorption process can be described by the Langmuir isotherm equation, following the second-order kinetic model. The electroadsorption capacity of the electrode for copper ions in the presence of a chelating agent was subsequently investigated (Huang and Siao, 2018), and the results showed that the addition of the chelating agent helped to enhance the electroadsorption capacity of the OMC electrode for copper ions. XPS analysis of the electrode after the reaction showed that the electrosorption behaviour was a physical adsorption rather than a redox reaction, and the electrode material could be regenerated by cutting off the power supply in situ after the electrosorption.
Dong et al. (Dong et al., 2021) used waste biomass to prepare porous biochar electrode materials for the removal of fluorine from wastewater by electrosorption. The removal rate of F- from synthetic wastewater was 91.98%, and the high specific capacitance, low internal resistance and suitable pore distribution would contribute to the removal of F-.
Jie Huang (Huang et al., 2022) et al. used electrosorption to remove uranium ions from uranium-containing wastewater. Acid doped polypyrrole/carbon felt (PA-PPy/CF) electrode was prepared by electrodeposition, which showed an excellent recycling performance and remarkable selectivity for uranium ions. When the complex of chitosan and phytic acid (CSPA) was used as the electrode material, its maximum adsorption capacity reached 429.1 mg/g. In the presence of competing ions, the electrosorption capacity of CSPA for U(VI) was 68.6% of the total electrosorption capacity. Combined with the experimental and DFT calculations results, it was concluded that the selective adsorption mechanism of uranium ions is related to the internal complexation between UO22+ and the O atoms of the P = O group (Huang et al., 2022).
Song Yonghui (Song et al., 2015; Song et al., 2016; Song et al., 2015) et al. used by chemical precipitation-electrosorption process to treat high concentration cyanide wastewater. Based on coal-based electrodes with the voltage was 2.0 V, the adsorption time was 24 h, and the electrode spacing was 10 mm, the removal rates of Cu, CNT, Zn, Fe and SCN- were 61.55%, 71.14%, 99.52%, 83.28% and 57.59%, respectively. During the reaction process, the presence of electric field does not cause the oxidation–reduction reaction in the system, but cause the ions in solution to migrate in a directional manner, so that the high concentration of iron in the original wastewater will preferentially undergo enrichment and precipitation, producing flocculent precipitation of copper ferrocyanide, zinc hydroxide and a small amount of cuprous thiocyanate near the anode, while copper, iron and zinc enrichment appeared on the anode plate after adsorption. YAO Di et al. (Yao et al., 2017) studied the effect of voltage on the treatment cyanide wastewater with 3D system. The research showed that under the applied voltage of 2 V, the interaction of adsorption, electrosorption, enrichment and precipitation of cyanide and metal ions near the anode were main effect of removal cyanide and heavy metal ions with highly efficient.
Based on the results above, using electrosrption technology for the treatment of heavy metal ions and cyanide wastewater can achieve good results. However, most of the research work is at the laboratory stage and there is still a long way to go before industrial applications. The complex composition of cyanide gold extraction wastewater and the large variation in the content of each component make the treatment process more complex and variable. Current research is less research has been carried out on the mechanism of electrosorption of each cyanide in the solution.
In this paper, the adsorption kinetics, thermodynamics and adsorption isotherms of zinc-cyanide and copper–cyanide complex ions were investigated through a series of electrosorption experiments in a simulated solution system, and the electrosorption behavior and reaction mechanism of metal cyanide complexes in the process of were inferred from the adsorption and detection results. The results of this work can provide us with a better understand of the removal characteristics of metal complex ions in cyanide wastewater during the electrosorption process, which is of great significance for the application of electrosorption technology to the cyanide gold extraction wastewater treatment.
2 Materials and methods
2.1 Materials
The self-made coal-based (CB) electrode material made by the low rank pulverized coal (LFC) and direct coal liquefaction residue (DCLR) were obtained from a coal chemical factory in Yulin, Shaanxi Province. The industrial analysis and elemental analysis of them were shown in the Table 1.
Sample
industrial analysis %
elemental analysis /%
Mt
Aad
Vad
FCad
Cad
Oad
Had
Nad
St,ad
LFC
5.42
14.16
25.74
54.68
79.19
15.27
4.17
0.87
0.50
DCLR
0.14
17.74
33.75
48.37
75.00
17.83
4.22
0.79
2.16
The zinc-cyanide simulated solution was prepared using Zn(CN)2, which is calculated and weighed, then dissolved in a certain concentration of KOH solution, and after complete dissolution, deionised water is added to fix the volume. The copper–cyanide simulated solution was prepared by dissolving a calculated and weighed amount of CuCl2 (s) in a certain amount of KOH solution, adding a calculated and weighed amount of KCN, and after complete dissolution, the solution is fixed using a prepared KOH solution, stored in a brown volumetric flask and stored away from light until use.
Reagents were used of analytical grade and deionized water was used to prepare all solutions.
2.2 Preparation of CB electrode materials
LFC and DCLR were ground and sieved into a particle size range of 180–200 μm and mixed in a mass ratio of 4:1. Under a pressure of 8 MPa to form a briquette of 30 mm diameter and 2 mm thickness. Carbonized for 1.5 h at 800 ℃ under a N2 atmosphere, immersed in 10% HNO3 for 24 h, washed with distilled water until the wash water was neutral, and after air-drying a CB electrode was obtained (Song et al., 2016).
2.3 Characteristics of CB
The pore and surface characteristics of CB electrode material were showed in Table 2. (See Fig. 1)
Characteristics
Value
BET area(m2·g−1)
269.745
Pore volume(cm3·g−1)
0.404
Average pore size (nm)
5.986
Carboxyl group (m mol·g−1)
0.343
Lactonic group (m mol·g−1)
0.191
Phenolic hydroxyl group (m mol·g−1)
0.350
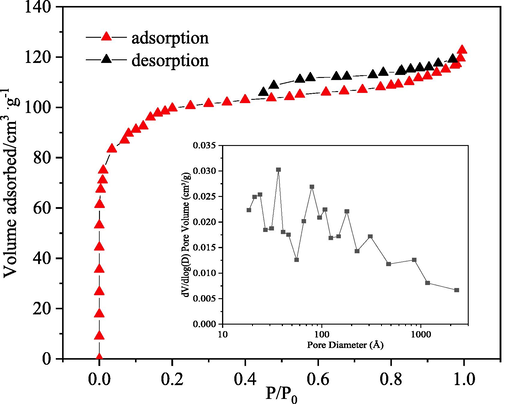
Nitrogen adsorption/ desorption isotherm and pore size distribution of the CB electrode.
The adsorption–desorption nitrogen isotherm (at 77 K) was determined with an automatic sorptiometer (ASAP 2460 Micromeritics) to deduce the BET specific surface area and porosity of the CB electrode material. The surface functional groups containing oxygen were determined by the Boehm titration.
Cyclic voltametric (CV) and Galvanostatic Charge/Discharge (GCD) measurements were performed using an electrochemical analyzer (CS2350, Corrtest, China) with a conventional three- electrode cell. Platinum and Ag/AgCl electrodes were used as the counter and reference electrodes, respectively. As shown in Figs. 2 and 3, it can be seen that the CB materials exhibit a certain pseudo-adsorption (Huang et al., 2017) or pseudo- capacitance behaviors.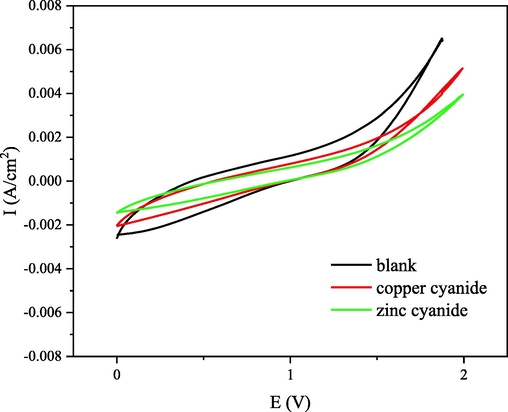
The cyclic voltammetries at scan rate of 20 mV s−1 at the potential window between 0 and 2 V.
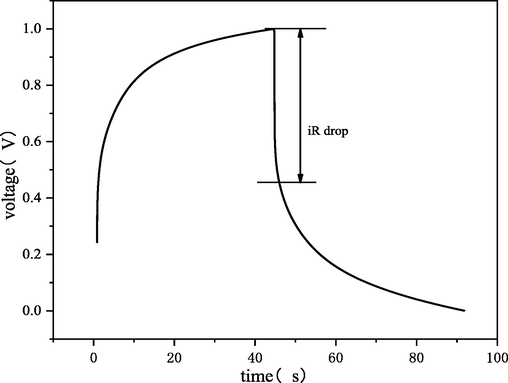
Galvanostatic charge/discharge of CB at 1 mA and electrolyte of Na2SO4 1 g/L.
2.4 Experimental procedure
The electrosorption experiments were carried out in single electrolyte solutions. As shown in Fig. 4, all experiments were performed with a DC power supply (LP230DF, Lodestar, China), a pair of CB electrodes were used as the anode and cathode, the distance between the electrodes was 10 mm. The total solution volume was 50 ml, the change in pH was measured at the initial and ending states by a pH meter (PHS-3C, LEICI, China).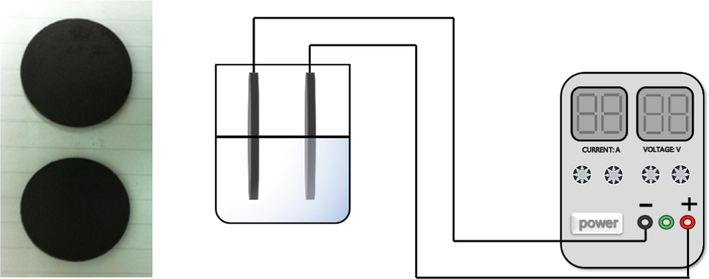
Coal-based electrode and schematic diagram for the electrosorption process.
The concentrations of each metal cations were determined by using atomic absorption spectrometry (AA-6800, SHIMADZU, Japan). SEM (Quanta FEG 250, FEI, U.S.A.) was used to examine the morphology and microstructure. XPS (K-Alpha, Thermo Fisher, U.S.A.) was used to further examine the Cu, and Zn species on the electrodes surface or in precipitation produced.
To study the individual removal of metal cyanide complex ions, prepare different concentrations of copper and zinc cyanide solutions. The removal capacity Q (mg·g−1) of the CB electrode can be calculated as follows:
Where C0 (mg·L-1) and Ce (mg·L-1) represent the concentrations at the initial and ending states of the charging step, respectively. V(L) is the volume of solution and m (g) is the mass of the CB electrode.
2.5 Adsorption/electrosorption kinetics and adsorption isotherms of cyanide complex ions on CB
The kinetics experiments were performed in 50 ml cyanide complex ions solution. Samples of 1 ml were withdrawn at predetermined time intervals and dilution to a certain multiple. The adsorption rate constants were determined from the Lagergren Equation (2–3), which called the first-order and second-order adsorption kinetic equations (Lagergren, 1998):
Where qt (mg·g−1) and qe (mg·g−1) are the amounts of adsorbed at time t (h) and equilibrium adsorption fitted values, respectively. k1 (h−1) is the first-order adsorption rate constants, k2 (g·mg−1·h−1) is the second-order adsorption rate constants.
The internal diffusion velocity constant is obtained using the Weber-Morris model by Eq. (4)
Where C (mg·g−1) is a constant related to the thickness of the boundary layer, KWM (g·mg−1·h−1/2) is the internal diffusion constant. q (mg·g−1) for (h−1/2) that is linear and passes through the origin indicates that the adsorption process is dominated by internal particle diffusion controlling the rate, and deviation from the origin indicates that both external and internal particle diffusion control the reaction rate.
The Langmuir and Freundlich equations were applied to model the measured the adsorption isotherms in this study, there equations were presented as follows:
Where qe (mg·g−1) is the equilibrium adsorption capacity, qmax (mg·g−1) is the maximum adsorption capacity (saturation), Ce (mg·g−1) is the equilibrium concentration of the solution, KL (L·g−1) is the Langmuir constant related to the affinity and adsorption energy of the bonding site, KF is the Freundlich model constant relating the adsorption capacity and strength of adsorption, 1/n is the Freundlich constant. Larger values of KF and n imply better adsorption performance of the adsorbent.
Using the van't Hoff equation to calculated the thermodynamic parameters, as in equation (7–8).
3 Result and discussion
3.1 Factors affecting adsorption kinetics
The applied voltage is the power source of the electrosorption, the initial concentration and the pH of solution affect the form of zinc-cyanide, copper–cyanide complexes. All three being important factors in the effectiveness of the electrosorption treatment effect. Therefore, the effects of voltage, pH and initial concentrations of zinc, copper–cyanide complex on adsorption/electrosorption were investigated by time-based analysis in this section. The adsorption rate constants were obtained by fitting the non-linear least square method of Lagergren adsorption rate equation.
3.1.1 Effect of potential
The effects of different voltages on the adsorption kinetics of zinc-cyanide and copper–cyanide complexes were investigated under different applied voltages. The Fig. 5 shows the relationship between the adsorption amount and time of zinc-cyanide and copper–cyanide. The solid and dashed lines in Fig. 5(a, c) are the results of fitting the kinetic rate equations to the Lagergren first-order and second-order adsorptions, respectively. The fitting parameters are shown in the Table 2, Fig. 5(b, d) are the multilinear fitting curves of the internal diffusion model.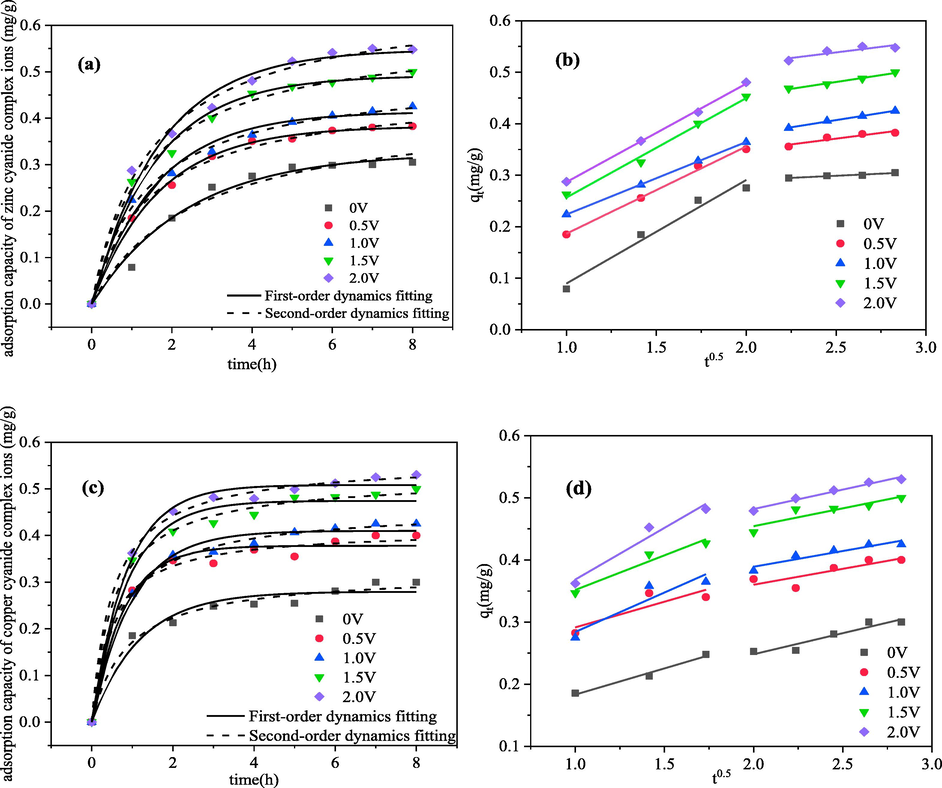
Relationship between adsorption capacity and time of metal cyanide complex ions under different voltages and the fitting graph of kinetic model (The initial concentration of metal ions was 50 mg·L-1, pH = 10, electrosorption for 8 h) (a) pseudo-first-order and pseudo-second-order dynamics of zinc; (b) Weber-Morris model of zinc (c) pseudo-first-order and pseudo-second-order dynamics of copper; (d) Weber-Morris model of copper.
As shown in Fig. 5(a), the amount of zinc cyanide electrosorbed increases gradually with increase voltage, reaching the maximum at 2 V. It can be seen from the fitting curve that a good fit was achieved from both the pseudo-first and pseudo-second kinetic equations for zinc cyanide electrosorption. From the fitting results in the Table 2, it can be concluded that when the pseudo-first-order fits are higher when the applied voltage is lower, which can be explained by the fact that the migration and adsorption of zinc-cyanide ions at low voltages is mainly dependent on the concentration difference, which belongs to purely physical adsorption. As the voltage increases, the pseudo-second-order kinetics fit is progressively better than the fit of the pseudo-first-order equation, indicating that the chemical interaction in the system gradually increases at this time, i.e., chemisorption is the main step to control the adsorption rate at this time, the process involves electron sharing or transfer between zinc-cyanide and CB electrodes (Yang et al., 2018). The higher the applied voltage, the faster the adsorption rate and the greater the adsorption capacity. When the applied voltage was 2 V, the adsorption rate constant for zinc-cyanide increased from 1.45 × 10⁻² g·(mg·h)-1 at open circuit to 2.46 × 10⁻² g·(mg·h)-1 at 2 V, with an equilibrium adsorption capacity was open circuit 1.53 times. The multilinear fitting results based on the internal diffusion model in Fig. 5(b) show that the zinc-cyanide complex electrosorption process is divided into two stages: the steep slope (corresponding to liquid membrane diffusion) indicates a rapid electrosorption process at the onset, which can be attributed to the large specific surface area of the electrode. The slow slope was the second step (corresponding to internal diffusion of particles) indicates that this is a gradual electrosorption process, during this step zinc-cyanide ions diffused into the pores of the CB electrode slowly until the adsorption equilibrium. Both liquid membrane diffusion and internal diffusion were involved in controlling the electrosorption rate of zinc-cyanide.
The results of the fitting of the copper–cyanide complex electrosorption process can be concluded to be more in line with the second kinetic model (as shown in Fig. 5(c)), that chemical adsorption is the main step controlling the rate of copper–cyanide adsorption. The higher the applied voltage, the faster the adsorption rate and the larger the adsorption capacity either. This is also consistent with the research results of HUANG et al. (Huang and He, 2013) on the electrosorption process of Cu2+. The multilinear fitting results showed that the liquid membrane diffusion and the particle diffusion stages of the electrosorption process were not clearly distinguished (Fig. 5 (d)), which indicates that the adsorption of copper–cyanide on the surface of CB materials mainly involved liquid membrane diffusion, especially at low voltage conditions. When the applied voltage was 2 V, the adsorption rate constant of copper–cyanide increased from 3.84 × 10⁻² g·(mg·h)-1 at open circuit to 8.50 × 10⁻² g·(mg·h)-1 at 2 V, and the equilibrium adsorption capacity is open circuit 1.74 times.
3.1.2 Effect of pH
Different pH directly changes the molecular structure of zinc-cyanide and copper–cyanide complexes in solution. Based on the existing conditions of conventional cyanide wastewater, this experiment mainly studies the electrosorption process of metal cyanide complex ions under neutral and alkaline conditions. Fig. 6 shows the relationship between the electrosorption capacity and time of zinc-cyanide and copper–cyanide complex at different initial pH.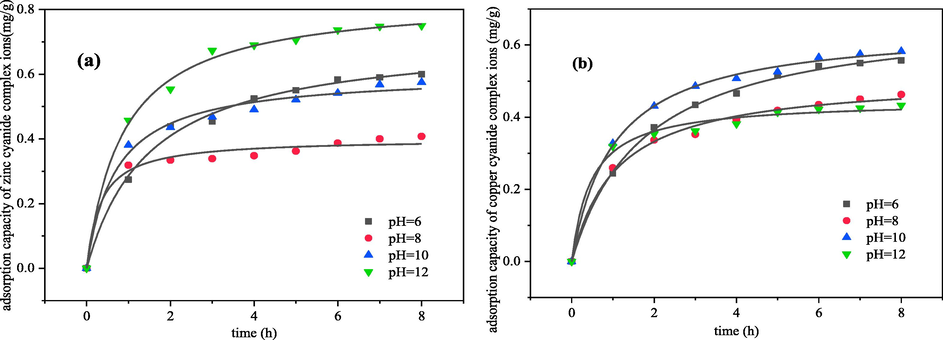
Effect of initial pH on electrosorption kinetics of metal cyanide complex ions (a) zinc; (b) copper (The voltage was 2 V, initial concentration was 50 mg·L-1, electrosorption for 8 h).
As shown in the Fig. 6, the electrosorption capacity of zinc-cyanide increased with the increasing pH. It was analyzed that as the initial pH of the system increased, the content of Zn(CN)2 in the solution gradually decreased and the concentrations of anions complex ions Zn(CN)3- and Zn(CN)42- gradually increased, which would facilitate the electrostatic attraction of the electric field and increase the ions removal rate. The difference is that the electrosorption capacity of copper–cyanide increases and then decreases dramatically with the increasing pH, and has a maximum value at pH = 10. It was analyzed that as the initial pH increased, the content of copper–cyanide complexes in solution changes from Cu(CN)2- to Cu(CN)32–, Cu(CN)32– and Cu(CN)43- gradually. The increase in the charge of the complexes increased the electrostatic attraction effect on the ions at the beginning of the increase in alkalinity of the solution, and at a later stage when pH = 12, the copper–cyanide complex ions in solution were mainly in the form of Cu(CN)43- (Li et al., 2013), which changes the planar structure to the spatial three-dimensional structure, will not be conducive to the aggregation and electrostatic adsorption of ions in the electric double layer. Therefore, the adsorption rate constant shows a trend of increase first and then decrease.
3.1.3 Effect of concentration
The effect of five different initial concentrations on the kinetics of electrosorption was shown in the Fig. 7. This is consistent with conventional adsorption phenomena and can be explained that the concentration gradient within the system increases with increasing initial concentration, resulting in an increase in adsorption content on the electrode surface. On the other hand, the analysis from the nature of metal cyanide complex and its own structure, it can be seen that the concentration of metal cyanide in the system increases with the concentration of ligand (CN–) in the solution, and Zn2+ gradually forms a stable complex Zn(CN)42- with a coordination number of 4 with CN–. While Cu(I) complexes gradually with CN– form complexes Cu(CN)32– and Cu(CN)43- with a coordination number of 3 or 4. The higher charge increases its electrostatic attraction in electric field, and the adsorption capacity of the electric double layer increased with the concentrations of the electrolyte solution. At the same time, a higher number of metal cyanide complex ions in the system can act as electrolytes. As a results, under the action of the electric field, the amount of metals cyanide ions that migrated to the electrode surface per unit time increases.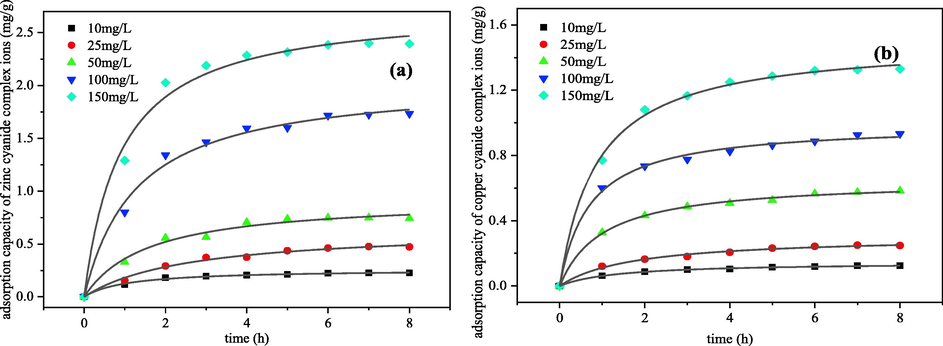
Effect of initial concentration on electrosorption kinetics of metals cyanide complex ions (a) zinc; (b) copper (The voltage was 2 V, pH = 12 of zinc cyanide solution and pH = 10 of copper cyanide solution, electrosorption for 8 h).
3.2 Adsorption isotherms
3.2.1 Electrosorption isotherms at different voltages
The electrosorption of different concentrations of zinc-cyanide and copper–cyanide complexes with CB electrodes, and the results of each experiment were fitted to the Langmuir and Freundlich adsorption isotherm model using the non-linear least squares method to obtain the relevant constants for the corresponding adsorption isotherm equations.
Fig. 8 shows the qe-ce relationship curves and fitting results for the approximate equilibrium of the metal cyanide complexes by the CB electrodes at different voltages, and the fitted parameters for the two isothermal models were shown in Table 3.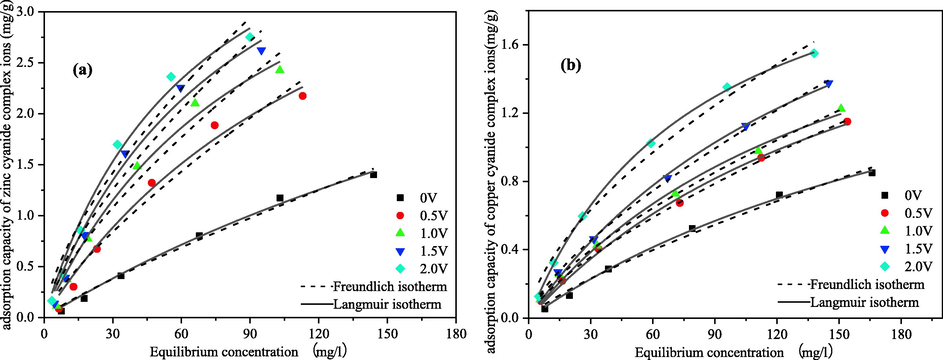
The adsorption/electrosorption isotherms of metals cyanide complex ions at 288 K (a) zinc; (b) copper.
Potential(V)
Zinc cyanide complex
Copper cyanide complex
First-order
Second-order
First-order
Second-order
qe
(mg·g−1)kt × 10-2
(h−1)R2
qe
(mg·g−1)kt*10-2
(g•mg−1•h−1)R2
qe
(mg·g−1)kt*10-2
(h−1)R2
qe
(mg·g−1)kt × 10-2
(g•mg−1•h−1)R2
0
0.3252
0.7033
0.9824
0.4306
1.4510
0.9700
0.2797
1.4097
0.9619
0.3204
3.8352
0.9839
0.5
0.3828
0.9755
0.9971
0.4625
1.7297
0.9968
0.3780
2.0145
0.9795
0.4135
5.6490
0.9902
1.0
0.4141
0.9940
0.9854
0.4948
2.0813
0.9962
0.4100
2.1384
0.9881
0.4588
5.7469
0.9969
1.5
0.4919
1.0153
0.9892
0.5873
2.4386
0.9947
0.4745
2.3593
0.9823
0.5241
5.9801
0.9960
2.0
0.5482
1.0297
0.9863
0.6588
2.4588
0.9945
0.5083
2.8553
0.9922
0.5590
8.5031
0.9979
The experimental results showed that the adsorption of metals cyanide complexes by CB electrodes was significantly enhanced by increasing voltage in range of 0–2 V, and the adsorption amount increased with increasing voltage. The maximum adsorption of zinc-cyanide complex ions increased from 2.12 mg·g−1 at 0 V to 5.14 mg·g−1 at 2.0 V, an increase of 2.42 times. The maximum adsorption of copper–cyanide ions increased from 1.22 mg·g−1 at 0 V to 3.00 mg·g−1 at 2.0 V, an increase of 2.21 times. Which were mainly due to the increase in voltage changing the adsorption pattern of metals cyanide complexes on electrode surface and the increase in electrostatic gravitational force.
From the fitted curves in Fig. 8 and the fitted parameters in Table 4, it can be seen that both adsorption isotherm models have good fitting results for the voltages in the range of 0–2 V, but have higher correlation coefficients for the Langmuir adsorption isotherm equation. This indicates that the zinc-cyanide and copper–cyanide complexes are mainly adsorbed/electrosorbed on the CB material in compact layer as a single molecular layer. The adsorption is easier to carry out and adsorption amount increases with increasing voltage as indicated by the constant n in the Freundlich model.
Potential(V)
Zinc cyanide complex ions
Copper cyanide complex ions
Langmuir
Freundlich
Langmuir
Freundlich
Qmax
(mg·g−1)KL
R2
KF
1/n
R2
Qmax
(mg·g−1)KL
R2
KF
1/n
R2
0
2.1245
0.0027
0.9942
0.02034
0.8602
0.9886
1.2201
0.00383
0.9976
0.01615
0.7826
0.9908
0.5
3.2038
0.00681
0.9832
0.06117
0.7702
0.9653
2.0325
0.00529
0.9972
0.03074
0.7208
0.9990
1.0
4.8856
0.01027
0.9876
0.09593
0.7118
0.9657
2.4880
0.00613
0.9942
0.03750
0.7094
0.9994
1.5
4.9607
0.01185
0.9869
0.1165
0.6992
0.9630
2.6211
0.00603
0.9978
0.04079
0.6943
0.9989
2.0
5.1361
0.01488
0.9898
0.1489
0.6631
0.9646
2.9979
0.01198
0.9996
0.07848
0.6142
0.9845
3.2.2 Free energy, enthalpy, and entropy in the process of electrosorption
The thermodynamic parameters could provide information that elucidated the behavior of adsorption. Using the Langmuir adsorption isotherm model, the equilibrium concentration versus equilibrium adsorption volume curves were plotted to analyses the adsorption isotherm model for the electrosorption of zinc-cyanide and copper–cyanide complexes at different temperatures by CB electrodes, Fig. 9, and the thermodynamic parameters for the electrosorption of cyanide complexes were calculated using the van't Hoff equation.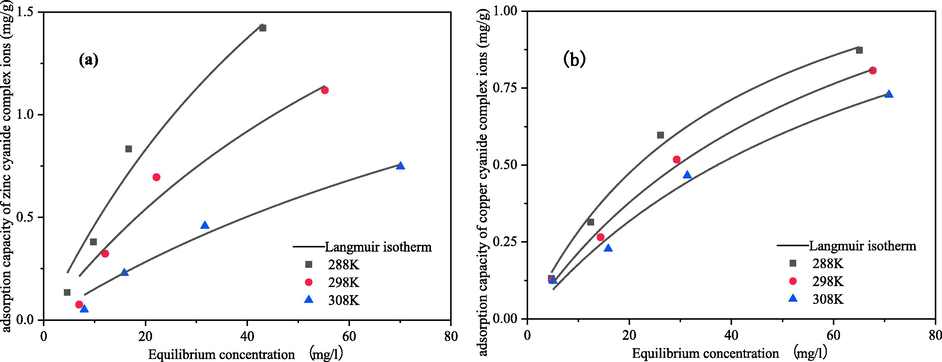
Electrosorption isotherms for cyanide complexes at different temperatures at 2 V (a) zinc; (b) copper.
Fig. 10 shows that the linear fit of lnKL to 1/T during the electrosorption of zinc-cyanide and copper–cyanide complexes. The corresponding thermodynamic parameters were deduced from the slope and intercept of the fitted lines, as shown in Table 5.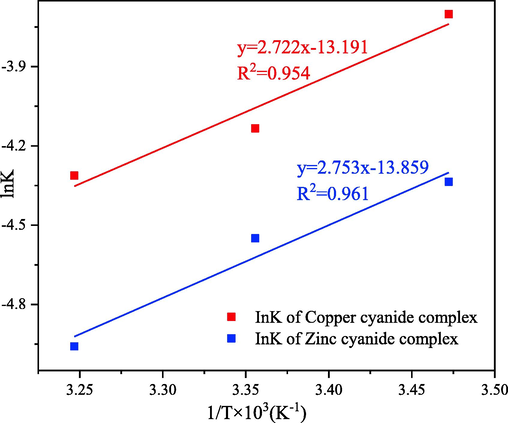
Van’t hoff (lnKL ∼ 1/T) plot for cyanide complexes electrosorption process.
Temperature
(K)Zinc-cyanide complex
Ccopper-cyanide complex
ΔG°
(kJ·mol−1)ΔH°
(kJ·mol−1)ΔS°
(J·mol−1·K−1)ΔG°
(kJ·mol−1)ΔH°
(kJ·mol−1)ΔS°
(J·mol−1·K−1)
288
10.298
–22.8866
−115.227
8.862
–22.632
−109.662
298
11.451
10.242
308
12.698
11.043
The thermodynamic calculations indicate that the electrosorption process of both zinc-cyanide and copper–cyanide complexes are exothermic and entropic. Based on the magnitude of the heat of reaction values, it can be concluded that this reaction process is mainly affected by the interaction of inter-dipole forces and ligand groups.
3.3 Analysis of removal mechanism of metals cyanide complex ions
3.3.1 Analysis of removal mechanism of zinc cyanide complex ions
It has been suggested that the removal of zinc ions by activated carbon based electrosorption is not a simple electrosorption process (electrostatic force) but a process involving Faradaic reactions (Lee et al., 2021). A small amount of white adherence to the cathode after treatment of the zinc-cyanide complex ions at both 0 V and 2 V were found to be very different by SEM, as shown in Fig. 11. It can be seen from the figure that at 0 V, the adhesion is spherical and more uniform on the surface of electrode. Which is analyzed as a combination of the zinc-cyanide complex and the functional groups on the surface of the CB material, as well as a deep complexation reaction between the complexes. At 2 V, the cathode surface was irregularly crystalline, indicating that other redox reactions occurred besides adsorption.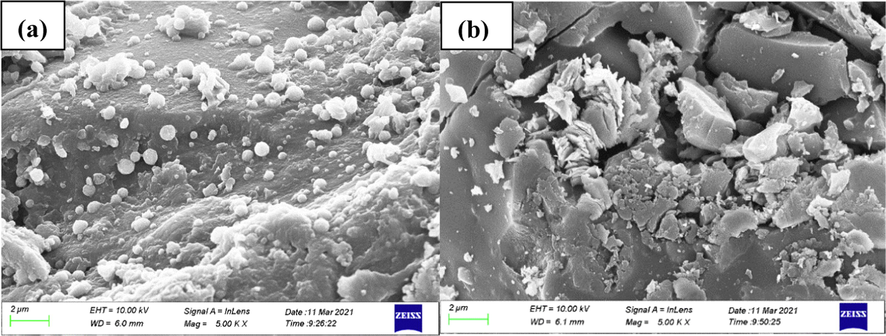
Cathode surface morphology under different voltages (a)0 V; (b)2 V.
To further clarify the reaction pathway and removal mechanism of zinc-cyanide complex in the electrosorption system, the precipitates and cathode surface adherence produced after the electrosorption reaction were subjected to XPS analysis. As shown in Fig. 12(a), the original spectral lines were fitted with split peaks, and the peaks of Zn 2p3/2 appeared at binding energies of 1021.2 eV and 1022.7 eV, indicating that the deposition of ZnO (Strohmeier and Hercules, 1984) and Zn(OH)2 (Dake et al., 2010), accounting for 36.64% and 63.36%, respectively. This indicates that the main reaction of zinc at the cathode are shown in equations (9–10) (Rosado-Mendoza et al., 2017).
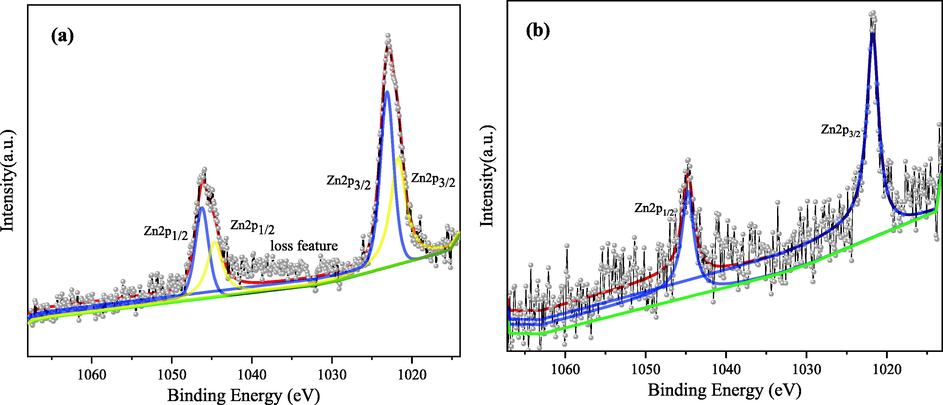
XPS analysis of precipitation in solution and zinc on the surface of cathode plate after electrosorption experiment.
XPS analysis of the cathode after adsorption was carried out and the spectrum of elemental zinc is shown in Fig. 12(b), only a pair of 2p orbital peaks appeared, with a peak of 1021.7 eV for Zn 2p3/2, which was found that the corresponding substance of this peak was Zn elemental (Powell, 2012). The analysis suggests that the zinc-cyanide complex dissociates under the action of the applied electric field and the free Zn2+ are partially bound in the double electric layer on the cathode surface by the electrostatic force and subsequently deposited by reduction on the surface of the electrode plate. However, it is noteworthy that the Zn spectral line in Fig. 12(b) is significantly rougher, indicating that the reduced Zn content is less.
The above analysis shows that the zinc-cyanide complexes in solution is moves directionally to anode and bound in the double electric layer by the electric field. Some of the zinc-cyanide decompose and resulting Zn2+, form Zn(OH)2 with the OH– in solution, which in turn produces ZnO, while a small amount of Zn2+ were electrostatically adsorbed on the cathode surface and reduced to zinc monomers. The removal of zinc-cyanide complexes therefore involves not only capacitive electroadsorption, but also a Faraday process at the cathode resulting in electrodeposition.
3.3.2 Analysis of removal mechanism of copper–cyanide complex ions
In order to investigate the removal pathway of copper–cyanide complex ions, the cathode electrode plate and the small amount of precipitation produced by the electrosorption treatment copper–cyanide complex were examined by XPS. The results showed that the cathode used for the removal of copper–cyanide had a similar XPS pattern to the original electrode as shown in Fig. 13(a), and there was no significant peak in the pattern of Cu2p (Fig. 13(b)). Under the condition of a constant applied voltage of 2 V, almost no metal ions were deposited by reduction only after the applied voltage. The analysis suggests that the ligand CN– ions were released from the metal coordinated ions during the electrodeposition process, while the free cyanide in solution inhibits the dissociation of the coordinated ions, so when the cyanide concentration increases, the activation energy of the reaction required for the cathodic reduction process increases, which in turn causes a decrease in the cathodic precipitation potential of the coordinated ions.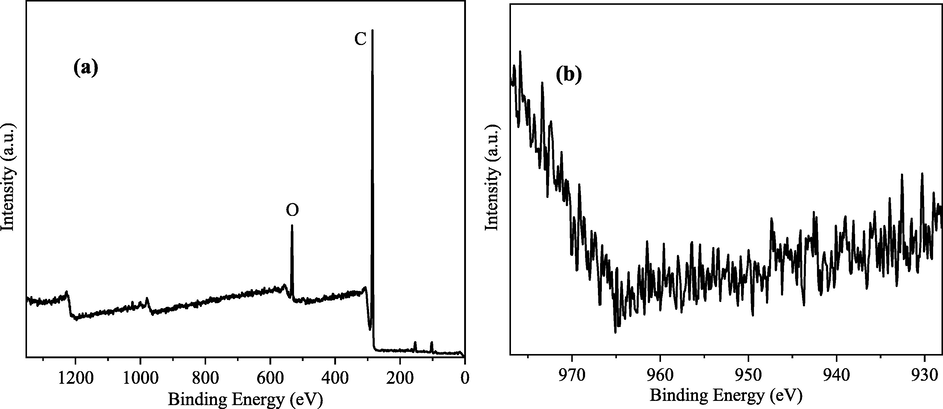
XPS spectrum and Cu2p spectrum of electrosorption cathode for copper–cyanide complex.
During the electrosorption process of copper–cyanide complex, a small amount of yellowish flocculent precipitate was produced under the anode, which was collected and then analysed by XPS on the precipitate. As shown in Fig. 14, there was no obvious peak in the Cu2p spectrum, while an obvious Cu3s absorption peak was present around 124 eV. The comparison with the spectral library, it was shown that the copper–cyanide complex was mainly present as Cu(OH)2 (Mcintyre and Cook, 1975) after reaction precipitation, which occurred in the form of the formula (11) reaction, and this form of presence also coincided with the E-pH diagram of the Cu-CN-H2O system.
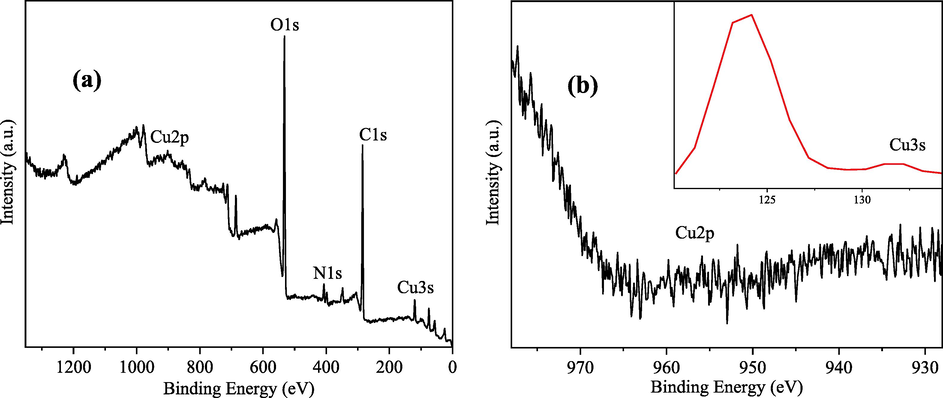
XPS spectrum and Cu2p and Cu3s spectra of electrodeposited copper cyanide solution precipitation.
The above analysis shows that some of the copper–cyanide complexes were decomposed to produce copper ions under the electric field during the electrosorption treatment, and Cu(OH)2 precipitates under alkaline conditions, almost no copper is deposited by reduction at the cathode. Instead, most of the copper removal can be attributed to the aggregation of copper–cyanide complexes by electrostatic adsorption into the range of the double electric layer near the anode, resulting in the purification of the solution. However, the overall removal rate of copper–cyanide was not high, combined with the results of copper–cyanide electrosorption kinetic analysis, the rate of copper–cyanide electrosorption was mainly controlled by the external diffusion rate, and it was difficult for copper–cyanide ions to enter the internal pores of the CB electrode, resulting in a reduction in the capacity of the electrode double layer and thus a decrease in the efficiency of electrostatic adsorption.
Based on the theoretical analysis of the chemical properties and experimental results of zinc-cyanide and copper–cyanide ions, the mechanism of their electrosorption reaction process as shown in Fig. 15. During the electrosorption process of zinc-cyanide ions, in addition to the binding effect of the double electric layer on the anode surface, some decomposition occurs to generate Zn2+, which generate Zn(OH)2 in alkaline solution, and generates ZnO precipitation further. At the same time, a small amount of Zn2+ were electrostatically adsorbed on the cathode surface, and then reduced and deposited. Copper-cyanide ions were partially decomposed by the electric field to produce Cu2+, and under alkaline conditions Cu(OH)2 was produced; while most of the copper–cyanide ions were collected by electrostatic adsorption in the double electric layer near the anode, so that the solution is separated and purified, almost no copper was deposited by reduction in this process.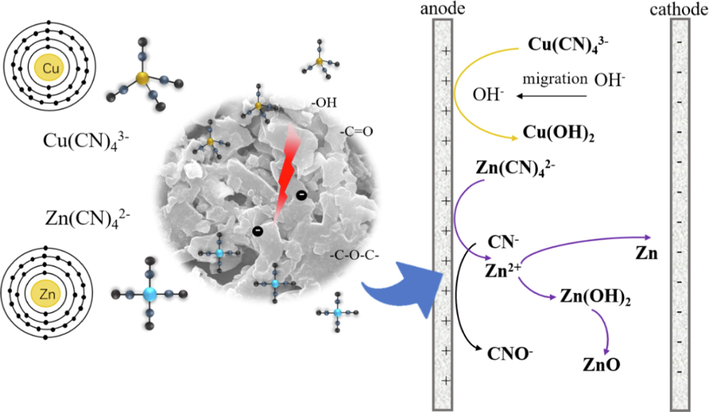
Mechanism of CB anode electrode zinc and copper cyanide complex ions electrosorption.
4 Conclusion
The adsorption/electrosorption kinetics of zinc-cyanide and copper–cyanide complex ions simulated solution on CB electrode showed that, both electrosorption processes were in accordance with the secondary kinetic model, indicating that the processes were accompanied by chemisorption. Liquid film diffusion and intraparticle diffusion were involved in controlling the rate of zinc-cyanide electrosorption. The equilibrium adsorption amount was 1.53 times higher than that at open circuit. External diffusion was the controlling step in the copper–cyanide electrosorption process, and the equilibrium sorption was 1.74 times higher than that at open circuit. Thermodynamic analysis showed that the two electrosorption processes follow the Langmuir model and are monomolecular layer adsorption, which is mainly affected by interdipole forces and ligand group exchange in this process.
Affected by the pseudo-capacitance, pore structure of CB electrodes, and the charges of complex ions, during the electrosorption process, the zinc-cyanide complex is bound in the double electric layer on the anode surface by the electric field, but partly decomposed to produce zinc ions and forms Zn(OH)2 in alkaline solution then generates ZnO precipitates, at the same time a small amount of Zn2+ are electrostatically adsorbed on the cathode surface for reduction deposition. However, the majority of the copper–cyanide complexes were purified by electrostatic adsorption to the double layer near the anode, while a small amount of decomposition occurred to produce Cu(OH)2 in the alkaline system, and almost no copper was deposited by reduction. This research results can enable us to better understand the removal characteristics of the weak metal cyanide complex ions in the process of electrosorption by CB electrode, and have great significance for the application of electrosorption technology to the treatment of cyanide wastewater.
Acknowledgements
This work was supported by the National Natural Science Foundation of China (No.51774227), Key Program of Shaanxi Natural Science Foundation (2018JZ5011), and Joint Program of Shaanxi Natural Science Foundation (2019JLM-44).
References
- Electrosorption of thiocyanate anions on active carbon felt electrode in dilute solution. J. Colloid Interface Sci.. 2005;290(1):190-195.
- [Google Scholar]
- Electrosorption of As(III) in aqueous solutions with activated carbon as the electrode. Appl. Surf. Sci.. 2018;434:816-821.
- [Google Scholar]
- Auger parameter measurements of zinc compounds relevant to zinc transport in the environment. Surf. Interface Anal.. 2010;14(1–2):71-75.
- [Google Scholar]
- Comparative study of electrosorption performance of solar reduced graphene oxide in flow-between and flow-through capacitive deionization architectures. Sep. Purif. Technol.. 2021;257(18):117972
- [Google Scholar]
- Engineering porous biochar for capacitive fluorine removal. Sep. Purif. Technol.. 2021;257:117932
- [Google Scholar]
- Electrosorptive removal of copper ions from wastewater by using ordered mesoporous carbon electrodes. Chem. Eng. J.. 2013;221(2):469-475.
- [Google Scholar]
- Efficient removal of uranium (VI) with a phytic acid-doped polypyrrole/carbon felt electrode using double potential step technique. J. Hazard. Mater.. 2022;433:128775
- [Google Scholar]
- Electrosorption of uranium (VI) from aqueous solution by phytic acid modified chitosan: An experimental and DFT study. Sep. Purif. Technol.. 2022;284:120284
- [Google Scholar]
- Removal of copper ions from an aqueous solution containing a chelating agent by electrosorption on mesoporous carbon electrodes. J. Taiwan Inst. Chem. Eng.. 2018;85:29-39.
- [Google Scholar]
- Carbon electrodes for capacitive deionization. J. Mater. Chem. A. 2017;5(2):470-496.
- [Google Scholar]
- Comparison of salt adsorption capacity and energy consumption between constant current and constant voltage operation in capacitive deionization. Desalination. 2014;352:52-57.
- [Google Scholar]
- Enhanced charge efficiency and reduced energy use in capacitive deionization by increasing the discharge voltage. J. Colloid Interface Sci.. 2015;446:317-326.
- [Google Scholar]
- About the theory of so-called adsorption of solution substances. Kungliga Svenska Vetenskapsakademiens Handlingar. 1998;24:1-19.
- [Google Scholar]
- The effect of the redox potential on the removal characteristic of divalent cations during activated carbon-based capacitive deionization. Chemosphere. 2021;274(12):129762
- [Google Scholar]
- Elimination of copper and iron cyanide complexes and mechanism in hypersaline system. Journal of Northeastern University (Natural Science). 2013;34(10):1473-1476.
- [Google Scholar]
- Treatment of cyanide wastewater by bulk liquid membrane using tricap-rylamine as a carrier. Water Sci. Technol. J. Int. Assoc. Water Pollut. Res.. 2016;73(12):2888-2895.
- [Google Scholar]
- X-ray photoelectron studies on some oxides and hydroxides of cobalt, nickel, and copper. Anal. Chem.. 1975;47(13):2208-2213.
- [Google Scholar]
- Combined reverse osmosis and constant-current operated capacitive deionization system for seawater desalination. Desalination. 2014;344:299-305.
- [Google Scholar]
- Cyanide and society: a critical review. Eur. J. Mineral Process. Environ. Protection. 2004;4:62-74.
- [Google Scholar]
- Capacitive deionization (CDI) for desalination and water treatment- past, present and future (a review) Desalination. 2008;228(1–3):10-29.
- [Google Scholar]
- Review on the science and technology of water desalination by capacitive deionization. Prog. Mater Sci.. 2013;58(8):1388-1442.
- [Google Scholar]
- Recommended Auger parameters for 42 elemental solids. J. Electron Spectrosc. Relat. Phenom.. 2012;185(1–2):1-3.
- [Google Scholar]
- Investigation of the selective growth of ZnO and Zn(OH)2 films deposited by chemical bath near room temperature. ECS J. Solid State Sci. Technol.. 2017;6(7):45-53.
- [Google Scholar]
- Song Y, Tian H, Li Y, et al. Effect of nitric acid concentration on structure and properties of coal-based electrode material. Coal Conversion, 2015, 38(4): 84-88+93.
- Treatment of cyanide wastewater by chemical precipitation-electric adsorption. Gold Science and Technology. 2015;23(4):75-79.
- [Google Scholar]
- Treatment of high-cyanide- containing wastewater using electric adsorption. Chinese J. Rare Metals. 2016;40(5):492-498.
- [Google Scholar]
- Removal of heavy metals and cyanide from gold mine waste-water by adsorption and electric adsorption. J. Chem. Technol. Biotechnol.. 2016;91(9):2539-2544.
- [Google Scholar]
- Surface spectroscopic characterization of the interaction between zinc ions and γ-alumina. J. Catal.. 1984;86(2):266-279.
- [Google Scholar]
- Adsorption kinetics and thermodyanmics of p-Nitrophenol on activated carbon. Ion Exchange and Adsorption. 2018;34(3):247-258.
- [Google Scholar]
- Effect of voltage on the treatment of cyanide wastewater by three-dimensional electrode. J. New Mater. Electrochem. Syst.. 2017;20(4):151-159.
- [Google Scholar]
- Electrochemically capacitive deionization of copper (II) using 3D hierarchically reduced graphene oxide architectures. Sep. Purif. Technol.. 2020;251:117368
- [Google Scholar]
- Experimental investigation of activated carbon prepared from date stones adsorbent electrode for electrosorption of lead from aqueous solution. Microchem. J.. 2019;146:164-169.
- [Google Scholar]


