

Translate this page into:
Study on the difference in adsorption thermodynamics for water on swelling and non-swelling clays with implications for prevention and treatment of pneumoconiosis
⁎Corresponding author. xidongdu@126.com (Xidong Du)
-
Received: ,
Accepted: ,
This article was originally published by Elsevier and was migrated to Scientific Scholar after the change of Publisher.
Peer review under responsibility of King Saud University.
Abstract
Excessive inhalation of mineral dust can cause irreversible damage such as diffuse fibrosis of lung tissue. Water-based dust reduction technology can effectively control the dust concentration. The study of the interaction of water-clay mineral dust is helpful to the prevention and treatment of pneumoconiosis by water-based dust removal technology. To better understand the underlying adsorption mechanisms of water molecules on clay mineral dust, the detailed adsorption thermodynamics analysis is necessary. In this paper, we research the thermodynamics of adsorption of water molecules on swelling clay of montmorillonite and non-swelling clay of illite. First, the adsorption isotherms of water molecules on montmorillonite and illite at 293–313 K were measured by gravimetric method. Then, the key thermodynamic variables, including entropy change (ΔS), surface potential (Ω), isosteric heat of adsorption (Qst) and variation of Gibbs free energy (ΔG), were analyzed. Results illustrate that the adsorption amount for water molecules on illite is one order of magnitude smaller than that on montmorillonite, suggesting that swelling clay plays a dominant role in water molecules adsorption process. For water molecules adsorption on montmorillonite, the contribution of secondary adsorption to total adsorption (a2/a) is always less than 30%. For water molecules adsorption on illite, the contribution of primary adsorption to total adsorption (a1/a) is greater than a2/a at the low pressure region, while a2/a can exceed 60% at the high pressure region. The difference in the uptakes of water molecules adsorption on non-swelling and swelling clays is mainly resulted from the difference in primary adsorption on two clays. The Henry’s constant (KAA) for montmorillonite is in the range of 21.37–75.08 mmol/g/kPa, which is evidently larger than the KAA values of 0.34–0.98 mmol/g/kPa for illite. Compared with non-swelling clay, the adsorption spontaneity degree for water molecules on swelling clay is higher, and the interaction of swelling clay-water molecules is stronger. Meanwhile, the movement of adsorbed water molecules in swelling clay is more confined than that in non-swelling clay. These findings can offer meaningful guidelines for the prevention and treatment of pneumoconiosis.
Keywords
Clay mineral dust
Pneumoconiosis
Water
Entropy loss
Adsorption spontaneity

1 Introduction
Excessive inhalation of mineral dust has the serious risk of suffering from pneumoconiosis for workers (Zhang et al., 2019). Pneumoconiosis is the most important occupational disease in China, which can seriously reduce the ability to work, cause disability and affect life expectancy (Xie et al., 2022). The smaller dust is easier to stay in the alveoli and cause the irreversible damage for diffuse fibrosis of lung tissue. Primary prevention is fundamental to prevent dust hazards, and pneumoconiosis is a completely preventable disease. Controlling the dust concentration below the allowable concentration can eliminate pneumoconiosis and significantly reduce the harm of pneumoconiosis. Water-based dust reduction technology can effectively control the dust concentration (Xie et al., 2022). Therefore, to better prevent pneumoconiosis, it is necessary to study the interaction of water molecules and mineral dust.
The adsorption of mineral dust to water molecules is dependent on clay minerals and organic matter (Rani et al., 2019). In general, the organic matter is hydrophobic and has extremely low adsorption ability for water molecules (Feng et al., 2018a). Contrarily, based on exchangeable cations and some surface polar groups, clay minerals own strong hydrophilicity nature (Chen et al., 2021). Many studies have revealed that water molecules adsorption on mineral dust is mainly governed through natural clay minerals (Wang et al., 2019; Zolfaghari et al., 2017). Thereby, understanding the interaction of water and mineral dust requires to systematically study water molecules adsorption on natural clays.
For most of mineral dust, illite, kaolinite and montmorillonite are the main clay minerals (Feng et al., 2018b). Montmorillonite represents the swelling clay, while illite and kaolinite belong to non-swelling clay. Illite and montmorillonite both are phyllosilicates, which are comprised of plate-like structures. These plate-like structures are formed by changing the arrangement of silica and alumina sheets packed in repeating layers (Hatch et al., 2012). Although illite and montmorillonite have the similar structure, their chemical and physical properties, such as swelling ability, surface area, particle size and isomorphic substitution sites, are significantly different (Hatch et al., 2012). The interlamellar potassium ions for illite have strong ionic interactions, leading to the non-expansive characteristics of illite (Dettmann, 1958). On the contrary, once the water molecules are adsorbed on montmorillonite, the structure of montmorillonite will expand, which is caused by the hydration of exchangeable cations (Ca2+, K+, Mg2+, Na+ and Li+) in the clay layers (Mooney et al., 1952b; Odom and Low, 1978). It is obvious that the clay minerals in mineral dust are mainly composed of non-swelling and swelling clays, and illite and montmorillonite can be taken as good representatives for non-swelling clay and swelling clay, respectively. Hence, comparing water molecules adsorption on non-swelling and swelling clays is meaningful to comprehend water molecules adsorption in mineral dust, and illite and montmorillonite were chosen as research objects in this study.
To date, some attempts have been done for investigating water molecules adsorption performances on clays by molecular simulation and experimental analysis method (Feng et al., 2018a; Hatch et al., 2012; Holmboe and Bourg, 2014; Li et al., 2019; Likos and Lu, 2002; Nair et al., 2021; Yang et al., 2019; Zolfaghari et al., 2017). Li et al. (2019) used the molecular simulation technology to research water molecules adsorption behavior on montmorillonite. They pointed out that water molecules are mainly adsorbed in mesopore at high relative humidity condition. Zolfaghari et al. (2017) studied adsorption of water molecules on gas-bearing formations and illustrated that the sample with lower clay minerals content has the weaker adsorption ability and slower initial adsorption rate for water molecules. Hatch et al. (2012) adopted Freundlich and BET adsorption models to analyze the adsorption of water molecules on illite, kaolinite and montmorillonite. Their results indicated that among the three clay minerals, montmorillonite possesses the highest adsorption ability for water molecules. Feng et al. (2018a) found that the occurrence characteristics of water in clay minerals vary with pore size. Yang et al. (2019) studied the adsorption and diffusion characteristics of water molecules on montmorillonite by molecular simulation method and showed that the mobility of water molecules is higher in the low-charge montmorillonite than in the corresponding high-charge system. It can be seen that although many published literatures have focused on the subject of water molecules adsorption on clays, the underlying adsorption mechanisms for water on non-swelling and swelling clays have not been well revealed. Hence, to better recognize the different adsorption performances for water on non-swelling and swelling clays, more efforts should be carried out to investigate illite-water molecules interaction and montmorillonite-water molecules interaction.
The understanding of water molecules adsorption mechanisms on natural clays needs thermodynamics analysis. By analyzing thermodynamics parameter, such as variation of Gibbs free energy (ΔG), entropy change (ΔS), surface potential (Ω) and isosteric heat of adsorption (Qst), the interaction strength of fluid–solid, the restricted degree of adsorbed molecules, the spontaneity of adsorption, etc., can be estimated (Duan, 2017). However, at present, only a limited number of studies report the heat of adsorption for water molecules on clay minerals (Belhocine et al., 2018; Likos and Lu, 2002; Mooney et al., 1952a). It is noticeable that there is still very dearth of data available about the adsorption thermodynamics of water on clays. Many important questions, including the effects of temperature and pressure on the thermodynamics of water molecules adsorption on clays, the packing manner of adsorbed water molecules on clay minerals and the heat effect during adsorption process on clays, remain unresolved. Therefore, to better understand the mechanisms of the interaction of water molecules on non-swelling and swelling clays, performing the research about the thermodynamics of water molecules adsorption on illite clay and montmorillonite clay is necessary.
The main objective for this research is to probe the mechanisms of water molecules adsorption on clays. For this purpose, the pore structure and surface chemistry of illite and montmorillonite were characterized. The adsorption isotherms on illite and montmorillonite for water molecules at the temperatures of 293–313 K were measured by gravimetric method. D’Arcy and Watt model was applied to simulate the obtained adsorption isotherms. Henry’s coefficient and thermodynamics parameters (Qst, ΔG, Ω and ΔS) were discussed.
2 Materials and methods
2.1 Sample collection
The illite with the purity of 98% and montmorillonite with the purity of 99% were acquired from Sichuan Basin of China. To accurately measure the adsorption capacity of two clays, the illite and montmorillonite were ground into powder with the size of 0.106–0.125 mm.
2.2 Sample characterization
2.2.1 Pore structure characterization for illite and montmorillonite
The illite and montmorillonite both possess complex pore structure. In order to accurately probe the pore information for illite and montmorillonite, pore structures of two clays were determined by low-pressure physisorption of N2 and CO2. N2 adsorption at 77 K and CO2 adsorption at 273 K were conducted out through ASAP-2020 M (Micromeritics, Georgia, USA).
The property of probe fluid has important effect on the measurement result of inner pore information (Ross and Bustin, 2009). On the one hand, N2 molecules have a bigger kinetics diameter (0.36 nm) than CO2 molecules (0.33 nm). N2 molecules entry into the narrow pores is either prevented entirely or controlled kinetically, while CO2 molecules have the capacity to access these narrow micropores. On the other hand, N2 adsorption measurement was conducted at the low temperature of 77 K. At this temperature, due to the shrinkage of pores and activated diffusion process, N2 molecule lacks the adequate energy to migrate into the ultrafine structure of micropores (Unsworth et al., 1989). Contrarily, the higher temperature of 273 K gives CO2 molecule more energy to force into the narrow passages. As a result, low-pressure N2 adsorption only can be applied to characterize mesopore and macropore. The micropore information was gained by low-pressure CO2 adsorption.
2.2.2 Surface chemistry characterization for illite and montmorillonite
The surface chemistry for illite and montmorillonite was characterized by the Tensor II Fourier Transform Infrared (FTIR) spectroscopy instrument provided by Buker Corporation. The spectra were collected within the wavenumber range of 400 cm−1 to 4000 cm−1 with 32 scans at a resolution of 2 cm−1.
2.3 Isothermal adsorption curves measurement
At present, the main measurement methods for adsorption isotherm are gravimetric method and volumetric method (Liu et al., 2019; Zhou et al., 2016). Compared with volumetric method, the measurement accuracy for gravimetric system only depends on magnetic suspension balance accuracy, and the measurement error of gravimetric method is easy to control. Hence, the adsorption experiments on illite and montmorillonite for water molecules were performed using gravimetric method.
The isothermal adsorption curves on illite and montmorillonite under the temperatures of 293–313 K for water molecules were measured through IGA-100B gravimetric analyzer, which is obtained from Hiden Analytical Ltd. Before carrying out the adsorption experiment, the sample cell was outgassed at 10-5 Pa and 473 K for 10 h. At 473 K, the water molecules adsorbed on clay surface can be eliminated, and the clay minerals structure will not be destroyed (Kuila and Prasad, 2013).
3 Theoretical basis
3.1 Adsorption model
Besides illuminating adsorptive potential of adsorbent, the shape and magnitude of adsorption isotherm can also reflect the relationship of equilibrium pressure and pore accessibility, the information regarding adsorption ability, pore structure, adsorption rate, as well as the surface characteristics of adsorbent (Klewiah et al., 2020). To better describe the adsorption phenomenon, the gained adsorption isotherms are always simulated by appropriate adsorption models. For the water molecules, the available adsorption models mainly include D’Arcy and Watt model, Dent’s model, Dubinin-Serpinsky model and Cooperative Multimolecular Sorption (CMMS) model (Duan and Li, 2018). In the fitting process, we found that D’Arcy and Watt model has the best matching result for adsorption isotherms on illite and montmorillonite for water molecules. Meanwhile, D’Arcy and Watt model has been successfully applied to water molecules adsorption on coal and nonporous carbon (Barton et al., 1994; McCutcheon et al., 2003). Therefore, the adsorption data on illite and montmorillonite for water molecules was treated using D’Arcy and Watt model.
D’Arcy and Watt model is based on a statistical thermodynamics treatment for adsorption under the multisite substrate (Duan and Li, 2018). D’Arcy and Watt model assumes that only one type of primary sites and only one type of secondary sites exist. Correspondingly, D’Arcy and Watt model can be adopted to evaluate the number of primary sites and secondary sites. D’Arcy and Watt model has the following form:
The first term in D’Arcy and Watt model, the Langmuir type contribution, calculates the adsorption in the primary sites (strongly bonding sites). The second term in D’Arcy and Watt model, the BET type contribution, calculates the adsorption in the weaker secondary sites. The adsorption amounts on primary sites (a1) and secondary sites (a2) for water molecules can be obtained by Eq. (2) and Eq. (3), respectively.
The goodness-of-fit of D’Arcy and Watt model to the gained isotherms on illite and montmorillonite for water molecules was estimated using determination coefficient and average relative deviation. The square of the coefficient of correlation is the determination coefficient (R2). Average relative deviation (ARE) quantifies the deviation between experimental result and calculated result. ARE can be acquired using Eq. (4).
3.2 Analysis of adsorption thermodynamics
In this paper, variation of Gibbs free energy (ΔG), entropy change (ΔS), surface potential (Ω) and isosteric heat of adsorption (Qst) on illite and montmorillonite for water molecules were analyzed. ΔG is always used to estimate the spontaneity trend and degree of adsorption process (Zhou et al., 2012). Ω is defined as the work necessary for adsorbate to reach equilibrium state (Mofarahi and Bakhtyari, 2015). Eq. (5) and Eq. (6) give the calculation methods for Ω and ΔG, respectively (Duan, 2017).
ΔS can be used to evaluate the disorderliness degree change of adsorption system (Duan, 2017). Qst can describe the heat effect of adsorption process and characterize the adsorbate-adsorbent interaction (Liang et al., 2016). The calculation method for Qst is shown in Eq. (7) and Eq. (8). ΔS was calculated using Eq. (9) and Eq. (10) (Duan, 2017).
3.3 Analysis of adsorption affinity
For the studied adsorption system, if the equilibrium pressure is very low, the adsorption quantity increases linearly with pressure and the observed adsorption isotherm is in accord with Henry’s equation. As indicated by Schindler and LeVan (2008), within the Henry’s range, the molecule can independently collide with the matrix of adsorbent. Correspondingly, the surface-molecule force predominates under the low pressure condition, and Henry’s coefficient can be taken as the unique parameter for estimating of adsorption affinity.
To calculate Henry’s coefficient (KAA), the first step is to express the correlation of experiment pressure and adsorption quantity by virial type equation (Tang et al., 2015).
Because the adsorption quantity is very small at the low pressure range, the corresponding high-order terms in Eq. (11) will be deleted.
By linearly fitting the curve of ln(P/a) vs. a, the values of A0 and KAA can be calculated.
4 Results and discussion
4.1 Pore structure morphology for illite and montmorillonite
4.1.1 Micropore morphology for illite and montmorillonite
The obtained CO2 adsorption isotherms at 273 K on illite and montmorillonite are presented in Fig. 1(a). The pore size distributions (PSD) of micropore for two clays are plotted in Fig. 1(b). As displayed in Fig. 1(a), over the whole pressure range, CO2 adsorption isotherm on montmorillonite is clearly above CO2 adsorption isotherm on illite, indicating that illite has a smaller adsorption capacity for CO2.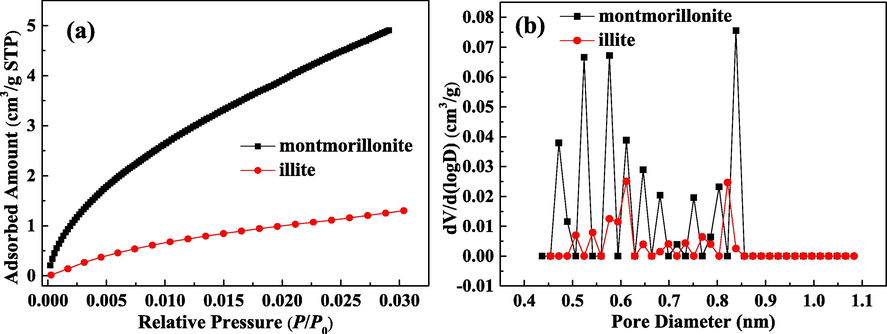
Adsorption isotherms of CO2 at 273 K (a) and PSD of micropore (b) for illite and montmorillonite.
It can be seen from Fig. 1(b) that PSD for micropore of illite and montmorillonite are both not continuous. PSD for micropore of illite is narrower than that of montmorillonite. PSD of micropore for montmorillonite ranges from 0.45 nm to 0.85 nm, and PSD of micropore for illite ranges from 0.50 nm to 0.85 nm. Meanwhile, the PSD peak values of montmorillonite are significantly higher than those of illite, which suggests that there are more micropores in montmorillonite.
The obtained micropore structure parameters for illite and montmorillonite are summarized in Table 1. The specific surface area of micropore (SCO2) for illite and montmorillonite are 4.22 m2/g and 16.34 m2/g, respectively, and the volume of micropore (VCO2) for illite and montmorillonite are 0.0013 cm3/g and 0.0052 cm3/g, respectively. The bigger SCO2 and VCO2 suggest that the micropore structure of montmorillonite is more developed than that of illite. With decreasing pore size, the molecule is more influenced by enclosing surfaces from all sides, and the electrostatic and van der Waals interactions are enhanced (Klewiah et al., 2020). Consequently, micropore is beneficial for fluid adsorption, and the adsorbent with the bigger micropore volume generally has the higher adsorption capacity. The larger SCO2 and VCO2 for montmorillonite can account for its higher CO2 adsorption amount than illite.
Adsorbent
SCO2 (m2/g)
VCO2 (cm3/g)
illite
4.22
0.0013
montmorillonite
16.34
0.0052
4.1.2 Mesopore and macropore morphology for illite and montmorillonite
The desorption and adsorption isothermal curves for N2 on illite and montmorillonite at 77 K are reported in Fig. 2(a), and macropore and mesopore size distribution is described in Fig. 2(b).
Adsorption and desorption isotherms of N2 at 77 K (a) and PSD of macropore and mesopore (b) for illite and montmorillonite.
The hysteresis loop of N2 for montmorillontie is very notable, while the desorption isotherm and adsorption isotherm of N2 for illite almost coincide. Gress and Sing (1982) stated that the hysteresis loop is formed by swelling or adsorption within micropores. The more notable hysteresis loop reflects that the matrix swelling for montmorillonite is more significant during the adsorption process. For N2 desorption isotherm of montmorillonite, it can be found that there is the “forced closure” phenomenon at P/P0 of 0.45–0.50, which is also identified as tensile strength effect (TSE) (Chen et al., 2021). When fluid desorption occurs in the pores with the size of about 4 nm, the hemispherical meniscus is not stable, giving rise to the appearance of TSE (Groen et al., 2003). At P/P0 lower than 0.05, the increase of N2 uptake on montmorillonite is sharper than that on illite, showing that the micropore filling occurring within montmorillonite has a higher level. Meanwhile, it can be deduced that for the desorption process on clay-rich gas-bearing reservoir, only when reservoir pressure drops very low, the adsorbed molecules can be remarkably and completely desorbed. As P/P0 increases to one, the adsorbed amounts of N2 on montmorillonite and illite increase without limit, which is caused by the insufficient packing of mesopore and macropore.
Based on the definition of IUPAC, the adsorption isotherms of N2 on montmorillonite and illite present type II isotherm property. The hysteresis loop on montmorillonite belongs to type H3 loop. The hysteresis loop can be used to characterize pore shape. Type H3 loop shows that the pore within montmorillonite is slit- or plate shaped. As detailed in Fig. 2(b), PSD of macropore and mesopore on montmorillonite and illite are similar. Two clays both have continuous PSD in the range of 2.5–4.0 nm, 4.0–10.0 nm and 10.0–70.0 nm. Under the same pore diameter, the peaks of PSD for montmorillonite are higher, and montmorillonite has more mesopore and macropore than illite.
The macropore and mesopore structure parameters for illite and montmorillonite are given in Table 2. The total pore volume (Vt) and BET specific surface area (SBET) for illite are 0.0454 cm3/g and 15.31 m2/g, respectively, and Vt and SBET for montmorillonite are 0.0962 cm3/g and 60.69 m2/g, respectively. The mesopore volume (Vmes) for illite and montmorillonite are 0.0370 cm3/g and 0.0808 cm3/g, respectively, and the macropore volume (Vmac) for illite and montmorillonite are 0.0084 cm3/g and 0.0154 cm3/g, respectively. Vmes/Vt values for illite and montmorillonite are both greater than 80%, demonstrating that Vt and SBET of two clays are mainly contributed by mesopore. Meanwhile, the values of SBET, Vt, Vmac and Vmes for illite are all lower than those for montmorillonite. Macropore and mesopore structure of montmorillontie is more developed. Besides micropore, mesopore also has significant effect on fluid adsorption. Although the adsorption potential in mesopore is not notably overlapped, the capillary condensation can occur in mesopore by changing the phase behavior of restricted fluid (Broom and Thomas, 2013). A liquid-like fluid formed in mesopore is conducive to fluid adsorption. Macropore has the smaller surface area and can act as the pathway for fluid flow. Hence, montmorillonite not only has the larger adsorption ability but also has the better pore connectivity.
Adsorbent
SBET
(m2/g)
Vmes
(cm3/g)
Vmac
(cm3/g)
Vt
(cm3/g)
Vmes/Vt
(%)
Vmac/Vt
(%)
illite
15.31
0.0370
0.0084
0.0454
81.50
18.50
montmorillonite
60.69
0.0808
0.0154
0.0962
83.99
16.01
According to the discussion above, we can find that the macro-, meso- and micropore structure of swelling clay (montmorillonite) is more developed than that of non-swelling clay (illite). When studying CH4 adsorption on various clay minerals, Ji et al. (2014) found that different clay minerals have different morphological structure, pore size and porosity. Their findings about pore structure of clay minerals are in agreement with our observations that pore evolution characteristics of swelling clay and non-swelling clay are different.
4.2 Surface chemistry characteristics for illite and montmorillonite
Fig. 3 compares the gained FTIR spectra for illite and montmorillonite. The peaks of FTIR spectra for montmorillonite are more abundant than those for illite, which indicates that montmorillonite surface has the more functional groups. The absorbance bands at 400–600 cm−1 and 800–1200 cm−1 are caused by the stretching vibrations and Si—O bending in silicate. The 700–900 cm−1 zone is associated with the out-of-plane aromatic C—H vibration. The region of 3600–3750 cm−1 is caused through O—H stretching vibration. In addition, montmorillonite has the prominent FTIR spectra peaks appearing at around 1650 cm−1 and 3400 cm−1. The spectra peak at around 1650 cm−1 is owing to the appearance of the oxygenated functional groups related to C⚌C stretching vibrations. The peak at around 3400 cm−1 is owing to the strong O—H stretching vibration. Many scholars have confirmed that surface functional groups exhibit the strong adsorption ability for water molecules (Bahadur et al., 2017; Brennan et al., 2002). Compared with non-swelling clay (illite), swelling clay (montmorillonite) is richer in hydrophilic groups. The difference in surface functional groups of illite and montmorillonite can help to interpret the distinct adsorption performances on two clays for water molecules.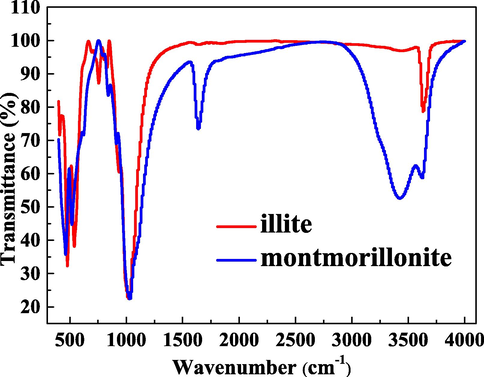
FTIR spectra for illite and montmorillonite.
4.3 Adsorption performances for water molecules on illite and montmorillonite
4.3.1 Adsorption isotherms for water molecules
Fig. 4(a) and (b) present the measured adsorption isotherms as a function of P/P0 for water molecules on illite and montmorillonite, respectively. The obtained adsorption amount of water molecules on montmorillonite is close to the measured data of Chiou and Rutherford (1997) and Ferrage et al (2005). Water uptakes on two clays both improve as P/P0 increases. Under the same condition, the uptake of water on illite is an order of magnitude lower than that on montmorillonite, demonstrating that swelling clay (montmorillonite) has a significantly stronger adsorption capacity for water than non-swelling clay (illite). Therefore, swelling clay plays a dominant role in adsorption of water on mineral dust. These adsorption isotherms on two clays as a function of P/P0 for water belong to type II isotherm. When P/P0 is lower, the uptake increases quickly, which reflects that the clay surface has the preferential sites with larger binding energy. Then, with the increase of P/P0, the isothermal adsorption curves begin to become gentle, and the adsorption rate gradually decreases. Under the high P/P0, the uptake of water on two clays, especially on illite, again enhances rapidly without saturation.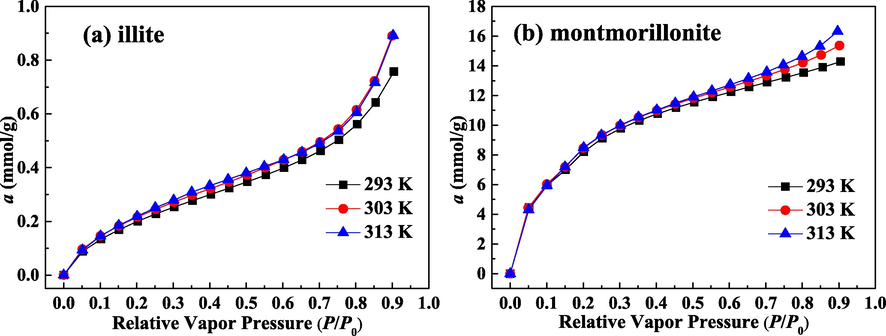
Adsorbed amount of water molecules as a function of P/P0 for illite (a) and montmorillonite (b).
As given in Fig. 4, temperature has a slight influence on water adsorption, and lower temperature does not correspond to the higher uptake. When studying adsorption of water molecules on Wufeng-Longmaxi reservoir, the insensitivity of isothermal adsorption curves plotted against P/P0 to the experiment temperature is also found (Chen et al., 2021). Table 3 lists the adopted values of pressures for water adsorption under different temperatures. When P/P0 = 0.25, the values of P at 313 K, 303 K and 293 K are 1.8442 kPa, 1.0619 kPa and 0.5837 kPa, respectively. When P/P0 = 0.75, the values of P at 313 K, 303 K and 293 K are 5.5326 kPa, 3.1856 kPa and 1.7510 kPa, respectively. Although high temperature is harmful for fluid adsorption, the increase in P can enhance the adsorption quantity. The combined effects result in the slight influence of temperature on the adsorption isotherms plotted against P/P0.
P/P0
P (kPa)
P/P0
P (kPa)
P/P0
P (kPa)
293 K
303 K
313 K
293 K
303 K
313 K
293 K
303 K
313 K
0.05
0.1167
0.2124
0.3688
0.35
0.8171
1.4866
2.5818
0.65
1.5175
2.7608
4.7948
0.10
0.2335
0.4247
0.7377
0.40
0.9338
1.6990
2.9506
0.70
1.6342
2.9732
5.1636
0.15
0.3502
0.6371
1.1065
0.45
1.0506
1.9113
3.3195
0.75
1.7510
3.1856
5.5325
0.20
0.4669
0.8495
1.4753
0.50
1.1673
2.1237
3.6883
0.80
1.8677
3.3979
5.9013
0.25
0.5837
1.0619
1.8442
0.55
1.2840
2.3361
4.0571
0.85
1.9844
3.6103
6.2701
0.30
0.7004
1.2742
2.2130
0.60
1.4008
2.5484
4.4260
0.90
2.1011
3.8227
6.6389
The adsorption isotherms vs. vapor pressure on illite and montmorillonite for water molecules are plotted on Fig. 5(a) and (b), respectively. It can be seen that reducing temperature and increasing vapor pressure both can enlarge water molecules adsorption quantity on two clays. As the temperature improves, the thermal motion of adsorption system is intensified and adsorbate molecules possess enough energy for overcoming the electrostatic attraction and van der Walls’ attraction (Wang et al., 2019). Correspondingly, the increase of temperature reduces water uptake. Moreover, with improving vapor pressure, when the micropore space is occupied, the subsequently injected adsorbate molecules can be trapped in the bigger pore structure, such as mesopore and macropore, by the mechanism of multilayer adsorption or capillary condensation. Thereby, improving vapor pressure promotes water adsorption.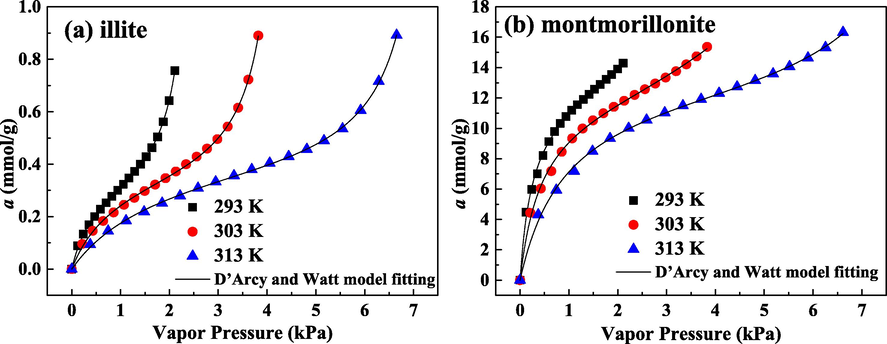
Adsorbed amount of water molecules as a function of vapor pressure for illite (a) and montmorillonite (b).
The matching results of isothermal adsorption curves of water molecules by D’Arcy and Watt model are displayed in Fig. 5, and the matching parameters in D’Arcy and Watt model are detailed in Table 4. The theoretical calculations are accordant with the experimental results. The values of R2 are higher than 0.99. ARE values are lower than 1.65%. Consequently, employing D’Arcy and Watt model to treat adsorption data on illite and montmorillonite for water molecules is feasible and reasonable.
Adsorbent
T (K)
S (mmol/g)
K (kPa−1)
s (mmol/g)
k (kPa−1)
R2
ARE (%)
293
0.3616
2.1161
0.1053
0.3856
0.9997
1.29
illite
303
0.4058
1.1325
0.0887
0.2259
0.9995
1.64
313
0.4608
0.5547
0.0688
0.1330
0.9995
1.60
293
11.8031
4.0389
9.0002
0.1382
0.9979
1.39
montmorillonite
303
11.8995
2.3131
5.6979
0.1161
0.9982
1.40
313
13.3066
1.0793
1.8207
0.1081
0.9987
1.18
The effectiveness of using D’Arcy and Watt model to deal with adsorption data indicates that the adsorption sites on illite and montmorillonite are composed by primary sites and secondary sites. Previous study has indicated that the surface chemistry of material has a significant role in adsorption process (Yin et al., 2016). Meanwhile, many researchers have confirmed that functional groups, especially hydrophilic functional groups, have the strong adsorption ability for water and can be identified as primary adsorption sites (Bahadur et al., 2017; Brennan et al., 2002). According to the measurement results about surface functional groups of two clays in Section 4.2, we can find that illite and montmorillonite both have functional groups or even oxygen-containing functional groups on their surface. Therefore, illite and montmorillontie have the surface chemistry basic to form primary sites and secondary sites. As summarized in Table 4, the values of K and k both decrease with the temperature increases, which illustrates that high temperature reduces primary adsorption sites-water molecules attraction force and secondary adsorption sites-water molecules attraction force.
4.3.2 Water molecules adsorption isotherms on primary sites and secondary sites
Fig. 6(a) and (c) present the adsorption isotherms on illite on primary sites and secondary sites, respectively. Fig. 6(b) and (d) depict the adsorption isotherms on montmorillonite on primary sites and secondary sites, respectively. Clearly, shapes for isothermal curves of primary adsorption and secondary adsorption are very different, illuminating that the mechanism for primary adsorption is different from that for secondary adsorption.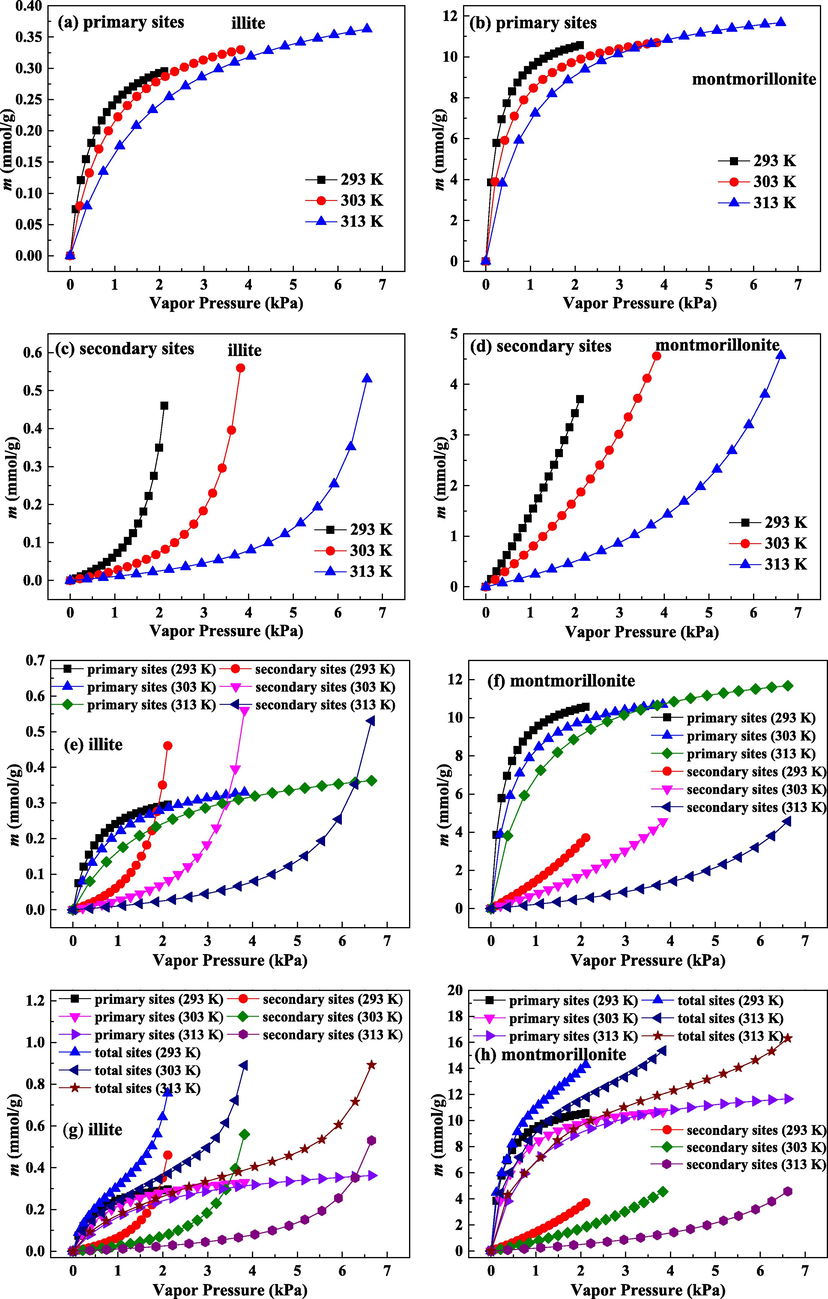
Adsorbed amount of water molecules as a function of vapor pressure on primary adsorption sites, secondary adsorption sites and total adsorption sites for illite and montmorillonite.
It can be found from Fig. 6(a) to (d) that under low P condition, primary adsorption uptake enhances sharply, while the enhancement of secondary adsorption uptake is extremely slow. Accordingly, the main adsorption is primary adsorption, and only a few adsorbates are adsorbed in secondary sites. The significantly strong adsorption on primary sites for water molecules suggests that primary adsorption is dominant within low P range. At the early stage of adsorption, the molecules density for water is very low, and water molecules hydrogen bond is difficult to form. The findings of Chen et al. (2021) have shown that water tends to be retained on some specific adsorption sites rather than indiscriminately on the entire surface. Therefore, injected water molecules will be preferentially retained on these functional groups (primary adsorption sites) with higher adsorption potential, and primary adsorption sites have the significant effect on water adsorption in the early phase.
With further enhancement of P, increases rate of primary adsorption uptake is obviously reduced, and secondary adsorption uptake increases rapidly. This phenomenon shows that as P enhances, the most of adsorbates are retained in secondary adsorption sites, and secondary adsorption effect gradually improves. With continuously increasing P, most of primary adsorption sites are used, giving rise to less available primary adsorption sites and slower increase of adsorption quantity in primary sites. As demonstrated by Bahadur et al. (2017), the adsorbed water molecules on primary adsorption sites can act as nucleation centers for subsequent adsorption and can be taken as secondary adsorption sites. As P enhances, the water clusters will be formed on pre-adsorbed water molecules (Svabova et al., 2011). By small-angle X-rays scattering technology and X-ray diffraction technology, the formation of ordered water clusters during adsorption process has been verified (Bahadur et al., 2017). Therefore, with gradual consumption of primary adsorption sites, water clusters begin to form, which is the main reason for the constant and quick enhancement of uptake on secondary adsorption sties.
Under high P region, primary adsorption is almost saturated, and secondary adsorption uptake still rapidly increases without saturation. Meanwhile, the increase rate of uptake on secondary adsorption sites is bigger and bigger with the increase in P. Under high P, primary sites are occupied, and less adsorption appears in primary sites. On the contrary, once the water clusters are formed, the size of water clusters enlarges through gathering more water molecules and bridging with adjacent water clusters. These growing water clusters can be eventually condensed in the inner pore structure (Charriere and Behra, 2010). The growth and bridging of water cluster can interpret the rapid increase of uptake in secondary sites at the high P stage. If the water cluster is formed at pore opening, the entry of water molecules into the pore space will be effectively prevented (Svabova et al., 2011). For the investigation of the effect of water clusters on pore connectivity, Brennan et al. (2002) discovered that the growing water clusters can narrow the pore size distribution and shift the big pore into small pore. In addition, these formed water clusters can separate the connected and continuous pore structure into several isolated pore space and obviously decrease the pore connectivity, which adversely affects the diffusion rate and adsorption capacity of adsorbate. Considering that primary adsorption of water molecules is only on the surface, primary adsorption has a slight effect on pore connectivity. Therefore, it can be reasonably inferred that the adverse effect of water adsorption to CH4 adsorption and diffusion is mainly attributed to water clusters formation on secondary sites.
As plotted in Fig. 6(a) and (b), water molecules adsorption amount in primary sites on illite is obviously lower than that on montmorillonite. Meanwhile, adsorption amount increase rate in primary sites on illite is very smaller than that on montmorillonite. Primary adsorption for water molecules is governed by the surface chemistry of clay minerals. Compared with illite, montmorillonite is richer in hydrophilic functional groups. Thus, the primary adsorption sites on montmorillonite are more abundant, and montmorillonite has bigger adsorption ability and faster adsorption rate for primary adsorption. In addition, increasing temperature reduces primary adsorption uptake. The increase in temperature weakens the hydrogen bonding interaction of water molecules and surface functional groups, causing the reduction in primary adsorption uptake.
As can be noted in Fig. 6(c) and (d) that water molecules adsorption amount in secondary adsorption sites on montmorillonite is one order of magnitude higher than that on illite, and the increase rate of uptake on secondary adsorption sites on montmorillonite is also very greater than that on illite. Secondary adsorption of water is mainly determined by the pore system of clay minerals. When most of primary adsorption sites are utilized, the water molecules will be trapped in secondary adsorption sites. As the adsorption process goes on, the forming water cluster grows and secondary adsorption is influenced by pore structure. The bigger and richer pore space is beneficial for the growth, bridging and condensation of water clusters. The pore structure of montmorillonite is more developed than that of illite. Pore volume, PSD and surface area of montmorillonite have the advantages over those of illite. Hence, the more developed pore system of montmorillonite brings about the stronger adsorption for water molecules in secondary sites. Moreover, secondary adsorption uptake has a negative correlation with experiment temperature. As verified through Tang et al. (2017), owing to the improvement of mobility of water molecules, the water clusters are more difficult to form on secondary adsorption sites at high temperature condition. Accordingly, high temperature is harmful for secondary adsorption of water.
Fig. 6(e) and (f) compare primary adsorption and secondary adsorption on illite and montmorillonite, respectively. For the non-swelling clay of illite, when P is low, primary adsorption contribution is greater, while secondary adsorption has a bigger contribution under high P range. When studying water adsorption on coal, Charriere and Behra (2010) also indicated that the uptake on secondary adsorption sites will exceed that on primary adsorption sites under high P condition. Thereby, at the early stage of adsorption, the influence of surface chemistry for non-swelling clay on the adsorption process is more obvious, while the pore structure for non-swelling clay has a more important impact on the adsorption process at the late stage. For the swelling clay of montmorillonite, over the whole P range, the contribution of primary adsorption predominates over that of secondary adsorption, which is in agreement with the observation about water adsorption on gas-bearing formations (Duan and Li, 2018). Hence, the influence of surface chemistry for swelling clay on water adsorption is more noticeable than the effect of pore structure of swelling clay on the adsorption of water during the whole adsorption process. In addition, on two clays, temperature affects secondary adsorption more manifestly, illustrating that temperature has a smaller influence on water-surface functional groups interaction than that on the formation of water clusters.
Combing Fig. 6(a) to (d), it can be seen that the difference in the uptakes of two clays in primary adsorption sites is evidently bigger than that in secondary adsorption sites. Thus, the difference in water molecules adsorption in non-swelling and swelling clays is mainly due to the difference in primary adsorption. Primary adsorption is mainly affected through surface chemistry. Correspondingly, the different water molecules adsorption performances on non-swelling and swelling clays are mainly resulted from the difference in surface chemistry of two clays.
The comparison of isothermal adsorption curves on three adsorption sites for water molecules on illite and montmorillonite is given in Fig. 6(g) and (h), respectively. The isotherms of primary adsorption present the characteristics of type I isotherm, suggesting that primary adsorption mechanism is monolayer adsorption. The rapid improvement in the uptake under the low P condition is attributed to the enhancement in the interactions of adsorbent-adsorbate within the narrow micropores (Thommes et al., 2015). For illite and montmorillonite, the surface functional groups lead to the quick adsorption on primary adsorption sites. In general, type I isotherm can be well simulated by Langmuir model. When adopting Langmuir model to deal with primary adsorption data on two clays, it indicates that the calculation results agrees well with the experiment values. For Langmuir model, one of basic assumptions is that there is no interaction between molecules adsorbed on neighboring sites (Duan, 2017). It is reasonably considered that the adsorbed molecules on primary adsorption sites have ignorable effect on neighboring adsorbed molecules, and the distribution of functional groups on clay minerals surface is scattered.
The secondary adsorption isotherms have the characteristics of type III isotherm. Type III isotherm suggests that clay surface-water molecules interaction is weaker and injected water molecules are clustered on secondary adsorption sites.
It is noteworthy that water molecules isotherms on total adsorption sites belong to type II isotherm. The first inflection point in type II isotherm usually illustrates the completion of monolayer adsorption, and the subsequently gradual curve corresponds to the significant overlap of monolayer adsorption and multilayer adsorption beginning (Thommes et al., 2015). As described in Fig. 6(g) and (h), the shape for isothermal adsorption curve on total sites is determined through secondary and primary adsorptions. For water molecules adsorption on porous carbon material, the isothermal adsorption curves on total adsorption sites are a function of pore structure property, the density and distribution of primary adsorption sites and experiment pressure (Svabova et al., 2011). Under low P condition, the rapid enhancement of uptake in total sites is due to preferential primary adsorption. With increasing P, monolayer coverage continuously completes, and the contribution of secondary adsorption constantly improves, resulting in the gradual adsorption isotherm on total sites. Under high P range, the growth and condensation of water clusters can explain the quick increase of isotherms on total adsorption sites. By comparing the adsorption isotherms on total adsorption sites on illite and montmorillonite, it can be seen that although the adsorption isotherms on total adsorption sites on two clays all have type II isotherm features, the two types of adsorption isotherms are differentiated. For the non-swelling clay (illite), owing to the less surface functional groups and the more significant contribution of secondary adsorption at the late phase, the rapid increase of isotherm on total adsorption sites at low P region is not noticeable, and the increase of isotherm on total adsorption sites at high P region is extremely sharp. For the swelling clay (montmorillonite), due to the sufficient surface functional groups and the more significant contribution of primary adsorption over the whole vapor pressure range, the adsorption isotherm on total adsorption sites at low P range is very steep, and the increase of isotherm on total adsorption sites at high P range is slight.
Fig. 7(a) shows the ratio of primary adsorption to secondary adsorption (a1/a2) on illite and montmorillonite. Apparently, the increase in vapor pressure reduces the value of a1/a2. The a1/a2 value on montmorillonite is bigger than that on illite, indicating the greater difference between primary adsorption and secondary adsorption on montmorillonite. Meanwhile, at 293 K, the value of a1/a2 is the smallest, while a1/a2 has the biggest value at 313 K. Decreasing temperature reduces the difference between primary adsorption and secondary adsorption. Percentage of uptake on secondary sites in total uptake (a2/a) is displayed in Fig. 7(b). The value of a2/a enhances as the vapor pressure increases, which elucidates that raising vapor pressure improves the contribution of secondary adsorption. The value of a2/a on montmorillonite is less than 30%, while a2/a value on illite can increase more than 60%. Illite has a larger a2/a value than montmorillonite, confirming that the influence of secondary adsorption on the adsorption of water molecules on illite is more apparent. In addition, the higher temperature corresponds to the lower value of a2/a. Under high temperature range, the clustering of water molecules are difficult on secondary adsorption sites, causing the decrease in a2/a.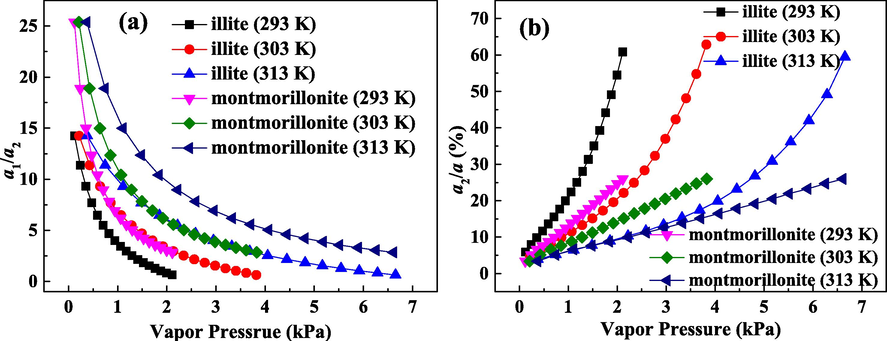
Ratio of primary adsorption to secondary adsorption (a) and percentage of adsorption quantity on secondary adsorption sites in total adsorption quantity.
4.3.3 Adsorption affinities on illite and montmorillonite for water molecules
The values of Henry’s constant (KAA) on illite and montmorillonite for water molecules are shown in Table 5. The value of KAA at 293 K is the highest, while the value of KAA at 313 K is the lowest. Hence, high temperature decreases the affinities on total sites, primary sites and secondary sites. The reduction in affinity is accordant with the decrease in uptake.
Adsorbent
T (K)
KAA (mmol/g/kPa)
total adsorption sites
primary adsorption sites
secondary adsorption sites
illite
293
0.9818
0.8469
0.0415
303
0.6161
0.5176
0.0205
313
0.3372
0.2801
0.0093
montmorillonite
293
75.0797
63.1012
1.2573
303
41.2797
34.4935
0.6811
313
21.3728
17.7501
0.1999
KAA value on secondary sites is the lowest, while total sites have the highest value of KAA. The KAA value on primary sites is close to that on total sites. On illite, KAA values in primary sites are more than 20 times bigger than those in secondary sites. On montmorillonite, KAA values on primary sites are more than 50 times bigger than those in secondary sites. Secondary sites have evidently weaker affinity for water molecules than primary sites. Giving that the estimation of KAA is according to adsorption data in low pressure range, water molecules will be preferentially retained on primary sites at the initial phase of adsorption. The very low KAA value on secondary sites illuminates the extremely weak interaction of secondary sites and water molecules. Accordingly, secondary adsorption is mainly triggered by water clusters formation with the help of hydrogen bonding between water molecules. Furthermore, the difference in KAA on secondary and primary sites on montmorillonite is bigger. Thereby, compared with non-swelling clay (illite), swelling clay (montmorillonite) has a significantly stronger affinity in primary sites than that in secondary sites, which can be adopted to explain the larger value of a1/a2 on montmorillonite.
As Table 5 displays that KAA values on three adsorption sites on montmorillonite are all more than one order of magnitude higher than those on illite. Montmorillonite has the stronger adsorption affinity for water molecules than illite. Therefore, swelling clay is more important for water adsorption on mineral dust.
4.4 Thermodynamics properties for water molecules adsorption on illite and montmorillonite
4.4.1 Analysis of surface potential
Fig. 8(a), (c) and (e) describe the calculated surface potentials (Ω) on illite in total, primary and secondary sites, respectively. The calculated Ω on montmorillonite in total, primary and secondary sites are reported in Fig. 8(b), (d) and (f), respectively. On three adsorption sites, the value of Ω becomes more negative as the vapor pressure increases, which suggests that water molecules adsorption needs more isothermal work under the high P condition. For the adsorption of CH4 on kaolinite clay, CH4 will be firstly adsorbed in the surface sites with larger energy and then retained in lower energy surface sites (Xiong et al., 2017). For primary adsorption on two clays, once the high-binding energy adsorption sites are occupied, the adsorbates are only retained in surface sites with low-binding energy. For secondary adsorption on two clays, with the increase of water clusters size, the growth of water clusters is more confined by pore space, and the gathering of water molecules on pre-formed clusters is more difficult. Accordingly, to maintain water molecules in the adsorbed state at the high P, more isothermal work is necessary, leading to the larger absolute value of Ω.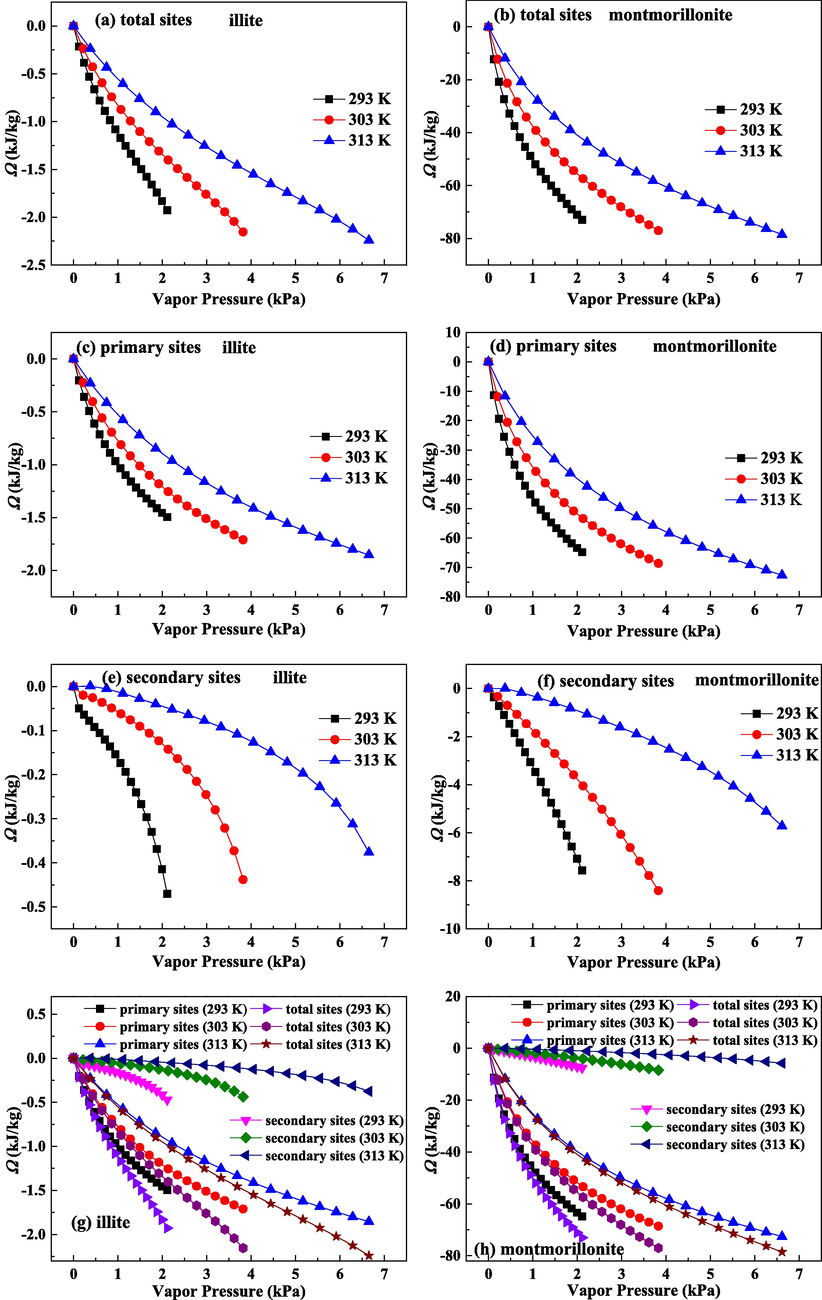
Surface potentials for water molecules on total adsorption sites, primary adsorption sites and secondary adsorption sites for illite and montmorillonite.
On the three adsorption sites, as P decreases down to zero, Ω values are close to zero. At low pressure (loading) condition, the adsorbents in contact with molecules have the same chemical potential with the adsorbents without contact with molecules (Ridha and Webley, 2010). Accordingly, the reduction in pressure causes surface potential close to zero. It is noted that on three adsorption sites, the absolute values of Ω decline monotonically with the improvement of temperature, agreeing with the observations of Duan (2017). Because Ω is in relation to the isothermal work needed for the achievement of adsorption equilibrium, the smaller uptake gives rise to the less negative surface potential. Thereby, Ω declines with increasing temperature.
Fig. 8(g) and (h) give the results of comparison of Ω in three sites on illite and montmorillonite, respectively. Ω value of primary adsorption is apparently more negative than that of secondary adsorption, suggesting that the adsorption of water molecules in primary sites needs more isothermal work. The curves of surface potential on total adsorption sites are close to those on primary adsorption sites, especially under the low P range. Ω on primary adsorption sites provides the main contribution for Ω on illite and montmorillonite.
By comparing Ω on illite and montmorillonite, we can find that the absolute values of Ω on three adsorption sites on montmorillonite are all greater than those on illite. In addition, the difference in Ω on secondary adsorption sites on two clays is lower than that on primary adsorption sites on two clays. Hence, the difference in water molecules adsorption quantities in secondary sites on two clays is smaller than that in primary sites on two clays.
4.4.2 Analysis of variation of Gibbs free energy
Under constant temperature and pressure condition, increment of free energy of the investigated system with increasing unit area of material is defined as variation of Gibbs free energy (ΔG) (Zhou et al., 2011). The force field imbalance of surface atoms results in the appearance of ΔG (Nie et al., 2000). Because the system with smaller energy is steadier, the adsorption system can spontaneously adsorb other molecules to decrease its surface free energy (Zhou et al., 2011). Therefore, the bigger variation for surface free energy corresponds to the greater power for adsorbent to adsorb molecules to reduce energy, and the adsorption spontaneity can be reasonably evaluated by ΔG.
The calculated ΔG in total, primary and secondary sites on illite are described in Fig. 9(a), (c) and (e), respectively. ΔG on montmorillonite in total, primary and secondary sites are shown in Fig. 9(b), (d) and (f), respectively. ΔG values on three adsorption sites on two clays are all negative, suggesting that water adsorptions in two clays are spontaneous. As plotted in Fig. 9(a) and (b), on the total adsorption sites, with enhancing pressure, the absolute values of ΔG on two clays enhance quickly to the maximum value and then decrease gradually. Especially for ΔG on total adsorption sites on illite, the reduction in ΔG corresponds to the smaller initial vapor pressure. Accordingly, vapor pressure has a more noticeable influence on spontaneity of water molecules adsorption on illite. Improving vapor pressure can increase adsorption spontaneity on two clays at the early stage, while improving vapor pressure at the late stage is detrimental to the spontaneity of water molecules adsorption on two clays.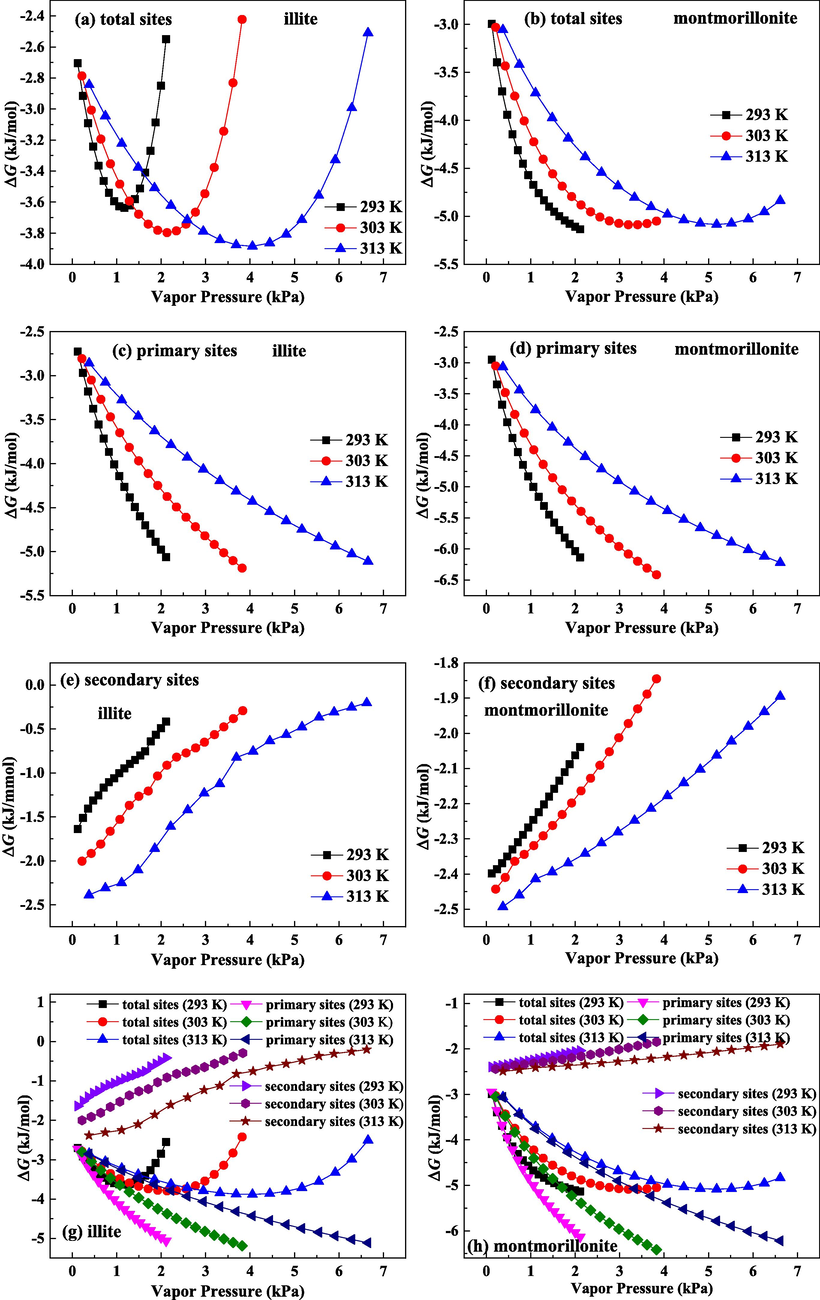
Gibbs free energy change for water molecules on total adsorption sites, primary adsorption sites and secondary adsorption sites for illite and montmorillonite.
Fig. 9(c) and (d) display the calculated ΔG on primary adsorption sites on illite and montmorillonite, respectively. The absolute values of ΔG on primary adsorption sites on two clays increase constantly as the vapor pressure increases, indicating that increasing vapor pressure will improve the spontaneity of primary adsorption. Therefore, high pressure is beneficial for primary adsorption on two clays.
As shown in Fig. 9(e) and (f), the absolute values for ΔG on secondary adsorption sites on two clays decline monotonously with the increase of vapor pressure, which illuminates that increasing pressure reduces secondary adsorption spontaneity. Therefore, high pressure results in the more difficult adsorption on secondary sites. Water clusters size keeps getting bigger as pressure improves. On the one hand, the formed water clusters at the openings of the pore channels will evidently block the pore structure and decrease the available pore volume (Svabova et al., 2011). On the other hand, the growing water clusters can separate the continuous pore structure into several isolated pore space and decrease the pore connectivity (Brennan et al., 2002). Accordingly, the water clusters are more difficult to grow at high pressure condition. These growing clusters explain the ΔG decrease in secondary sites.
Fig. 9(g) and (h) compare the calculated ΔG on three adsorption sites on illite and montmorillonite, respectively. Absolute value for ΔG of primary adsorption is bigger than that of secondary adsorption, suggesting that secondary adsorption has a lower spontaneity than primary adsorption. Hence, under low P range, water molecule will be preferentially adsorbed on primary sites, and primary adsorption offers main contribution to ΔG on total sites. Under high P range, primary adsorption reaches saturation, and secondary adsorption sites are the main available adsorption sites. ΔG on total adsorption sites is mostly affected through secondary adsorption, and the reduction in ΔG on total sites at the late stage of adsorption is resulted from the constant decrease of ΔG of secondary adsorption.
As depicted in Fig. 9, the effects of temperature on ΔG of secondary adsorption and primary adsorption are different. Improving temperature can decrease ΔG of primary adsorption, but it can increase ΔG of secondary adsorption. Hence, high temperature reduces the spontaneity of primary adsorption and raises the spontaneity of secondary adsorption. The increase in temperature weakens the interaction of water molecules-surface functional groups, leading to the lower ΔG of primary adsorption. On secondary sites, water clusters are not readily formed under high temperature. The influence of growing water clusters on pore accessibility and connectivity becomes smaller as the temperature improves, bringing about the higher ΔG of secondary adsorption.
Comparing ΔG on illite and montmorillonite, the absolute values of ΔG on three adsorption sites on illite are all lower than those on montmorillonite. Thereby, swelling clay (montmorillonite) has the higher adsorption spontaneity for water molecules than non-swelling clay (illite).
4.4.3 Analysis of isosteric heat of adsorption
Isosteric heat of adsorption (Qst) can quantify the strength of adsorbent-adsorbate bonding and provide the valuable information on the nature of adsorbed phase and adsorbent (Sircar, 1991). The Qst for illite and montmorillonite are reported in Fig. 10(a) and (b), respectively. Enthalpy change values (−Qst) on two clays are negative, revealing that water molecules adsorption process on two clays are exothermic. Accordingly, high temperature inhibits water molecules adsorption on two clays.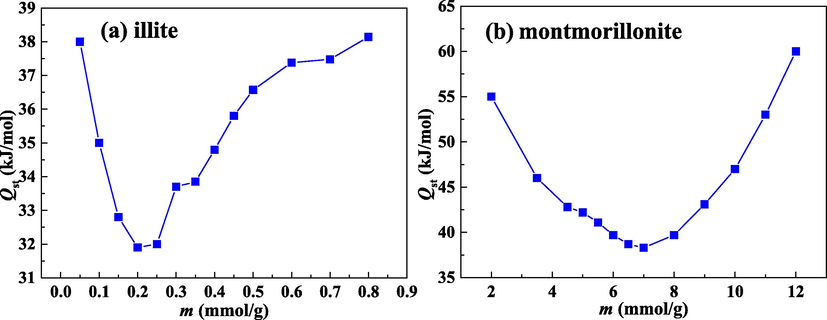
Isosteric heat of adsorption for water molecules on illite (a) and montmorillonite (b).
With the increase of adsorption quantity, the change of Qst is not constant. As the uptake increases, Qst declines rapidly to the minimum value and then enhances continuously. The value of Qst is governed by adsorbate-adsorabate interaction and adsorbate-adsorbent interaction (Chakraborty et al., 2006). The decrease of Qst at the low loading region reflects the surfaces of two clays are energetically heterogeneous. First, the injected water molecules will be retained on high-binding energy primary adsorption sites. Then, owing to the energy heterogeneity of adsorption sites, the subsequent water molecules will be retained on low-binding energy primary sites. Hence, Qst reduces within the low loading range. The decrease of Qst also suggests that the interaction of adsorbate-adsorbent is predominant in initial adsorption process. With constantly increasing loading, primary adsorption sites are occupied, and water molecules will be clustered on the secondary adsorption sites. As more molecules are clustered on secondary sites, Qst value increases. The enhancement of Qst illustrates that the interaction of adsorbate–adsorbate is dominated during late adsorption process. Moreover, the enhancement of Qst demonstrates indirectly that the mechanism of secondary adsorption for water molecules is by forming water clusters.
It can be seen from Fig. 10 that montmorillonite has a larger value of Qst than illite, which shows that water molecules adsorption on montmorillonite generates more heat. Therefore, swelling clay (montmorillonite) has a stronger interaction with water molecules than non-swelling clay (illite). In addition, the decrease range of Qst for illite is smaller than that for montmorillonite, suggesting that the energy heterogeneity of illite surface is lower than that of montmorillonite surface.
4.4.4 Analysis of entropy change
Entropy change (ΔS) is related to confined mobility of molecules and the specific adsorbent-adsorbate interaction (Duan 2017). Fig. 11(a) and (b) show the calculated ΔS on illite and montmorillonite, respectively. The values of ΔS on two clays are both negative, revealing the reduction in randomness at the gas/solid interface. Thereby, after the adsorption process, the adsorbed molecules are from an unrestricted state to a restricted state, and a more ordered packing is formed on the material surface.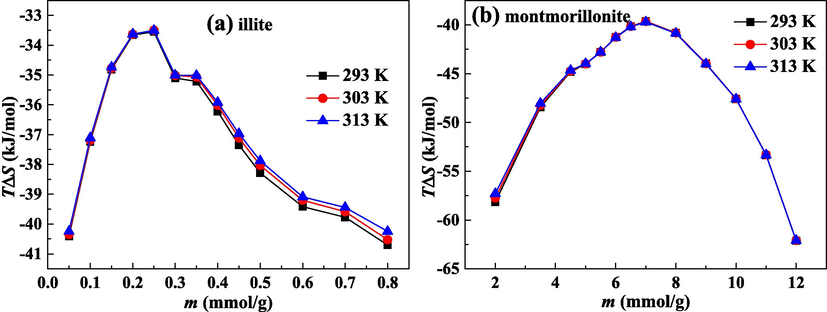
Entropy loss for water molecules on illite (a) and montmorillonite (b).
With the improvement of loading, the absolute values of ΔS on two clays first decline and then increase. The change of ΔS with loading shows the process of water molecules adsorption on two clays is heterogeneous. Under the low loading range, water molecules are mainly trapped on primary sites, and ΔS value is mainly influenced by the interaction of primary sites-water molecules. At the early phase of adsorption, water molecules will be selectively retained in primary sites with greater binding energy. Consequently, water molecules movement is significantly confined. As primary sites are further adopted, the primary adsorption sites with smaller binding energy become available for water molecules. Accordingly, the interaction of primary sites-water molecules becomes weaker, and the adsorbed molecules are more likely to escape from the adsorption site. Hence, with increasing loading, the absolute values of ΔS and the degree of system orderliness decline. Under late stage of adsorption, secondary adsorption plays the main role in the adsorption process, and ΔS value is influenced by the available pore volume. The smaller pore size can result in the higher ΔS (Myers, 2004). In the larger pore space, the formation of more distinct layer always produces the lower ΔS (Keffer et al., 1996). As more water molecules are clustered on secondary adsorption sites, the water clusters size enlarges. Under the same pore space, the movement of bigger water clusters is more confined. Thereby, the absolute value of ΔS and the degree of system orderliness improve at the high loading condition.
For the study of fluid adsorption on 5A and 13X zeolites, it is found that the more ordered packing of adsorbed molecules leads to the release of more heat (Duan, 2017). Accordingly, the absolute value of ΔS exhibits a positive correlation with Qst. Combining Fig. 10 and Fig. 11, we can see that the larger absolute value of ΔS on montmorillonite corresponds to the higher Qst on montmorillonite.
By analyzing the performances of entropy change of water molecules on two clays, it is evident that the absolute value of ΔS on montmorillonite is greater than that on illite. The stronger interaction of water molecules and swelling clay of montmorillonite brings about the more efficient arrangement of adsorbed water molecules on clay surface. The movement of adsorbed water molecules on swelling clay is more confined than that on non-swelling clay, and the disorderliness degree of adsorption system of water molecules and swelling clay is lower than that of water molecules and non-swelling clay.
Obviously, in comparison with ΔS values for CO2 and CH4 on montmorillonite ΔS value on montmorillonite of water molecules is significantly larger than those of CH4 and CO2, which is in agreement with the research result of Myers (2004) that polar molecules have a significantly larger standard entropy than nonpolar molecules. Meanwhile, the adsorbed CH4 molecules are more inclined to retain on the material surface by forming layers, while the injected water molecules are trapped into the pore structure by the formation of three-dimensional clusters network (Brennan et al., 2002). Hence, the adsorption construction of water molecules on clay is more firm. The adsorbed water molecules can easily replace the pre-adsorbed CH4 molecules on the adsorption sites, which causes the negative influence on CH4 adsorption behavior.
5 Conclusions
In this work, adsorption performances for water molecules on swelling clay of montmorillonite and non-swelling clay of illite were investigated. The thermodynamics of adsorption for water molecules in two clays was discussed. These following results have been reached:
Adsorption quantity for water molecules in montmorillonite is one order of magnitude higher than that in illite. The adsorption for water molecules in primary sites is governed through surface chemistry. Secondary adsorption of water molecules is determined by pore structure. For montmorillonite, the uptakes in primary sites are always higher than those in secondary sites. For illite, the contribution of primary adsorption is greater under low P range, while secondary adsorption has a larger contribution under high P range. Difference in the uptakes of water on non-swelling and swelling clays is mainly resulted from the difference in primary adsorption on two clays.
The Henry’s constant, entropy change, surface potential, isosteric heat of adsorption and variation of Gibbs free energy of montmorillonite are all higher than those of illite. Water molecules has an evidently bigger adsorption affinity on swelling clay than that on non-swelling clay. Swelling clay has a higher adsorption spontaneity for water molecules than non-swelling clay. The interaction of swelling clay-water molecules is stronger than that of non-swelling clay-water molecules. The movement of adsorbed water molecules in swelling clay is more confined than that in non-swelling clay.
Data availability
The data applied to support the results in this study are available from the corresponding author upon request.
Acknowledgements
This study was funded by Yunnan Fundamental Research Projects (Grant no. 202101BE070001-039), Yunnan Provincial Department of Education Science Research Fund Project (Grant no. 2022J0055), and National Natural Science Foundation (Grant no. 81860565).
Declaration of Competing Interest
The authors declare that they have no known competing financial interests or personal relationships that could have appeared to influence the work reported in this paper.
References
- Clustering of water molecules in ultramicroporous carbon: In-situ small-angle neutron scattering. Carbon. 2017;111:681-688.
- [Google Scholar]
- Isosteric heat of water adsorption and desorption in homoionic alkaline-earth montmorillonite. Chem. Phys.. 2018;501:26-34.
- [Google Scholar]
- Adsorption of water in activated carbons: Effects of pore blocking and connectivity. Langmuir. 2002;18:5438-5447.
- [Google Scholar]
- Gas adsorption by nanoporous materials: Future applications and experimental challenges. Mrs Bull.. 2013;38(5):412-421.
- [Google Scholar]
- On the thermodynamic modeling of the isosteric heat of adsorption and comparison with experiments. Appl. Phys. Lett.. 2006;89:171901
- [Google Scholar]
- Effects of composition and temperature on water sorption in overmature Wufeng-Longmaxi shales. Int. J. Coal Geol.. 2021;234:103673
- [Google Scholar]
- Effects of exchanged cation and layer charge on the sorption of water and EGME vapors on montmorillonite clays. Clay. Clay Miner.. 1997;45(6):867-880.
- [Google Scholar]
- A thermodynamics study of CO2 and CH4 adsorption on Sichuan basin shales. Chongqing, China: Chongqing University; 2017.
- Equilibrium and kinetics of water vapor adsorption on shale. ASME J. Energy Resour. Technol.. 2018;140:122001-1-122001-9.
- [Google Scholar]
- Water adsorption isotherm and its effect on pore size distribution of clay minerals. J. China Univ. Petroluem. 2018;42:110-118.
- [Google Scholar]
- Water adsorption and its impact on the pore structure characteristics of shale clay. Appl. Clay Sci.. 2018;155:126-138.
- [Google Scholar]
- Investigation of smectite hydration properties by modeling experimental X-ray diffraction patterns: Part I. Montmorillonite hydration properties. Am. Mineral.. 2005;90:1358-1374.
- [Google Scholar]
- Adsorption, Surface Area and Porosity (2nd ed.). New York: Academic Press; 1982.
- Pore size determination in modified micro- and mesoporous materials. Pitfalls and limitations in gas adsorption data analysis. Micropor. Mesopor. Mat.. 2003;60(1–3):1-17.
- [Google Scholar]
- Water adsorption on clay minerals as a function of relative humidity: Application of BET and Freundlich adsorption models. Langmuir. 2012;28:1790-1803.
- [Google Scholar]
- Molecular dynamics simulations of water and sodium diffusion in smectite interlayer nanopores as a function of pore size and temperature. J. Phys. Chem.. 2014;118:1001-1013.
- [Google Scholar]
- Relationship between methane adsorption capacity of clay minerals and micropore volume. Natural Gas Geosci.. 2014;25(2):141-152.
- [Google Scholar]
- The effect of nanopore shape on the structure and isotherms of adsorbed fluids. Adsorption. 1996;2:9-21.
- [Google Scholar]
- Review of experimental sorption studies of CO2 and CH4 in shales. J. Nat. Gas Sci. Eng.. 2020;73:103045
- [Google Scholar]
- Specific surface area and pore-size distribution in clays and shales. Geophys. Prospect.. 2013;61:341-362.
- [Google Scholar]
- Molecular simulation study of montmorillonite in contact with water. Ind. Eng. Chem. Res.. 2019;58:1396-1403.
- [Google Scholar]
- An investigation into the thermodynamic characteristics of methane adsorption on different clay minerals. J. Nat. Gas Sci. Eng.. 2016;33:1046-1055.
- [Google Scholar]
- Water vapor sorption behavior of smectite-kaolinite mixtures. Clay. Clay Miner.. 2002;50(5):553-561.
- [Google Scholar]
- CO2/CH4 competitive adsorption in shale: Implications for enhancement in gas production and reduction in carbon emissions. Environ. Sci. Technol.. 2019;53:9328-9336.
- [Google Scholar]
- Characterization of water adsorbed on bituminous coals. Energ. Fuel.. 2003;17:107-112.
- [Google Scholar]
- Experimental investigation and thermodynamic modeling of CH4/N2 adsorption on zeolite 13X. J. Chem. Eng. Data. 2015;60(3):683-696.
- [Google Scholar]
- Adsorption of water vapor by montmorillonite. I. Heat of desorption and application of BET theory. J. Am. Chem. Soc. 1952;74:1367-1371.
- [Google Scholar]
- Adsorption of water vapor by montmorillonite. II. Effect of exchangeable ions and lattice swelling as measured by X-ray diffraction. J. Am. Chem. Soc. 1952;74:1371-1374.
- [Google Scholar]
- Characterization of nanopores by standard enthalpy and entropy of adsorption of probe molecules. Colloid. Surface. A.. 2004;241:9-14.
- [Google Scholar]
- Overview of the adsorption and transport properties of water, ions, carbon dioxide, and methane in swelling clays. ACS Earth Space Chem.. 2021;5:2599-2611.
- [Google Scholar]
- Surface free energy of coal and its calculation. J. Taiyuan Univ. Technol.. 2000;31(4):346-348.
- [Google Scholar]
- Relation between swelling, surface-area and B-dimension of Na-montmorillonite. Clay. Clay Miner.. 1978;26:345-351.
- [Google Scholar]
- Review of gas adsorption in shales for enhanced methane recovery and CO2 storage. J. Petrol. Sci. Eng.. 2019;175:634-643.
- [Google Scholar]
- Entropic effects and isosteric heats of nitrogen and carbon dioxide adsorption on chabazite zeolites. Micropor. Mesopor. Mat.. 2010;132:22-30.
- [Google Scholar]
- The importance of shale composition and pore structure upon gas storage potential of shale gas reservoir. Mar. Petrol. Geol.. 2009;26:916-927.
- [Google Scholar]
- The theoretical maximum isosteric heat of adsorption in the Henry’s law region for slit-shaped carbon nanopores. Carbon. 2008;46(4):644-648.
- [Google Scholar]
- Isosteric heats of multicomponent gas adsorption on heterogeneous adsorbent. Langmuir. 1991;7:3065-3069.
- [Google Scholar]
- Water vapor sorption on Marcellus shale: measurement, modeling and thermodynamic analysis. Fuel. 2017;209:606-614.
- [Google Scholar]
- Adsorption affinity of different types of coal: Mean isosteric heat of adsorption. Energ. Fuel.. 2015;29:3609-3615.
- [Google Scholar]
- Physisorption of gases, with special reference to the evaluation of surface area and pore size distribution (IUPAC Technical Report) Pure Appl. Chem.. 2015;87(9–10):1051-1069.
- [Google Scholar]
- Experimental study of water vapor adsorption behaviors on shale. Fuel. 2019;248:168-177.
- [Google Scholar]
- Research status of occupational pneumoconiosis and dust prevention and control technology. Journal of Wuhan University of Technology (Information & Management Engineering). 2022;44(1):39-44.
- [Google Scholar]
- Adsorption behavior of methane on kaolinite. Ind. Eng. Chem. Res.. 2017;56:6238-6299.
- [Google Scholar]
- Layer charge effects on adsorption and diffusion of water and ions in interlayers and on external surfaces of montmorillonite. ACS Earth Space Chem.. 2019;3(11):2635-2645.
- [Google Scholar]
- Physical and structural changes in shale associated with supercritical CO2 exposure. Fuel. 2016;184:289-303.
- [Google Scholar]
- Progress in the pathogenesis and drug treatment of pneumoconiosis. Central South Pharmacy. 2019;17(7):1051-1055.
- [Google Scholar]
- Thermodynamic analysis of competitive adsorption of CO2 and CH4 on coal matrix. J. China Coal Soc.. 2011;36(8):1307-1311.
- [Google Scholar]
- Supercritical isothermal adsorption characteristics of shale gas based on gravimetric method. J. China Coal Soc.. 2016;41(11):2806-2812.
- [Google Scholar]
- Thermodynamics for the adsorption of SO2, NO and CO2 from flue gas on activated carbon fiber. Chem. Eng. J.. 2012;200–202:399-404.
- [Google Scholar]
- Water sorption behaviour of gas shales: I. Role of clays. Int. J. Coal Geol.. 2017;179:130-138.
- [Google Scholar]


