

Translate this page into:
Synthesis and characterization of CuO nanoparticles utilizing waste fish scale and exploitation of XRD peak profile analysis for approximating the structural parameters
⁎Corresponding author. saminaahmed@bcsir.gov.bd (Samina Ahmed)
-
Received: ,
Accepted: ,
This article was originally published by Elsevier and was migrated to Scientific Scholar after the change of Publisher.
Peer review under responsibility of King Saud University.
Abstract
Abstract
In this research, we strived to utilize waste fish scale (labeo rohita) for synthesizing CuO nano-particles (CuO NPs), which gained much attention due to its distinctive properties and versatile applications. Upon the heat treatment, the collagen content of the fish scale got transformed into gelatin which in turn converted the precursor material into CuO NPs. The X-Ray diffraction (XRD) analysis confirmed the formation of CuO NPs and revealed the structure to be of monoclinic lattice. The structural parameters i.e. crystallite size, lattice parameters, microstrain, dislocation density was evaluated for the synthesized CuO NPs using the XRD data. Scherrer’s Method (SM), Scherrer Equation Average Method (SEAM), Linear Straight Line Method (LSLM), Straight Line Passing the Origin Method (SLPOM), Monshi Scherrer Method (MSM), Williamson-Hall Method (WHM), Size-Strain Plot Method (SSPM), Halder-Wagner Method (HWM) was exploited for the estimation of crystallite size. According to the calculations, the crystallite size was found to be 87 nm, 41 nm, 1980 nm, 62 nm, 66 nm, 28 nm, 13 nm, 13 nm respectively and the dislocation density was found to be 1.32 × 10⁻⁴, 5.95 × 10⁻⁴, 0.002 × 10⁻⁴, 2.60 × 10⁻⁴, 2.29 × 10⁻⁴, 12.75 × 10⁻⁴, 59.17 × 10⁻⁴ and 59.17 × 10⁻⁴ respectively. UV–Vis absorption analysis also confirmed the formation of CuO NPs based on the absorption peak at 262 nm (λmax) and Tauc Plot method was used to calculate the optical band gap which was 3.84 eV. Functional group, especially the Cu-O bonding was confirmed by the Attenuated Total Reflectance-Fourier Transform Infrared Spectroscopy (ATR-FTIR) data. Field Emission Scanning Electron Microscopy (FESEM) showed three different shapes of CuO NPs which was also confirmed by Transmission Electron Microscopy (TEM). Particle size was determined based on FESEM and TEM image using imageJ software and also by the Dynamic Light Scattering (DLS) technique. Thermal analysis showed a four stage weight loss in case of Thermogravimetric (TGA) analysis and three conversion steps was observed in Differential Scanning Calorimetric (DSC) analysis. Such synthesis pathway is evidently green and facile for synthesizing CuO NPs with potentiality of various applications and also utilization of waste fish scale is a perquisite.
Keywords
Copper (II) oxide
Nanoparticle Synthesis
Fish Scale
Green Synthesis
Crystallite Size Determination

1 Introduction
Disparate from bulk materials, the properties of nano-materials have been under the scrutiny of researchers since the emergence of modern science and technology which was accomplished by the aid of nanotechnology (Abboud et al., 2014; Berra et al., 2018). The research and engineering that are done with materials at nano-scale level for the evolution of newer technologies is defined as nanotechnology. One example for the sublimity of nanotechnology is that, for a material with the same composition, the melting point is lower for the nano-sized material compared to the bulk material (Chavali and Nikolova, 2019). Nanotechnology is considered as the pivotal technological aspects of 21st century since it has been the building block of technological advancement and also possesses immense potential to revolutionize any industrial sector (Jeelani et al., 2020; Verma et al., 2019). Among a myriad amount of nanoparticles, metal oxide nanoparticles received considerable amount of interest as they exert some eccentric optical, electronic and magnetic properties. The oxides of transition metals are of great interest because of their applications in catalysis (Sadri et al., 2014), electronics (Shen et al., 2009; Zhou et al., 2019), magnetic storage media (Crowley et al., 2003), gas sensors (Miller et al., 2014), solar energy transformations, etc. (Taghavi Fardood and Ramazani, 2016). Likewise, CuO NPs also attained quite an interest because of being the simplest member of the copper compounds and also due to its applications in catalysis (Xu et al., 2009), as thermal conductivity nano-fluids (Sone et al., 2020), sensors (Sundar et al., 2018; Zhang et al., 2006; Zhu et al., 2012), in steam reforming (Udani et al., 2009), lithium ion batteries (Yang et al., 2014), solar energy conversion (Kaneshiro et al., 2010), CO oxidation of automobile exhaust gases (Cao et al., 2008), as anti-microbial, anti-oxidant, drug delivery agent in biomedicine (Yallappa et al., 2013), in photocatalysis (Vaidehi et al., 2018), (Mustafa et al., 2013) etc. A number of synthesis methods of CuO have been exploited such as hydrothermal approach, chemical methods, sonochemical technique, thermal oxidation, thermal decomposition, precipitation methods etc. (Siddiqui et al., 2021). These techniques involve the use of toxic chemicals and energy consuming synthesis pathways which makes them repugnant to environment and apathetic to industrial applications. In addition to that, the increasing concern about energy crisis and convoluted challenges of physical and chemical approaches made the researchers to strive for alternative facile routes (Cuong et al., 2021). In order to eliminate aforementioned demerits, development of an eco-friendly, non-toxic and bio-compatible route of synthesis is a prerequisite and “green” chemistry is one of the resolutions where environment-friendly cost effective reducing agents are utilized. In this regard, labeo rohita fish scale, which is discarded daily from kitchen and fish market as a waste material is used for synthesizing CuO NPs. Fish scales contain a large amount of necessary compounds including 40–55% of organic components such as collagen, fat, lecithin, vitamins etc and 7–25% of inorganic components such as hydroxyapatite, calcium phosphate, etc. (Chinh et al., 2019). The fish scale extract of labeo rohita is affluent with type I collagen which gets denatured at a certain temperature to form gelatin and this gelatin helps in the effective formation of CuO NPs. The present work aims for a green synthesis of CuO NPs which is eco-friendly, cost effective and utilizes a waste material into a value added product.
2 Materials and methods
2.1 Materials
The precursor materials, copper sulfate pentahydrate (CuSO4·5H2O) was procured from Sigma-Aldrich and sodium hydroxide (NaOH) which was used in controlling the pH was procured from Merck KGaA. All the reagents used were of analytical grade and no further purification was done. Deionized (DI) water was used in all sorts of experiments. Matured fish scale of labeo rohita (locally known as Rui) was collected from a local fish market at Jatrabari, Dhaka, Bangladesh.
2.2 Preparation of fish scale powder
Freshly separated (not more than one hour after separation) fish scales were soaked for thirty minutes in water to loosen the adherent skin and washed thoroughly three times with tap water to remove dirt and water-soluble impurities. Then they were sundried for 4 days, followed by oven drying at 70 °C until the scale became crisp and constant weight was achieved. The dried fish scales were then ground in a stainless steel grinder (Panasonic MX 900 M) and sieved at 200 mesh size for several minutes to maintain the sizes below 74 µm.
2.3 Preparation of fish scale solution
Finely ground fish scale powder (5 g) was placed in a 500 ml beaker in which 225 ml of DI water was added. The solution was then placed in a hot plate where the temperature was set to 60 °C for 30 min with constant stirring. After the heat treatment, the solution was allowed to cool until room temperature and then subjected to centrifugation (centurion CR4000) at 4000 rpm for 30 min. The supernatant was filtered out and kept in a refrigerator below 8 °C and used it for CuO synthesis within one week of preparation.
2.4 Synthesis of CuO nano-particles
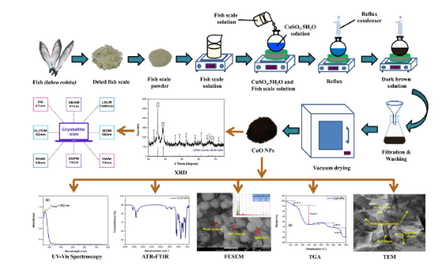
Synthesis of CuO nano-particles was initiated by taking 2 g of copper sulfate (CuSO4·5H2O) and dissolving it in 40 ml of DI water. 50 ml of 40% fish scale solution was added to CuSO4·5H2O solution and pH ∼ 9 was maintained with the addition of NaOH solution. The mixture was then subjected to reflux at 100 °C, maintaining a constant stirring with the help of a magnetic stirrer. The temperature was kept constant until the color of the solution changed from blue to dark brown. After achieving such, the solution was centrifuged and filtered. The residual dark brown mass was washed few times with DI water, absolute ethanol and acetone and then subjected to vacuum drying at 40 °C for 1 h. The synthesis scheme of CuO NPs is given in Fig. 1.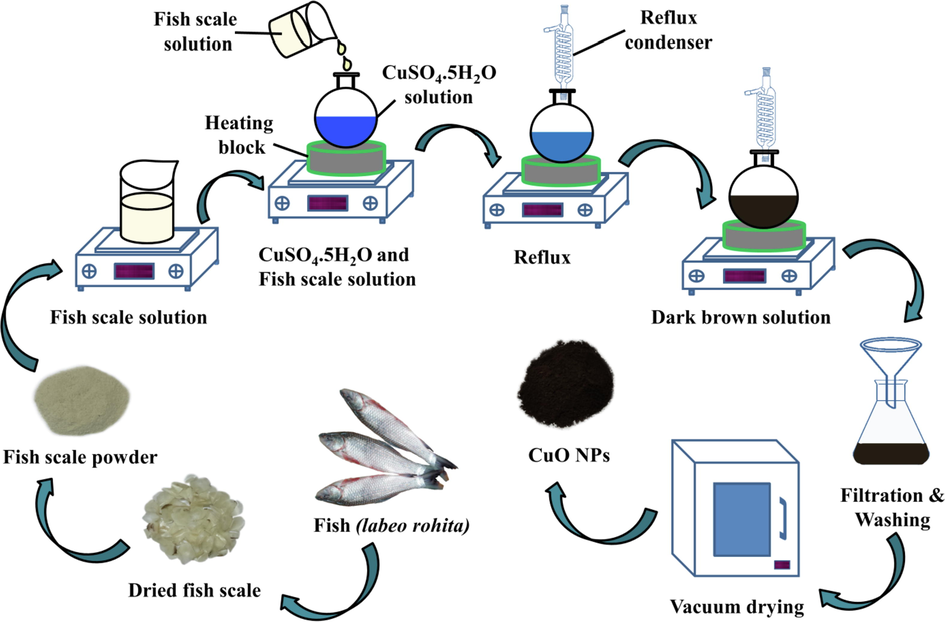
Synthesis scheme of CuO NPs from labeo rohita fish scale.
The probable mechanism for the formation of CuO NPs is depicted in the following equations (Akintelu et al., 2020):
Cu2+ (From CuSO4·5H2O) + Collagen (From Fish Scale Extract) → [Cu-collagen]2+
3 Characterization of CuO NPs
The crystalline nature of the synthesized CuO NPs was investigated by using a X-ray powder diffractometer. The XRD pattern was recorded by PANalyticalX'pert PRO XRD (PW 3040) CuKα radiation (λ = 1.54178 Å), from a broad focus Cu tube operated at 40 kV and 30 mA, was applied to the samples for measurement. The XRD pattern of the sample was measured in the continuous scanning mode with a speed of 2.5°/min and in the scan range of 30° to 75°. Bragg's law was used to compute the basal spacing of the crystalline samples.
Transmission Electron Microscopic (TEM) analysis was carried out using Talos F200X (ThermoFisher Scientific, USA) at an accelerated voltage of 200 kV. The morphological and elemental study was carried out by Field Emission Scanning Electron Microscopic (FESEM) technique using JEOL (JSM-7610F) coupled with Energy Dispersive X-ray (EDX) at an accelerating voltage of 15 kv. Prior to the FESEM analysis, the sample was coated with platinum using a sputter coater.
The particle size and zeta potential analysis was carried out by a DLS particle size analyzer (Malvern Panalytical Zetasizer Ultra) equipped with a laser (10 mW) of 632.8 nm wavelength; particle size was calculated based on Multi Angle Dynamic Light Scattering (MADLS) technology. Prior to measurements, the powdered samples were dispersed in water and then sonicated for 30 min to reduce the formation of agglomerates.
The Attenuated Total Reflectance-Fourier Transform Infrared Spectroscopic (ATR-FTIR) data of the synthesized CuO nanoparticles was collected using MIRacle-10 Single Reflection ATR accessory mounted IR Prestige-21 (Shimadzu Corporation, Japan) in the wavenumber ranging from 400 to 4000 cm−1 with resolution of 4 cm and number of scans were 30. Absorption spectral measurement was carried out by dispersing the CuO NPs into DI water & then taking measurements using Hitachi U-2910 UV–Vis spectrophotometer.
The thermal stability of the synthesized CuO NPs was investigated in terms of thermogravimetric analysis (TGA) and differential scanning calorimetric (DSC) analysis by the aid of a simultaneous thermal analyzer (NETZSCH STA 449F5). The analysis was done at a heating rate of 20°/min over a temperature range of 30 °C to 1000 °C under nitrogen atmosphere.
4 Results and discussion
4.1 X-ray powder diffraction study
The phase composition and crystallite structure of the synthesized CuO NPs were determined with the aid of x-ray powder diffraction analysis. Fig. 2. shows the xrd pattern of synthesized CuO NPs for the 2θ values in the range of 30° to 75°.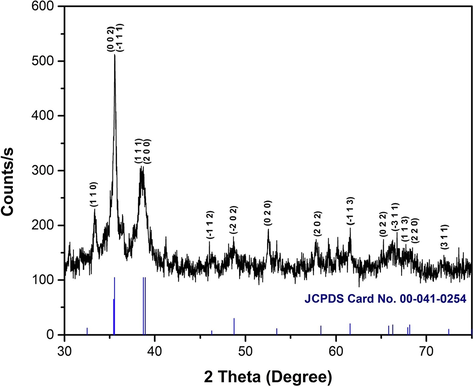
XRD powder diffraction pattern of synthesized CuO NPs.
The largest peaks are observed at the 2θ values of 35.55°, 35.57°, 38.41° and 38.73° which correspond to the crystal planes of (0 0 2), ( −1 1 1), (1 1 1) and (2 0 0) respectively. The other significant Bragg’s reflection peaks corresponds to the crystal planes (1 1 0), ( −1 1 2), ( −2 0 2), (0 2 0), (2 0 2), ( −1 1 3), (0 2 2), ( −3 1 1), (1 1 3), (2 2 0) and (3 1 1). These crystal planes and the 2θ values were in very close agreement with the JCPDS card no 00–041-0254. The xrd pattern revealed that the synthesized CuO NPs were polycrystalline in nature and depicted to be the monoclinic tenorite phase of CuO structure (Kamble and Mote, 2019; Munawar et al., 2020; Nicolaescu et al., 2021; Perkas et al., 2014; Philip et al., 2021; Shinde et al., 2016). In addition to the crystal planes and diffraction angles, the selected values of full width half maximum (FWHM, β) and related other conversions are presented in Table 1.
2θ (degree)
β = FWHM (Degree)
θ (Degree)
Cosθ (Degree)
1/Cosθ (Degree)
Ln (1/Cosθ) (Degree)
β = FWHM (Radian)
Lnβ (Radian)
4Sinθ (Degree)
β (Radian).Cosθ (Degree)
d-spacing (Å)
33.33
0.384
16.66
0.9579
1.0438
0.0429
0.0067
−5.0053
1.1473
0.0064
2.68
35.57
0.096
17.78
0.9521
1.0502
0.0489
0.0016
−6.3916
1.2219
0.0015
2.52
38.41
0.576
19.20
0.9443
1.0589
0.0572
0.0100
−4.5998
1.3158
0.0094
2.34
40.41
0.096
20.20
0.9384
1.0655
0.0635
0.0016
−6.3916
1.3815
0.0015
2.23
41.17
0.288
20.58
0.9361
1.0682
0.0660
0.0050
−5.2930
1.4066
0.0047
2.19
52.48
0.384
26.24
0.8969
1.1148
0.1087
0.0067
−5.0053
1.7685
0.0060
1.74
53.80
0.144
26.90
0.8917
1.1213
0.1145
0.0025
−5.9861
1.8098
0.0022
1.70
54.11
0.144
27.05
0.8905
1.1229
0.1159
0.0025
−5.9861
1.8195
0.0022
1.69
57.76
0.576
28.88
0.8755
1.1420
0.1328
0.0100
−4.5998
1.9321
0.0088
1.59
66.20
1.152
33.10
0.8376
1.1937
0.1771
0.0201
−3.9067
2.1845
0.0168
1.41
4.2 Crystallite size calculation using various methods
4.2.1 Scherrer’s method (SM)
Generally, the coherent volume in a material for the respective diffraction peak is referred as the crystallite size. For a powdered sample, it also corresponds to the grain size and for polycrystalline thin films, it corresponds to the thickness (Bishnoi et al., 2017). The most famous method for calculating the crystallite size of a crystalline material is the exploitation of Scherrer equation (equation (1)) (Monshi et al., 2012; Scherrer, 1912),
Here, D is the crystallite size, λ is the wavelength of x-ray (λ = 0.15405 nm for Cu Kα), β is the full width half maxima (FWHM) in radians, K is a constant, named shape factor which is related to the crystallite shape and normally taken as 0.9 and θ is the diffraction angle in degree. Many researchers calculate the crystallite size by taking the FWHM (β) of the sharpest peak. Herein, by doing so, the crystallite size of the synthesized CuO NPs was found to be 87 nm (listed in Table 4).
4.2.2 Scherrer equation average method (SEAM)
This model considers all of the selected values of FWHM (β) found in the X-ray diffraction pattern (Fig. 2) and employs them to calculate the crystallite size using scherrer equation. The final result is the average of all the values of crystallite size found for each β. The values of crystal size found through Scherrer equation and their average is presented in Table 2.
Values of FWHM (β), (radians)
Crystallite Size,
(nm)
Average Crystallite Size (nm)
0.0067
21.59
41.15
0.0016
86.90
0.0100
14.60
0.0016
88.17
0.0050
29.46
0.0067
23.06
0.0025
61.85
0.0025
61.94
0.0100
15.75
0.0201
8.23
While considering FWHM (β) for all or the selected peaks, the average crystallite size based on Scherrer equation was found to be around 41 nm (listed in Table 4) and was less than half the crystallite size found by considering FWHM (β) of the sharpest peak.
4.2.3 Linear straight line method (LSLM)
The Linear Straight Line Method (LSLM) of Scherrer’s equation was introduced to calculate the crystallite size of the synthesized CuO NPs considering all the selected peaks. This method was formulated by rearranging the existing Scherrer equation (equation (1)) and comparing it with a linear straight line equation (y = mx + c) as (Rabiei et al., 2020),
Plotting the values of cosθ in y-axis and 1/β in x-axis produced a graph of straight line from which the value of the slope can be calculated. The graph is shown in the Fig. 3.
Linear fit plot of linear straight line method (LSLM) of Scherrer’s equation for calculating crystallite size of synthesized CuO NPs.
According to equation (2), the slope of the plot is equal to which has found to be 0.00007 from Fig. 3. After calculation, the value reveals a crystallite size of 1980 nm (listed in Table 4) which is invalid since the value of crystallite size of a nanocrystal should be under 100 nm (Rabiei et al., 2020). Rabiei et al. opined that when the least squares method is exploited to fit the data according to the LSLM (equation (2)) then, certainly the y-intercept does not carry any physical meaning. To rectify the emerged consequence, it is recommended to enforce the linear plot and make it pass through the origin.
4.2.4 Straight line passing the origin method (SLPOM)
This method has been developed by Rabiei et al. (Rabiei et al., 2020) where the linear plot is forced to pass through the origin and the outcome is a reasonable slope for calculation. This SLPOM extracted all the points from Fig. 3 as the plot of y versus × points (Table 3) and introduced into the following equation (3),
Values of x
149.20
596.83
99.47
596.83
198.94
149.20
397.88
397.88
99.47
49.73
Values of y
0.9579
0.9521
0.9443
0.9384
0.9361
0.8969
0.8917
0.8905
0.8755
0.8376
After putting the values of x and y, the slope was found to be 0.0022222336 which is equal to
and hence the calculated crystallite size was 62 nm (listed in Table 4). This modification considered all the selected peaks of XRD pattern and the resultant crystallite size is somewhere in between the values obtained through SM and SEAM.
Sl. No.
Name of the Method
Acronym
Crystallite Size, nm
Remarks
01.
Scherrer’s method
SM
87
Valid
02.
Scherrer equation average method
SEAM
41
Valid
03.
Linear Straight Line Method
LSLM
1980
Not valid
04.
Straight Line Passing the Origin Method
SLPOM
62
Valid
05.
Monshi Scherrer Method
MSM
66
Valid
06.
Williamson-Hall method
WHM
28
Valid
07.
Size-strain plot method
SSPM
13
Valid
08.
Halder-Wagner Method
HWM
13
Valid
4.2.5 Monshi scherrer method (MSM)
Monshi Scherrer method or the modified Scherrer method was introduced by Monshi et al. (Monshi et al., 2012) in 2012 by bringing some modifications to the existing Scherrer equation in order to calculate the crystallite size with more precision. This method was also employed for calculating the crystallite size of CuO NPs. The Scherrer equation (equation (1) can be written as follows,
Taking logarithm on both sides, equation (4) becomes,
For the estimation of crystallite size by Monshi Scherrer method (MSM), plot of
(in y-axis) versus
(in x-axis) has been plotted. Linear fitting of this plot can be compared with straight line equation (y = mx + c) which resulted in the following equations,
The plot (Fig. 4) has the slope of 9.26194, R2 value of 0.13391 and the intercept of negative 6.17597 which is equal to
according to equation (6) and (7). Thus, the average crystallite size was calculated to be 66 nm (listed in Table 4) which is not far from the value obtained through the straight line passing the origin method (SLPOM).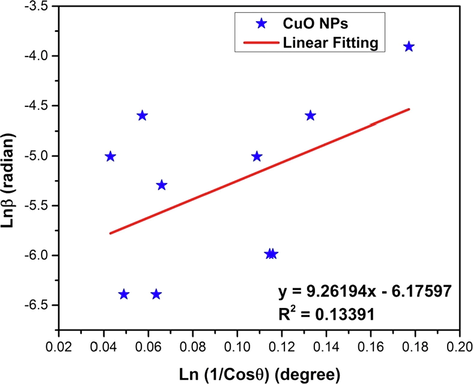
Linear fit plot of Monshi Scherrer method (MSM) for calculating crystallite size of synthesized CuO NPs.
4.2.6 Williamson-Hall method (WHM)
Williamson-Hall (W-H) method was also exploited to calculate the crystallite size of the synthesized CuO NPs. Unlike Scherrer method, the W-H method does not only confine to the effect of crystallite size in XRD peak broadening, rather it considers the effect of strain-induced xrd peak broadening. Moreover, this W-H model provides a calculative pathway of crystallite size as well as intrinsic strain (Nath et al., 2020; Warren and Averbach, 1952). The W-H model excluded the 1/cosθ dependency by introducing the variation with tanθ in strain considerations (Zak et al., 2011). Strain is caused by the imperfections and distortions in the crystals of a powdered sample. Keeping this in mind, the W-H method expresses the total physical line broadening (FWHM) of x-ray diffraction peak as a combination of effect of size and strain (Mote et al., 2012; Rabiei et al., 2020),
The crystal imperfections and/or distortions will give raise to strain which can be calculated using the following equation (9) (Mote et al., 2012),
Amalgamation of equation (1), (8) and (9) gives us the following equation (10),
By rearranging the above equation, we get,
By plotting
in the x-axis and
in the y-axis, we obtained Fig. 5. Generally, W-H method relates to an isotropic (perfect) crystal system and apparently, slope and intercept of the fitted line corresponds to the strain and crystal size. The linear fitting of Fig. 5 results in an intercept of negative 0.00483 and the value of slope was 0.00677. The value of intercept is equal to the
and from this relationship the crystallite size is calculated to be 28 nm (listed in Table 4). The value of slope is equal to the strain (ε) which is 6.77 × 10⁻³. The positive value of strain corresponds to the tensile strain (negative value corresponds to the compressive strain).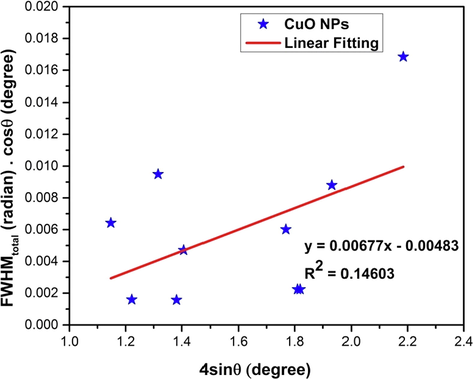
Linear fit plot of W-H method (WHM) for calculating crystallite size of synthesized CuO NPs.
4.2.7 Size-strain plot method (SSPM)
The Willianson-Hall method (WHM) is based on the fact that the broadening of the xrd peaks is a combined effect of size and strain induced broadening. On the other hand, the size-strain plot method (SSPM) considers the size broadening as a Lorentz function and strain broadening as Gaussian function (Balzar and Ledbetter, 1993) which is presented as,
Where, βL and βG are the peak broadening based on Lorentz and Gaussian function respectively.
Generally, the SSPM is more focused on isotropic crystal structures (Kafashan, 2018) and low angle reflections where more accuracy and precision can be attained. The size-strain plot is presented by the following equation (13) (Basak et al., 2021; Kushwaha and Chauhan, 2021; Nath et al., 2020; Sivakami et al., 2016),
Here, d is the lattice distance between the (hkl) planes of the monoclinic structure of CuO NPs (also known as the d-spacing) and can be calculated by the following equation (14),
Now, using equation (13), a plot can be drawn where (d2.β.cosθ) is represented in the x-axis and (d.β.cosθ)2 is presented in the y-axis (Fig. 6). The crystallite size and intrinsic strain of the synthesized CuO NPs can be calculated from the slope and intercept of the linear extrapolated data.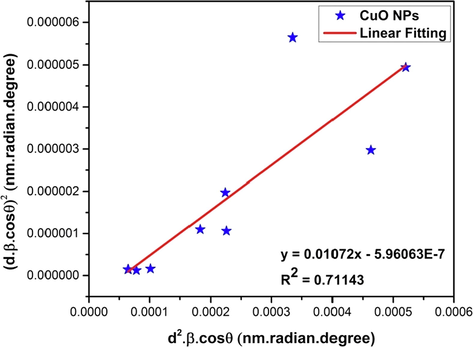
Linear fit plot of size-strain plot method (SSPM) for calculating crystallite size of synthesized CuO NPs.
The slope of the straight line obtained from the plot (Fig. 6) of (d2.β.cosθ) versus (d.β.cosθ)2 provides a value of 0.01072 and it is equal to of equation (13). This calculation gives us the value of crystallite size to be 13 nm (listed in Table 4). The value of intercept is equal to from which the strain can be calculated. But since the value of intercept is negative (- 5.96063E-7), the calculation of strain was not mathematically possible.
4.2.8 Halder-Wagner method (HWM)
The necessity of Halder-Wagner Method (HWM) for calculating crystallite size is governed by the fact that, the size broadening of the xrd peak profile is neither a Lorentzian nor a Gaussian function (Halder and Wagner, 1966; Hepp and Baerlocher, 1988), rather it is based on symmetric Voigt function (Halder and Wagner, 1966; Motevalizadeh et al., 2014). So, to eliminate this difficulty, HWM proposed the following equation (15) for Voigt function,
Where, βL and βG are the full width at half maximum of the Lorentzian and Gaussian function. The HWM has the advantage over other methods since it is more focused on the peaks at low and middle angles where the overlapping of the diffraction peak is less. The computational formula of HWM is presented in equation (16) along with its subcategories in equation (17) and (18),
Amalgamation and rearrangement of equations (16), (17) and (18) produce equation (19),
The plot of equation (19) with
in the x-axis and
in the y-axis is shown in Fig. 7. The linear fitting of Fig. 7 results in a slope value of 0.01072 which is equal to
of equation (19) and the calculated crystallite size is 13 nm (listed in Table 4). Similar crystallite size was also obtained using the SSPM. Linear fitting of Fig. 7 also provides the intercept of negative 1.00456E-4 which is equal to
of equation (19). Since the intercept value is negative, the calculation of strain was also not possible using HWM.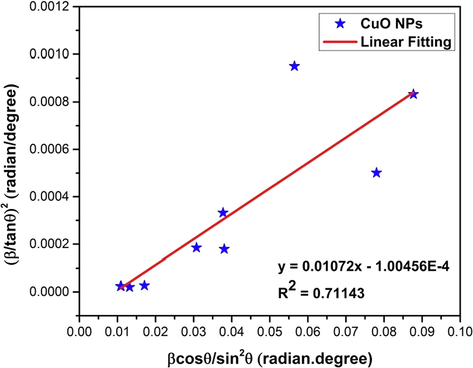
Linear fit plot of Halder-Wagner method (HWM) for calculating crystallite size of synthesized CuO NPs.
The calculated crystallite of the synthesized CuO NPs is summarized in Table 4 which clearly shows that, LSLM produces crystallite size of 1980 nm and it is invalid (Rabiei et al., 2020). Among the remaining methods, SSPM and HWM produced the lowest crystallite size (13 nm) whereas SM considering FWHM (β) of the sharpest peak produced the highest crystallite size (87 nm).
4.3 Calculation of crystallographic parameters
The lattice parameters and the volume of the monoclinic structured CuO were calculated by equation (14) and the following equation (20), (Azaroff and Buerger, 1958; Rodney et al., 2018; Volanti et al., 2008),
According to the equation (14), the lattice parameters were calculated to be a = 4.689 Å, b = 3.469 Å, c = 5.115 Å, β = 99.3090° and V = 82.10° (according to equation (20)) which are very much in accordance with previous studies (Mustafa et al., 2013), (Monshi et al., 2012), (Aparna et al., 2012), (Srivastava, 2013).
The crystal density based on the obtained xrd data can be calculated by the following equation (Karimi et al., 2014; Rodney et al., 2018),
Where V is the volume of unit cell, A is the sum of atomic weight of all the atoms belonging to the unit cell and N is the Avogadro’s number. When it comes to density of the monoclinic structure, the volume of unit cell can be written from equation (20) and since monoclinic structure of CuO contains 4 molecules in a primitive structure, equation (21) can be altered as,
Here, M is the molecular weight of copper oxide. Table 5 lists the experimental and JCPDS lattice parameters of CuO NPs.
Lattice Parameter (Å)
a (Å)
b (Å)
c (Å)
β °
Volume of Unit Cell V (Å)3
Crystal density, dCuO (g/cm3)
JCPDS Values (Card No: 00–041-0254)
4.685
3.423
5.132
99.520
81.17
6.45
Experimental Values
4.689
3.469
5.115
99.309
82.10
6.43
The microstrain or local strain is the variations in the lattice parameters in the crystalline materials. It can be calculated by the following equation (24) (Hossain et al., 2021),
Dislocation density is the concentration assessing the number of dislocation lines per unit area of surface and is directly related to crystal size (Saikiran et al., 2020). The dislocation density was calculated by the following equation (24) which involved the crystallite size evaluated using various methods (Bin Mobarak, 2022)(Hossain et al., 2021),
Crystallinity is a state of molecular structure referring to a long range periodic geometric pattern of atomic spacing and degree of crystallinity (also known as percentage of crystallinity) influences the degree of stiffness, hardness and heat resistance (Crompton, 1993). The percentage of crystallinity was calculated according to the xrd deconvolution technique, using OriginPro 9.0 software to calculate the integrated area of the crystalline peak and the total integrated area (Crystalline + Amorphous) under the xrd peaks. The formula is as follows (Wibowo and Park, 2020).
Where SC is the integrated area of the crystalline peaks and St is the total integrated area under the xrd peaks. The results of microstrain, dislocation density and crystallinity have been listed in Table 6.
4.4 Transmission electron microscopic analysis
The analysis with transmission electron microscopy (TEM) has aided in understanding the particle size-shape as well as the SAED (selected area electron diffraction) pattern for confirming the d-spacing values of the synthesized CuO NPs. Fig. 8 (a), (b) and (c) shows the TEM images whereas Fig. 8 (d) shows the SAED pattern. At first sight from Fig. 8 (a), it is quite visible that the particles were strongly agglomerated and very few particles were completely separated.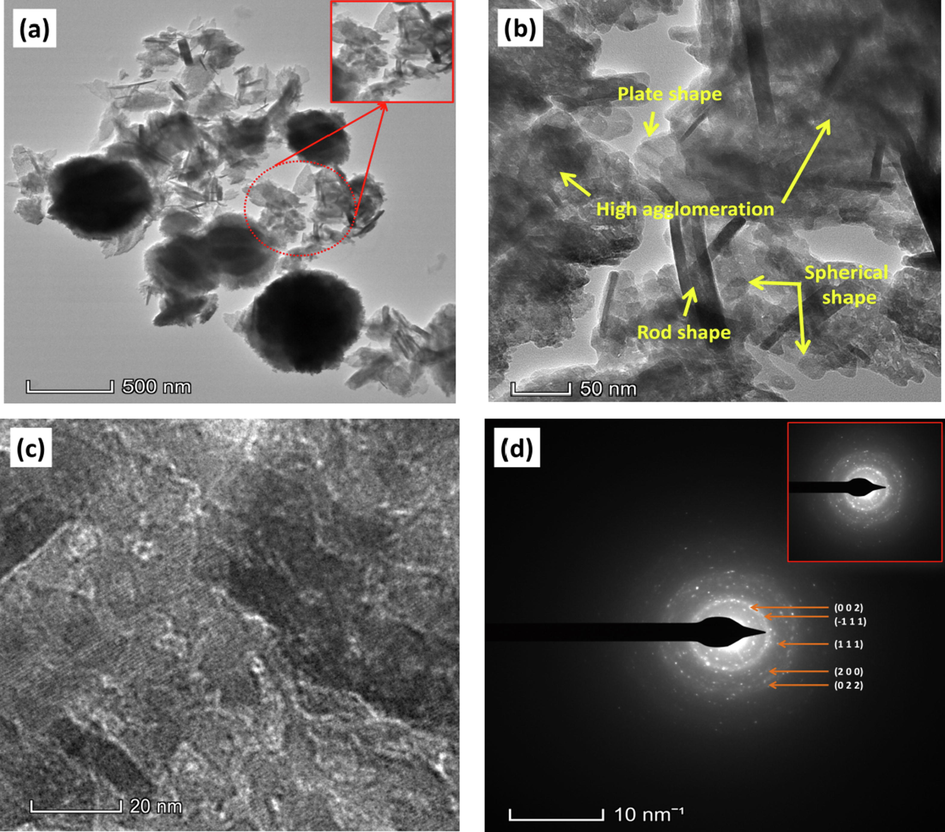
(a), (b) & (c) TEM images and (d) SAED pattern and of the synthesized CuO NPs.
Three different shaped particles, i.e. spherical, rod and plate shape were observed from the TEM images (Fig. 8 (a) and (b)). The diameter of rod and plate shaped particles are within 5–17 nm whereas the spherical shaped ones were larger in size. This is due to the high agglomeration of the particles which led to very few distinct particles to observe. The crystallinity of the synthesized CuO NPs that was initially confirmed by the XRD analysis, was also confirmed by the SAED pattern of the TEM analysis. The appearance of ring structure that is comprised of bright spots confirms the polycrystalline structure of the CuO NPs. Implementing the imageJ tool, the radius of these rings has been calculated from which corresponding d-spacing values were also evaluated that complied with values found through XRD analysis. The corresponding crystal planes of the intense peaks are denoted in Fig. 8 (d). Although the particles were highly agglomerated, the lattice fringes of the polycrystalline CuO NPs were visible at higher a magnification which is shown in Fig. 8 (c).
4.5 UV–Vis spectroscopic study
The UV–Vis absorption spectrum of the synthesized CuO NPs is shown in the Fig. 9 (a).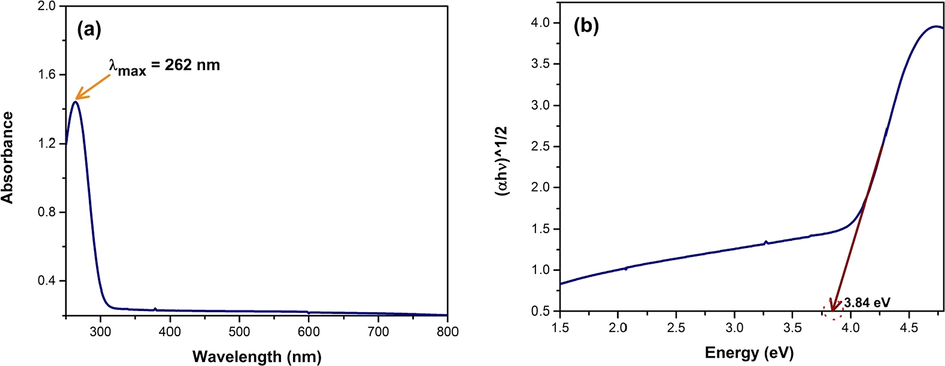
(a) UV–Visible spectra and (b) normalized photon energy versus (αhν)1/2 plot for calculation of band gap of the synthesized CuO NPs.
The visual confirmation of the formation of CuO NPs was achieved by observing the color change of the reaction mixture which was also confirmed by the UV–Vis spectroscopic technique. The colloidal suspension shows a hump like absorption data with an apex at 262 nm which confirms the formation of Cupric Oxide, also documented in previous literatures (Abboud et al., 2014; Taghavi Fardood and Ramazani, 2016; Yin et al., 2005). The initial color of the reaction mixture turns from blue to dark brown (mentioned in the synthesis part). This is due to the excitation of surface plasmon resonance (SPR) phenomenon of CuO NPs which typically ranges from 200 to 350 nm and also attributes to the formation of CuO NPs in the reaction mixture (Abboud et al., 2014; Akintelu et al., 2020; Berra et al., 2018; Caroling et al., 2015; Manjari et al., 2017; Rehana et al., 2017; Sarkar et al., 2020; Taghavi Fardood and Ramazani, 2016; Yang et al., 2014). The hump-like adsorption peak is an indication of narrow size distribution of CuO NPs (Borgohain et al., 2002). The optical band gap of CuO NPs was estimated using the Tauc Plot method which is shown in the following equation (Gusatti et al., 2015; Jin et al., 2011; Kamble and Mote, 2019; Maku\la et al., 2018),
Where, Eg is the optical band gap, A is a constant, α is the adsorption coefficient, h is the Planck’s constant, ν is the photon frequency and n = 1/2 for direct bandgap semiconductors. The calculated band gap of the synthesized CuO NPs was 3.84 eV which depicts its potentiality in catalysis, especially in photocatalysis. Table 7 shows the reported band gap energy of synthesized CuO calculated using Tauc Plot method based on the UV–Vis absorption data.
Sl No
Synthesis technique
Band gap energy (eV)
Ref.
01.
Hydrothermal
3.43–3.56
(Vinothkumar et al., 2019)
02.
Bio-synthesis (Solanum lycopersicum)
3.87
(Vaidehi et al., 2018)
03.
Sol-gel
Bio-synthesis3.63
3.33–3.46(Muthuvel et al., 2020)
04.
Bio-synthesis (Elsholtzia blanda)
3.8
(Maheo et al., 2022)
05.
Bio-synthesis (Moringa oleifera)
2.1
(Surendhiran et al., 2021)
06.
solution combustion method
3.0
(Harini et al., 2022)
07.
Chemical precipitation and microwave modification
2.43–2.93
(Yang et al., 2014)
08.
Bio-synthesis (Crocus Sativus)
3.52
(Shashanka, 2021)
09.
Co-precipitation
3.47
(Zeid et al., 2020)
10.
Modified precipitation method
2.7
(Kumar et al., 2016)
4.6 ATR-FTIR study
The peak positions of the ATR-FTIR spectra are shown in the Fig. 10.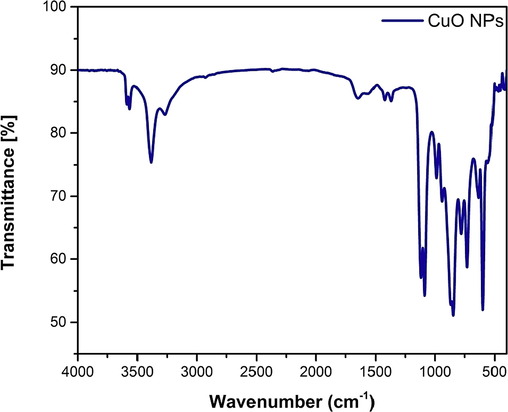
ATR-FTIR spectra of synthesized CuO NPs.
As can be seen from the spectra, the characteristic peak for amide I band (C = O stretch/hydrogen bond coupled with COO–) is assigned for 1645 cm−1 frequency while the amide II band (NH bending coupled with CN stretching) is assigned for 1560 cm−1, 1548 cm−1, 1529 cm−1, 1423 cm−1 (COO– symmetrical stretching) and 1369 cm−1 (CH2 wagging) frequencies. The amide III band is associated with C-O stretching frequency at 1087 cm−1. The amide A band is assigned for the N-H stretching frequency which covers a wide range of peaks, from 3313 cm−1 to 3442 cm−1 where the apex was found at 3385 cm−1. Amide B band is associated with at 2927 cm−1 (CH2 asymmetrical stretching) and 2856 cm−1 (CH2 symmetrical stretching) frequencies (Pati et al., 2010), (Rehana et al., 2017). The peak positions at 443 cm−1, 470 cm−1, 497 cm−1, 514 cm−1 538 cm−1, 559 cm−1 and 621 cm−1 frequencies corresponds to the metal–oxygen vibration (Cu-O) that bolsters the presence of monoclinic phase of the CuO NPs (Berra et al., 2018; Ethiraj and Kang, 2012; Porta et al., 1988; Rehana et al., 2017; Sivaraj et al., 2014a, 2014b; Taghavi Fardood and Ramazani, 2016). The obtained ATR-FTIR peak positions and their assignments according to the literature is concised in Table 8.
Peak Position (Wavenumber, cm−1) Obtained through ATR-FTIR
Peak Position (Wavenumber, cm−1) according to literature
Region
Assignments
Ref.
443
446
Metal-Oxygen
Cu-O stretching vibration
(Sivaraj et al., 2014a)
470
471
Metal-Oxygen
Cu-O stretching vibration
(Sivaraj et al., 2014b)
497
497
Metal-Oxygen
Cu-O stretching vibration
(Ethiraj and Kang, 2012; Siddiqui et al., 2021)
490
Metal-Oxygen
Cu-O stretching vibration
(Rehana et al., 2017)
514
512
Metal-Oxygen
Cu-O stretching vibration
(Berra et al., 2018)
524
523
Metal-Oxygen
Cu-O stretching vibration
(Philip et al., 2021)
538
530
Metal-Oxygen
Cu-O stretching vibration
(Rehana et al., 2017)
559
558
Metal-Oxygen
Cu-O stretching vibration
(Sivaraj et al., 2014a)
630
618
Metal-Oxygen
Cu-O stretching vibration
(Berra et al., 2018)
603
Metal-Oxygen
Cu-O stretching vibration
(Ethiraj and Kang, 2012)
597
Metal-Oxygen
Cu-O stretching vibration
(Siddiqui et al., 2021)
1645
1653
Amide I
C = O stretch/ hydrogen bond coupled with COO–
(Pati et al., 2010)
1663, 1674
Amide I
(Rehana et al., 2017)
1560
1558
Amide II
NH bending coupled with CN stretching
(Pati et al., 2010)
1529
1530, 1535
(Rehana et al., 2017)
1423
1423
COO– symmetrical stretching
(Pati et al., 2010)
1369
1343
CH2 wagging
(Pati et al., 2010)
1087
1083
Amide III
C-O stretching frequency
(Pati et al., 2010)
1030–1100
(Rehana et al., 2017)
3313–3442
3440
Amide A
NH stretching
(Rehana et al., 2017)
2927
2923
Amide B
CH2 asymmetrical stretching
(Rehana et al., 2017)
2856
2858
CH2 symmetrical stretching
4.7 FESEM and EDX analysis
The morphological analysis (FESEM) was carried out to investigate the microstructure of the synthesized CuO NPs powder. And also, the elemental analysis was carried out in terms of energy dispersive x-ray (EDX) study in order to confirm the presence and quantify the constituent elements. The FESEM images and EDX spectra are shown in Fig. 11.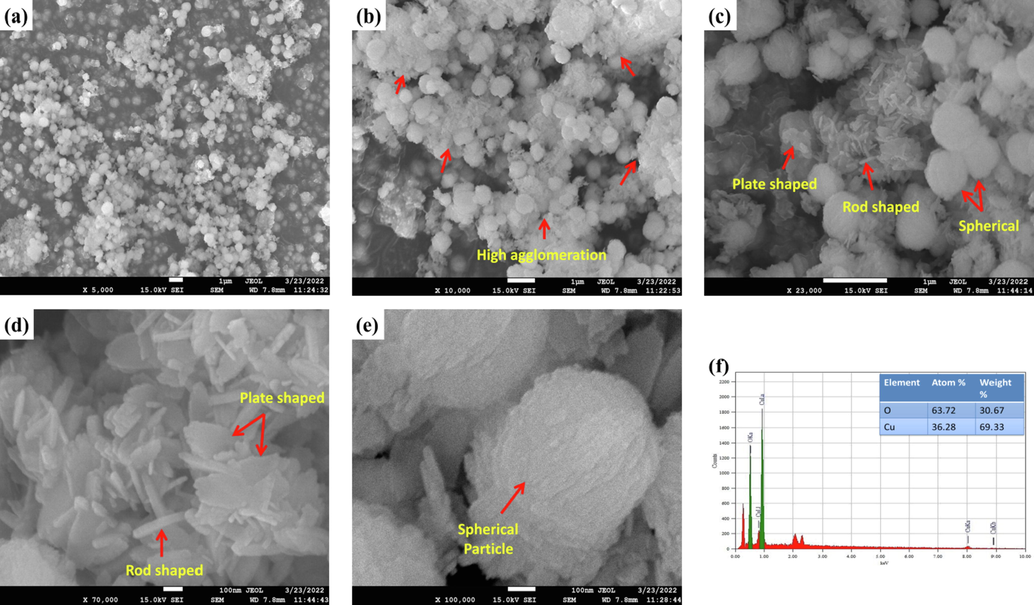
(a) - (e) FESEM images and (f) EDX spectra of synthesized CuO NPs.
Initially at lower magnification (Fig. 11 (a) and (b)), within 1 µm of the image resolution, the particles were seen to be of spherically shaped like tiny nodules and existing very close to each other. But at higher magnification, strong agglomeration of particles was observed. Interestingly, rod and plate shaped particles were also existent (Fig. 11 (d) and (e)) along with the spherical shaped particles. This matches (Fig. 11(c)) with the findings from the TEM analysis (Fig. 8 (b)). The rod and plate shaped particles were found to be stationed in between the spherical particles. The surface of the spherical shaped particles were furrowed whereas surfaces of rod and plate shaped particles were smooth except for the edges. Upon taking a deeper look (Fig. 11(e)), it was noticed that the consolidated adherence of the plate shape particles spawned spheres of CuO NPs. The EDX spectra (Fig. 11 (f)) confirmed the presence of Cu and O as well as showed the quantitative values of atom % and weight % present in the synthesized CuO NPs (36.28% Cu and 63.72% O based on atom %; 69.33% Cu and 30.67% O based on weight %).
4.8 Particle size analysis
The particle size of the synthesized CuO NPs has been analyzed using two approaches; (i) based on FESEM and TEM image using an image processing program (imageJ software) and (ii) DLS particle size analyzer. The imageJ software is a Java-based domain image processing and analysis program which was developed by National Institute of Health (NIH), USA. This software is open source, multithreaded platform that is freely available and can be utilized to develop user-coded plugins for specific requirements (Mazzoli and Favoni, 2012).
The analysis begins with the calibration of the FESEM image prior to the determination of the particle size. The image calibration was done by drawing a straight line over the scale bar of the FESEM image, then setting the scale in terms of pixels and length as shown in the Fig. 12 (a).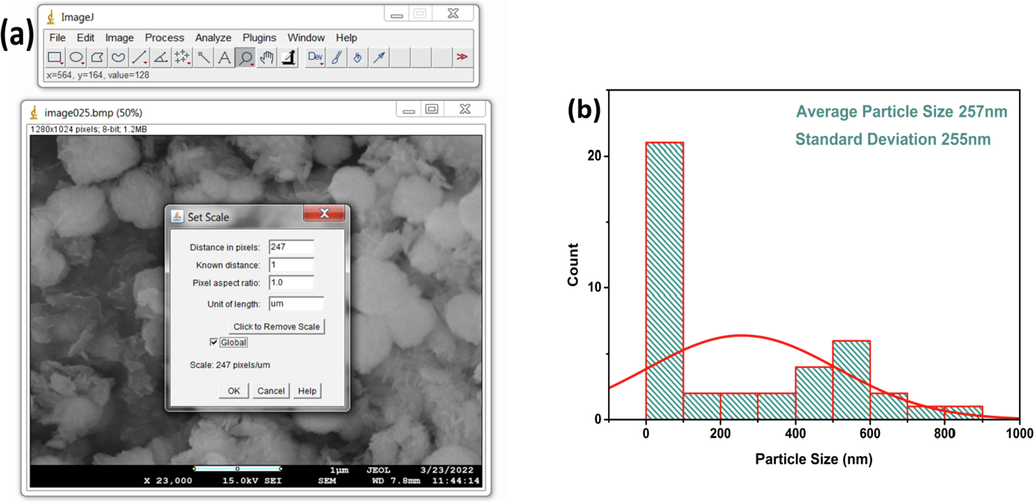
(a) Calibration of imageJ software for particle size analysis with FESEM image and (b) particle size distribution histogram of CuO NPs with normal fitting obtained from imageJ.
In this case, the known distance was 1 µm, distance in pixels was 247 and pixel aspect ratio was 1. The image processing algorithm consisted of converting the SEM image into an 8-bit image that can display 28 Gray levels. For the measurement of particle size, the image was zoomed to a suitable magnitude for precisely and distinctly selecting the diameter of the particle and then selecting “measure”. This was done for 42 different particles including spherical, rod, plate shaped particles and the values were plotted as a distribution histogram with normal fitting which is shown in Fig. 12 (b). ImageJ is a measurement that follows visual aid and the results reveal that the average particle size was 257 nm with a standard deviation of 255 nm. Such high standard deviation is due to the fact that, the spherical shaped particles are much larger than the rod and plate shape particles.
The procedure was same for analysis with the TEM image (Fig. 13 (a)). Due to intensive agglomeration of the particles, very few distinctive particles were available for analysis. Using the imageJ tool, the average particle size was 11 nm with a standard deviation of 3 nm shown in Fig. 13 (b).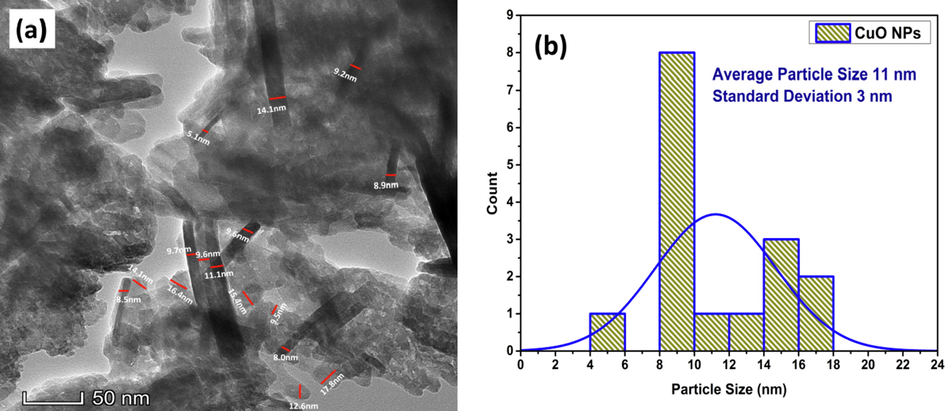
(a) Particle size analysis with TEM image and (b) particle size distribution histogram of CuO NPs with normal fitting obtained from imageJ.
The second approach that has been followed for the determination of particle size of the synthesized CuO NPs was the DLS technique which utilized MADLS technology for the analysis. The analysis revealed the distribution of particles within a wide range of sizes and the average particle size found out to be 273 nm (Fig. 14(a)). For acquiring insights about the stability of the synthesized CuO NPs and detect the surface charges, zeta potential analysis was carried out which is shown in Fig. 14(b). The zeta potential of the synthesized CuO NPs was found to be −1.591 mV at pH ∼ 7. The negative value is attributed to the formation of OH– groups on the surface of the particles while they are dispersed in water medium. When the particles are dispersed in water, they intend to form agglomerates upon the influence of Van der Waal’s force. On the other hand, when all the particles attain either negative or positive charge on their surface, this creates a repulsion force between the particles.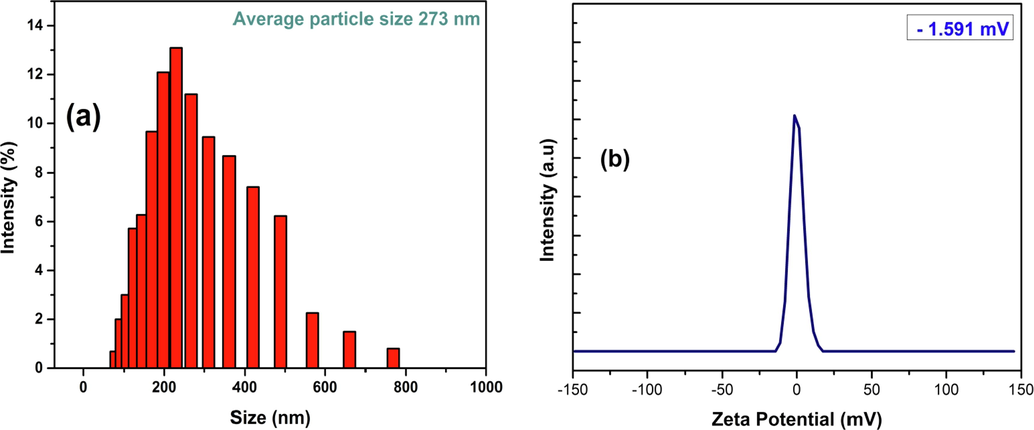
(a) particle size distribution and (b) zeta potential analysis of the synthesized CuO NPs using DLS technique.
If this repulsion force exceeds the Van der Waal’s force, then the particles will be highly dispersed with more stability. This repulsion force is extrapolated in terms of zeta potential and higher magnitude of zeta potential refers to higher stability. In our case, although we found a negative value of zeta potential but the magnitude was very minute which indicates lesser stability for the CuO NPs (Cuevas et al., 2015; Sarkar et al., 2020).
In order to make a comparison, the particle size of the synthesized CuO NPs that has been found using various techniques has been tabulated in Table 9. According to the compiled data, DLS analysis showed the highest value of particle size which was anticipated since it signifies the hydrodynamic volume or diameter of the particle. The imageJ software driven analysis based on FESEM image also showed more than twenty three times higher value of particle size than the TEM image-based analysis. This was also anticipated since the overlapping or the higher agglomeration made two or more particles to look like one entity and thus resulting in higher calculated particle size.
Sl No.
Name of the calculation method/technique of the particle size
Average particle size
01.
FESEM analysis with imageJ
257 nm
02.
DLS analysis with MADLS technology
273 nm
03.
TEM analysis with imageJ
11 nm
4.9 Thermal analysis
The thermal analysis of the synthesized CuO NPs was carried out in terms of TGA and DSC for evaluating its thermal stability and is presented in Fig. 15. The TGA curve (Fig. 15(a)) shows a four step weight loss with respect to a temperature range of 30 °C to 1000 °C. The first stage of weight loss was observed from the very beginning of temperature raise up until 150 °C. The calculated weight loss was around 4.12% and this is due to the elimination of volatile components such as deionized water, ethanol, moisture or surface water that might be present by binding with the surface, i.e. physisorbed H2O (Zhang et al., 2017).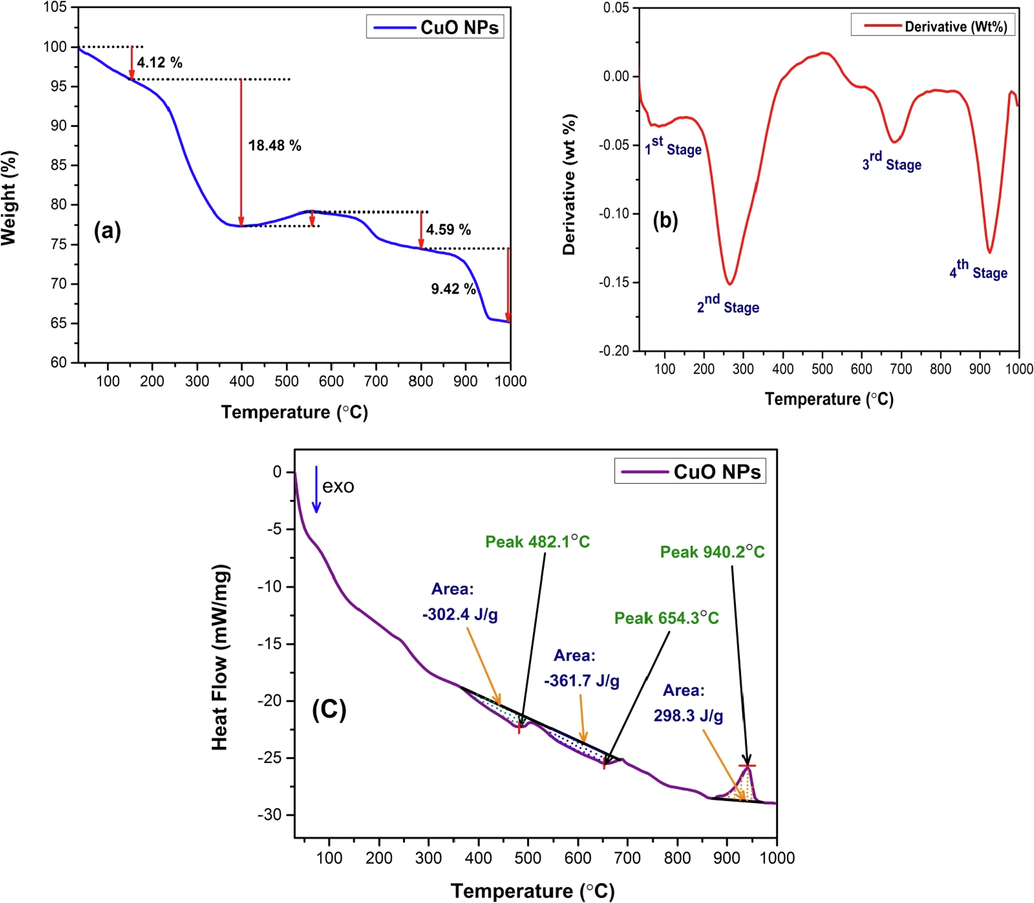
Thermal analysis of synthesized CuO NPs (a) TGA thermogram (b) First order derivatogram (DTG) and (c) DSC thermogram.
The next stage of weight loss was observed in the temperature range of 150 °C to 400 °C and a highest weight loss of 18.48% was observed in this stage. This weight loss can be attributed by the release of volatile organic compounds and water molecules that might have not been removed in the first stage. This volatile organic compound (amide groups confirmed by ATR-FTIR study) might be existent due to the incomplete conversion of CuO-gelatin complex into CuO NPs (Athinarayanan et al., 2020). Another reason that might contribute to the greater weight loss is the depolymerization of the gelatin structure (Safaei et al., 2019). The apparent increase in the weight (1.80%) after 400 °C might be due to the artifact of the instrument (Devi et al., 2014). The next two stages of weight loss from 600 °C to 1000 °C is due to the complete elimination of any sort of organic components that might be present with CuO NPs. A total weight loss of 34.83% was observed from the TGA analysis. Such finding when compared with previous literature reveals that, 34.83% weight loss up to a temperature of 1000 °C is an indication of moderate stability of the synthesized CuO NPs (Gandhi et al., 2010; Manjari et al., 2017; Shashanka, 2021; Tamaekong et al., 2014). First order derivative of the TGA data was also extrapolated and presented as a Derivative Thermogravimetric (DTG) curve or simply derivatogram which is shown in Fig. 15(b). This derivatogram is a plot of rate of weight loss with respect to temperature. According to the derivatogram, 4 stages of weight loss and the exact temperatures at which maximum weight loss occurs (85 °C, 264 °C, 684 °C and 925 °C). In addition to the TGA analysis, DSC analysis was also performed to seek out the thermal effects instigated by the synthesized CuO NPs when it undergoes physical transition or chemical reaction by the applied temperature at a controlled atmosphere. The DSC thermogram of synthesized CuO NPs is shown in Fig. 15(c). According to the DSC data obtained, three conversion steps was observed of which two of them were exothermic and one of them was endothermic. The acquired peak and area of the two exothermic processes were 482.1 °C, −302.4 J/g and 654.3 °C, −361.7 J/g respectively. The endothermic process was observed at temperature maxima of 940.2 °C with an area of 298.3 J/g.
5 Conclusion
This research work quested for a green route of synthesis for CuO NPs by utilizing fish scale which is a common household and commercial waste material. The formation of CuO NPs as well as the phase was confirmed by xrd analysis. Crystallographic parameters were estimated based on the xrd data and also exploiting various methods, the crystallite size was calculated. All the methods produced crystallite sizes within 100 nm for the as synthesized CuO NPs, except for the linear straight line method (LSLM) which resulted in a crystallite size of 1980 nm. Crystallographic plane found from both xrd and SAED pattern were in close agreement. The ATR-FTIR study confirmed the presence of amide groups as well as the Cu-O bonding which indicated the involvement of fish scale in the synthesis. Formation of CuO NPs was also confirmed by UV–Vis spectroscopy. Both the TEM and FESEM analysis revealed three different shapes of the CuO NPs. The acquired particle size was higher for DLS technique compared to the imageJ software based analysis of FESEM and TEM image. This might be due to the fact that DLS determines the hydrodynamic volume of the particle. Thermal analysis as well as zeta potential revealed a moderate to lesser stability of the synthesized CuO NPs.
Acknowledgement
We are gratefully acknowledging the support from IGCRT, BCSIR (R&D approval ref.
39.02.0000.011.14.134.2021/900; Date: 30/12/2021). We also appreciate BTRI for supporting with FESEM analysis.
Declaration of Competing Interest
The authors declare that they have no known competing financial interests or personal relationships that could have appeared to influence the work reported in this paper.
References
- Biosynthesis, characterization and antimicrobial activity of copper oxide nanoparticles (CONPs) produced using brown alga extract (Bifurcaria bifurcata) Appl. Nanosci.. 2014;4:571-576.
- [Google Scholar]
- Green synthesis of copper oxide nanoparticles for biomedical application and environmental remediation. Heliyon. 2020;6:e04508
- [Google Scholar]
- Aparna, Y., Rao, K.V., Subbarao, P.S., 2012. Preparation and characterization of CuO Nanoparticles by novel sol-gel technique.
- Simultaneous fabrication of carbon nanodots and hydroxyapatite nanoparticles from fish scale for biomedical applications. Mater. Sci. Eng. C. 2020;117:111313
- [Google Scholar]
- The powder method in X-ray crystallography. McGraw-Hill New York; 1958.
- Voigt-function modeling in Fourier analysis of size-and strain-broadened X-ray diffraction peaks. J. Appl. Crystallogr.. 1993;26:97-103.
- [Google Scholar]
- The use of X-ray Diffraction peak profile analysis to determine the structural parameters of cobalt ferrite nanoparticles using Debye-Scherrer, Williamson-Hall, Halder-Wagner and Size-strain plot: different precipitating agent approach. J. Alloys Compd. 2021:162694.
- [Google Scholar]
- Green synthesis of copper oxide nanoparticles by Pheonix dactylifera L leaves extract. Dig. J. Nanomater. Biostructures. 2018;13:1231-1238.
- [Google Scholar]
- Bishnoi, A., Kumar, S., Joshi, N., 2017. Wide-angle X-ray diffraction (WXRD): technique for characterization of nanomaterials and polymer nanocomposites, in: Microscopy Methods in Nanomaterials Characterization. Elsevier, pp. 313–337
- Probing the photocatalytic competency of hydroxyapatite synthesized by solid state and wet chemical precipitation method. journal of molecular structure. 2022;1252
- [CrossRef] [Google Scholar]
- Synthesis and properties of Cu 2 O quantum particles. J. Appl. Phys.. 2002;92:1292-1297.
- [Google Scholar]
- CuO catalysts supported on attapulgite clay for low-temperature CO oxidation. Catal. Commun.. 2008;9:2555-2559.
- [Google Scholar]
- Biosynthesis of copper nanoparticles using aqueous guava extract-characterisation and study of antibacterial effects. Int. J. Pharm. Biol. Sci.. 2015;5:25-43.
- [Google Scholar]
- Metal oxide nanoparticles and their applications in nanotechnology. SN Appl. Sci.. 2019;1:1-30.
- [Google Scholar]
- Characterization of collagen derived from tropical freshwater carp fish scale wastes and its amino acid sequence. Nat. Prod. Commun.. 2019;14
- [Google Scholar]
- Degree of crystallinity and melting temperature. Pract. Polym. Anal. Springer 1993:630-647.
- [Google Scholar]
- Synthesis of metal and metal oxide nanowire and nanotube arrays within a mesoporous silica template. Chem. Mater.. 2003;15:3518-3522.
- [Google Scholar]
- Cuevas, R., Durán, N., Diez, M.C., Tortella, G.R., Rubilar, O., 2015. Extracellular biosynthesis of copper and copper oxide nanoparticles by Stereum hirsutum, a native white-rot fungus from chilean forests. J. Nanomater. 2015.
- New frontiers in the plant extract mediated biosynthesis of copper oxide (CuO) nanoparticles and their potential applications: a review. Environ. Res. 2021:111858.
- [Google Scholar]
- Novel synthesis and characterization of CuO nanomaterials: biological applications. Chin. Chem. Lett.. 2014;25:1615-1619.
- [Google Scholar]
- Synthesis and characterization of CuO nanowires by a simple wet chemical method. Nanoscale Res. Lett.. 2012;7:1-5.
- [Google Scholar]
- Ultrasound assisted one pot synthesis of nano-sized CuO and its nanocomposite with poly (vinyl alcohol) J. Mater. Sci.. 2010;45:1688-1694.
- [Google Scholar]
- Growth of variable aspect ratio ZnO nanorods by solochemical processing. J. Mater. Sci. Technol.. 2015;31:10-15.
- [Google Scholar]
- Separation of particle size and lattice strain in integral breadth measurements. Acta Crystallogr.. 1966;20:312-313.
- [Google Scholar]
- Combustion synthesis CuO nanoparticles: application to photocatalytic activity. Mater. Today Proc.. 2022;49:860-864.
- [Google Scholar]
- Learned peak shape functions for powder diffraction data. Aust. J. Phys.. 1988;41:229-236.
- [Google Scholar]
- Crystallographic analysis of biphasic hydroxyapatite synthesized by different methods: an appraisal between new and existing models. Chem. Pap. 2021:1-13.
- [Google Scholar]
- Multifaceted application of silica nanoparticles. a review. Silicon. 2020;12:1337-1354.
- [Google Scholar]
- Investigation of photoluminescence in undoped and Ag-doped ZnO flowerlike nanocrystals. J. Appl. Phys.. 2011;109:053521
- [Google Scholar]
- Structural characterizations of pure SnS and In-doped SnS thin films using isotropic and anisotropic models. Mater. Res. Express. 2018;5:046417
- [Google Scholar]
- Structural, optical and magnetic properties of Co doped CuO nano-particles by sol-gel auto combustion technique. Solid State Sci.. 2019;95:105936
- [Google Scholar]
- Advances in copper-chalcopyrite thin films for solar energy conversion. Sol. Energy Mater. Sol. Cells. 2010;94:12-16.
- [Google Scholar]
- Magnetic and structural properties of nano sized Dy-doped cobalt ferrite synthesized by co-precipitation. J. Magn. Magn. Mater.. 2014;361:150-156.
- [Google Scholar]
- Veteran cupric oxide with new morphology and modified bandgap for superior photocatalytic activity against different kinds of organic contaminants (acidic, azo and triphenylmethane dyes) Mater. Res. Bull.. 2016;83:522-533.
- [Google Scholar]
- Microstructural evaluation of iron oxide nanoparticles at different calcination temperature by Scherrer, Williamson-Hall, Size-Strain Plot and Halder-Wagner methods. Phase Transit.. 2021;94:731-753.
- [Google Scholar]
- Biosynthesis, characterization, biological and photo catalytic investigations of Elsholtzia blanda and chitosan mediated copper oxide nanoparticles. Arab. J. Chem.. 2022;15:103661
- [Google Scholar]
- Makula, P., Pacia, M., Macyk, W., 2018. How to correctly determine the band gap energy of modified semiconductor photocatalysts based on UV–Vis spectra.
- Catalytic and recyclability properties of phytogenic copper oxide nanoparticles derived from Aglaia elaeagnoidea flower extract. J. Saudi Chem. Soc.. 2017;21:610-618.
- [Google Scholar]
- Particle size, size distribution and morphological evaluation of airborne dust particles of diverse woods by scanning electron microscopy and image processing program. Powder Technol.. 2012;225:65-71.
- [Google Scholar]
- Nanoscale metal oxide-based heterojunctions for gas sensing: a review. Sens. Actuators B Chem.. 2014;204:250-272.
- [Google Scholar]
- Modified Scherrer equation to estimate more accurately nano-crystallite size using XRD. World J. Nano Sci. Eng.. 2012;2:154-160.
- [Google Scholar]
- Mote, V.D., Purushotham, Y., Dole, B.N., 2012. Williamson-Hall analysis in estimation of lattice strain in nanometer-sized ZnO particles J. Theor. Appl Phys 6.
- Facile template-free hydrothermal synthesis and microstrain measurement of ZnO nanorods. Bull. Mater. Sci.. 2014;37:397-405.
- [Google Scholar]
- Synthesis of novel heterostructured ZnO-CdO-CuO nanocomposite: characterization and enhanced sunlight driven photocatalytic activity. Mater. Chem. Phys.. 2020;249:122983
- [Google Scholar]
- Synthesis and characterization of cupric oxide (CuO) nanoparticles and their application for the removal of dyes. Afr. J. Biotechnol.. 2013;12:6650-6660.
- [Google Scholar]
- Synthesis of copper oxide nanoparticles by chemical and biogenic methods: photocatalytic degradation and in vitro antioxidant activity. Nanotechnol. Environ. Eng.. 2020;5:1-19.
- [Google Scholar]
- X-ray diffraction analysis by Williamson-Hall, Halder-Wagner and size-strain plot methods of CdSe nanoparticles-a comparative study. Mater. Chem. Phys.. 2020;239:122021
- [Google Scholar]
- Production of Cu-Zr mixed metal oxides by thermal oxidation of amorphous ribbons. Mater. Today Proc.. 2021;45:4337-4343.
- [Google Scholar]
- Isolation and characterization of fish scale collagen of higher thermal stability. Bioresour. Technol.. 2010;101:3737-3742.
- [Google Scholar]
- The sonochemical approach improves the CuO–ZnO/TiO 2 catalyst for WGS reaction. Phys. Chem. Chem. Phys.. 2014;16:7521-7530.
- [Google Scholar]
- Novel fabrication of cellulose sprinkled crystalline nanocomposites using economical fibrous sources: High performance, compatible catalytic and electrochemical properties. Micropor. Mesopor. Mater.. 2021;318:111021
- [Google Scholar]
- Structural characterization of malachite-like coprecipitated precursors of the binary CuO-ZnO catalysts: bulk and surface properties. Catal. Today. 1988;2:675-683.
- [Google Scholar]
- Comparing methods for calculating nano crystal size of natural hydroxyapatite using X-ray diffraction. Nanomaterials. 2020;10:1627.
- [Google Scholar]
- Evaluation of antioxidant and anticancer activity of copper oxide nanoparticles synthesized using medicinally important plant extracts. Biomed. Pharmacother.. 2017;89:1067-1077.
- [Google Scholar]
- Photo-Fenton degradation of nano-structured La doped CuO nanoparticles synthesized by combustion technique. Optik. 2018;161:204-216.
- [Google Scholar]
- Green oxidation of alcohols by using hydrogen peroxide in water in the presence of magnetic Fe3O4 nanoparticles as recoverable catalyst. Green Chem. Lett. Rev.. 2014;7:257-264.
- [Google Scholar]
- Preparation, structural characterization, thermal properties and antifungal activity of alginate-CuO bionanocomposite. Mater. Sci. Eng. C. 2019;101:323-329.
- [Google Scholar]
- Microwave synthesis of Zn/Mg substituted and Zn/Mg-F co-substituted nanocrystalline hydroxyapatite. Mater. Today Proc.. 2020;27:2355-2359.
- [Google Scholar]
- Green synthesized copper oxide nanoparticles ameliorate defence and antioxidant enzymes in Lens culinaris. Nanomaterials. 2020;10:312.
- [Google Scholar]
- Bestimmung der inneren Struktur und der Größe von Kolloidteilchen mittels Röntgenstrahlen. Kolloidchemie Ein Lehrbuch. Springer 1912:387-409.
- [Google Scholar]
- Investigation of optical and thermal properties of CuO and ZnO nanoparticles prepared by Crocus Sativus (Saffron) flower extract. J. Iran. Chem. Soc.. 2021;18:415-427.
- [Google Scholar]
- Devices and chemical sensing applications of metal oxide nanowires. J. Mater. Chem.. 2009;19:828-839.
- [Google Scholar]
- Highly energetic flexible all-solid-state asymmetric supercapacitor with Fe 2 O 3 and CuO thin films. RSC Adv.. 2016;6:58839-58843.
- [Google Scholar]
- Green synthesis of copper oxide (CuO) nanoparticles by Punica granatum peel extract. Mater. Today Proc.. 2021;36:751-755.
- [Google Scholar]
- Estimation of lattice strain in nanocrystalline RuO2 by Williamson-Hall and size–strain plot methods. Spectrochim. Acta. A. Mol. Biomol. Spectrosc.. 2016;152:43-50.
- [Google Scholar]
- Biosynthesis and characterization of Acalypha indica mediated copper oxide nanoparticles and evaluation of its antimicrobial and anticancer activity. Spectrochim. Acta. A. Mol. Biomol. Spectrosc.. 2014;129:255-258.
- [Google Scholar]
- Biogenic copper oxide nanoparticles synthesis using Tabernaemontana divaricate leaf extract and its antibacterial activity against urinary tract pathogen. Spectrochim. Acta. A. Mol. Biomol. Spectrosc.. 2014;133:178-181.
- [Google Scholar]
- Biosynthesized CuO nano-platelets: physical properties & enhanced thermal conductivity nanofluidics. Arab. J. Chem.. 2020;13:160-170.
- [Google Scholar]
- Synthesis and characterisation of copper oxide nanoparticles. IOSR J. Appl. Phys.. 2013;5:61-65.
- [Google Scholar]
- Biosynthesis of copper oxide (CuO) nanowires and their use for the electrochemical sensing of dopamine. Nanomaterials. 2018;8:823.
- [Google Scholar]
- Rapid green synthesis of CuO nanoparticles and evaluation of its photocatalytic and electrochemical corrosion inhibition performance. Mater. Today Proc.. 2021;47:1011-1016.
- [Google Scholar]
- Green synthesis and characterization of copper oxide nanoparticles using coffee powder extract. J. Nanostructures. 2016;6:167-171.
- [Google Scholar]
- Tamaekong, N., Liewhiran, C., Phanichphant, S., 2014. Synthesis of thermally spherical CuO nanoparticles. J. Nanomater. 2014.
- Steam reforming and oxidative steam reforming of methanol over CuO–CeO2 catalysts. Int. J. Hydrog. Energy. 2009;34:7648-7655.
- [Google Scholar]
- Antibacterial and photocatalytic activity of copper oxide nanoparticles synthesized using Solanum lycopersicum leaf extract. Mater. Res. Express. 2018;5:085403
- [Google Scholar]
- Green nanotechnology: advancement in phytoformulation research. Medicines. 2019;6:39.
- [Google Scholar]
- Effect of reaction time on structural, morphological, optical and photocatalytic properties of copper oxide (CuO) nanostructures. J. Mater. Sci. Mater. Electron.. 2019;30:6249-6262.
- [Google Scholar]
- Synthesis and characterization of CuO flower-nanostructure processing by a domestic hydrothermal microwave. J. Alloys Compd.. 2008;459:537-542.
- [Google Scholar]
- The separation of cold-work distortion and particle size broadening in X-ray patterns. J. Appl. Phys.. 1952;23:497.
- [Google Scholar]
- Determination of Crystallinity of Thermosetting Urea-Formaldehyde Resins Using Deconvolution Method. Macromol. Res.. 2020;28:615-624.
- [Google Scholar]
- ZnO with different morphologies synthesized by solvothermal methods for enhanced photocatalytic activity. Chem. Mater.. 2009;21:2875-2885.
- [Google Scholar]
- Microwave assisted rapid synthesis and biological evaluation of stable copper nanoparticles using T. arjuna bark extract. Spectrochim. Acta. A. Mol. Biomol. Spectrosc.. 2013;110:108-115.
- [Google Scholar]
- Synthesis and microwave modification of CuO nanoparticles: crystallinity and morphological variations, catalysis, and gas sensing. J. Colloid Interface Sci.. 2014;435:34-42.
- [Google Scholar]
- X-ray analysis of ZnO nanoparticles by Williamson-Hall and size–strain plot methods. Solid State Sci.. 2011;13:251-256.
- [Google Scholar]
- Study the influence of silver and cobalt on the photocatalytic activity of copper oxide nanoparticles for the degradation of methyl orange and real wastewater dyes. Mater. Res. Express. 2020;7:026201
- [Google Scholar]
- Preparation and photo Fenton-like activities of high crystalline CuO fibers. Appl. Surf. Sci.. 2017;422:1042-1051.
- [Google Scholar]
- Nearly monodisperse Cu2O and CuO nanospheres: preparation and applications for sensitive gas sensors. Chem. Mater.. 2006;18:867-871.
- [Google Scholar]
- Transparent metal-oxide nanowires and their applications in harsh electronics. J. Mater. Chem. C. 2019;7:202-217.
- [Google Scholar]
- Facile fabrication and enhanced sensing properties of hierarchically porous CuO architectures. ACS Appl. Mater. Interfaces. 2012;4:744-751.
- [Google Scholar]


