

Translate this page into:
Synthesis of Cu-doped Ni-B amorphous alloy catalyst and its catalytic performance for BH4- oxidation
⁎Corresponding author. nsdtx@126.com (Xiao Tian)
-
Received: ,
Accepted: ,
This article was originally published by Elsevier and was migrated to Scientific Scholar after the change of Publisher.
Abstract
Searching for non-precious metal anode catalysts with high catalytic activity and low cost is essential for direct borohydride fuel cells (DBFC). The Ni-B alloys with crystalline states prepared by physical methods commonly exhibit high B content (NiB4, NiB6, etc.). This work first prepared four kinds of amorphous Ni-B alloy with low boron content by the chemical reduction method. The composition of Ni-B alloy is critical to its performance. Cu is doped in the Ni-B alloy in a suitable proportion to improve the catalytic activity further. The crystal structure, microstructure, and composition information of Ni-B and Ni-B-Cu alloys were characterized by X-ray diffraction (XRD), scanning electron microscope (SEM), transmission electron microscope (TEM), selective area electronic diffraction (SAED), X-ray photoelectron spectroscopy (XPS), and inductively coupled plasma-optical emission spectrometer (ICP-OES) tests. The results show that the Ni-B and Ni-B-Cu alloys are amorphous nanoparticles with particle sizes of about 70 and 50 nm, respectively. The electrocatalytic oxidation BH4− performance of Ni-B and Ni-B-Cu was studied by cyclic voltammetry (CV), chronoamperometry (CA), and electrochemical impedance spectroscopy (EIS). It was shown that Ni-B and Ni-B-Cu alloy catalysts have good catalytic activity for BH4− oxidation reaction, and Cu doping improves the catalytic activity of the Ni-B alloy for borohydride oxidation reaction (BOR). In addition, it is found that the maximum power density (79.124 mW·cm−2) of the direct borohydride fuel cell using Ni-B-Cu/NF (NF: nickel foam) as an anode electrode is significantly higher than that of the Ni-B/NF electrode (21.063 mW·cm−2). The Ni-B and Ni-B-Cu alloys with low boron content can be used as potential anode catalyst materials for DBFC.
Keywords
Direct borohydride fuel cell
Nickel-boron-copper alloy
Borohydride oxidation reaction
Anode catalyst

1 Introduction
With the continuous progress of human society, the consumption of fossil energy such as coal, oil and natural gas is increasing, and it is increasingly urgent to find new renewable clean energy (Hu et al., 2020; Zhou et al., 2019; Hu et al., 2020). Hydrogen energy is considered the most promising clean new energy in the 21st century. Research related to hydrogen energy has attracted more attention from experts and scholars in recent years. Direct borohydride fuel cell (DBFC) using borohydride (such as KBH4, NaBH4) as fuel is a device that converts the chemical energy (hydrogen energy) in the fuel into electrical energy by electrochemical reaction. This battery is a hydrogen fuel cell with a high energy conversion rate, convenient fuel carrying and environmental friendliness. In particular, the borohydride fuel is carbon-free and has the characteristics of high hydrogen content (10.6 wt%), high energy density (9.3 Wh/g), stable performance in alkaline solution, non-toxicity, and simple storage and transportation (Harun and Shaari, 2022; Santos and Sequeira, 2011; Oshchepkov et al., 2022; Momeni and Hassaninejad-Darzi, 2024). Therefore, DBFC is increasingly favored by researchers.
However, the operation of DBFC mainly depends on the redox electrochemical reaction of the cathode and anode. The BH4− oxidation reaction (BOR, Eq. 1) occurred at the anode of DBFC, and the O2/H2O2 reduction reaction (Eqs. 2 ∼ 3) occurred at the cathode, and the total cell reaction was equation 4 ∼ 5. The specific electrochemical reaction equations are as follows: Anode: BH4− + 8OH− → BO2− + 6H2O + 8e− E = −1.24 V vs. SHE(1) Cathode: O2 + 4H2O + 8e− → 8OH− E = 0.4 V vs. SHE(2) 4H2O2 + 8H+ + 8e− → 8H2O E = 1.77 V vs. SHE(3) Overall: BH4− + 2O2 → BO2− + 2H2O E = 1.64 V vs. SHE(4) BH4− + 4H2O2 → BO2− + 6H2O E = 3.01 V vs. SHE(5)
DBFC transfer 8e− during operation from the above reaction equations theoretically. However, in addition to the BOR reaction, a BH4− hydrolysis reaction will also occur on the anode, as shown in equation 6. The actual battery reaction that happens during DBFC operation is equation 7. In this way, there is xe− transferred. The BH4− hydrolysis reaction leads to a decrease in the number of electrons transferred and fuel utilization. At the same time, the hydrogen generated by hydrolysis will bring hidden dangers to the safety of DBFC. BH4− + 2H2O → BO2− + 4H2↑(6) BH4− + xOH− → BO2− + (x − 2) H2O + (4 − x/2) H2 + xe−(7)
Thus, the anode catalyst is the key factor to determine the performance of DBFC. The research on DBFC is also mainly carried out around the anode catalyst. Initially, noble metal materials such as Au (Finkelstein et al., 2013; Caglar et al., 2023; Xue et al., 2024), Pt (Liu et al., 2014; Verma et al., 2024; Kuang et al., 2024) and Pd (Braesch et al., 2018; Kaya et al., 2022; Saha et al., 2021) were commonly used as DBFC anode catalysts, and they also exhibited excellent catalytic performance. However, large-scale commercial production is challenging due to the price and reserves of precious metals. With the further development of catalytic materials, some non-noble metal materials (Ni, Co, etc.) (Ko et al., 2024; Li et al., 2023; Guo et al., 2017) and hydrogen storage alloys (Ji et al., 2024; Zhang et al., 2018) also display promising catalytic performance. They are progressively applied in DBFC anode catalyst materials. Particularly, non-noble metal materials have received extensive attention from researchers due to their low cost, simple preparation and low catalytic potential.
Metal borides (Ni-B, Co-B, and Fe-B, etc.) were first discovered by using metal salts (NiCl2, CoCl2, etc.) to catalyze the hydrolysis of BH4− to produce hydrogen. Black precipitate was found in the solution, which is called metal borides (Schlesinger et al., 1953). A large number of experimental results show that metal borides are a class of non-precious metal catalyst materials with excellent catalytic performance and can be used as catalysts for various chemical reactions. For example, Ni-B can catalyze chemical reactions such as the hydrogenation of styrene (Liu et al., 2012), the oxygen evolution reaction (Li et al., 2024), and the electrocatalytic oxidation of glucose (Zhang et al., 2013) and ethanol (Zhang et al., 2014; Zhang et al., 2014). Co-B can catalyze oxygen reduction reaction (Liu et al., 2021) and hydrolysis of ammonia-borane (Chen et al., 2022). Ni-Co-B can be used as a methanol electro-catalytic oxidation catalyst (Sunitha et al., 2020). At present, the research on metal borides as DBFC anode catalyst materials is still in the initial stage of development. Only several borides, such as NiB (Li et al., 2018), CoB (Guo et al., 2017), and Co-Ni-B (Duan et al., 2021) have been proved to have specific catalytic activity for the BOR reaction and can be used as DBFC anode catalysts. Metal borides still have broad research space and application prospects.
Generally, metal borides synthesized by chemical reduction are amorphous structures. Amorphous alloy materials have a unique structure of long-range disorder and short-range order, with the presence of dislocations and unsaturated atoms bringing excellent catalytic properties (Jin et al., 2024; Hong et al., 2024; Guo et al., 2024). The first-principles calculations including spin-polarized density functional theory show that Co, Ni and Cu in 3d transition metals (Cr, Mn, Fe, Co, Ni and Cu) are more likely to adsorb BH4− due to the strong s-dzz hybridization between the adsorbate and the metal (Arevalo et al., 2012). The catalytic effect is closely related to the surface adsorption of solid materials. The adsorption of BH4− is an essential step in catalyzing the BOR reaction. It is speculated that the introduction of Cu may improve the catalytic performance of Ni-B alloy. However, previous studies are mostly theoretical speculation and lack experimental verification. On this basis, an amorphous Ni-B alloy catalyst was synthesized by the chemical reduction method and used as DBFC anode catalyst. By analyzing the catalytic performance of the material, the Ni-B alloy catalyst with the best component ratio was selected as the basic catalyst. Then Cu was doped into the Ni-B alloy to form a ternary Ni-B-Cu catalyst by a similar synthesis method. Finally, the structure and catalytic properties of the synthesized ternary Ni-B-Cu catalyst were investigated and applied in DBFC to investigate the power density of the cell.
2 Experimental
2.1 Catalyst preparation
A series of Ni-B alloys with different compositions were synthesized by chemical reduction method using NiCl2·6H2O and KBH4 as raw materials. The preparation procedure is illustrated in Fig. 1. Specifically, NiCl2·6H2O was dissolved in distilled water (0.85 mol/L, 10 ml), and KBH4 with different amounts of substance was dissolved in 0.4 mol/L KOH aqueous solution (40 ml) to control the composition of the alloy. Then, KBH4/KOH mixed solution was added dropwise into NiCl2·6H2O solution under magnetic stirring. A large amount of gas (H2) and black precipitate are generated. Until no gas is generated, the solution is continuously magnetically stirred for an hour to ensure sufficient reaction. The obtained black precipitate was purified with distilled water and ethanol to remove by-products and impurities (KOH, KBO2, etc). Finally, the black Ni-B alloy powder with high purity was obtained by vacuum drying at 55 °C. During the synthesis process, the specific chemical reaction equations in the solution are as follows:
BH4− + 2Ni2+ + 2H2O = 2Ni + BO2− + 4H+ + 2H2↑(8)
BH4− + H2O = B + OH− + 2.5H2↑(9)
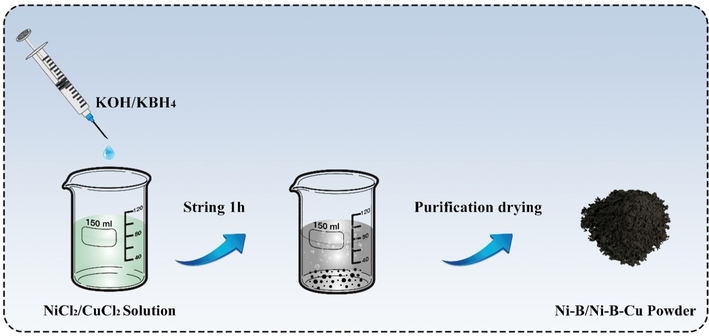
Synthetic process of the Ni-B/Ni-B-Cu catalyst.
The substantial reducing property of BH4− is utilized to reduce NiCl2 to Ni (Eq. 8). At the same time, BH4− is self-reduced into B (Eq. 9) in the solution, and finally Ni and B form Ni-B alloy in a particular proportion. The amount of substance and concentration of NiCl2 and KOH was kept constant and the composition of the alloy was controlled by adjusting the amount of KBH4 (constant concentration). For convenience, the samples were labeled S1, S2, S3, and S4, respectively. The composition ratio of Ni-B alloy was tested by ICP, as shown in Table 1. In fact, the total composition of Ni and B is about 80 % of the mass due to the alloy's oxidization. It is similar to the reported by other authors (Yuan and Zhang, 2009). The normalized atomic ratio of Ni and B in Ni-B are summarized in Table 1.
Sample
Ni (at.%)
B (at.%)
Ni:B atomic ratio
S1
86.945
13.055
1:0.150
S2
86.228
13.772
1:0.160
S3
85.917
14.083
1:0.164
S4
85.243
14.757
1:0.173
Cu-doped Ni-B alloys were synthesized by using a similar synthesis method mentioned above. In the synthesis process, CuCl2·2H2O was added to NiCl2·6H2O solution by molar ratio. The Ni-B-Cu alloys were denominated according to the amount of Cu doping and labeled with Cu0.07, Cu0.10 and Cu0.13, respectively, and corresponded to Ni: Cu (atomic ratio) = 1:0.07, 1:0.10 and 1:0.13.
2.2 Electrode preparation
Ni-B (Ni-B-Cu) alloy powder, Nafion dispersion, pure water, and ethanol were mixed into an ink-like slurry by ultrasonic in a particular proportion. The ink-like slurry was coated on the nickel foam, and the area was controlled at 1 cm2. The nickel foam coated with Ni-B and Ni-B-Cu catalysts was dried in a vacuum for 24 h and then connected with a nickel strip as an electrode. The loading of Ni-B and Ni-B-Cu catalysts was 60 mg/cm2.
2.3 Structural characterization
The content of nickel and boron elements in the Ni-B alloys was analyzed using ICP spectroscopy (PerkinElmer Optima 7300 V), and the alloy samples were subjected to acid dissolution pretreatment prior to testing. The crystal structures of Ni-B and Ni-B-Cu alloys were characterized by X-ray diffractometer (Philips PW1830) with Cu target (λ = 0.154 nm, 2θ = 15° − 80°). The microstructure and composition information were tested by SEM (Czech TESCAN MIRALMS), and TEM/EDS (Thermo Fisher Talos F200X G2). The valence state of elements was characterized by XPS (Thermo Scientific ESCALAB 250Xi), and the binding energy (BE) was calibrated with C 1 s (284.8 eV) as a reference.
2.4 Electrochemical measurements
The performance of Ni-B and Ni-B-Cu catalysts for the catalytic oxidation of BH4− was tested by cyclic voltammetry (CV) curves, chronoamperometry (CA), and electrochemical impedance spectroscopy (EIS) using an electrochemical workstation (Shanghai Chenhua CHI660E). The three-electrode system was used in the test, in which the working electrode was Ni-B/NF or Ni-B-Cu/NF (NF: Nickel foam), the counter electrode was nickel foam, and the reference electrode was Hg/HgO. The electrolyte was a mixed solution of 0.1 mol/L KBH4 and 2 mol/L KOH for CV and EIS test, 0.2 mol/L KBH4 and 2 mol/L KOH for CA test. The CV test range was −0.5 V ∼ 1.1 V vs Hg/HgO, and the scan rate was 20 mV/s ∼ 50 mV/s. The EIS test range is 0.1 Hz ∼ 105 Hz, and the initial potential is the open circuit voltage. The Nyquist plot obtained by the test is analyzed by Zview 3 software.
2.5 Fuel cell test
The single cell performance test was carried out in the self-made electrolytic cell (Fig. 2). Ni-B/NF and Ni-B-Cu/NF were used as negative electrodes, and Pt sheet (1 cm × 1 cm) was used as positive electrode. The anode electrolyte was 6 mol/L KOH and 0.8 mol/L KBH4, the cathode electrolyte was 4 mol/L H2O2 and 0.5 mol/L H2SO4, and the separator was Nafion N212. The test temperature is 25 °C. The DBFC with hydrogen peroxide oxidant is also known as the direct borohydride-hydrogen peroxide fuel cell (DBHFC).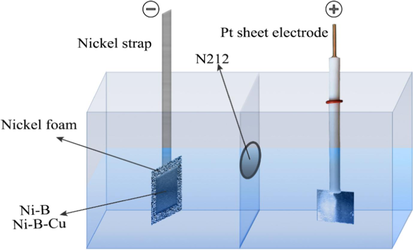
The schematic diagram of single cell assembly.
3 Results and discussion
The XRD patterns of Ni-B and Ni-B-Cu alloys are shown in Fig. 3. As seen in Fig. 3(a), all Ni-B alloys show two broader diffraction peaks near 33° and 45°, which are characteristic peaks of the amorphous state formed by metals Ni and B. It proves that the synthesized Ni-B alloy is an amorphous long-range disordered structure. PDF card #04–0836 represents the metal copper in Fig. 3(b). The XRD diffraction peaks of Ni-B-Cu alloys show crystal diffraction spikes of Cu in addition to two prominent amorphous broad peaks, and the peak intensity increases gradually with the increase of Cu content. Cu doping reduces the amorphous degree of the alloy. With the increase of Cu doping amount, the crystallinity of Ni-B-Cu alloy increases gradually.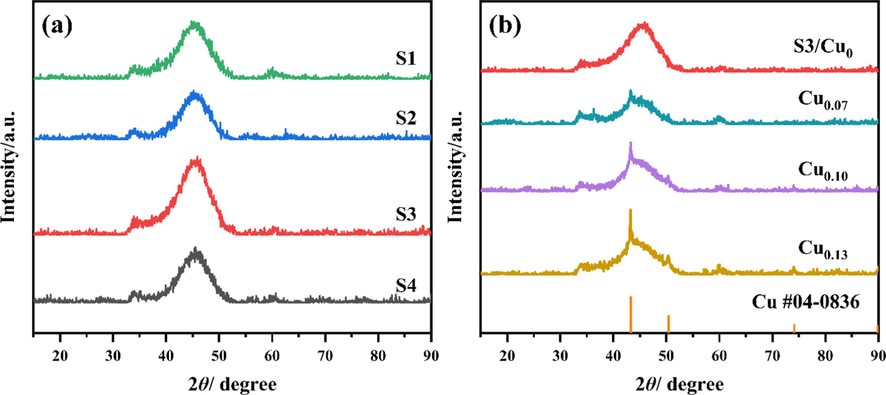
The XRD patterns of catalysts: (a) Ni-B; (b) Ni-B-Cu.
The microscopic morphology of a catalyst is significant for its catalytic activity. Fig. 4 is the SEM images of S3 and Cu0.10 alloys at different magnifications. It can be seen that the microstructure of S3 is spherical nanoparticles. As shown in the part circled with red circles in Fig. 4(b), the nanoparticles of the S3 sample are arranged in chains, which are not obvious due to heavy agglomeration. Similarly, the microstructure of Cu0.10 is also spherical nanoparticles, which are significantly smaller than those of the S3. This may be related to the strong interaction between Cu and Ni, leading to a decrease in the overall effective radius of the alloy and a decrease in the particle size. The smaller the particle size, the larger the relative specific surface area, and the better the catalytic activity. In addition, the chain structure of Cu0.10 particles is more pronounced and the chain arrangement is longer compared to S3. The chain structure of the sample is mainly related to the magnetic attraction between adjacent particles. Since the Ni element in S3 and Cu0.10 is a ferromagnetic material, the particles form a chain structure under magnetic attraction. At the same time, the crystallinity of the material also indirectly affects the formation of the chain structure. The lower the material's crystallinity, the worse the magnetic properties, resulting in a smaller driving force for the formation of the chain structure (Zhang and Manthiram, 1997). According to the XRD results, the crystallinity of Cu0.10 is higher than that of S3, the magnetic driving force for the formation of the chain structure is greater, and the chain structure is more prominent. The chain structure improves the agglomeration of the alloy, exposes more active sites, and increases the catalytic activity.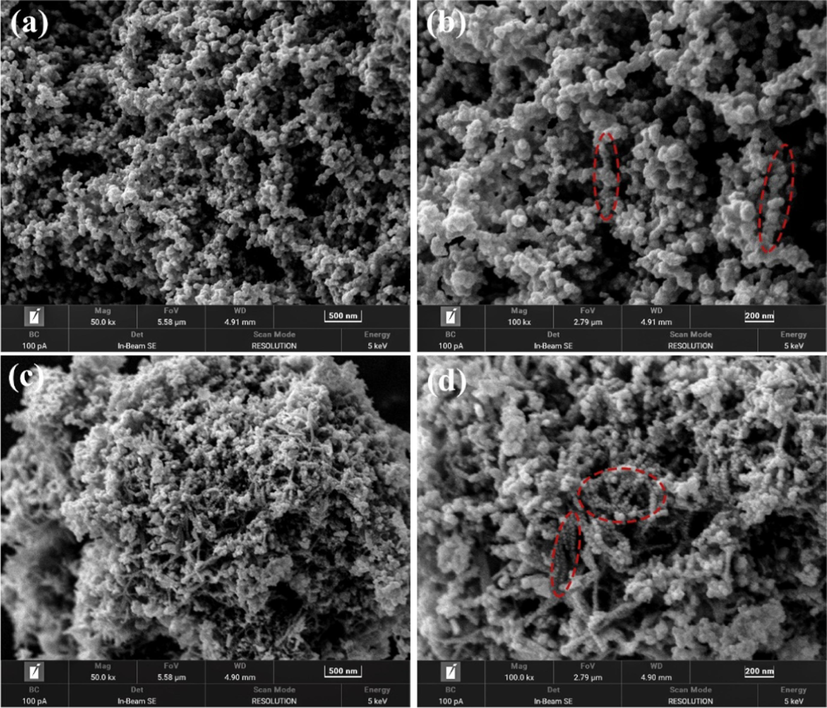
SEM images of the catalysts with different magnification: (a, b) S3; (c, d) Cu0.10.
Fig. 5 is the TEM bright-field images, the corresponding selected area electron diffraction (SAED) patterns and relative elemental mappings of S3 and Cu0.10 alloys. It can be seen that the S3 and Cu0.10 comprised uniformly spherical particles with an average size smaller than 100 nm (about 70 nm and 50 nm, respectively), indicating that the Ni-B and Ni-B-Cu alloys existed as the nanometer particles. Moreover, nanosized particles with high surface energy resulted in the particles' aggregation, and some alloy particles' self-aggregation occurred in the image. The SAED pattern of S3 and Cu0.10 displays a typical halo-diffraction of an amorphous phase rather than distinct dots, indicating the amorphous long-range order structure, and it is also consistent with the XRD results. As shown in the HAADF-STEM images and relative elemental mappings of S3 and Cu0.10, Ni, B and Cu are uniformly dispersed throughout the particles, indicating that the components of the synthesized alloy are uniformly distributed.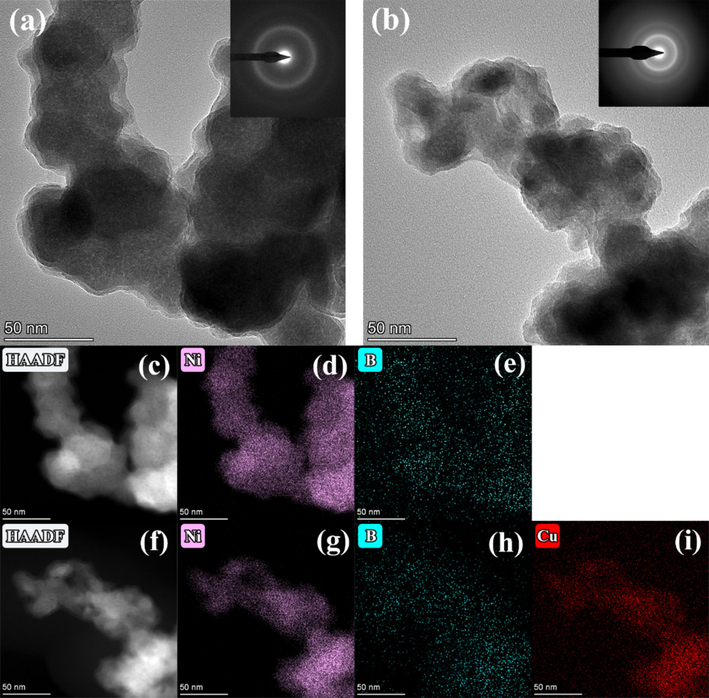
TEM bright-field images, the corresponding selected area electron diffraction (SAED) patterns and relative elemental mappings of S3 and Cu0.10 alloys: (a, c-e) S3, (b, f-i) Cu0.10.
Bonding states and electronic structures of Ni-B and Ni-B-Cu alloys can be obtained by XPS analysis. Fig. 6 is the XPS survey spectra of S3 and Cu0.10 alloys. As shown in Fig. 6, the elements nickel, boron, copper and oxygen are present in the Ni-B and Ni-B-Cu alloys. The oxygen element is mainly derived from the oxidation of the alloy surface. Fig. 6(a) and (b) show the XPS spectra of B 1 s and Ni 2p electronic levels for the S3 alloy. The spectra reveal that B and Ni exist in both elemental states, corresponding to binding energy (BE) of 188.16, 852.30 (2p3/2) and 869.59 (2p1/2) eV, respectively, and oxidized states, corresponding to binding energy (BE) of 191.81, 855.52 (2p3/2) and 873.29 (2p1/2) eV, respectively. Those oxidized states were formed during the synthesis or transferred to the measurement chamber. A positive shift of about 1.00 eV compared with the standard BE value of the pure B (187.20 eV) and negative shift of about 0.30 eV compared to pure Ni (852.60 eV). This phenomenon for amorphous transition metal borides (TMBs) materials is commonly explained as the “reverse electron transfer model” (Gunda et al., 2021). This demonstrates an electron transfer from the alloying B to the vacant d-orbital of the metallic Ni; which makes the B atom electron-deficient and the Ni atom electron-enriched. XPS data of Cu0.10 are presented in Fig. 6(c–e). As shown in the B 1 s spectrum, the peaks at 194.63, 191.95, and 188.19 eV are attributed to boron-oxide, boron-suboxide, and boron in the metal bride (Ni-B-Cu), respectively. This is basically consistent with the B1s results of Ni-B alloy, with only an additional oxidation peak due to the different degrees of surface oxidation. It also indicates that Ni-B-Cu has a higher degree of oxidation. As for the Ni 2p spectrum, the BE of 852.37 eV is assigned metallic Ni in Ni-B-Cu; the peaks at 855.94 and 873.76 eV correspond to oxidized Ni 2p3/2 and 2p1/2 electronic levels. In the Cu 2p spectrum, the BE of 932.38 and 952.28 eV assigned to metallic Cu 2p3/2 and 2p1/2, the peaks at 933.78 and 954.68 eV attributed to the Cu2+ 2p3/2 and 2p1/2 (oxidized state). Similar to the Ni-B alloy, a positive shift of for B (1.01 eV), negative shifts for Ni (0.27 eV) and Cu (0.42 eV) compared with pure B, Ni, and Cu (932.80 eV) indicates an electron transfer from the B to the Ni and Cu. The above results indicate that Ni-B and Ni-B-Cu alloy powder was prepared using the chemical reduction method and contained some oxide impurities. For amorphous Ni-B and Ni-B-Cu, electrons are transferred from B and gathered around the metal (Ni and Cu). Therefore, the electronic interaction between B and the metal enhances its electrocatalytic performance (Masa et al., 2019).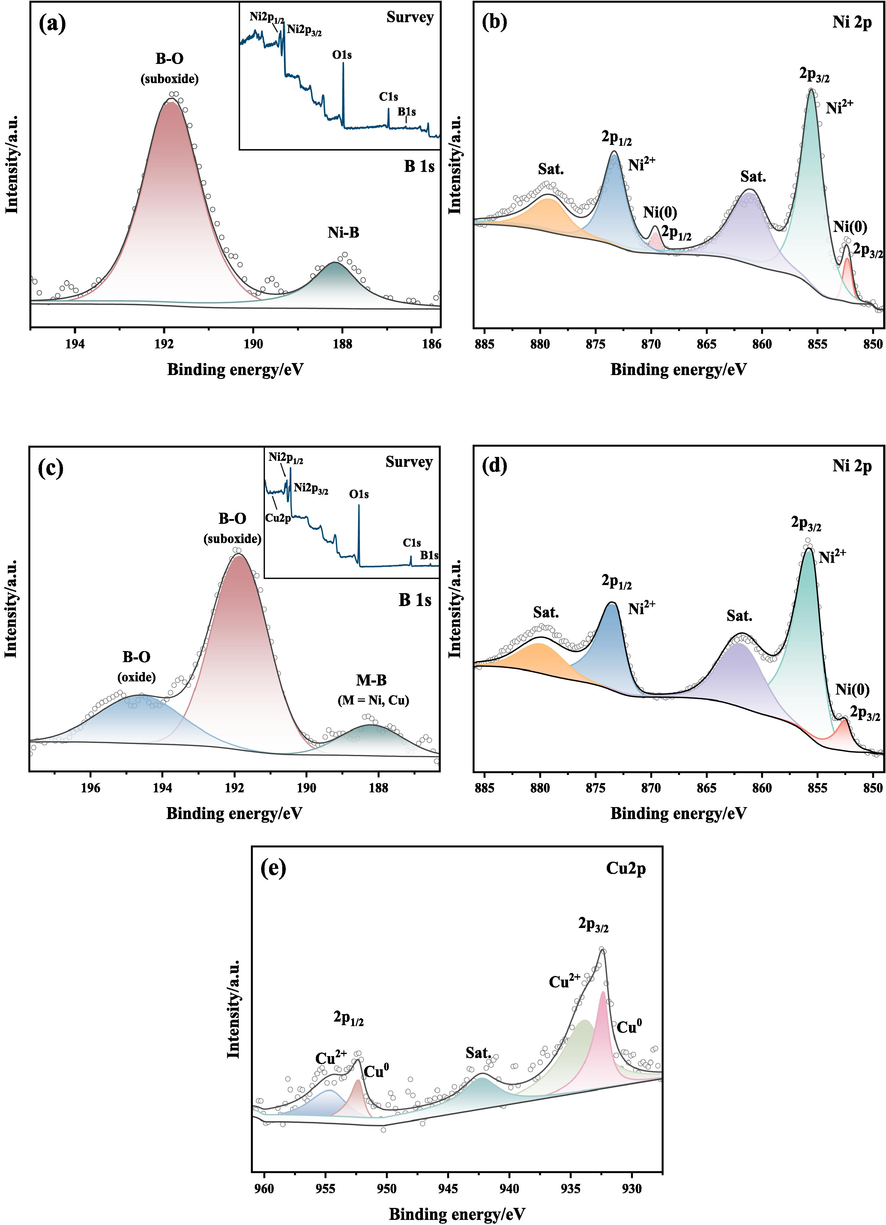
XPS spectra of S3 and Cu0.10 alloys: (a, b) S3; (c-e) Cu0.10.
To investigate the catalytic activity and stability of Ni-B and Ni-B-Cu alloys in the BOR reaction, cyclic voltammetry (CV) and chronoamperometry (CA) tests were performed, respectively. Fig. 7 shows the CV and CA curves for the Ni-B and Ni-B-Cu alloy samples. Table 2 shows the maximum oxidation peak current density and the corresponding potential value. The results are shown in Fig. 7(a) for a 60 mg/cm2 catalyst loading and a sweep rate of 20 mV/s. All Ni-B alloys have an oxidation peak at −0.35 V vs Hg/HgO, corresponding to the BH4− oxidation reaction. Among the four Ni-B catalysts, the oxidation peak current density of S3 is the largest, that is, S3 has the greatest catalytic activity for BOR reaction. To further explore the influence of scanning speed and load on the catalytic performance of S3 alloy and explore the best test conditions, the CV diagrams of S3 alloy at different scanning speeds and different loads were tested, respectively. The results of different scan rates are shown in Fig. 7(b). The catalytic activity of S3 increases with the increase of scan rate in the range of 20 ∼ 50 mV/s. The effect of loading on the catalytic performance is shown in Fig. 7(c). The larger the loading, the greater the reaction rate and the better the catalytic activity. The optimum test conditions for the CV test in the experimental range were 60 mg/cm2 and 50 mV/s. To further improve the catalytic activity of Ni-B alloy, S3 was doped with Cu to synthesize ternary Ni-B-Cu catalyst. The CV diagrams of Ni-B-Cu catalysts with different Cu doping amounts are shown in Fig. 7(d). With the increase of Cu doping amount, the oxidation peak current density increases and then decreases, and the optimal doping content of Ni: Cu = 1: 0.10. Among the three components, Cu0.10 has the best catalytic performance, and its oxidation peak current density is 1.4 times that of S3. In summary, S3 has the best catalytic activity in Ni-B alloy, Cu0.10 has the best catalytic performance in Ni-B-Cu, and Cu doping significantly improves the catalytic performance of the alloy BOR reaction. Fig. 7(e) is the chronoamperometry (CA) performed at a potential step of 0.4 V for 500 s, which displays the stabilities of the S3/NF and Ni-B-Cu/NF electrodes towards the electro-oxidation of BH4−. In the CA curves, the initial current dropped sharply and then decayed slowly. The initial current of the Ni-B-Cu/NF electrode is higher than that of the S3 electrode. Although the initial current of Cu0.13 is higher, it is significantly reduced after about 110 s, which proves it is less stable. The current of the Cu0.10 is the highest in the Ni-B-Cu/NF electrode, and no significant attenuation occurs within 500 s, indicating that the catalytic performance and stability are the best of the three alloys. It can also observe some fluctuations due to hydrogen bubbles from the hydrolysis of BH4− during the test.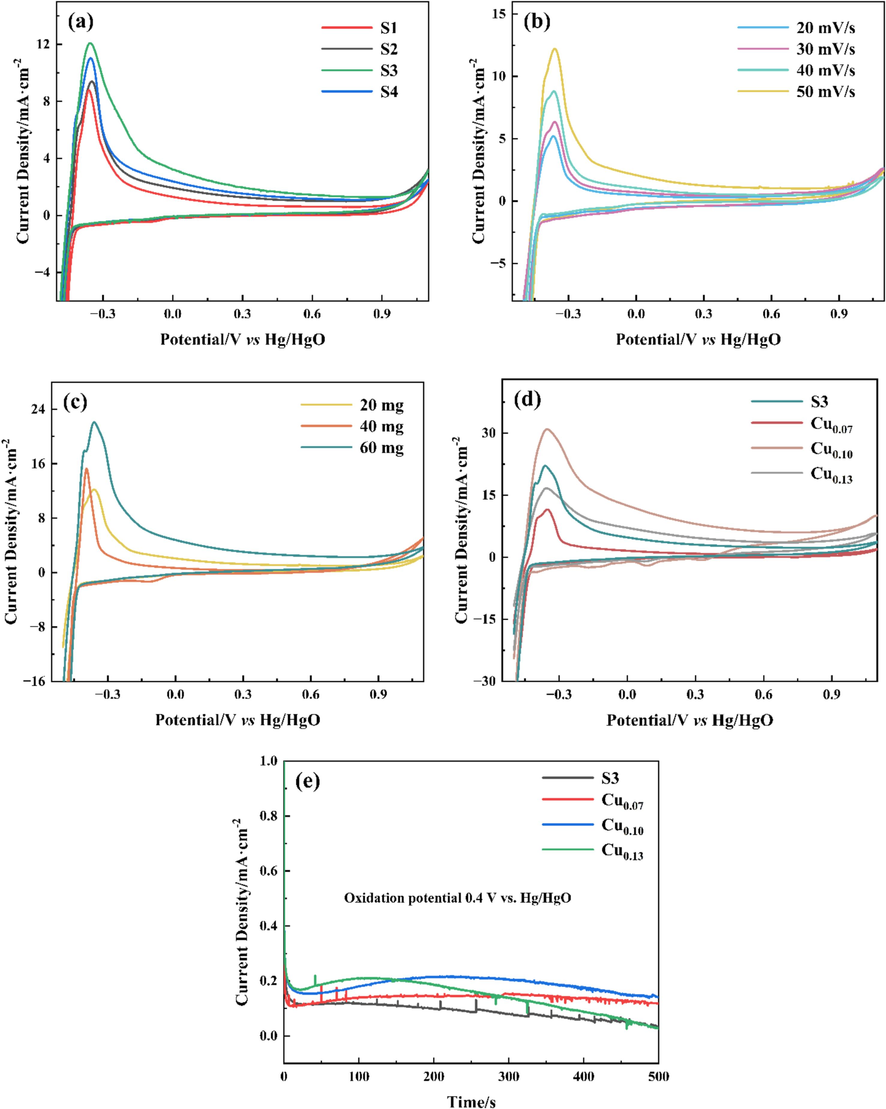
CV and CA curves of the Ni-B and Ni-B-Cu alloys: (a) CV curves of Ni-B alloys in 60 mg and 20 mV/s; (b) CV curves of S3 in 20 mg and 20 ∼ 50 mV/s; (c) CV curves of S3 in 20 ∼ 80 mg and 50 mV/s; (d) CV curves of Ni-B-Cu in 60 mg and 50 mV/s, (e) CA curves of S3 and Ni-B-Cu catalysts.
Text Condition
Alloys
Peak potential (V vs Hg/HgO)
Peak current density (mA/cm2)
60 mg, 20 mV/s
S1
−0.361
8.78
S2
−0.349
9.39
S3
−0.355
12.09
S4
−0.353
11.03
60 mg, 50 mV/s
S3
−0.363
22.08
Cu0.07
−0.353
11.52
Cu0.10
−0.355
31.03
Cu0.13
−0.355
16.67
Fig. 8 shows the EIS Nyquist diagram of the BOR reaction catalyzed by Ni-B and Ni-B-Cu alloys. Since the BOR reaction produces gases leading to unstable resistance in the low-frequency region controlled by matter transfer, only the part of the high-frequency region controlled by charge transfer is given in Fig. 8. The diameter of the semicircular arc in Fig. 8 is positively correlated with the magnitude of the impedance. In the equivalent circuit diagram, Rs represents the internal resistance of the solution, Rct represents the charge transfer resistance, and constant phase angle element (CPE) is used to represent the non-ideal behavior of the double-layer capacitance. The specific resistance values fitted by the equivalent circuit diagram are listed in Table 3. From Fig. 8(a), it can be seen that the semi-circular arc of the impedance spectrum of S3 is the smallest, indicating that S3 in Ni-B alloy is more conducive to the electrooxidation of BH4−. The charge transfer resistance of Ni-B-Cu alloy is smaller than that of Ni-B alloy (Fig. 8(b)). This is due to the fact that Cu doping improves the conductivity of the alloy, and the corresponding resistance becomes smaller. A smaller value of resistance facilitates the transfer of charge, and the more charge is transferred, the more catalytic activity of the catalyst. Therefore, the catalytic activity of S3 in Ni-B is the best, while Cu0.10 in Ni-B-Cu is the best, which is also consistent with the CV test results.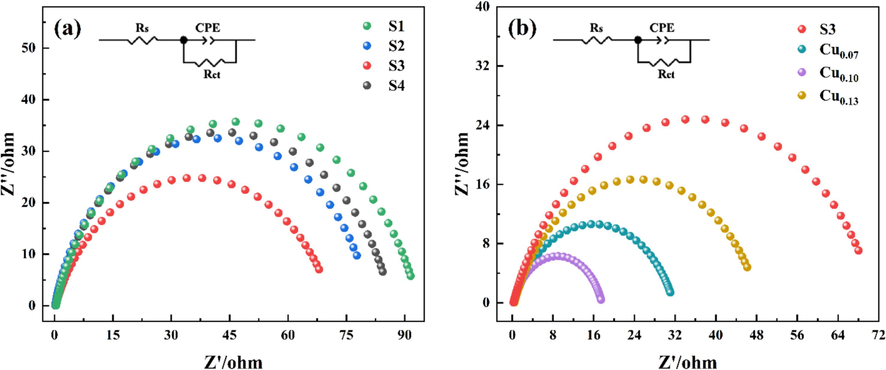
AC impedance diagram of catalysts at open circuit potential: (a) Ni-B; (b) Ni-B-Cu.
Alloys
Rs (Error%)
CPE-T (Error%)
CPE-P (Error%)
Rct (Error%)
S1
0.39 (1.52)
2.35 × 10⁻³ (1.95)
0.83 (0.43)
93.09 (1.26)
S2
0.20 (2.28)
2.44 × 10⁻³ (1.85)
0.86 (0.37)
80.98 (1.33)
S3
0.25 (2.20)
4.21 × 10⁻³ (2.38)
0.77 (0.54)
71.26 (1.71)
S4
0.31 (1.97)
3.19 × 10⁻³ (2.56)
0.84 (0.56)
86.28 (1.85)
Cu0.07
0.33 (0.86)
7.16 × 10⁻³ (1.37)
0.76 (0.34)
31.66 (0.71)
Cu0.10
0.25 (1.06)
9.54 × 10⁻³ (1.72)
0.80 (0.41)
17.33 (0.74)
Cu0.13
0.42 (1.39)
7.29 × 10⁻³ (2.16)
0.77 (0.56)
48.16 (1.58)
To investigate the performance of Ni-B and Ni-B-Cu alloy catalysts in DBFC, the polarization curves and power density tests were carried out on S3 and Cu0.10, which have the best catalytic activity among Ni-B and Ni-B-Cu, and the test results are shown in Fig. 9. It can be seen from the polarization curves that the open circuit potentials of S3 and Cu0.10 are 1.275 V and 1.845 V, respectively, which are smaller than the theoretical potential of the direct borohydride‑hydrogen peroxide fuel cell (DBHFC, 3.01 V). This is due to mixing the BOR reaction and BH4− hydrolysis reaction potential. According to the power density curve, the maximum power density shows that Cu doping increases the power density of the alloy. The maximum power density of Cu0.10 is 79.124 mW·cm−2, which is about 3.8 times that of S3 (21.063 mW·cm−2). The maximum power density of Cu0.10 is also higher than that of some precious metal catalysts (Duan et al., 2015). The results show that Ni-B-Cu can be used as a DBFC anode catalyst with excellent performance.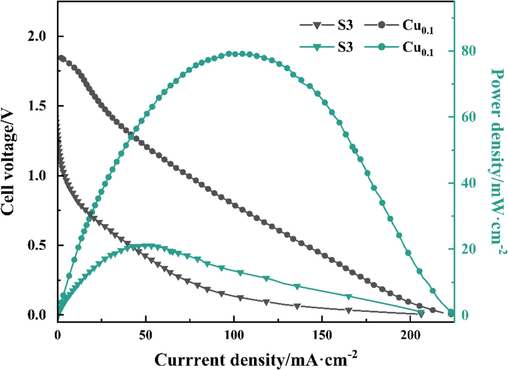
Cell polarization curves (black) and power density curves (green) of the DBFC using S3 and Cu0.1 anode catalysts at 25 ℃. (For interpretation of the references to colour in this figure legend, the reader is referred to the web version of this article.)
4 Conclusion
Ni-B alloy catalysts were prepared by chemical reduction method, and Cu was doped to synthesize ternary Ni-B-Cu alloy catalysts. The structure and properties of the catalysts were compared and analyzed, and the reasons for improving performance were explored in this paper. The results show that amorphous Ni-B alloy with low boron content has electrocatalytic oxidation performance for BOR reaction. Both from the analysis of the oxidation peak current density of the CV diagram and electron transfer impedance value, S3 has the best catalytic activity among the four Ni-B alloys. This is mainly attributed to the higher degree of amorphous matter and the smaller resistivity caused by chemical composition. With the doping of Cu, the microstructure of the alloy changes from agglomeration to chain arrangement, and the particle size of the alloy decreases. Furthermore, the conductivity and stability of the Ni-B-Cu alloys are further enhanced. As a result, the catalytic performance of the Ni-B-Cu alloys is improved. And this enhancement is related to the amount of Cu doping. The Cu0.10 showed faster electro-transfer kinetics and better stability for the BOR reaction. A large doping amount may cover part of the active center of Ni, which reduces the catalytic activity. Also, the amorphous degree of the alloy is significantly reduced, resulting in a decrease in the active site. In addition, the stability of the electrode is also poor. The Cu0.10 has the best catalytic activity among the three Ni-B-Cu alloys. The reverse electron transfer model between boron and metal leads to the enrichment of electrons around metal, which increases the Ni and Cu catalytic active sites and improves the catalytic activity. The maximum power density of DBFC with Cu0.10 as anode catalyst was 79.124 mW·cm−2, which was significantly higher than that of S3. In conclusion, both Ni-B and Ni-B-Cu have catalytic activity for BOR reaction and can be used as DBFC anode catalyst materials, and the performance of DBFC with Ni-B-Cu as catalyst is better than that of Ni-B alloy. The investigations of Ni-B and Ni-B-Cu alloy catalysts provide new ideas and a theoretical basis for the development of DBFC catalysts made of non-precious metal materials.
CRediT authorship contribution statement
Ying Zhang: Writing – original draft, Data curation. Xiao Tian: Writing – review & editing, Methodology, Funding acquisition. Jiale Han: Data curation. Xiaojie Zhang: Data curation. Yuanyuan Gao: Formal analysis. Gerile Naren: Writing – review & editing. Yanchun Yang: Writing – review & editing, Funding acquisition.
Acknowledgements
This work is supported by Natural Science Foundation of Inner Mongolia (2024MS05017), Research Program on Carbon Peaking and Carbon Neutrality at Universities of Inner Mongolia Autonomous Region (STZX202207), Inner Mongolia Autonomous Region Science and Technology Plan Project (2023YFHH0059), National Natural Science Foundation of China (62164010) and Funds for Reform and Development of Local Universities Supported by The Central Government (Cultivation of First-Class Disciplines in Physics).
Declaration of Competing Interest
The authors declare that they have no known competing financial interests or personal relationships that could have appeared to influence the work reported in this paper.
References
- A theoretical study of the structure and stability of borohydride on 3d transition metals. Surf. Sci.. 2012;606:1954-1959.
- [Google Scholar]
- Borohydride oxidation reaction mechanisms and poisoning effects on Au, Pt and Pd bulk electrodes: from model (low) to direct borohydride fuel cell operating (high) concentrations. Electrochim. Acta.. 2018;273:483-494.
- [Google Scholar]
- Characterization and electrooxidation activity of ternary metal catalysts containing Au, Ga, and Ir for enhanced direct borohydride fuel cells. J. Appl. Electrochem.. 2023;53:1207-1218.
- [Google Scholar]
- Synthesis of a novel Co–B/CuNWs/CTAB catalyst via chemical reaction at room temperature for hydrolysis of ammonia-borane. Int. J. Hydrogen Energy.. 2022;47:2976-2991.
- [Google Scholar]
- Cobalt nickel boride nanocomposite as high-performance anode catalyst for direct borohydride fuel cell. Int. J. Hydrogen Energy.. 2021;46:15471-15481.
- [Google Scholar]
- Carbon supported Cu-Pd nanoparticles as anode catalyst for direct borohydride-hydrogen peroxide fuel cells. Electrochim. Acta.. 2015;178:1126-1135.
- [Google Scholar]
- Self-poisoning during BH4- oxidation at Pt and Au, and in situ poison removal procedures for BH4- fuel cells. J. Phys. Chem. c.. 2013;117:1571-1581.
- [Google Scholar]
- Progress, challenges, and opportunities in the synthesis, characterization, and application of metal-boride-derived two dimensional nanostructures. ACS Mater. Lett.. 2021;3:535-556.
- [Google Scholar]
- Amorphous electrocatalysts for urea oxidation reaction. Prog. Nat. Sci.: Mater. Int.. 2024;34:362-375.
- [Google Scholar]
- Study of the electrooxidation of borohydride on a directly formed CoB/Ni-foam electrode and its application in membraneless direct borohydride fuel cells. J. Mater. Chem. a.. 2017;5:15879-15890.
- [Google Scholar]
- A review on sulfonated poly (ether ether ketone) based-membrane in direct borohydride fuel cell applications. Int. J. Energy Res.. 2022;46:17873-17898.
- [Google Scholar]
- Amorphous cobalt-nickel borides boost electrocatalytic ethanol oxidation coupled with energy-saving hydrogen production. Catal. Sci. Technol.. 2024;14:4007-4018.
- [Google Scholar]
- Hierarchical NiMoO4@Co3V2O8 hybrid nanorod/nanosphere clusters as advanced electrodes for high-performance electrochemical energy storage. Nanoscale.. 2020;12:3763-3776.
- [Google Scholar]
- La-doped V2O5·nH2O@OAB and flexible Fe2O3@rGO as binder-free thin film electrodes for asymmetric supercapacitors. Chem. Eng. J.. 2020;389:123534
- [Google Scholar]
- Synthesis of La-Mg-Ni@Ag composite catalyst and its catalytic performance for borohydride. Int. J. Hydrogen Energy.. 2024;51:624-637.
- [Google Scholar]
- Novel nanoporous amorphous/nanocrystalline composite structured RuNiFeCo multicomponent alloys with exceptional catalytic activity for ammonia borane hydrolytic dehydrogenation. Mater. Today Nano.. 2024;26:100485
- [Google Scholar]
- Highly active RuPd bimetallic catalysts for sodium borohydride electrooxidation and hydrolysis. J. Electron. Mater.. 2022;51:403-411.
- [Google Scholar]
- All Platinum Group Metal-Free and Durable Catalysts for Direct Borohydride Fuel Cells. ACS Appl. Energy Mater.. 2024;7:639-648.
- [Google Scholar]
- Atomically dispersed high-loading Pt-Fe/C metal-atom foam catalyst for oxygen reduction in fuel cells. J. Alloys Compd.. 2024;973:172928
- [Google Scholar]
- Ni-B nanostructured electrocatalysts with high efficiency for oxygen evolution prepared through selective dealloying from Ni-W-B amorphous alloy. Int. J. Hydrogen Energy.. 2024;68:614-622.
- [Google Scholar]
- A new application of nickel-boron amorphous alloy nanoparticles: anode-catalyzed direct borohydride fuel cell. Ionics.. 2018;24:201.
- [Google Scholar]
- Carbothermal shock synthesis of CoO/N/C nanoparticles with superior durability for oxygen reduction reaction. J. Power Sources.. 2023;587:233699
- [Google Scholar]
- Electroless preparation and characterization of Ni-B nanoparticles supported on muti-walled carbon nanotubes and their catalytic activity towards hydrogenation of styrene. Mater. Res. Bull.. 2012;47:338-343.
- [Google Scholar]
- Preparation and characterization of nanoporous carbon-supported platinum as anode electrocatalyst for direct borohydride fuel cell. Int. J. Hydrogen Energy.. 2014;39:6729-6736.
- [Google Scholar]
- In situ synthesis of Co-B-doped porous carbon through laser thermal reduction for an efficient oxygen reduction reaction. New J. Chem.. 2021;45:15562-15570.
- [Google Scholar]
- Role of boron and phosphorus in enhanced electrocatalytic oxygen evolution by nickel borides and nickel phosphides. ChemElectroChem.. 2019;6:235-240.
- [Google Scholar]
- UiO-66 metal-organic framework nanoparticles as electrocatalysis for direct sodium borohydride fuel cells. Ionics.. 2024;30:2747-2766.
- [Google Scholar]
- Direct borohydride fuel cells: A selected review of their reaction mechanisms, electrocatalysts, and influence of operating parameters on their performance. Curr. Opin. Electrochem.. 2022;32:100883
- [Google Scholar]
- Development of bimetallic PdNi electrocatalysts toward mitigation of catalyst poisoning in direct borohydride fuel cells. ACS Catal.. 2021;11:8417-8430.
- [Google Scholar]
- Sodium borohydride as a fuel for the future. Renewable and Sustainable Energy Rev.. 2011;15:3980-4001.
- [Google Scholar]
- Procedures for the Preparation of methyl borate. J. Am. Chem. Soc.. 1953;75:213-215.
- [Google Scholar]
- Nickel boride and cobalt boride coated stainless steel gauze for enhance electrochemical oxidation of methanol. Ionics.. 2020;26:1875-1884.
- [Google Scholar]
- Ethylene-vinyl acetate binder-based carbon-supported Pt Anode empowered by potassium borohydride fuel for direct borohydride fuel cells: defining strategies to achieve ambient long-endurance performance. J Solid State Electrochem. 2024
- [Google Scholar]
- Engineering partially oxidized gold via oleylamine modifier as a high-performance anode catalyst in a direct borohydride fuel cell. ACS Appl. Mater. Interfaces. 2024
- [Google Scholar]
- Preparation and magnetic properties of amorphous Co-Cu-B alloy nano-powders. Intermetallics.. 2009;17:281-284.
- [Google Scholar]
- Chains composed of nanosize metal particles and identifying the factors driving their formation. Appl. Phys. Lett.. 1997;70:2469-2471.
- [Google Scholar]
- Electrocatalytic oxidation of glucose on highly dispersed Ni-B/Nanoporous Cu amorphous alloy electrode. Acta. Chim. Sin.. 2013;71:1676-1682.
- [Google Scholar]
- In situ synthesis of nickeleboron amorphous alloy nanoparticles electrode on nanoporous copper film/brass plate for ethanol electro-oxidation. Int. J. Hydrogen Energy.. 2014;39:3100-3108.
- [Google Scholar]
- Ni-B amorphous alloy nanoparticles modified nanoporous Cu toward ethanol oxidation in alkaline medium. J. Power Sources.. 2014;247:428-436.
- [Google Scholar]
- Enhanced electrocatalytic HER performance of non-noble metal nickel by introduction of divana-dium trioxide. Electrochim. Acta.. 2019;320:13453.
- [Google Scholar]


