

Translate this page into:
Synthesis of magnesium oxide nanoparticles and its application for photocatalytic removal of furfural from aqueous media: Optimization using response surface methodology
⁎Corresponding authors. lailimohamadi@gmail.com (Leili Mohammadi), a.dargahi29@yahoo.com (Abdollah Dargahi), fatemehpirdadeh@yahoo.com (Fateme Pirdadeh)
-
Received: ,
Accepted: ,
This article was originally published by Elsevier and was migrated to Scientific Scholar after the change of Publisher.
Peer review under responsibility of King Saud University.
Abstract
Furfural is a toxic compound with an LD50 of 65 mg/kg that is produced in many industries, such as paper industries, petrochemical industries, and oil refineries. This compound exists in various concentrations in these industries and is released into the environment. Therefore, removing this contaminant from the wastewater of production units is among the environmental priorities of every company. This study investigated the optimization of photocatalytic removal of furfural using synthesized magnesium oxide nanoparticles (MgONPs) by the response surface method (RSM). In this study, MgONPs were prepared by the direct precipitation method, and the characteristics of the nanoparticles (NPs) were examined using XRD and SEM analyses. The effect of various operating parameters, including pH (3, 7, and 11), contact time (15, 90, and 165 min), initial concentration of furfural (25, 150, and 275 mg/L), dose of NPs (125, 687.5, and 1250 mg/L), and UV radiation intensity (8, 15, and 30 µW/cm2) on furfural removal was explored. Furfural concentration was measured using a spectrophotometer at a wavelength of 277 nm. The number of samples was determined by the CCD method. Data were analyzed using MINITAB 16 software. The optimal removal conditions based on variance analysis and appropriate model were obtained at a pH of 6, NP dose of 1 g/L, initial concentration of 250 mg/L, reaction time of 160 min, and UV radiation intensity of 30 µW/m2. Under these conditions, the removal efficiencies for both furfural and COD were 99.97%. The results of the analysis of the synthesized MgONPs also showed that the direct precipitation method is a fast and low-cost method for the synthesis of MgONPs. Results showed that the photocatalytic process in the presence of synthesized MgONPs is highly efficient in removing furfural from aqueous media.
Keywords
Synthesized MgONPs
Photocatalytic Process
Furfural
Response surface methodology (RSM)

1 Introduction
The oil and petrochemical industries are fundamental industries providing numerous benefits, such as employment opportunities and contributing to development. However, they are also among the largest sources of pollution, releasing various chemical compounds into the environment and contaminating it (Leili et al., 2012, Almasi et al., 2019, Ghanbari et al., 2022). One such contaminant is furfural (C5H4O2), a colorless, oily liquid with a pungent, and aromatic odor that is produced or used in many industries such as petrochemicals, pharmaceuticals, oil refineries, food, and paper industries (Shu 2006), (Singh et al., 2009, Pourali et al., 2022). Furfural can have serious health effects when inhaled or swallowed and can cause long-term health problems such as weakness, skin rashes, tumors, enlargement of the liver, and nosebleeds (Nezamzadeh-Ejhieh and Moeinirad 2011).
To protect aquatic habitats and non-aquatic life from the harmful effects of furfural, it is necessary to remove this substance before releasing it into the environment. Traditional methods for removing contaminants, such as clarification separation, often require a lot of energy and do not remove the contaminant to an appropriate extent (Ghosh et al., 2010). Biological purification is also costly, time-consuming, and not very useful on a large scale. Therefore, researchers have developed new methods, such as photocatalysis, which is a low-cost and highly efficient method for removing hazardous organic compounds (Mano et al., 2015).
Advanced oxidation processes based on the production of hydroxyl radicals (OH) have a variety of advantages, including high efficiency and the absence of secondary pollution (Bhatkhande et al., 2003). Among these methods, photocatalytic processes using nanoparticles have shown promising results. When exposed to ultraviolet radiation, photons with energy equal to or greater than the gap energy cause electrons to be excited from the valence band to the conduction band, creating electron vacancies (h + ) in the valence band. These NPs have a high specific surface area, which makes them suitable for absorbing various organic compounds. Among them, magnesium oxide nanoparticle (MgONP) is a basic oxide with salient features including low cost, non-volatility, non-toxicity, high availability, stable reuse, and high reactivity (Umar and Aziz 2013) (Katsoni et al., 2011, Rauf et al., 2011, Tajbakhsh et al., 2014).
Various methods can be used to produce NPs, such as sol–gel, hydrothermal, homogenization, and mechanical methods. The direct precipitation method is more suitable than other common methods thanks to its low cost and the possibility of controlling the size of NPs (El Ghandoor et al., 2012, Seidmohammadi et al., 2021). The features of NPs depend on their production and construction method and can be measured and identified by various methods and devices such as scanning electron microscopy (SEM), transmission electron microscopy (TEM), x-ray diffraction (XRD), and isotherm (BET) (Seid-Mohammadi et al., 2020, Dargahi et al., 2022a, Dargahi et al., 2022b).
Previous studies have investigated the removal of furfural using photocatalytic processes and RSM. Researchers have suggested that the adsorption process can be effective in removing furfural (Zeitsch 2000, Nezamzadeh-Ejhieh and Moeinirad 2011). Other studies have analyzed the metabolic conversion of furfural into furfural alcohol under anaerobic conditions through the use of microorganisms (Belay et al., 1997). Additionally, researchers have been able to decompose furfural through biotransformation using yeast cells covalently attached to cellulose granules (Ivanova and Yotova 1993). Zazouli et al. (2013) investigated the ability of TiO2/sun and TiO2/UV to remove furfural using the RSM; mentioned systems were able to remove furfural with an efficiency of 45% and 85%, respectively (Zazouli et al., 2013).
The present study aims to evaluate the feasibility of optimizing the photocatalytic removal of furfural using synthesized MgONPs in aquatic media through the statistical RSM method.
2 Materials and methods
This is an experimental, applied, and laboratory-scale study conducted in a semi-continuous reactor. Samples were prepared in the laboratory using furfural and double-distilled water. All the chemicals used in the study were highly pure chemicals manufactured by Merck Company. A laboratory-made reactor made of plexiglass with a primary chamber (a useful volume of 2 L) and a secondary chamber (a useful volume of 3 L) was used (Fig. 1). To reduce the temperature caused by UV lamp radiation, water continuously flowed into the chamber. Also, the reactor was covered with an aluminum cover to prevent the reflection of ultraviolet rays coming out of the reactor and to increase the efficiency of furfural decomposition. At each stage, 250 ml of samples containing concentrations of 25, 150, and 275 mg/L of furfural was used under UV radiation with a radiation power of 8, 15, and 30 µW/m2. Since the flow in the reactor was discontinuous, a magnet at the end of the reactor was utilized to homogenize the effluent and mix the NPs with the effluent. Before conducting the experiments, we used sulfuric acid and sodium hydroxide to adjust the different pH values of the samples. Based on the model and previous studies, we selected the parameters as follows: the amount of NPs (125, 687.5, and 1250 mg/L), reaction time (15, 90, and 165 min), pH values (3, 7, and 11), initial concentration of furfural (25, 150, and 275 mg/L) and radiation intensity (8, 15, and 30 µw/cm2) (See Table 1). MgONPs were synthesized by the chemical precipitation method. They underwent characterization tests. The adsorption of furfural was measured at the wavelength of 277 nm using a spectrophotometer.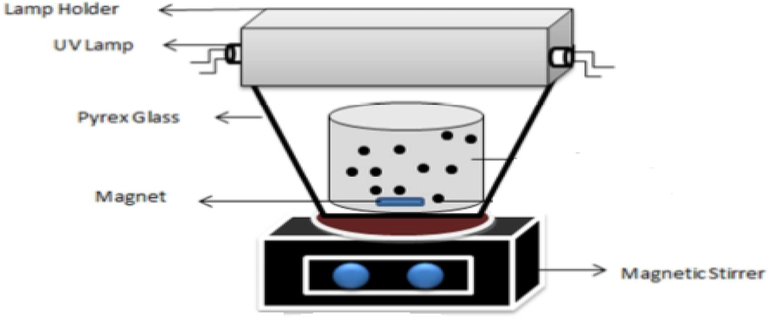
Schematic of the reactor used in the photocatalytic process.
Independent variables
Symbol
Unit of measurement
level
−1
0
+1
pH
X1
–
3
7
11
The amount of nanoparticles
X2
mg/L
125
687.5
1250
Initial concentration of furfural
X3
mg/L
25
150
275
contact time
X4
minutes
15
90
165
radiation intensity
X5
µw/cm2
8
15
30
2.1 Synthesis of NPs
Fig. 2 shows the steps of MgONPs synthesis. MgONPs are synthesized in two steps. Various processes such as mixing, stirring, filtering, drying, and grinding were conducted. Initially, 5.13 g of Mg (No3)2 6H2O was poured into a beaker to make a 0.2 M solution in distilled water. Then, we dissolved 2.041 g (0.5 M) of NaOH in 100 ml of distilled water. Stirring the magnesium nitrate solution using a magnetic stirrer was kept for half an hour. Subsequently, dropwise addition of 0.5 M sodium hydroxide solution was done to the prepared magnesium nitrate solution (MgNo3·6H2O) (while stirring it continuously). After 30 min, a milky white precipitate of magnesium hydroxide appeared in the glass. The pH of the solution was 12.5 (it was measured by pH paper). We filtered the precipitate using a filter paper and washed it with methanol three to four times to remove the ionic impurities. We then dried it in the air. After drying, the white powder sample was annealed in air for two hours at a temperature of 300 to 500 °C. We crushed the dried powder using a mortar and converted it into a very fine powder (Cushing et al., 2004, Cui et al., 2009).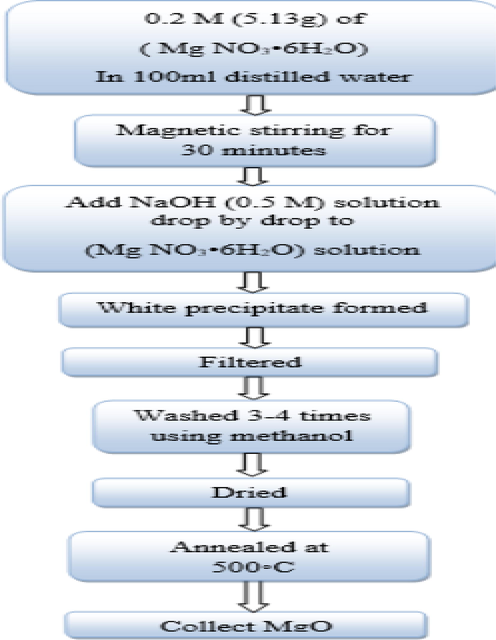
Synthesis steps of MgONPs by co-precipitation method.
The chemical reaction that occurred during the synthesis as well as the block diagram of the entire process are shown below:
The SSA of NPs is a factor influencing the physical and chemical properties. After the end of each process, the sample was placed in a centrifuge for 10 min at a speed of 3000 rpm to make the NPs settle and separate them.
2.2 Sample design and data analysis
At first, we estimated the number of samples through the Central Composite Design (CCD) model to evaluate the effect of independent variables on the performance of the response and predict the best response value. The independent variables in this study were pH (X1), the amount of NPs (X2), initial concentration of furfural (X3), contact time (X4), and intensity of UV radiation (X5); we designed a total of 64 runs in 3 levels with 12 central repetition points (to estimate the error percentage of the sum of squares) using MINITAB 16 software. In this statistical model, the experiments were conducted completely randomly and based on statistical principles. R-Sq and R-SqAdjusted coefficients were utilized to determine the quality of the polynomial model, and analysis of variance (ANOVA) was our desired statistical method to analyze the responses. Three-dimensional plots were designed to better understand the effects of the variables. P ≤ 0.05 was considered as the significance level. The reason for using this statistical model is the high cost of NPs, reducing the sample volume and presenting the final linear equation.
3 Results and discussion
3.1 The synthesis of MgONPs
After the synthesis of MgONPs, we used the X-ray diffraction spectrum to analyze the synthesized NPs, examine the crystal structure of the particles, determine the phase, and evaluate the size of the synthesized MgONPs. Also, scanning electron microscopy (SEM) analysis was utilized to determine the morphology of the NPs. Fig. 3 shows the SEM images of MgONPs calcined at 400 °C. Fig. 4 shows the XRD analysis of the sample of the synthesized MgONPs.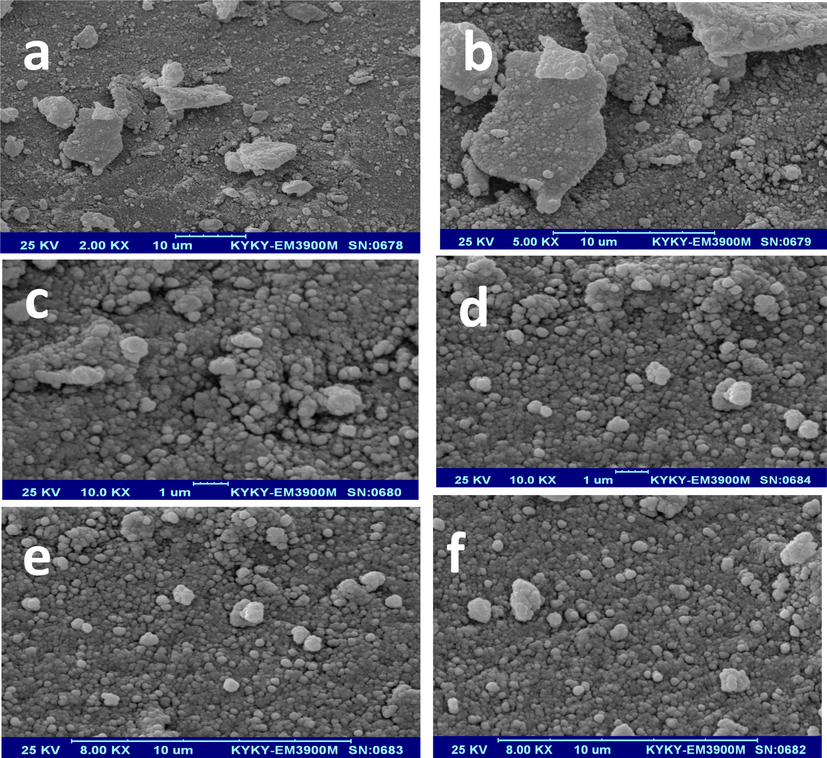
SEM analysis of synthesized MgONPs.
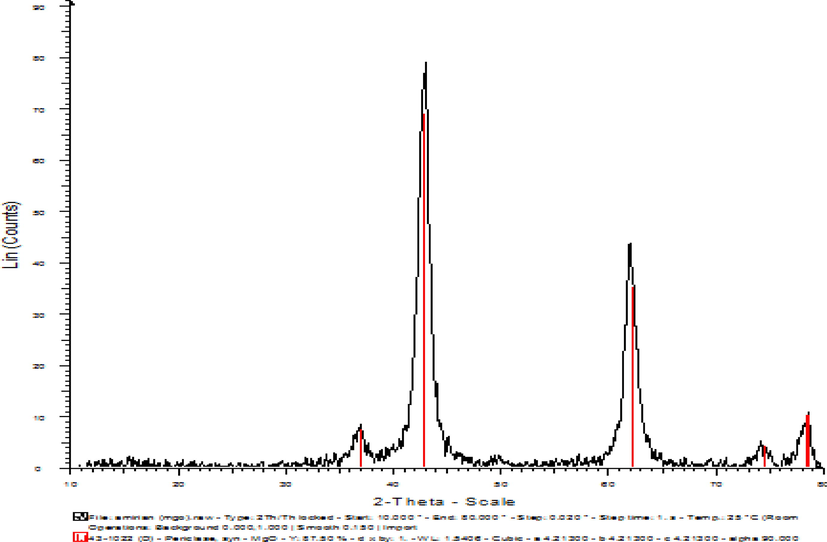
XRD analysis of synthesized MgONPs.
3.2 Model optimization and statistical analysis
Based on the recorded initial amounts of furfural in the samples and the calculation of the remaining furfural, calculating the removal efficiency of furfural was done at each RUN of the experiment, the results of which are given in Table 2.
RUN
radiation intensity
(µw/cm2)contact time (min)
Initial concentration of furfural
(mg/L)The amount of nanoparticles
(mg)pH
Experimental efficiency
(%)Predicted efficiency
(%)
1
1
−1
1
1
−1
84.100
83.6388
2
0
0
0
0
0
81.600
81.4992
3
−1
1
−1
−1
−1
59.500
59.4545
4
−1
−1
−1
−1
1
57.200
57.1689
5
−1
1
−1
−1
−1
59.400
59.4545
6
0
1
0
0
0
89.500
89.1930
7
−1
0
0
0
0
78.893
78.7291
8
1
−1
1
1
−1
83.200
83.6388
9
0
0
0
0
0
81.500
81.4992
10
0
0
0
0
−1
73.210
73.2191
11
0
0
0
0
0
81.400
81.4992
12
−1
−1
−1
−1
1
57.100
57.1689
13
0
1
0
0
0
89.200
89.1930
14
0
0
1
0
0
92.100
92.1996
15
1
1
−1
1
−1
62.770
63.0491
16
1
0
0
0
0
85.100
85.0097
17
0
0
0
0
−1
73.174
73.2191
18
0
0
0
0
1
77.049
76.7342
19
0
0
−1
0
0
66.070
65.7193
20
−1
1
1
−1
1
86.020
85.9851
21
0
0
0
0
0
81.300
81.4992
22
−1
1
1
1
−1
84.400
84.3579
23
0
0
0
0
0
81.200
81.4992
24
−1
−1
−1
1
−1
48.052
47.9777
25
−1
−1
1
−1
−1
78.020
77.9391
26
0
0
0
0
0
81.020
81.4992
27
0
0
−1
0
0
66.033
65.7193
28
1
−1
1
−1
1
85.330
85.2209
29
1
−1
−1
−1
−1
58.050
58.0603
30
0
0
1
0
0
92.010
92.1996
31
1
−1
−1
1
1
60.693
60.9751
32
1
1
1
−1
−1
93.713
93.6480
33
1
1
−1
−1
1
65.600
65.4313
34
1
1
1
1
1
97.200
97.2848
35
0
−1
0
0
0
81.716
81.3999
36
1
0
0
0
0
85.080
85.0097
37
0
−1
0
0
0
81.145
81.3999
38
0
0
0
−1
0
77.400
77.7585
39
0
0
0
0
0
81.650
81.4992
40
0
0
0
1
0
78.100
77.5779
41
0
0
0
0
0
81.500
81.4992
42
1
1
−1
1
−1
63.200
63.0491
43
1
−1
−1
−1
−1
58.100
58.0603
44
−1
−1
1
−1
−1
78.000
77.9391
45
0
0
0
0
0
81.350
81.4992
46
0
0
0
0
1
76.849
76.7342
47
−1
1
−1
1
1
64.100
64.1478
48
1
1
1
−1
−1
93.700
93.6480
49
−1
1
1
−1
1
86.000
85.9851
50
0
0
0
0
0
81.200
81.4992
51
0
0
0
−1
0
77.800
77.7585
52
−1
0
0
0
0
78.780
78.7291
53
−1
−1
1
1
1
80.000
80.0324
54
0
0
0
0
0
81.000
81.4992
55
0
0
0
1
0
77.748
77.5779
56
1
1
1
1
1
97.300
97.2848
57
0
0
0
0
0
81.770
81.4992
58
1
1
−1
−1
1
65.200
65.4313
59
1
−1
1
−1
1
85.200
85.2209
60
−1
1
−1
1
1
64.000
64.1478
61
−1
1
1
1
−1
84.300
84.3579
62
−1
−1
−1
1
−1
47.800
47.9777
63
1
−1
−1
1
1
61.100
60.9751
64
−1
−1
1
1
1
80.020
80.0324
Based on the analysis of the variance of the test data presented in Table 3 (ANOVA), the model has a statistically significant relationship for the photocatalytic process of furfural removal with linear and cubic conditions. • Ss = Sum of squares. • M Seq = Mean squares.
Source
Degree of freedom (DF)
Ss
*M Seq**
Adj ss
Adj MS
F
regression
20
25.8645
25.8645
26.432
84.675
0.000
linear
5
96.7323
96.7323
79.146
90.228
0.000
square or square
5
59.1207
59.1207
52.241
20.377
0.000
Interaction
10
70.113
70.113
37.11
63.177
0.000
Pure error
37
76.1
76.1
0.05
0.000
Total
63
10.864
0.000
3.3 Calculation of linear equations designed by software
Performing a multivariate regression analysis of the test data was considered to estimate the regression coefficients. The final model was obtained according to the linear equation of Table 4, which shows the empirical relationship between the tested variables and the coded removal efficiency. In these equations, X1, X2, X3, X4, and X5 represent the pH, NP dose, furfural initial concentration, reaction time, and UV radiation intensity, respectively. The difference in values is significant when 5% of the levels are significant.
• S = 0.253006 R-Sq = 99.97 R-Sq(adj) = 99.95.
Coefficient
Estimation coefficient
T
The significance level
Fixed coefficient
A0
18.4992
1594.035
0.000
X1
A1
1.7575
14.68
0.000
X2
A2
−0.0903
2.141
0.000
X3
A3
31.2401
29.407
0.038
X4
A4
3.8966
29.407
0.000
X5
A5
3.1403
47.472
0.000
X12
A6
−6.5226
75.192
0.000
X22
A7
−3.8311
–33.592
0.000
X32
A8
−2.5398
–22.27
0.000
X42
A9
3.7972
33.295
0.000
X52
A10
0.03702
3.246
0.002
X 1X 2
A11
1.1695
62.148
0.000
X 1X3
A12
−0.6401
−14.312
0.000
X 1X4
A13
−0.2151
−4.81
0.000
X 1X5
A14
−0.4431
−9.906
0.000
X 2X4
A16
0.4054
9.064
0.000
X 2X5
A17
0.4137
9.249
0.000
X 3X 4
A18
0.409
9.145
0.000
X 3X5
A19
0.7944
17.763
0.000
X 4X5
A20
0.0432
0.966
0.34
3.4 Validation of the response surface model
Fig. 5 depicts the distribution plot of test data against the predicted values of furfural removal by the model, which indicates the acceptability of the model.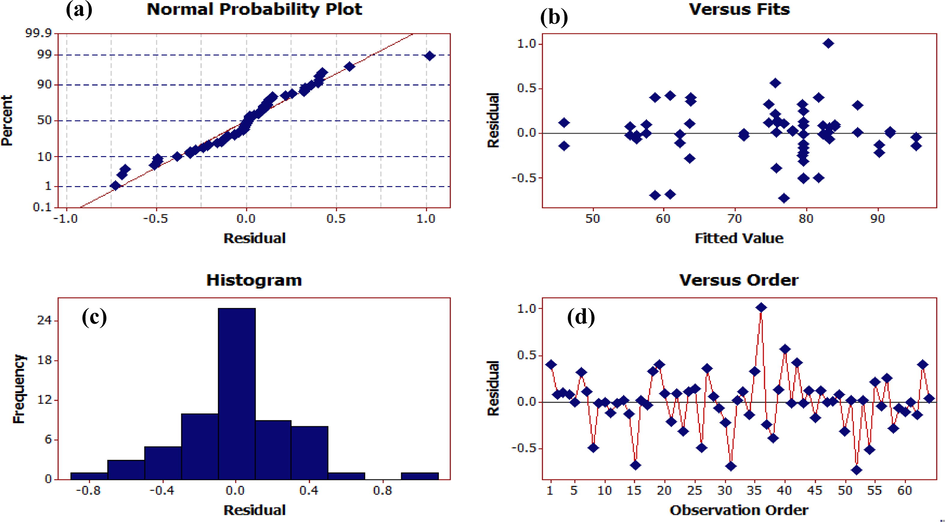
Distributional plot of test data against the values predicted by the surface response model of furfural removal. (a) Normal probability plot, (b) versus fits, (c) histogram, (d) versus order.
Figures a and b depict the normality of the residuals. In Figure a, the bisection line of the first quadrant is the expected values of the normal distribution of the residual points. The closer these points are to the line, the greater normality of the residuals. In Graph a, no deviation could be detected in normality of the residuals. Figure b, which is the histogram of the residuals, also shows the same thing.
Figure c shows the distribution diagram of the residuals against the given values to examine the assumption of constant variance of the residuals. This assumption is accepted if no particular trend is seen in this diagram. No particular trend indicating a change in the variance was observed, so we accept constancy of the variance.
Figure d shows the distribution of residuals based on the time order of data collection to check for independence between residuals. If no particular trend, such as sinusoidal nature of this graph, is observed, this assumption is accepted. In this graph, we noticed no particular trend to reject the assumption of the independence of the residuals.
According to the results, the normal probability and the residuals outside the model design satisfactorily cover the data of the ANOVA table. The residual values showed the normal distribution of the applied variables near the mean values, so the model can be used to predict the efficiency values of furfural removal by the photocatalytic process. The above graphs showed the agreement between the experimental and predicted values.
As depicted by Fig. 6, the highest removal efficiency is obtained in the middle range of NPs, after which the efficiency decreases after applying an increase in the amount of NPs. Also, the removal efficiency increased in the neutral pH value compared to the acidic and alkaline states. The simultaneous increase in the values of NP and pH had a positive effect on removal efficiency, and the maximum efficiency of furfural removal was about 81%.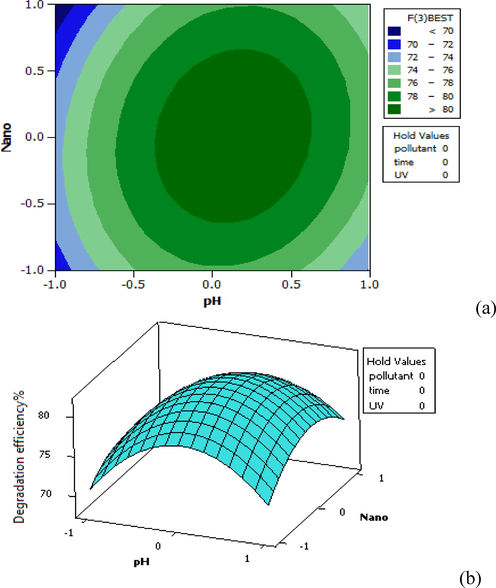
Distribution plot of pH-Nano test data (against the predicted values of furfural removal, in 3D (a) and Contour plot (b).
As shown in Fig. 7, the efficiency has increased in the medium amount of NPs and increased intensity of UV radiation. However, it has decreased after increasing NPs from medium to high, although the intensity of UV radiation has increased.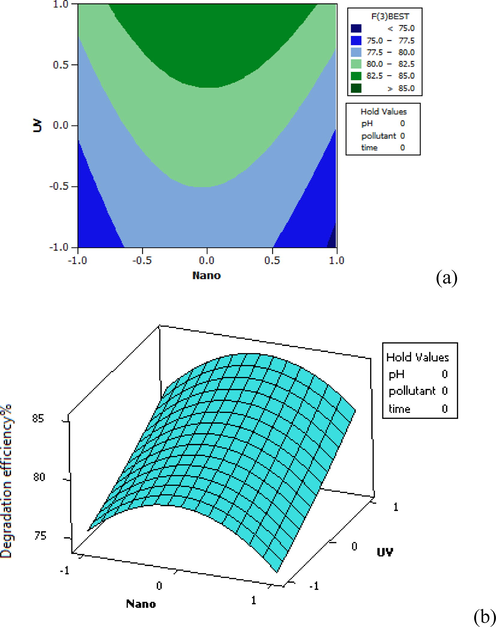
Distribution plot of UV-Nano test data against the predicted values of furfural removal in 3D (a) and Contour plot (b).
As seen in Fig. 8, the removal efficiency of about 84% has been obtained in medium pH values with the application of the maximum intensity of UV radiation. The pH variable has had a greater effect on the removal efficiency than the radiation intensity. For this reason, the removal efficiency has decreased by an increase in the pH value despite the maximum intensity of radiation.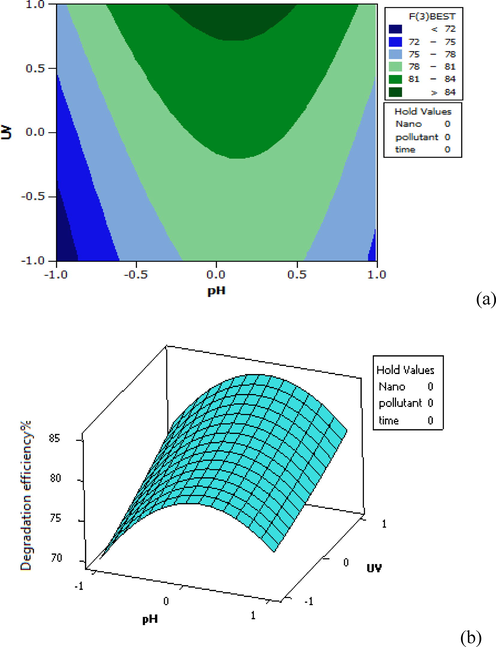
Distribution plot of UV-pH test data against the predicted values of furfural removal in 3D (a) and Contour plot (b).
3.5 Characterization of MgONPs
According to Fig. 4, which depicts the XRD analysis of the synthesized MgONPs, there are peaks in the range of 37, 43, 62, 74, and 78° (in terms of ɵ) in the spectrum.
According to Fig. 3, which shows the SEM images of MgONPs, the surface morphology and size of nanocatalysts were examined using this technique. As seen in the Figure, these nanoparticles are well distributed with a spherical appearance and a diameter of 64 nm.
3.6 Effect of pH changes on the performance of MgONPs
In this statistical method, all the variables were examined simultaneously and in combination. Therefore, among the software-designed tests, we compared those in which all the variables were constant, except for pH value, to examine the effect of pH on them.
According to Table 2, in tests 18, 17, 10, 4, and 46, all the variables were the same, except for pH. In tests 10 and 17, the pH value was 3, in which case the removal efficiencies were reported to be 73.21% and 73.176%, respectively. In tests, 2, 9, and 11, where all variables were considered constant, the pH value was 7, and the removal efficiencies were reported to be 81.6%, 81.5%, and 81.4%, respectively.
Tests 4, 18, and 46 with a pH of 11 had removal efficiencies of 57.2%, 77.029%, and 76.84%, respectively. As seen, the efficiency increases as a result of an increase in the pH level until neutral, then it decreases by an increase in the alkalinity. This statistical method had the ability to analyze the effects of variables in linear, quadratic, and interferential forms. In all experiments, linear, quadratic (pH × pH), and interferential (effect of pH × NP dose, time, initial concentration of furfural, and intensity of UV radiation) forms were all significant, meaning that they influenced the removal efficiency.
This finding is consistent with the results of Lee et al.on the removal of humic acid in the presence of chromium through the photocatalytic decomposition of titanium dioxide nanoparticles (Yang and Lee 2006) and Bazarafshan et al.s study on the photocatalytic removal of aniline through the use of MgONPs(Bazrafshan et al., 2016a). These studies showed that the pH of the medium is effective on the oxidation rates of photocatalytic decomposition, and it depends on the type of contaminant, the point of zero charge of the catalyst (pHzpc), the surface of the catalyst, the ionization conditions, and the pKa value (and in fact the electrostatic interaction between the catalyst surface and the contaminant) (Dehghani and Fadaei 2015). The results of the studies indicated that the reason for the decreased efficiency in alkaline media is that high pH provides the opportunity for the formation of carbonate ions, which is an effective scavenger of OH– ions and can reduce the decomposition rate (Hasani et al., 2021). Considering available reports, the pH of the solution becomes alkaline after adding MgONPs to it (Sasaki et al., 2011, Kermani et al., 2013), and the pH of the medium becomes excessively alkaline when the pH is adjusted in alkaline conditions. In these conditions, magnesium oxides react with water molecules and decompose (The following equation). As a result, magnesium oxide loses its properties at very high pH levels, in which case furfural removal efficiency decreases.
Moreover, in the photocatalytic decomposition process, an electron pair is formed when NPs semiconductor is exposed to photons with an energy equal to or greater than the energy of the empty cavity. At neutral pH, the released electrons have the ability to react with the oxygen atom as an electron acceptor, and the oxygen atom is converted from O2 to O2–° (Dianati Tilaki et al., 2015). The produced O2–° and OH° react with furfural and cause its decomposition.
3.7 Effect of changes in NP dose on furfural removal
To observe the effect of MgONP dose on furfural removal, as Table 2 shows, we analyzed tests 38, 40, 51, and 55, where all the variables were the same, except for the NP dose. The MgONP dose variable was significant in linear, quadratic, and interferential forms, indicating that it had an effect on the removal efficiency. In tests 38 and 51, NPs of 125 mg/L yielded the removal efficiencies of 77.4% and 77.8%, respectively. In tests 40 and 55, the amount of MgONPs was 1250 mg/L, resulting in removal efficiencies of 78.1% and 77.74%, respectively. In tests 2, 9, and 11, where all variables were considered constant, the NP dose was 687.5 mg/L, and the removal efficiencies were 81.6%, 81.5%, and 81.4%%, respectively. It indicates an increase in MgONPs increases the rate of furfural removal. However, according to tests 40 and 55, if the amount of NP exceeds a certain limit, it no longer affects the removal of furfural, but the decrease in efficiency is removed. The reason for this is the aggregation or the accumulation of particles, which reduces the contact surface. In addition, as a result of an increase in the contact surface, the number of NPs that receive radiation decreases, which leads to diminishing removal efficiency. Studies have shown that an increase in the amount of MgO causes more production of hydroxide radicals because of the increase in the number of active sites and the increase in the production of free electrons in the conductive band. As a result, the contaminant removal percentage increases (Abramović et al., 2013). This finding is in line with the result of Zazouli et al.s study entitled Effect of Sunlight and Ultraviolet Radiation in the Titanium Dioxide (TiO2) Nanoparticles for Removal of Furfural from Water (Zazouli et al., 2013).
3.8 Effect of changes in furfural concentration on the performance of MgONPs
According to Table 2, in tests 14, 19, 27, 30, and 44, all the variables were the same, except for furfural concentration. The furfural concentration variable was significant in linear, quadratic, and interferential forms, indicating that it had an effect on the removal efficiency. In tests 19 and 27, where the concentration of furfural was 25 mg/L, the removal efficiency rates were reported to be 66.07% and 66.03%, respectively. However, tests 14 and 30 with furfural concentration of 275 mg resulted in removal efficiencies of 92.1% and 92.01%, respectively. In tests 2, 9, and 11, where all the variables were considered constant, the initial concentration of furfural was 150 mg/L, and the removal efficiencies were 81.6%, 81.5%, and 81.4%, respectively. According to the results of the tests, it is concluded that an increase in the initial concentration of furfural leads to an increase in removal efficiency. The reason for that can be the greater access of the adsorbent to the adsorbate, which can easily be in contact with each other (Tewari et al., 2005).
Bazarafshan et al. also showed an increase in the removal efficiency of cadmium from aqueous solutions by an increase in cadmium concentration. An increase in cadmium dose from 25 to 150 mg/L led to an increase in the removal efficiency from 68% to 79% (Bazrafshan et al., 2016b). The study by Das and Ghuha on the removal of trivalent chromium using biomass also demonstrated similar results (Das and Guha 2007).
3.9 Effect of UV radiation intensity changes on furfural removal
The radiation intensity is another factor affecting furfural removal efficiency. The radiation intensity variable was significant in linear, quadratic, and interferential forms (except for interference with reaction time, which was insignificant and did not affect the removal efficiency), that is, it had an effect on the removal efficiency.
In tests 7, 16, 36, and 52, all the variables, except for the intensity of UV radiation, were considered constant. In tests 7 and 52, the UV radiation intensity was 8 µw/cm2, in which case the removal efficiencies were reported to be 78.893% and 78.78%, respectively. The UV radiation intensity value was 30 µw/cm2 in tests 16 and 36; for these tests, the removal efficiencies were reported to be 85.08% and 85.1%, respectively. Also, according to tests 2, 9, and 11, where all the variables were considered constant, the intensity of UV radiation was 15 µw/cm2, and the removal efficiency was 81.6%, 81.5%, and 81.4%, respectively. It can be seen that an increase in radiation intensity leads to an increase in the furfural removal efficiency. Studies have represented that as a result of an increase in the power of the lamp which leads to an increase in the radiation intensity, NPs become more excited and consequently produce more hydroxyl radicals. It is consistent with the results of Ayati et al. obtained for removing acid orange 7 by the ozonation/photocatalytic hybrid process (Ayati 2015) and Arabkhani et al. detected for the photocatalytic removal of furfural with zinc oxide nanoparticles (Parastar et al., 2012).
3.10 Effect of changes in reaction time on furfural removal
In tests 5, 6, 13, 35, and 37, all variables, except for the reaction time, were considered the same by the software. Tests 35 and 37, with a reaction time of 15 min, yielded the removal efficiencies of 81.716% and 81.145%, respectively. The reaction time variable was significant in linear, quadratic, and interferential forms (except for interference with radiation intensity, which was significant and did not affect the removal efficiency), that is, it had an effect on furfural removal efficiency.
According to tests 2, 9 and 11, where all the variables were considered constant, an increase in the reaction time leads to an increase in the furfural removal efficiency. Initially, more removal efficiency could be recognized, but subsequently an increase in time slows it down. It can be due to the decomposition of the contaminant at the beginning of the process by free radicals produced by the electron excitation of NPs. With an increase in the reaction time, although the excitation process of NPs and the production of hydroxyl free radicals did not decrease, some of the produced free radicals were used for the decomposition of these compounds due to the formation of intermediate organic compounds caused by the decomposition of furfural, As a result, the amount of contaminant removal decreased. Studies have shown that an increase in the contact time results in an increase in the percentage of contaminant removal; this is due to the increased excitation of NPs with time, and therefore, the increased number of OH radicals and positive cavities produced (Parastar et al., 2012). Ghasemi et al. investigated the photocatalytic removal of furfural using UVC/TiO2/GAC at different times. They found that the photocatalytic reaction of furfural removal is a Pseudo-first-order reaction, where the maximum amount of furfural removal increases with an increase in time and the highest rate of removal efficiency occurs in 80 min (Ghasemi et al., 2016).
3.11 Analysis of synthesized MgONPs
The crystal size measurement technique was emploiyed to interpret the data in this study. In XRD spectra, the size of the particles depends on the intensity of the peak, the height of the peak, and the angle at which the maximum peak appears. The lower the height of the peak, the smaller the particles will be. Also, according to Scherrer Equation, the size depends on the value of ɵ and ᵦ. Therefore, basically, the smaller the angle of the peak in terms of ɵ and the greater the width of the peak, the smaller the particle size will be. As Fig. 4 shows, the XRD spectra of the synthesized samples have large and sharp peaks, which indicates a good crystalline structure in the synthesized NPs. In this analysis, we observed that the synthesized MgONPs correspond to the reference JCPDS, Card No. 1451–36. As seen in Fig. 3 related to the SEM analysis, the synthesized MgONPs are almost uniform. The particles are small and have a spherical structure.
3.12 Optimization of photocatalytic removal of furfural using synthesized MgONPs
In order to obtain the optimal conditions for removing furfural using the photocatalytic process, the optimization process searches for a combination of variable levels in which the maximum removal of furfural occurs. The response level software selects and predicts the best operating conditions for the variables, which is considered the best achievable conditions of the process. It searches for optimal conditions for each variable in a special way and then optimizes this operation based on the target of the response. Fig. 9 shows the results of the optimal amount of photocatalytic removal by the software.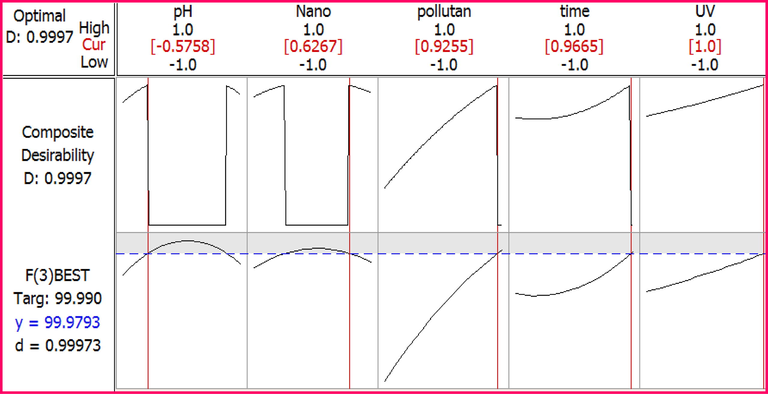
Optimal conditions designed for the photocatalytic removal of furfural by RSM.
A complementary test was performed with optimal conditions designed by the software (Table 5), which confirmed the results obtained with the values predicted by the software.
parameter
Optimal values
Furfural removal efficiency%
experiments
Predicted
pH
6
97.99
99.99
The amount of nanoparticles
1 g/l
Initial concentration of furfural
250 mg/L
contact time
160 min
radiation intensity
30 µw/cm2
The final test was conducted with optimal conditions using synthesized MgONPs (for comparison with commercial MgONPs) and was repeated 4 times, resulting in efficiencies of 99.97%, 97.5%, 98.1%, and 99.98%. These results indicate the high efficiency of the synthesized MgONPs in the photocatalytic removal of furfural. The list of abbreviations used in the study is shown in Table 6.
MgONPs
magnesium oxide nanoparticles
RSM
response surface method
NPs
nanoparticles
UV
Ultraviolet radiation
CCD
central composite design
COD
Chemical Oxygen Demand
THF
tetrahydrofuran
LC50
Lethal concentration 50
SEM
scanning electron microscopy
TEM
transmission electron microscopy
XRD
x-ray diffraction
BET
Brunauer-Emmett-Teller (BET)
4 Conclusion
The results of this study showed that the quadratic model was helpful in the removal of furfural by the combined process, and the response surface design can be used to evaluate a large number of variables with the least number of tests. Statistical analyses for the maximum furfural removal showed that the optimal values to achieve the highest removal efficiency for pH variables, NP dose, reaction time, intensity of UV radiation, and initial concentration of furfural were about 6, 1 g/L, 160 min, 30 µw/cm2, and 250 mg/L, respectively. Under optimal conditions, a removal efficiency of 97.99% can be achieved. The results indicated that it is possible to optimize the combined process used for removing furfural using the response surface statistical model in a certain number of tests in the final and optimized stages. This study showed that the furfural optimization method is an appropriate method with a high capability of meeting environmental standards. Concerning the synthesis of MgONPs, it revealed that the direct precipitation method is reasonable thanks to the simplicity of the production method, the lack of need for special expensive equipment for production, and the environmentally-friendly nature of these materials. Furthermore, considering the high efficiency of the synthesized MgONPs in the photocatalytic removal of furfural under optimal conditions, the use of MgONPs for removing furfural represents a promising approach to developing effective and sustainable methods for treating industrial wastewater, and the synthesized NPs can be replaced with commercial MgONPs for furfural removal.
Acknowledgement
This paper is the result of Fatemeh Pirdadeh’s Master’s thesis in Environmental Health Engineering (project No. 7709). Thanks are due to Zahedan University of Medical Sciences for its financial support of this study.
Declaration of Competing Interest
The authors declare that they have no known competing financial interests or personal relationships that could have appeared to influence the work reported in this paper.
References
- Photocatalytic degradation of the herbicide clomazone in natural water using TiO2: kinetics, mechanism, and toxicity of degradation products. Chemosphere. 2013;93:166-171.
- [Google Scholar]
- Optimizing biological treatment of petroleum industry wastewater in a facultative stabilization pond for simultaneous removal of carbon and phenol. Toxin Rev.. 2019;40:189-197.
- [Google Scholar]
- Investigation of kinetic and intermediate products of acid orange7 removal by hybrid ozonation/photocatalytic processes. Modares Civ. Eng. J.. 2015;15:79-89.
- [Google Scholar]
- Photocatalytic degradation of aniline in aqueous solutions using magnesium oxide nanoparticles. J. Mazandaran Univ. Med. Sci.. 2016;26:126-136.
- [Google Scholar]
- Biosorption of cadmium from aqueous solutions by Trichoderma fungus: kinetic, thermodynamic, and equilibrium study. Desalin. Water Treat.. 2016;57:14598-14608.
- [Google Scholar]
- Anaerobic transformation of furfural by Methanococcus deltae (Delta) LH. Appl. Environ. Microbiol.. 1997;63:2092-2094.
- [Google Scholar]
- Photocatalytic degradation of nitrobenzene using titanium dioxide and concentrated solar radiation: chemical effects and scaleup. Water Res.. 2003;37:1223-1230.
- [Google Scholar]
- Strategies of large scale synthesis of monodisperse nanoparticles. Recent Pat. Nanotechnol.. 2009;3:32-41.
- [Google Scholar]
- Recent advances in the liquid-phase syntheses of inorganic nanoparticles. Chem. Rev.. 2004;104:3893-3946.
- [Google Scholar]
- Enhanced electrocatalytic degradation of 2, 4-Dinitrophenol (2, 4-DNP) in three-dimensional sono-electrochemical (3D/SEC) process equipped with Fe/SBA-15 nanocomposite particle electrodes: degradation pathway and application for real wastewater. Arab. J. Chem.. 2022;15:103801
- [Google Scholar]
- Electrochemical degradation of 2, 4-Dinitrotoluene (DNT) from aqueous solutions using three-dimensional electrocatalytic reactor (3DER): Degradation pathway, evaluation of toxicity and optimization using RSM-CCD. Arab. J. Chem.. 2022;15:103648
- [Google Scholar]
- Biosorption of chromium by Termitomyces clypeatus. Colloids Surf. B Biointerfaces. 2007;60:46-54.
- [Google Scholar]
- Survey efficiency of ultraviolet and zinc oxide process (UV/ZnO) for removal of diazinon pesticide from aqueous solution. Water Wastewater. 2015;26:12-18.
- [Google Scholar]
- Efficiency and kinetics studies of photocatalytic degradation of 4-Chlorophenol from aqueous solutions by sunlight in the presence of zinc oxide nanoparticles. J. Health. 2015;6:134-143.
- [Google Scholar]
- Synthesis and some physical properties of magnetite (Fe3O4) nanoparticles. Int. J. Electrochem. Sci.. 2012;7:5734-5745.
- [Google Scholar]
- Biodegradation of Acid Orange 7 dye using consortium of novel bacterial strains isolated from Persian Gulf water and soil contaminated with petroleum compounds. Biomass Conversion Biorefinery 2022:1-12.
- [Google Scholar]
- Enhanced photocatalytic degradation and mineralization of furfural using UVC/TiO2/GAC composite in aqueous solution. Int. J. Photoenergy 2016
- [Google Scholar]
- Pervaporative separation of furfural from aqueous solution using modified polyurethaneurea membrane. Desalination. 2010;252:1-7.
- [Google Scholar]
- Degradation of basic violet 16 dye by electro-activated persulfate process from aqueous solutions and toxicity assessment using microorganisms: determination of by-products, reaction kinetic and optimization using Box–Behnken design.
- Biotransformation of furfural by yeast cells covalently bound to cellulose granules. Acta Biotechnol.. 1993;13:79-82.
- [Google Scholar]
- Degradation of trinitrophenol by sequential catalytic wet air oxidation and solar TiO2 photocatalysis. Chem. Eng. J.. 2011;172:634-640.
- [Google Scholar]
- Degradation efficiency and kinetic study of metronidazole by catalytic ozonation process in presence of mgo nanoparticles. Stud. Medical Sci.. 2013;24:839-850.
- [Google Scholar]
- Removal of furfural from wastewater using combined catalytic ozonation process (COP) and cyclic biological reactor (CBR)[dissertation]. Tehran: Tarbiat Modares University; 2012.
- Water treatment efficacy of various metal oxide semiconductors for photocatalytic ozonation under UV and visible light irradiation. Chem. Eng. J.. 2015;264:221-229.
- [Google Scholar]
- Heterogeneous photocatalytic degradation of furfural using NiS-clinoptilolite zeolite. Desalination. 2011;273:248-257.
- [Google Scholar]
- Photocatalytic removal of nitrate from aqueous solutions by ZnO/UV process. J. Health. 2012;3:54-61.
- [Google Scholar]
- Enhanced three-dimensional electrochemical process using magnetic recoverable of Fe3O4@ GAC towards furfural degradation and mineralization. Arab. J. Chem.. 2022;15:103980
- [Google Scholar]
- An overview on the photocatalytic degradation of azo dyes in the presence of TiO2 doped with selective transition metals. Desalination. 2011;276:13-27.
- [Google Scholar]
- Sorption characteristics of fluoride on to magnesium oxide-rich phases calcined at different temperatures. J. Hazard. Mater.. 2011;191:240-248.
- [Google Scholar]
- Photocatalytic degradation of metronidazole (MnZ) antibiotic in aqueous media using copper oxide nanoparticles activated by H2O2/UV process: biodegradability and kinetic studies. Desalin. Water Treat.. 2020;193:369-380.
- [Google Scholar]
- Improved degradation of metronidazole in a heterogeneous photo-Fenton oxidation system with PAC/Fe3O4 magnetic catalyst: biodegradability, catalyst specifications, process optimization, and degradation pathway. Biomass Conversion Biorefinery 2021:1-17.
- [Google Scholar]
- Degradation of dyehouse effluent containing CI Direct Blue 199 by processes of ozonation, UV/H2O2 and in sequence of ozonation with UV/H2O2. J. Hazard. Mater.. 2006;133:92-98.
- [Google Scholar]
- Fixed-bed study for adsorptive removal of furfural by activated carbon. Colloids Surf. A Physicochem. Eng. Asp. 2009;332:50-56.
- [Google Scholar]
- MgO nanoparticles as an efficient and reusable catalyst for aza-Michael reaction. J. Iran. Chem. Soc.. 2014;11:665-672.
- [Google Scholar]
- Study on biosorption of Cr (VI) by Mucor hiemalis. Biochem. Eng. J.. 2005;23:185-192.
- [Google Scholar]
- Photocatalytic degradation of organic pollutants in water. Organic pollutants-monitoring, risk and treatment.. 2013;8:196-197.
- [Google Scholar]
- Removal of Cr (VI) and humic acid by using TiO2 photocatalysis. Chemosphere. 2006;63:1677-1684.
- [Google Scholar]
- Effect of sunlight and ultraviolet radiation in the titanium dioxide (TiO2) nanoparticles for removal of furfural from water. J. Mazandaran Univ. Medical Sci.. 2013;23:126-138.
- [Google Scholar]
- The chemistry and technology of furfural and its many by-products. Elsevier; 2000.


