

Translate this page into:
Synthesis of polyaspartic acid-glycidyl adduct and evaluation of its scale inhibition performance and corrosion inhibition capacity for Q235 steel applications
⁎Corresponding author. hualiyiwang@163.com (Xinhua Liu)
-
Received: ,
Accepted: ,
This article was originally published by Elsevier and was migrated to Scientific Scholar after the change of Publisher.
Peer review under responsibility of King Saud University.
Abstract
Modified polyaspartic acid (PASPG) was synthesized as a scale and corrosion inhibitor. The scale inhibition performance of PASPG was slightly affected by pH (5–9) and [Ca2+]. PASPG exhibited both high scale inhibition efficiency and good corrosion inhibition performance.
Abstract
In this work, the development of the eco-friendly comprehensive scale and corrosion inhibitor based on green polyaspartic acid (PASP) was presented. In this view, PASPG was prepared by a ring-opening graft modification reaction of polysuccinimide (PSI) with glycidyl. In addition, the molecular structure and the thermal stability of PASPG were characterized by using three different methods (FTIR, 1H NMR, and TGA). PASPG’s scale inhibition efficiency and corrosion inhibition efficiency were also evaluated, respectively. More concretely, the scale inhibition efficiency of PASPG achieved 94.6 % and 95.1 % for CaCO3 and CaSO4, respectively. With the aid of the FTIR and SEM measurement techniques, it was found that PASPG could induce the irregular growth of the CaCO3 and CaSO4 morphology and destroy the formation of crystals. On the other hand, the higher corrosion efficiency of 85.17 % was achieved by PASPG in comparison with PASP (72.53 %). PASPG is a mixed inhibitor and the adsorption of PASPG on the Q235 steel surface followed the Langmuir mono-layer adsorption isotherm. The formation of a protective film on the surface of carbon steel was proved by PASPG’s adsorption, which increased the resistance to be eroded. Thus, the surface of carbon steel can be effectively protected. The present work provides a simple and effective pathway for the synthesis of high-efficiency green scale and corrosion inhibitor, by introducing a functional group into the PASP chains. The implementation of such type of chemical modification method may also be an effective strategy for improving the efficiency of other polymers green scale and corrosion inhibitors.
Keywords
Polyaspartic acid/glycidyl
Ring-openning graft modification
Scale and a corrosion inhibitor
Scale and corrosion inhibition efficiency
Electrochemical measurement

1 Introduction
With the rapid development of the economy, the demand for water in industrial production has greatly increased. Therefore, the shortage of water poses serious problems. One effective way to solve this problem is recycling water resources [Chen et al. 2020, Nayunigari et al. 2016]. However, during the recycling process of the cooling water, the concentration of Ca2+ is gradually increased and a massive scale will be formed. The scale will be then attached to the surface of the pipeline or the equipment of the cooling water system, resulting in the reduction of the efficiency of the heat transfer procedure and the acceleration of the pipeline corrosion [Chaussemier et al. 2015, Al-Roomi and Hussain. 2015, Guo et al. 2021].
Along these lines, to inhibit the formation of the calcium scale crystal, a number of phosphorus-containing scale inhibitors have been proposed in the literature. However, the utilization of such types of inhibitors (e.g. trimethylene phosphonic acid (ATMP) and polyether polyaminomethylene phosphonate (PAPEMP)) could lead to the eutrophication of the water when discharged to the rivers [Ketrane et al. 2009, Zhang et al. 2017, Yang et al. 2017, Wang et al. 2016]. With the enhancement of people’s awareness of environmental protection, the phosphorus-free and green inhibitor has attracted wide attention from the scientific community [Abd-El-Khalek et al. 2016]. One representative green inhibitor is polyaspartic acid (PASP). In order to further expand the comprehensive performance of scale and corrosion inhibition, grafted modification of PASP has been studied in the literature [Shi et al. 2016, Zhang et al. 2016]. By introducing new functional groups, such as carboxyl, sulfonic, and sulfhydryl, etc., new polymers can be obtained and the performance of the PASP is enhanced [Zhou et al. 2021, Shi et al. 2018]. This is because the polymers have high solubility, good fluidity, and a large number of terminated functional groups. On top of that, the polymers can be easily adsorbed on the surface of the CaCO3 and CaSO4 crystals. For example, Fu et al. [ Fu et al. 2020] and Chen et al. [Chen et al. 2020] synthesized polyaspartic acid grafted β-cyclodextrin, and polyaspartic acid/oxidized starch copolymer (PASP/GO), respectively, which showed their good anti-scale performances to CaSO4 and CaCO3. Sun et al. [Sun et al. 2015] synthesized the graft copolymer of polyaspartic acid-tryptophan by introducing carboxyl and unsaturated heterocyclic groups, which improved the scale inhibition performance compared with the conventional PASP. Zhao et al. [Zhao et al. 2021] developed the graft copolymer of poly (aspartic acid) / aminomethanesulfonic acid and demonstrated its good anti-scale performance as an oilfield scale inhibitor.
In addition, the concentration of the corrosive ions (e.g. Cl- and SO42-) is also increased when the cooling water is recycled, which induces the corrosion products (e.g. Fe2O3) to attach on the pipeline and reduces the heat transfer efficiency [Farag and Hegazy 2013, Fu et al. 2010]. In order to relieve this issue, Zeino et al. [Zeino et al. 2018] proposed the PASP with Zn2+ as a new inhibitor, enhancing the efficiency to 97 % through a synergistic mechanism. Gao et al [Gao et al., 2015] studied a mixture of PASP-SEA-ASP, Zn2+, 2-hydroxyphosphonoacetic acid (HPAA), and hexadecylldimethyl (2-sulfite) ethyl ammonium. The authors reported good corrosion inhibition performance in seawater. To further reduce the use of heavy metal ions, polyaspartic acid was modified with small green molecules containing amino groups. Chai et al [Chai et al. 2020] examined dopamine modified PASP, whose corrosion inhibition efficiency in the acid solution is relatively high because of the effective adsorption of its molecule on the metal surface. Migahed et al. [Migahed et al. 2016] synthesized polyaspartic acid/glycine graft copolymer and the corrosion inhibition efficiency of the GLY-PASP compound reached for 83.8 % at 250 mg/L. Chen et al. [Chen et al. 2019] grafted threonine onto the side chain of PASP to synthesize a polyaspartate threonine derivative (PASP-THR). From the experimental results, it was demonstrated that the inhibition efficiency of PASP-THR was greatly higher than that of PASP. As discussed above, the existing works in the literature mainly utilize the amino from amino acid to improve the inhibition performance by introducing it into the conventional PASP. Glycidyl(Gly) is mutually soluble in water and has active chemical properties. Moreover, it contains hydroxyl and ester groups and can occur esterification with a carboxylic acid. Therefore, Gly is regarded as a good modifier. For example, Huang et al. [Huang et al. 2019] studied the scale inhibition performance of polyepoxysuccinic acid modified by Gly, which is environmentally friendly and possesses high scale inhibition efficiency.
However, to the best of our knowledge, there is no report in the literature about using hydroxyl and ester from Gly to simultaneously improve the scale and the corrosion inhibition efficiency of PASP in simulated industrial water. Based on the above-mentioned findings, Gly was selected and linked to the side chain of PASP through a simple ring-opening grafting reaction of polysuccinimide (PSI) to prepare a novel PASP derivative (PASPG) in this work. Then, the comprehensive scale inhibition and the corrosion inhibition performance of PASPG were investigated by using the static scale inhibition method, weight loss method, and the electrochemical measurement method in the simulated industrial water. On these bases, in terms of the measurement of the scale inhibition mechanism, Fourier transform infrared spectroscopy(FTIR) and scanning electron microscope(SEM) experiments were also conducted to visualize the change in the morphology of both the CaCO3 and CaSO4 crystals. The adsorption behaviour and mechanism of PASPG on the Q235 steel surface were discussed. As expected, in comparison with PASP, PASPG, and blank showed greatly improved scale inhibition and corrosion inhibition performance due to the presence of pendent functional groups.
2 Experimental
2.1 Reagents and instruments
PSI and Gly was obtained from Shanghai Kangtuo Chemical Co. ltd. (Shanghai, P.R. China). Sodium hydroxide, anhydrous calcium chloride, anhydrous sodium sulfate, absolute ethanol, sodium bicarbonate, EDTA disodium was purchased from Tianjin Yongda Chemical Reagents Co., ltd (Tianjin, P.R. China). All reagents mentioned above are reagent grade and used without further purification. The specimen of Q235 Carbon steel (72.4 × 11.5 × 2 mm3) were supplied by Gaoyou Qinyou Instrument Chemical Co., ltd (Gaoyou, P.R. China).
Instruments utilized in the experiments include VERTEX7O Fourier Infrared Spectroscopy (FTIR), Tga-4000 Thermogravimetric analyzer(TGA), SIGMA300 scanning electron microscopy(SEM), Pulsar TM NUCLEAR magnetic resonance spectrometer(1H NMR) and Zahner Electrochemical Workstation.
2.2 Synthesis of PASP and PASPG
PASP was synthesized according to steps in paper [Chen et al. 2019].
The proposed PASPG was synthesized by PSI and Gly. First, 5 g PSI and certain amounts of Gly were added. Secondly, 1.6 g initiator sodium hydroxide and 5 mL of tetrahydrofuran solvent (THF) were added to the PSI and Gly system (the ratio was 1, 1:0.2, 1:0.4, 1:0.6, 1:0.8) and was heated to 70 °C for 6 h. After the reaction, the pH of the mixture is adjusted at 7.0 using HCl solution and then poured into certain amounts of absolute ethanol to generate precipitation. Next, the precipitation is washed by absolute ethanol and dried at 60 °C. Fig. 1 shows the synthesis reaction.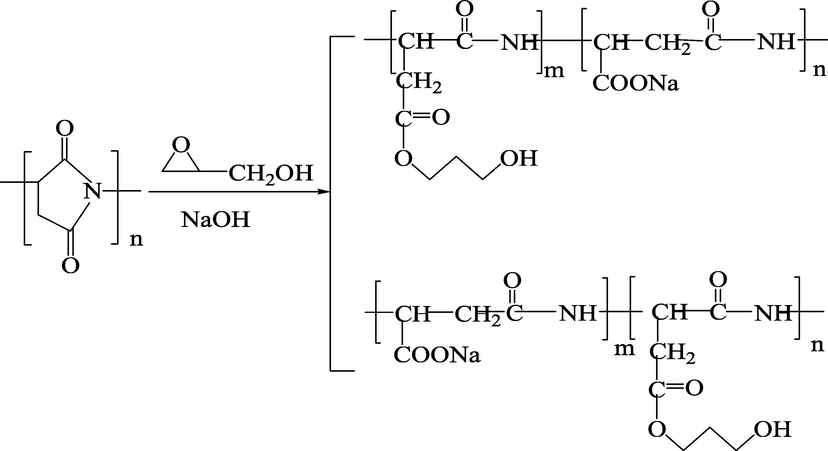
Synthesis of PASP derivatives with hyper-branched by copolymerization reaction.
2.3 Characterization of PASPG
2.3.1 Molecular structure
In this paper, the molecular structure of PASPG was analyzed by three different methods:
(i) 1H NMR. Dissolved by the heavy water (D2O), PASPG was analyzed by PulsarTM (shanghai HaoLang Scientific Instrument Co. ltd.).
(ii) FTIR. The FTIR spectrum of PASPG was detected by VERTEX7O FTIR spectrometer (Brock Technology Co., ltd.) in the range of 4000 ∼ 400 cm−1.
(iii) TGA. The TGA of PASPG were detected by tga-4000 thermogravimetric analyzer (PerkinElmer)in the range of 30–600 °C. Note that the heating rate was maintained at 30 °C/min in nitrogen atmosphere.
2.3.2 Molecular weight
The molecular weights of PASP and PASPG were measured by the method of Ubbelohde Viscometer. Note that the 0.8 mm Ubbelohde viscometer and sodium thiocyanate solution (105 g/L) were used. The outflow time of sodium thiocyanate solution with and without PASPG (PASP) were measured by the stop-watch and recorded as t0 and t1, respectively. The experiment was repeated for 3 times and the average time was used to calculate the molecular weight of PASPG (PASP), which is shown as follows:
where M is the molecular weight, K and ɑ are the constant values (K = 1.21 × 10⁻³, ɑ= 0.5) [Liu et al., 2014; Huang et al., 2019] and η is calculated as (2).
2.4 Measurement of scale inhibition efficiency
In the experiments, the scale inhibition efficiency of PASP and PASPG against CaCO3 was evaluated according to the national standard (GB/T16632-2019) in China (GB/T 16632–2019). Certain amounts of anhydrous CaCl2 and NaHCO3 were dissolved in the deionized water and ρ(Ca2+) = 200 mg/L and ρ(HCO3–) = 400 mg/L[Chen et al., 2020; Liu et al., 2014; Zhou et al., 2021]. The prepared solutions with different concentrations of PASP and PASPG were heated at 60℃ for 10 h. When the solution was cooled to the room temperature, it was filtered and the concentration of Ca2+ was measured by the method of EDTA titration under the PH value of 12–13. Noted that the indicator was calcium carboxylic acid (the color changed from wine red to blue).
The scale inhibition efficiency can be calculated as:
In terms of the scale inhibition efficiency against CaSO4, all experimental conditions were identical with that of CaCO3 except the concentration of CaCl2 and Na2SO4 were 6800 mg/L and 7100 mg/L, respectively[Chen et al.2020, Zhou et al.2021].
2.5 Measurement of corrosion inhibition performance
2.5.1 Weight loss method
The to-be-tested solution was the simulated cooling water and its chemical composition was given in Table 1. The prepared carbon steel coupons (20 cm2) was immersed in the beaker which contained 500 mL simulated cooling water and different doses of PASPG (PASP) at 25 °C. After the 3-day immersion test, the carbon steel coupons was taken out and washed by the acid (5 % HCl and 3 mg/L hexamethylenetetramine). Then, it was washed by the deionized water and dried. Finally, the carbon steel specimen was weighted with the accuracy of 0.0001 g. The testing and calculation methods were given in Chinese national standard (GB/T 18175–2014).
Ion
Ca2+
Cl-
Mg2+
SO42-
Na+
HCO3–
Concentration(mg/L)
200
457
48
1920
112
120
2.5.2 Electrochemical method
In this paper, we conducted the electrochemical experiments by Zahner electrochemical workstation with a conventional three electrode’s cell. The saturated calomel electrode (SCE) was utilized as the reference electrode. In addition, platinum plate and cylindrical carbon steel (d = 2 mm) were used as counter electrode and working electrode, respectively. The to-be-tested solution was simulated cooling water containing PASPG (PASP) and the concentration was 0 and 500 mg/L. Before experiments, the working electrode was immersed in the to-be-tested solution for 30 min to obtain the steady-state open circuit potential (OCP)(Fig. 2). Note that the whole electrochemical experiments were conducted at 25 °C.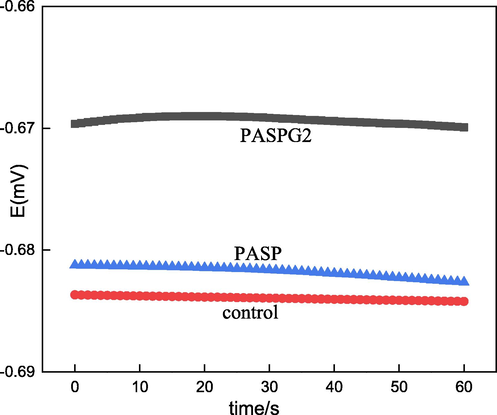
Eocp-t curves of Q235 steel.
The curves of the potentiodynamic polarization were obtained from −0.25 ∼ 0.25 V with respect to OCP at the constant scanning rate, i.e. 1 mV/s[Tan et al.2022, Tan et al.2021]. The linear parts of both anode and cathode curves were extrapolated to the corrosion potential (Ecorr) and obtained the corrosion current density (Icorr), which could be utilized to calculate the corrosion inhibition efficiency of PSAPG (PASP):
The electrochemical impedance spectroscopy (EIS) was obtained by utilizing the AC signals with the peak-to-peak of 5 mV at OCP and the frequency range is from 100000 Hz to 0.01 Hz[Tan et al.2022, Tan et al.2021]. The result was shown in the form of Nyquist plots. The equivalent circuit and charge transfer resistance (Rct) were obtained based on Nyquist plots. Hence, the corrosion inhibition efficiency could be formulated as:
2.6 SEM and EDS
In this paper, the method of obtaining CaCO3 was as follows: At the room temperature, the calcium chloride, sodium bicarbonate and scale inhibitor solutions were mixed in a glass container and stirred by a magnetic stirrer. The well-mixed solution was set for 24 h. Next, CaCO3 was collected by centrifugation and washed by distilled water for twice to remove the residual PASPG [Meng et al.2007, Naka 2003].
Based on the collected CaCO3 crystal, SEM (SIGAM 300) was applied to obtain the final images.
On the other hand, we also visualized the protective film on the surface of the corroded carbon steel specimen by SEM. In addition, energy Dispersive Spectrometer (EDS) technology was also applied to investigate the composition of protective film.
3 Results and discussion
3.1 Analysis of the structure of PSAPG
Based on the measurement method presented in section 2.3.2, PASPG (PASP) with different molecular weights is listed in Table 2, where different mass ratios between PSI and Gly are utilized. Note that the PASPG2 in Table 2 was selected for characterization experiments of 1H NMR and FTIR. The experimental results of 1H NMR, FTIR, and TGA are given in Fig. 3(a), Fig. 3(b), and Fig. 3(c), respectively.
PSI:Gly
t0
t1
Ƞr
Ƞsp
Ƞ
Mƞ
1:0.0 (PASP)
120.49
125.99
1.0456
0.0456
0.0413
1162
1:0.2(PASPG1)
120.49
126.63
1.0509
0.0509
0.0434
1286
1:0.4(PASPG2)
120.49
127.45
1.0578
0.0578
0.0455
1414
1:0.6(PASPG3)
120.49
128.72
1.0660
0.0660
0.0534
1948
1:0.8(PASPG4)
120.49
129.57
1.0754
0.0754
0.0624
2661
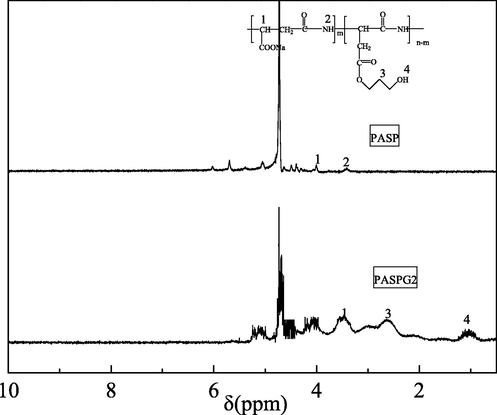
The 1H NMR spectra of PASP and PASPG2.

The FTIR spectra of PASP and PASPG2.
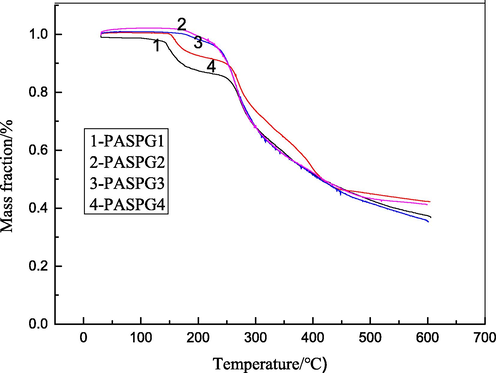
Thermogravimetric analysis of PASPG.
As shown in Fig. 3(a), the peaks of 4.388 ppm and 3.502 ppm in the PASP spectrum indicate the chemical shift of the –CH- and –CONH- bonds, respectively. In addition, the peaks of 3.094 ppm and 1.547 ppm in the PASPG2 spectrum specify the chemical shift of the –CH2- and –CH2OH- bonds in glycidyl, respectively. Moreover, the hydrogen shift and peak of the tertiary carbon of PASPG2 have certain changes compared with that of PASP because of the graft reaction. This outcome demonstrates that glycidyl reacts with polysuccinimide and the branch point is formed.
In the PASP curve of Fig. 3(b), the absorption peaks located at 3426 cm−1, 1625 cm−1, and 1584 cm−1 indicate the stretching vibration of N—H bond, C⚌O of carboxyl, and C⚌O of amide. Besides, the absorption peak in 1404 cm−1 indicates the vibration of the N—H and C—N bonds of –CONH–. However, in the PASPG curve, all peaks mentioned above can be found and the peak at 2943 cm−1, indicating that the vibration of –CH2– is strengthened and has a certain shift. In addition, the absorption peaks at 1047 cm−1 and 1196 cm−1, respectively, indicate the vibration of the C—O and –OH bonds of –CH2-OH. It should be mentioned that the –CH2-OH group only could be found in glycidyl, which demonstrates polysuccinamide reacts with glycidyl, and PASPG2 were obtained.
In Fig. 3(c), the evaporation of the water and organic matter occurred at 30 ∼ 180 °C, the rupture of the C—C covalent bond took place at 140 ∼ 250 °C, the thermal degradation of –CONH- and other organic groups occurred at 250 ∼ 430 °C. However, the rupture of PASPG macromolecular chain and the coking of small molecules occurred at 430 ∼ 600 °C (Fu Ch.’E et al., 2011). These experimental results demonstrate that PASPG cannot be decomposed even at a relatively high temperature. For example, its mass fraction is higher than 85 % at 200 °C, which indicates its superior stability. Besides, it was also found that the curves of PASPG1 and PASPG4 contained 4 different phases from room temperature to 600 °C. However, the curves of PASPG2 and PASPG3 only contained 3 different phases, which indicates that the stability of the latter two products was better.
3.2 Analysis of scale inhibition performance
In this section, four different factors that effect scale inhibition performance were thoroughly investigated. More specifically, they are the monomer ratio, PASPG concentration, pH value, and the concentration of Ca2+.
3.2.1 Influence of monomer ratio and PASPG concentration on scale inhibition efficiency
In Fig. 4, the impact of the monomer ratio (PSI vs Gly) and the concentration of PAPSG on the scale inhibition efficiency was examined. As shown in Figs. 4(a) and 4(b), the scale inhibition efficiency of PASPG were greatly higher than that of PASP over the whole concentration range. The scale inhibition efficiency of PASPG increased first and then decreased with the change of the mass ratio of monomer. When PSI:Gly = 1:0.4(PASPG2), the scale inhibition efficiency reached the maximum. Furthermore, the scale inhibition efficiency increased as the concentration raised. However, the growth rate became slow when the concentration was higher than 25 mg/L. The scale inhibition efficiency of PASPG achieved 94.6 % and 95.1 % for CaCO3 and CaSO4 at the concentration of 25 mg/L, respectively. This is because the chelation effect of PASPG’s branched structure on Ca2+ was stronger than that of PASP’s linear structure [Zhang et al. 2016]. (This was also verified by the difference in the molecular weight of the aforementioned product). Besides, the lone pair electrons of oxygen ether in bonds and hydroxyls from PASPG maybe induce the adsorption of inhibitor molecules on the surface of the crystal of CaCO3 and CaSO4 [Huang et al. 2019].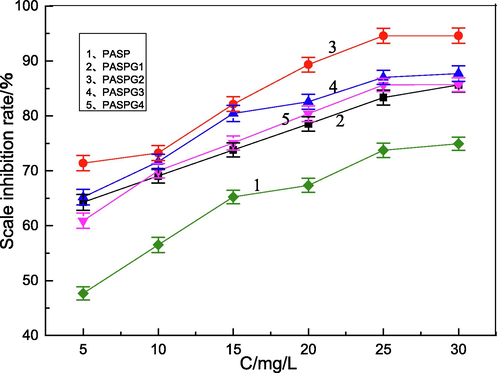
Influence of mass ratios of (PSI vs Gly.) on the CaCO3 scale inhibition performance.
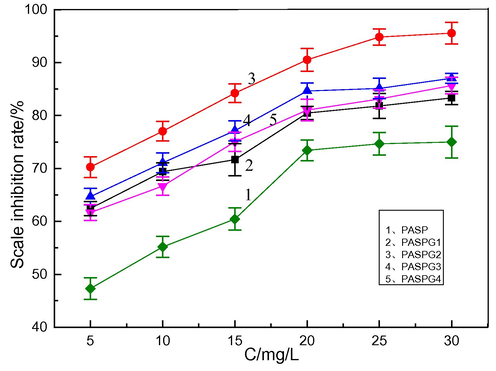
Influence of mass ratios of (PSI vs Gly.) on the CaSO4 scale inhibition performance.
3.2.2 Influence of pH value on CaCO3 scale inhibition efficiency
In this subsection, the influence of the pH value on CaCO3 scale inhibition efficiency was investigated and the results are given in Fig. 5. As can be observed, the scale inhibition performance of PASPG was stable in the whole pH range. On the contrary, the performance of PASP decreased significantly as the pH value increased. The scale inhibition efficiency of PASPG2 for calcium carbonate was always higher than that of other modified products PASPG under different pH conditions. Additionally, the scale inhibition efficiency of PASPG2 was up to 85.0 %, while that of PASP was 60.1 % at pH = 10. This phenomenon can be accounted for by the chelation effect of PASPG’s ether bonds and hydroxyls, which was stronger than that of PASP’s carboxyl group. However, the chelation effect of PASPG on Ca2+ maybe be weakened by the alkaline environment, resulting in a slight performance loss when the pH value was higher than 8 [Bukuaghangin et al. 2016]. Therefore, it can be concluded that a pH value of 5 ∼ 9 is the best condition for PASPG to be used as a CaCO3 scale inhibitor.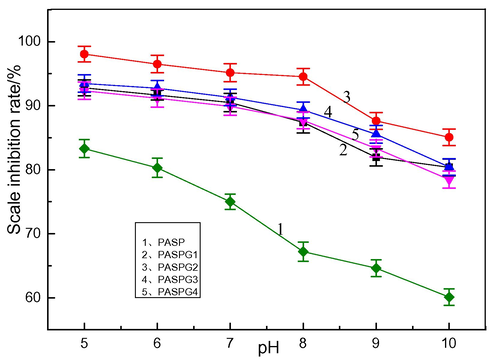
The relationship between pH value and CaCO3 scale inhibition performance.
3.2.3 Influence of the concentration of Ca2+ on CaCO3 scale inhibition efficiency
Fig. 6 depicts the experimental results of the relationship between the concentration of Ca2+ and the CaCO3 scale inhibition efficiency, where the concentration of PASPG (PASP) was 25 mg/L. As can be ascertained from Fig. 6, compared with PASP, the proposed PASPG’s performance reduced slowly as the concentration of Ca2+ increased. In different concentration values of Ca2+ systems, the scale inhibition efficiency of PASPG with different monomer mass ratios was obviously higher than that of PASP. When [Ca2+] = 500 mg/L, the scale inhibition efficiency of PASPG2 was up to 84.6 %, while that of PASP was 60.3 %.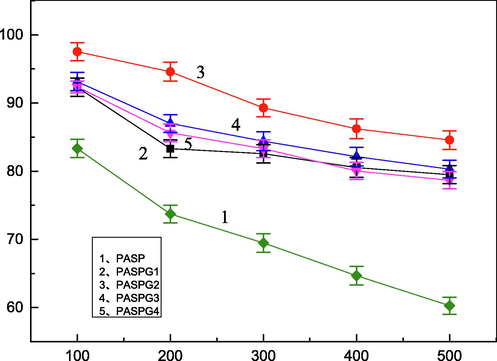
The Relationship between the concentration of Ca2+ and CaCO3 scale inhibition efficiency.
This phenomenon indicates that the scale inhibition efficiency of PASPG was robust with the concentration of Ca2+.
3.3 Scale inhibition mechanism
In this section, the scale inhibition mechanism was investigated from three aspects: the nucleation process of the calcium crystal, FTIR spectrum, and SEM images.
3.3.1 Nucleation process of CaCO3 crystal
In this subsection, the nucleation process of CaCO3 crystal was indicated by a change of the electrical conductivity with a conductivity meter (SLDS-1, made in Nanjing Sangli Electronic Equipment Factory in China). Fig. 7 shows that the change in the electrical conductivity of the mixed solution (264 mg/L calcium chloride, 252 mg/L sodium carbonate, and 20 mg/L scale inhibitor) versus the time when the different inhibitors were utilized. More specifically, as shown in Fig. 7(a), the electrical conductivity of the blank group without the inhibitor significantly decreased, which indicates the absence of a nucleation induction period. However, the nucleation induction period of CaCO3 in PASPG groups ranged from 900 s to 2300 s (Fig. 7(c)-7(e)). On the contrary, the period in the PASP group was about 100 s (Fig. 7(b)), which demonstrates that the proposed PASPG’s hyperbranched structure can effectively prolong the nucleation induction period of the CaCO3. In addition, the PASPG2 (Fig. 7(d)) showed the best inhibition performance.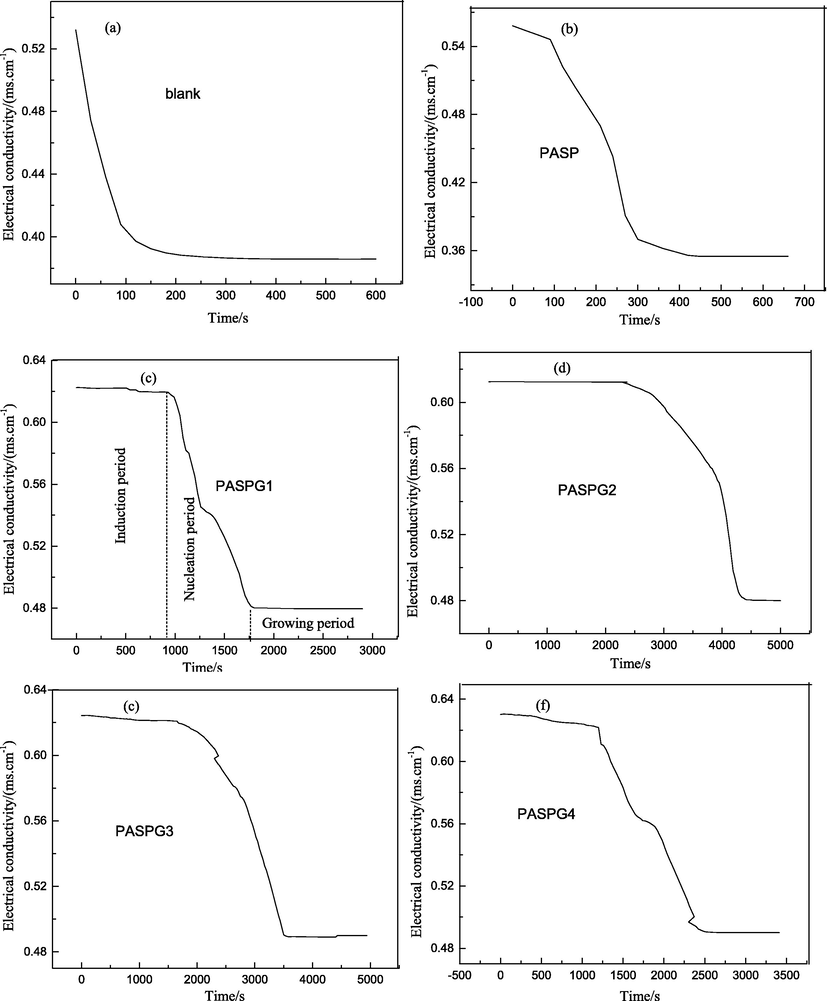
The electric conductivity of solution with different inhibitors (a. Blank, b. PASP, c. PASPG1, d. PASPG2, e. PASPG3, f. PASPG4).
Furthermore, when the reaction achieved the state of equilibrium, the concentration of Ca2+ in the PASPG groups was higher than that of the control group and the PASP group, which demonstrates that PASPG improves the solubility of the CaCO3 crystal in the solution. This phenomenon can be explained by formula (7) [ Huang et al. 2019]:
According to formula (7), when the concentration of CaCO3 increases, the critical radius of the CaCO3 crystal will be smaller. Therefore, it can be argued that PASPG is more effective for scale inhibition compared with PASP.
3.3.2 FTIR analysis of CaCO3 crystal
The polymorphs of CaCO3 crystal are different when the utilized inhibitor is different. The FTIR spectrum of the CaCO3 crystal is given in Fig. 8 (Fig. 8b shows a partial enlargement of Fig. 8a), where the adsorption peaks at 711 cm−1 and 745 cm−1 represent the calcite and the vaterite polymorphs of CaCO3 crystal, respectively [Meng,wt al. 2007. Naka 2003]. As shown obviously in Fig. 8b, only calcite was found in the blank group and both the alcite and the vaterite exist in the PASP and PASPG groups. This is because the inhibitor occupied the distorted position of vaterite with double inverted cones in some cases and the calcite was not formed [Zhang et al. 2017].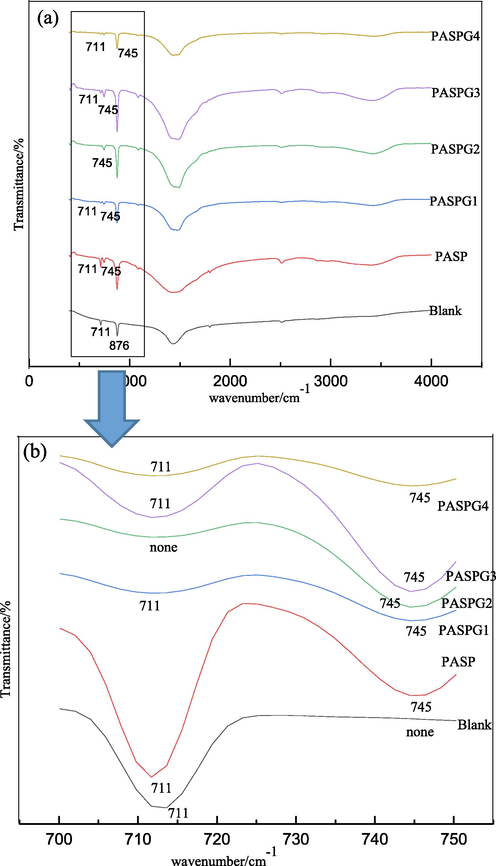
FTIR spectra of CaCO3 crystal with different inhibitors.
More specifically, compared with the PASP group, most of the polymorphs of CaCO3 crystal in the PASPG2 were vaterite, which corresponds to the curve of PASPG2 (there is no obvious adsorption peak at 711 cm−1). This phenomenon can be accounted for by the fact that PASPG2′s adsorption capacity on CaCO3 crystal was significantly stronger than that of PASP.
3.3.3 Morphology of calcium crystal
a) SEM analysis of CaCO3.
The CaCO3 crystal was prepared by using different inhibitors with a concentration of 25 mg/L. whereas the SEM images of the CaCO3 crystal are shown in Fig. 9. From Fig. 9 (a), it can be seen that the crystal in the blank group possesses a smooth surface and hard texture. Although the lattice distortion occurred both in the PSAP and PSAPG groups, the size of the crystal in the PASPG groups obviously appeared to be smaller. In addition, the crystal in the PASPG2 group was the loosest. By comparing the morphology of calcium carbonate of the control group with that of the added scale inhibitor, it was proved that the crystalline form of calcium carbonate was from calcite to vaterite [Chen et al. 2015, Huang et al. 2019, Ge et al. 2016, Nan et al. 2010].![SEM images of CaCO3 with different inhibitors [(a) blank, (b) PASP, (c) PASPG1, (d) PASPG2, (e) PASPG3, (f) PASPG4].](/content/184/2023/16/2/img/10.1016_j.arabjc.2022.104515-fig12.png)
SEM images of CaCO3 with different inhibitors [(a) blank, (b) PASP, (c) PASPG1, (d) PASPG2, (e) PASPG3, (f) PASPG4].
In order to clearly explain the morphology changes of the CaCO3 crystal, a schematic diagram was provided in Fig. 10. As can be observed, the top half represents the change of the shape of the crystal without the inhibitor and the calcite was formed at last. When the PASPG (PASP) was formed, the lattice distortion occurred and the formation of calcite was inhibited, as shown in the bottom half of Fig. 10.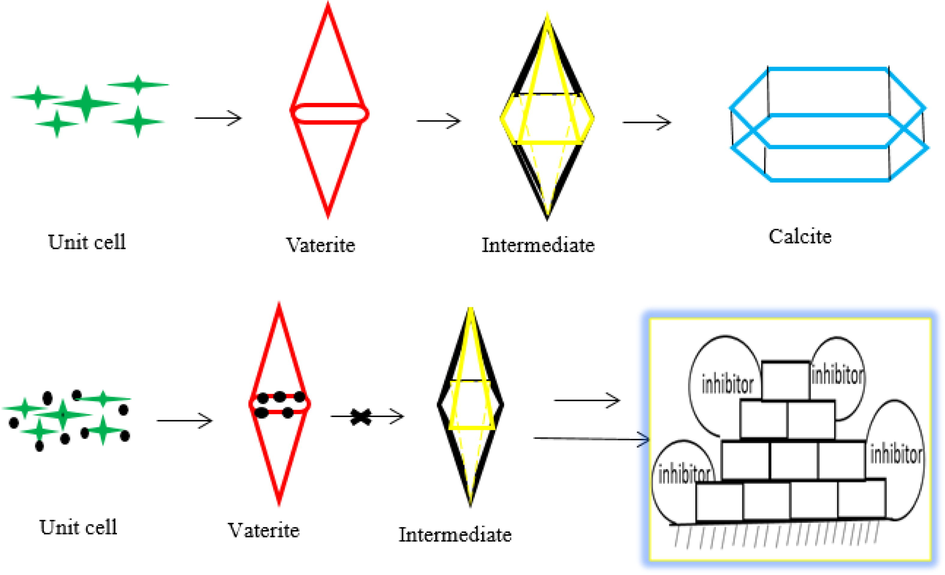
The change of morphology of CaCO3 crystal with and without inhibitor.
b) SEM analysis of CaSO4.
The SEM images of CaSO4 are shown in Fig. 11. Particularly, from Fig. 11(a), it can be seen that the crystal is regular and smooth in the blank group. Additionally, when the conventional PASP (25 mg/L) was added, fine cracks can be found on the surface of the crystal from Fig. 11 (b). However, as shown in Fig. 11(c)-11(f) (the 25 mg/L PASPG was added), the crystal were deepened and its surface appeared to be rougher and full of honeycombs. Besides, the whisker of the crystal disappeared and also the length-diameter ratio decreased significantly. More concretely, the crystal of CaSO4 was broken completely into small and unstable crystals when PASPG2 was added. This was because the branched polymer molecules were adsorbed on the surface of the microcrystal and inhibited the growth of the CaSO4 crystal [Huang et al. 2019]. In this case, the scale was prevented from sticking to the pipeline and can be easily washed away by the running water.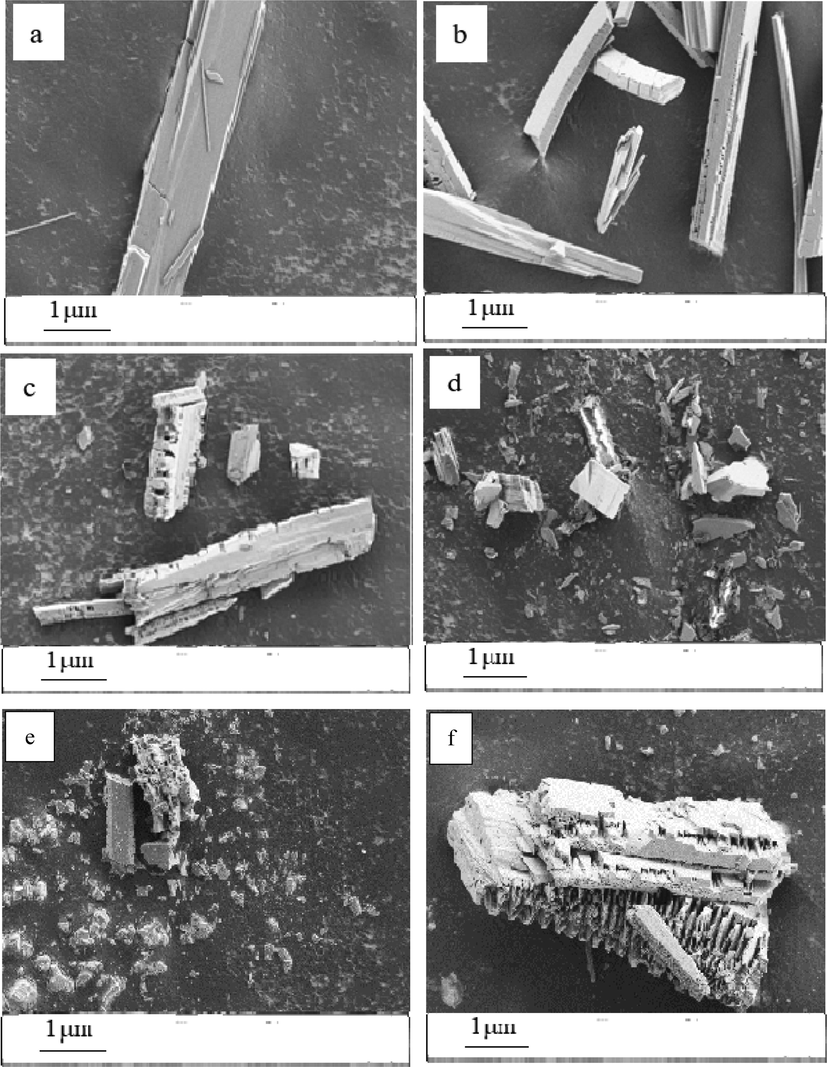
SEM images of CaSO4 crystal with different inhibitors (a) blank, (b) PASP, (c) PASPG1, (d) PASPG2, (e) PASPG3, (f) PASPG4.
3.4 Analysis of the corrosion inhibition performance
In this section, the weight loss method, electrochemical method, SEM technology, and EDS technology were applied to evaluate the corrosion inhibition performance of PASPG (PASP).
3.4.1 Weight loss test
In this subsection, the weight loss method was utilized to measure the corrosion inhibition efficiency of PASP and PASPG for 72 h at the temperature value of 25 °C [Chen et al. 2019]. The experimental results are given in Table 3, where only PASPG2 was considered as the representation of the PASPG inhibitor. As presented in Table 3, the corrosion efficiency increased when the concentration of PASPG2 (PASP) became higher. Besides, it can be seen that the corrosion efficiency of PASPG2 was higher than that of PASP with an identical concentration. As an example, the efficiency of PASPG2 at 500 mg/L was 85.17 %, while it was 72.53 % for PASP. This is because more area of the steel surface was covered and the influence of the chemical adsorption was strengthened when PASPG2 is compared with PASP.
Inhibitor
Concentration (mg/L)
X (g/cm2.h)
Ƞ (%)
Blank
0
2.88 × 10⁻⁵
/
PASP
50
1.93 × 10⁻⁵
32.97
100
1.68 × 10⁻⁵
41.66
150
1.375 × 10⁻⁵
52.26
200
1.34 × 10⁻⁵
53.47
300
1.07 × 10⁻⁵
62.84
500
7.91 × 10⁻⁶
72.53
PASPG2
50
1.76 × 10⁻⁵
39.06
100
1.26 × 10⁻⁵
56.25
150
1.11 × 10⁻⁵
61.45
200
1.01 × 10⁻⁵
64.93
300
7.42 × 10⁻⁶
74.25
500
4.27 × 10⁻⁶
85.17
3.4.2 Electrochemical test
In this subsection, two classical electrochemical experiments, namely the polarization test and impedance test were conducted to evaluate the corrosion inhibition performance of the proposed PASPG. Finally, PASPG was also compared with other inhibitors and the results in detail were analysed.
The three polarization curves in Fig. 12 are the polarization curves of blank, PASP of 500 mg/L, PASPG2 of 500 mg/L, and carbon steel of Q235 in solution, respectively. On top of that, in the original pictures, sometimes, a small tail appeared at the high potential extremity of the polarization curve plot, which can be assigned to metal dissolution. Thus, the small tails were neglected because they do not affect graphic analysis [Chen et al. 2019]. As can be seen from Fig. 12, after the addition of PASP and PASPG2, the corrosion potential (Ecoor) had a positive shift of 10 mV and 41 Mv, respectively, compared with the blank solution, which was much less than 85 Mv [Mourya et al. 2014] (as can be seen from Table 4). Moreover, the corrosion current of the cathode and anode decreased obviously, and βa and βc increased to a certain extent, and the slope of the cathode curve changed greater, which proved that PASP and PASPG2 were mixed corrosion inhibitors mainly for inhibiting cathodes. The current density of PASP and PASPG2 decreased also from 15.90 μA/cm2 to 3.71 μA/cm2 and 2.80 μA/cm2, respectively. What’s more, the inhibition efficiency of PASP and PASPG2 was 76.67 % and 82.38 %, respectively. The inhibition efficiency of PASPG2 was also 6.61 % higher than that of PASP. Fig. 12 and Table 4 show that PASPG2 can effectively inhibit the corrosion of steel after adsorption on the interface of the Q235 steel. This further proves that PASPG2 has both good scale inhibition and corrosion inhibition performance.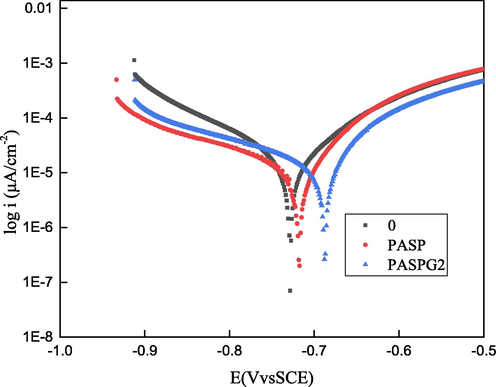
Tafel polarization curves of blank, PASP, and PASPG2.
Inhibitor
Ecorr (mVvs SCE)
Icorr(μA/cm2)
βa (mV/dec)
-βC (mV/dec)
Ƞ(%)
blank
−728
15.90
531
1.45
/
PASP
−718
3.71
255
1.01
76.67
PASPG2
−687
2.80
241
5.71
82.38
The three curves in Fig. 13 are the EIS diagram of blank, PASP of 500 mg/L, and PASPG2 of 500 mg/L of Q235 carbon steel in solution, respectively. Fig. 13 illustrates that the blank, PASP, and PASPG2 systems all have an irregular semi-arc, which may be due to the roughness of the solid electrode surface and the frequency dispersion [Qiang et al. 2021, Solomon et al. 2019]. Charge transfer of impedance arc (Rct) with PASP or PASPG2 system was also greater than that of the blank, whereas, Rct of the PASPG2 was larger and the inhibition efficiency of PASPG2 was 82.35 %, which proved that PASPG2 can well inhibit the corrosion of Q235 steel in the solution.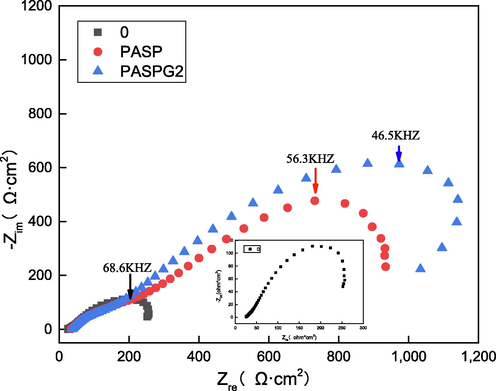
Nyquist plots of blank, PASP, and PASPG2.
In order to deeply understand the corrosion inhibition mechanism of PASP and PASPG2, impedance diagrams of blank, PASP, and PASPG2 systems were fitted to obtain an appropriate equivalent circuit diagram in Fig. 14 (it can be seen from Table 5 that Chi-square χ2 represents the fitting accuracy of the data, while a low value of χ2 indicates that the fitting results are in good agreement with the acquired experimental data) [Wan et al. 2022, Zeng et al. 2022 ]. In the model of the circuit diagram, Rs represents the solution resistance, Rf denotes the membrane resistance, Cf is the membrane capacitance, Y0 refers to a constant of the constant phase element of double electrical layer capacitance(CPE), and n is the CPE index, representing the un-smoothness of the electrode surface. Because the blank, PASP, and PASPG2 systems all produce an irregular semi-arc, the ideal capacitors contained in the three systems were replaced by constant phase angles (CPE). [Replace capacitance with constant phase angle (CPE).] The calculation formula of the CPE impedance is shown in formula (8) [Qiang et al. 2021, Solomon et al. 2019]:
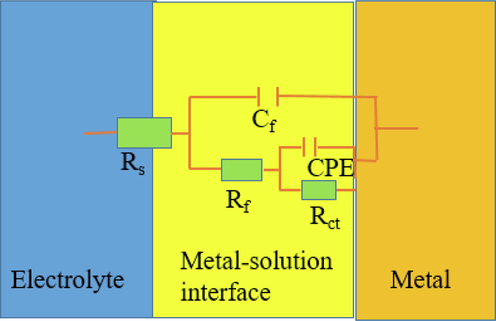
The equivalent circuit for fitting the impedance spectra of the carbon steel.
The value of CPEdl was calculated by using the formula (9) [Tan et al. 2020, Tan et al. 2022, Qiang et al. 2020]:
As can be observed from Table 5, the value of CPEdl was reduced in the PASP and PASPG2 system in comparison with that of the blank system, whereas the PASPG2 system was smaller. By using the following formula (10) [Dehghani et al. 2019, Wan et al. 2022]:
Inhibitor
RS (Ω·cm2)
Rf (Ω·cm2)
Cf (μF·cm−2)
Rct (Ω·cm2)
CPEdl
Ƞ(%)
χ2
Y0 (10-4·Ω·cm−2·sn)
n
Blank
25.8
26.3
62.4
320.3
25.0
0.762
/
0.0054
PASP
33.9
351.7
13.9
1224.6
14.0
0.751
73.84
0.0078
PASPG
35.8
247.7
10.5
1814.9
8.60
0.701
82.35
0.0040
Besides, the corrosion inhibition efficiency among PASPG2, SA, HE, C, and PGP were also compared in Table 6 and the proposed PASPG2 achieved the best performance.
Inhibitor
Metal exposed
Corrosive media
Cinh
η (%)
Reference
PASPG2
Q235 carbon steel
Simulated cooling water
300 mg/L
85.17
proposed
SA
API X60 steel
3.5 % NaCl
300 mg/L
57.57
[Obota etal.2017]
HEC
1018C-steel
3.5 % NaCl
0.1 mM
88.7
[EL-Haddad et al.2014]
PGP
Mild Steel
3.5 % NaCl
900 mg/L
64.62
[Geethanjali et al.2014]
PGP
Mild Steel
3.5 % NaCl
500 mg/L
69.57
[Geethanjali et al.2014]
PASP/SB
Q235 carbon steel
1 M HCl
80 ppm
90.39
[Wang et al.2019]
ASLE
Q235 carbon steel
1 M HCl
150 mg/L
98.79
[Liao et al.2023]
3.4.3 SEM and EDS analysis of the carbon steel specimens
In order to clearly examine the morphology of the specimen surface after corroding, SEM imaging was used for studying the morphology of the samples. In addition, EDS mapping was also applied to investigate the composition of the protective film on the surface of the specimen. The concentration of inhibitor was 500 mg/L and the experimental results are displayed in Fig. 15. As shown in Fig. 15(a), the surface of the steel in the blank group was full of corrosion products after being exposed for 72 h at the temperature value of 25 °C, which were scale and iron oxide (Fe(OH)3 and FeOOH) [Chen et al. 2019]. Compared with the PASP group in Fig. 15(c), the surface of the steel in the PASPG group (Fig. 15 (e)) obviously appeared to be smoother and less corrosion product was formed. This phenomenon can also be proved by the EDS results. Compared with the PASP group in Fig. 15 (d), the oxygen content decreased and the iron atoms of the PASPG group increased significantly, as shown in Fig. 15 (f). The EDS experimental data with PASPG2 are also very close to the experimental data of the newly polished carbon steel specimen. This is because PASPG2 can be adsorbed on the steel surface and the corrosion rate became slower [Chen et al. 2019].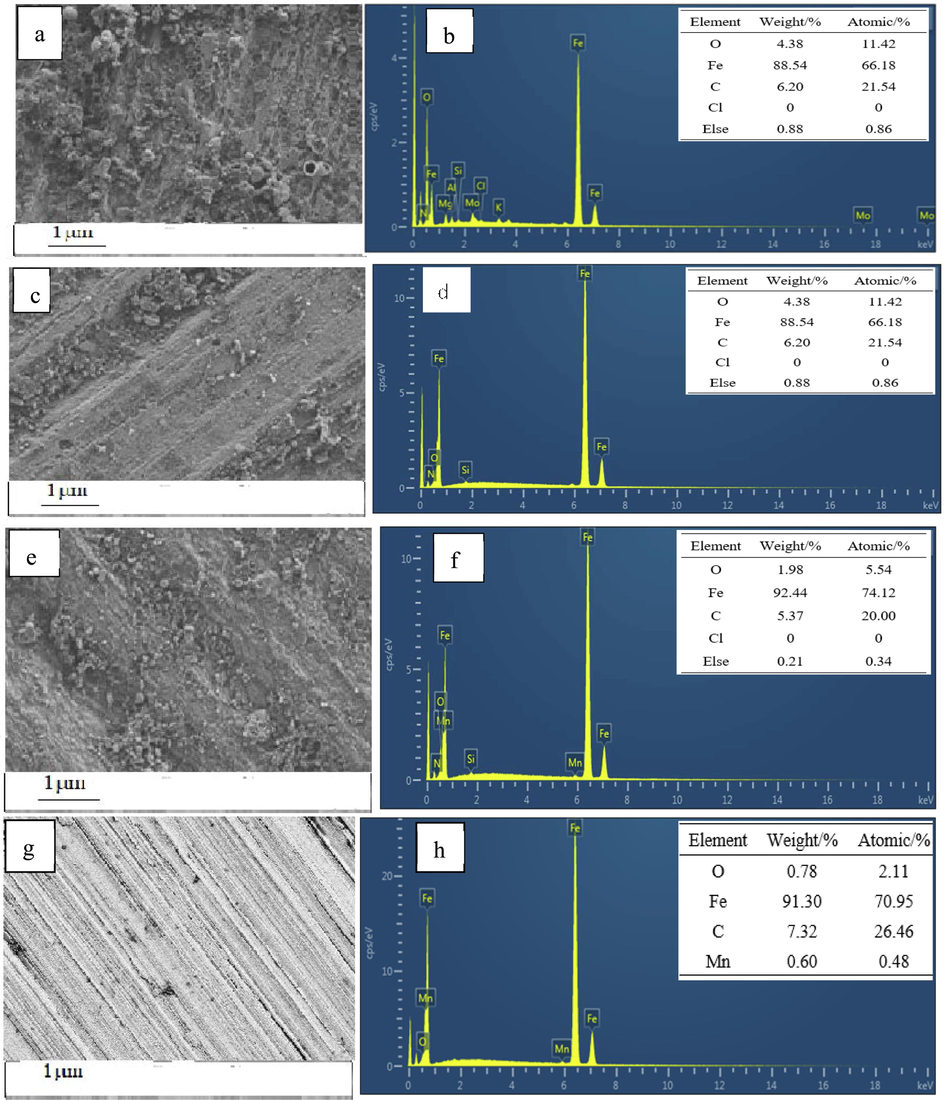
SEM and EDS analyses of the carbon steel specimens. (a-b) blank, (c-d) PASP (e-f), PASPG2 (g-h) new.
3.5 Mechanism of corrosion inhibition
In order to investigate the underlying mechanism of corrosion inhibition of PASG, the adsorption isotherm, and PZC tests were adopted. In addition, the whole process of corrosion inhibition is also shown in detail.
3.5.1 Adsorption isotherm
The corrosion inhibition performance of the organic inhibitor is determined by its adsorption effect on the surface of the metal. Therefore, to elaborate on the mechanism of corrosion inhibition, utilizing an adsorption isotherm formulation, such as Langmuir, Floy-Huggin, Bockris-Swinkels, Frumkin, and Temkin isotherms is an effective method [Wang et al. 2019]. More specifically, the Langmuir formula was selected in our experiments due to its best-fitting effect. Therefore, other isotherms were not taken into account.
According to formula (11), the relationship between Cinh/θ and Cinh is depicted in Fig. 16 and the discrete point is fitted into a line, where the correlation coefficient is R2 = 0.99332. This result indicates the adsorption behaviour of PASPG2 molecules was consistent with the Langmuir formula. It should be also mentioned that the reciprocal of the intercept of the line is the constant Kads, which can be further utilized to calculate the adsorption-free energy ΔG0ads:
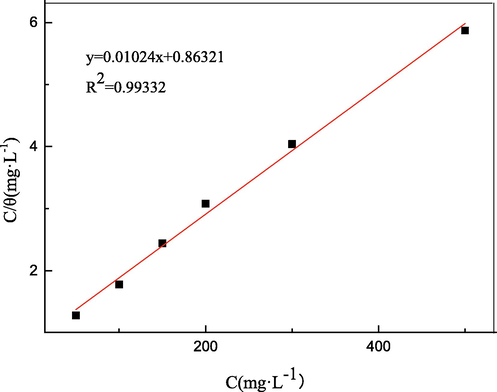
Langmuir plot for the adsorption of PASPG2 on the carbon steel surface.
When |ΔG0| ≤ 20 kJ/mol, the adsorption behaviour can be considered physical adsorption because of the electrostatic interaction between the charged metal surface and the corrosion inhibitor molecules. On the other hand, chemical adsorption takes place when |ΔG0| ≥ 40 kJ/mol. More concretely, it was involved in the processes of (i) the transfer and sharing of electrons and (ii) the formation of complexation covalent bonds from inhibitor molecules to the metal surface.
Based on the above-mentioned discussion, it can be concluded that the adsorption behavior of PASPG2 on the steel surface includes both physical and chemical adsorption. More specifically, in terms of physical adsorption, electrostatic attraction exists when PASPG2 molecules approach the surface of the carbon steel. Besides, the complexation behaviour between inhibitor molecules and the vacant d-orbital of the iron atom demonstrates the existence of chemical adsorption.
3.5.2 Potential of zero charge (PZC) tests
In order to clearly understand the underlying reason for the adsorption of PASAG2 molecules on the surface of the carbon steel specimen, the PZC was measured by the AC impedance method at the temperature value of 25 °C. The relationship between the double-layer capacitance (Cdl) and the voltage (E) is illustrated in Fig. 17, where the horizontal coordinate value of the lowest point of the parabola was PZC (Epzc(PASPG2) = -0.60 V). Therefore, the difference between PZC and the corresponding open circuit potential (Eocp(PASPG2) = -0.52 V) was 0.08 V (φPASPG2 = 0.60–0.52 = 0.08 V). Hence, it can be concluded that first since φPASPG2 was positive, the anions in the solution such as cl- and SO42- were adsorbed on the steel surface, which will be negatively charged. Then, the anions on the steel surface became the electrostatic bond with the positively charged PAPSG2 ions [Amin et al. 2011].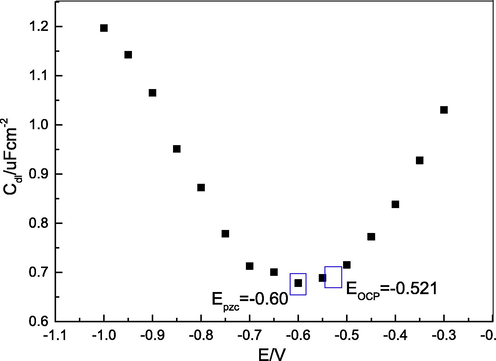
The relationship between the double-layer capacitance (Cdl) and the voltage (E).
3.5.3 Process of corrosion inhibition
The reaction equations of the process of corrosion inhibition are shown as follows: [Chen et al. 2019]:
According to formula (13) and (14), it can be found that (i) the dissolution of the carbon steel in the anode region can accelerate the formation of the corrosion products, (ii) the oxygen reduction reaction in the cathode region produces OH– and the pH value of the steel surface is changed and (iii) the compounds of Fe2+ and Fe3+ (such as sulfate (FeSO4), chloride (FeCl3), iron hydroxide [Fe(OH)2, Fe(OH)3] and oxides (Fe3O4, γ-Fe2O3)) are generated on the steel surface.
When the proposed PASPG2 is added, the above-mentioned corrosion process will be changed. First, PASPG2 molecules are adsorbed on the steel surface because of the electrostatic action, which has been proved by the PZC tests. The adsorption process can be understood by the replacement reaction between the water molecules and PASG2. The equation for the replacement reaction is the following [Chen et al. 2019]:
where PA-T(so) and PA-T(ad), represent the PASG2 in the solution and adsorbed on the steel surface, respectively and Y denotes the number of water molecules replaced by PASPG2.
Subsequently, the chemical adsorption process of PASPG2 takes place in the anode region, which can be understood by the fact that the lone electron pair in the (N, O)-atoms of PASPG2 and the empty d orbital of the iron atom were combined and formed the complex. Therefore, the reaction equation in the anode region was changed from formula (13) to (15) after adding PASPG2:
The process of corrosion inhibition is depicted in Fig. 18. Particularly, without the inhibitor, the surface of the carbon steel is covered by the water molecules and corrosion media, such as chloride ions and a small amount of oxygen molecules. However, after PASPG2 was added, its molecules will be adsorbed on the steel surface and isolate the carbon steel from the water molecules, chloride ions, and oxygen molecules. Besides, due to the advantages of PAPSG2, such as large molecular weight and a big number of polar groups, the dense protective film can be generated on the surface of the carbon steel. As was described in the electrochemical impedance diagrams (Fig. 12), a protective film was formed on the surface of the carbon steel electrode, which increased the resistance to be eroded, and thus protected the carbon steel.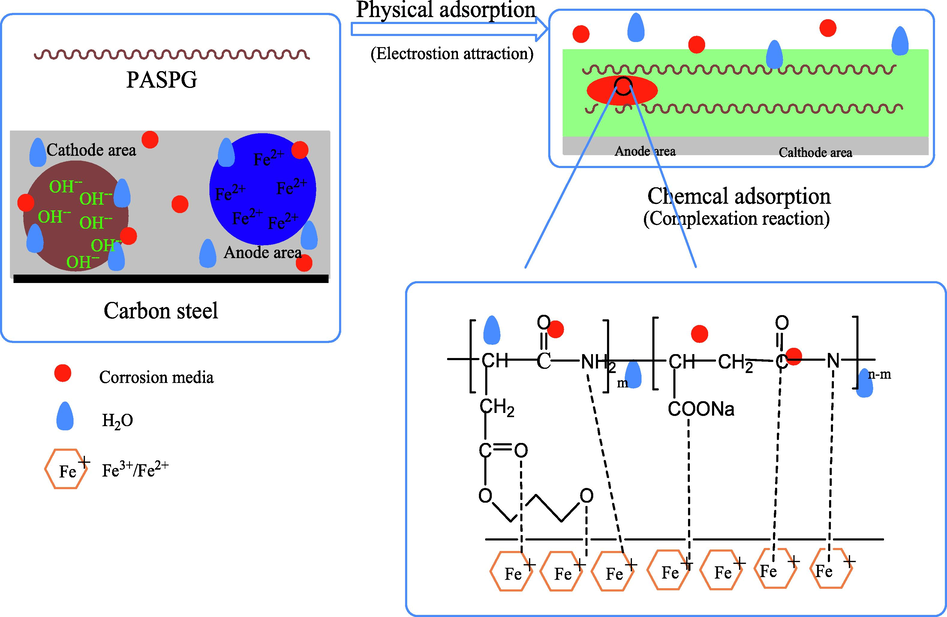
The schematic diagram of the corrosion inhibition process of PASPG2.
4 Conclusion
1. A new inhibitor called PASPG was synthesized by the polymerization of PSI and Gly and characterized by FTIR, 1H NMR, and TGA techniques.
2. The static inhibition method was used to acquire the scale inhibition efficiency against CaCO3 (94.6 %) and CaSO4 (95.1 %). Under the same experimental conditions, the scale inhibition efficiency of PASPG was obviously better than that of PASP.
The SEM and FTIR experiments revealed that PASPG can effectively inhibit the growth of the crystals and distort the crystal lattice of CaCO3 (CaSO4).
4. PASPG as a green inhibitor exhibited 85.17 % maximum corrosion inhibition efficiency. The adsorption of PASPG on carbon steel surface obeyed Langmuir adsorption isotherm. Besides, it was proved that a protective film was formed on the surface of carbon steel by PASPG’s adsorption through characterization, by carrying out EIS and SEM measurements, which increased the resistance to be eroded. Thus, the surface of carbon steel was effectively protected.
In conclusion, in this work sufficient theoretical support for the proposed PASPG was provided and its potential in the field of scale and corrosion inhibition was demonstrated.
5 Author agreement
All authors have approved of the publication of this paper. We declare that the paper is the original research.
Acknowledgment
This work was financially supported by Natural Science Foundation of Hebei Province of China (D2022105004), the Found ation of Tangshan Normal University of China (2022C42) and the Foundation of phased achievement of the key cultivation project of Tangshan Normal University of China (ZDPY07,ZDPY05).
Declaration of Competing Interest
The authors declare that they have no known competing financial interests or personal relationships that could have appeared to influence the work reported in this paper.
References
- Investigation of a novel environmentally friendly inhibitor for calcium carbonate scaling in cooling water. Desalin. Water Treat.. 2016;57:1-7.
- [CrossRef] [Google Scholar]
- Application and evaluation of novel acrylic based CaSO4 inhibitors for pipes. Desalin.. 2015;355:33-44.
- [CrossRef] [Google Scholar]
- Amin M. A., Ibrahim M. M.. 2011. Corrosion and corrosion control of mild steel in concentrated H2SO4 solutions by a newly synthesized glycine derivative. Corros. Sci., 53,873-885 https://doi: 10.1016/j.corsci.2010.10.022.
- Bukuaghangin O., Sanni O., Kapur N. 2016. Kinetics study of barium sulphate surface scaling and inhibition with a once-through flow system. J. Pet. Sci. Eng., 147, 699–706. https://doi: 10.1016/ j.petrol.2016.09.035.
- Chai C.X., Xu Y,H., Xu Y., et al. 2020. Dopamine-modified polyaspartic acid as a green corrosion inhibitor for mild steel in acid solution. Eur. Polym. J., 137, 109946. https://doi.org/10.1016/j.eurpolymj.2020.109946.
- State of art of natural inhibitors of calcium carbonate scaling. a review article. Desalin.. 2015;356:47-55.
- [CrossRef] [Google Scholar]
- Synthesis of polyaspartic acid/graphene oxide grafted copolymer and evaluation of scale inhibition and dispersion performance. Diamond Relat. Mater.. 2020;108
- [CrossRef] [Google Scholar]
- Chen J.X. , Xu L.H., Han J., et al. 2015. Synthesis of modified polyaspartic acid and evaluation of its scale inhibition and dispersion capacity. Desalin., 358:42–48. http://dx.doi.org/10. 1016/ j.desal.2014.11.010.
- Corrosion inhibition performance of threonine-modified polyaspartic acid for carbon steel in simulated cooling water. J. Appl. Polym.. 2019;47242:1-12.
- [CrossRef] [Google Scholar]
- Electronic/atomic level fundamental theoretical evaluations combined with electrochemical/surface examinations of Tamarindus indiaca aqueous extract as a new green inhibitor for mild steel in acidic solution (HCl 1 M) J. Taiwan Inst. Chem. E.. 2019;102:349-377.
- [CrossRef] [Google Scholar]
- EL-Haddad M. N.. 2014. Hydroxyethylcellulose used as an eco-friendly inhibitor for 1018 c-steel corrosion in 3.5% NaCl solution. Carbohydr. Polym., 112,595-602. https://doi: 10.1016/ j.carbpol.2014.06.032.
- Synergistic inhibition effect of potassium iodide and novel Schiff bases on X65 steel corrosion in 0.5 M H2SO4. Corros. Sci.. 2013;74:168-177.
- [CrossRef] [Google Scholar]
- Fu L.P., Lv J. , Zhou L., et al. 2020. Study on corrosion and scale inhibition mechanism of polyaspartic acid grafted b-cyclodextrin. Mater. Lett., 264 :127276. https://doi.org/ 10.1016/j.matlet.2019.127276.
- Double-hydrophilic block copolymers as precipitation inhibitors for calcium phosphate and iron(III) Ind. Eng. Chem. Res.. 2010;49:8920-8926.
- [CrossRef] [Google Scholar]
- Gao Y,H., Fan L,H., Ward L., et al. 2015. Synthesis of polyaspartic acid derivative and evaluation of its corrosion and scale inhibition performance in seawater utilization. Desalin., 365:220–226. https://doi.org/10.1016/j.desal.2015.03.006Get rights and content.
- Investigation of scale inhibition mechanisms based on the effect of HEDP on surface charge of CaCO3. Tenside Surf. Deterg.. 2016;53:29-36.
- [CrossRef] [Google Scholar]
- Water-Soluble and biodegradable pectin- grafted polyacrylamide and pectin-grafted polyacrylic acid: electrochemical investigation of corrosion-inhibition behaviour on mild steel in 3.5% NaCl media. Indian J. Mater. Sci.. 2014;4:1-9.
- [CrossRef] [Google Scholar]
- Guo X,Y., Joy J. S. C. , Cheng Y.M., et al. 2021. Scale Inhibitors for Industrial Circulating Water Systems:A Review. J.Wat. Chemi. Techn., 43(6):517–525. https://doi.org/ 10.3103/S 1063455X21060102.
- Huang H.H., Yao Q., Jiao Q. , et al... 2019. Polyepoxysuccinic acid with hyper-branched structure as an environmentally friendly scale inhibitor and its scale inhibition mechanism. JSCS, J. Saudi Chem. Soc.. 23(1): 61-74. https://doi:10.1016/j.jscs.2018.04.003.
- Efficiency of five scale inhibitors on calcium carbonate precipitation from hard water: effect of temperature and concentration. Desalin.. 2009;249:1397-1404.
- [CrossRef] [Google Scholar]
- Insight into The Anti-corrosion Performance of Acanthopanax Senticosus Leaf Extract as Eco-friendly Corrosion Inhibitor for Carbon Steel in Acidic Medium. J. Indus. Engin. Chemis. 2023;117:238-246.
- [CrossRef] [Google Scholar]
- Study of corrosion and scale inhibition of polyepoxysuccinic acid derivative. Asian J. Chem.. 2014;26(22):7716-7720.
- [CrossRef] [Google Scholar]
- Hyperbranched polyesters with carboxylic or sulfonic acid functional groups for crystallizationmodification of CaCO3. Macromol. Chem. Phys.. 2007;208:474-484.
- [CrossRef] [Google Scholar]
- Synthesis, characterization of polyaspartic acid-glycine adduct and evaluation of their performance as scale and corrosion inhibitor in desalination water plants. J. Mol. Liq.. 2016;224:849-858.
- [CrossRef] [Google Scholar]
- Corrosion inhibition of mild steel in acidic solution by Tagetes erecta (Marigold flower) extract as a green inhibitor. Corros. Sci.. 2014;85:352-363.
- [CrossRef] [Google Scholar]
- Effect of dendrimers on the crystallization of CaCO3 in aqueous solution. Top. Curr. Chem.. 2003;228:141-158.
- [CrossRef] [Google Scholar]
- Novel morphologies and phase transformation of CaCO3 crystals formed in CDS and urea aqueous solution. J. Crystal Growth. 2010;312:705-713.
- [CrossRef] [Google Scholar]
- Curcumin–malic acid based green copolymers for control of scale and microbiological growth applications in industrial cooling water treatment. J. Mol. Liq.. 2016;214:400-410.
- [CrossRef] [Google Scholar]
- Obota I.B., , Onyeachub I. B., Kumar A.M.. 2017. Sodium alginate: A promising biopolymer for corrosion protection of API X60 high strength carbon steel in saline medium. Carbohydr. Polym., 178, 200-208. https://doi: 10.1016/j.carbpol.2017.09.049.
- Self-assembling anchored film basing on two tetrazole derivatives for application to protect copper in sulfuric acid environment. J. Mater. Sci. Technol.. 2020;52:63-71.
- [CrossRef] [Google Scholar]
- Fabrication of environmentally friendly Losartan potassium film for corrosion inhibition of mild steel in HCl medium. Chem. Eng. J.. 2021;406:126863
- [CrossRef] [Google Scholar]
- Synthesis of a polyaspartic acid/4-(2-ami-noethyl) morpholine graft copolymer and evaluation of its scale and corrosion inhibition performance. Polym. Adv. Technol.. 2018;29:2838-2847.
- [CrossRef] [Google Scholar]
- Synthesis and evaluation of polyaspartic acid/furfurylamine graft copolymer as scale and corrosion inhibitor. RSC Adv.. 2016;6:102406-102412.
- [CrossRef] [Google Scholar]
- Solomon M M , Umoren S A , Quraishi M A , et al. 2019. Myristic acid based imidazoline derivative as effective corrosion inhibitor for steel in 15% HCl medium. J. Colloid. Interf. Sci.,551: 47–60. https://doi:10.1016/j.jcis.2019.05.004.
- Sun X.Y., Zhang J,P., Yin C.X., et al. 2015. Poly(aspartic acid)–tryptophan grafted copolymer and its scale-inhibition performance. J. Appl. Polym. Sci, . 132(45): 42739. https://doi.org/ 10.1002/app.42739.
- Tan B.C., Zhang S,T. , Cao X,L. et al. 2022. Insight into the anti-corrosion performance of two food flavors as eco-friendly and ultra-high performance inhibitors for copper in sulfuric acid medium. J. Colloid Interface Sci., 609: 838–851. https:// doi.org/10.1016/j.jcis.2021.11.085.
- Experimental and theoretical studies on the inhibition properties of three diphenyl disulfide derivatives on copper corrosion in acid medium. J. Mol. Liq.. 2020;298:111975
- [CrossRef] [Google Scholar]
- Insight into anti-corrosion nature of Betel leaves water extracts as the novel and eco-friendly inhibitors. J. Colloid Interface Sci.. 2021;585:287-301.
- [CrossRef] [Google Scholar]
- Tan B.C., Lan W. , Zhang S.t., et al. 2022. Passiflora edulia Sims leaves Extract as renewable and degradable inhibitor for copper in sulfuric acid solution. Colloids Surf., A. https://doi.org/ 10.1016/j.colsurfa. 2022.128892.
- Soybean extract firstly used as a green corrosion inhibitor with high efficacy and yield for carbon steel in acidic medium. Ind. Crops Prod.. 2022;187:115354
- [CrossRef] [Google Scholar]
- Enhanced corrosion inhibition performance of novel modified polyaspartic acid on carbon steel in HCl solution. J. Alloys Compd.. 2019;771(15):736-746.
- [CrossRef] [Google Scholar]
- A natural extract of tobacco rob as scale and corrosion inhibitor in artificial seawater. Desalin.. 2016;398:198-207.
- [CrossRef] [Google Scholar]
- Synthesis and scale inhibition performance of a novel environmental friendly and hydrophilic terpolymer inhibitor. Desalin.. 2017;416:166-174.
- [CrossRef] [Google Scholar]
- Mechanistic study of polyaspartic acid (PASP) as eco-friendly corrosion inhibitor on mild steel in 3% NaCl aerated solution. J. Mol. Liq.. 2018;250:50-62.
- [CrossRef] [Google Scholar]
- Melamine modified carbon dots as high effective corrosion inhibitor for Q235 carbon steel in neutral 3.5 wt% NaCl solution. J. Mol. Liq.. 2022;349:118108
- [CrossRef] [Google Scholar]
- Scale inhibition performance and mechanism of sulfamic/amino acids modified polyaspartic acid against calcium sulfate. Desalin.. 2017;419:152-159.
- [CrossRef] [Google Scholar]
- Synthesis and characterization of novel polyaspartic acid/urea graft copolymer with acylamino group and its scale inhibition performance. Desalin.. 2016;395:92-98.
- [CrossRef] [Google Scholar]
- Calcium scale inhibition of stimulated oilfield produced water using polyaspartic acid/aminomethanesulfonic acid. ChemistrySelect. 2021;6(15):3692-3701.
- [CrossRef] [Google Scholar]
- Zhou Y.S.; Jie W.; Yan F.. 2021. Green and High Effective Scale Inhibitor Based on Ring-Opening Graft Modification of Polyaspartic Acid. Catalysts, 11(7): 802-802. https://doi.org/ 10.3390/catal11070802.


