

Translate this page into:
Synthesis of trichromatic carbon dots from a single precursor by solvent effect and its versatile applications
⁎Corresponding authors. wujiajieb0a5ab0@a63.com (Jiajie Wu), 435360678@qq.com (Zeyu Zhang)
-
Received: ,
Accepted: ,
This article was originally published by Elsevier and was migrated to Scientific Scholar after the change of Publisher.
Peer review under responsibility of King Saud University.
Abstract
Multi-color is the fundamental for display, white LED (WLED), and bioimaging. Three kinds of carbon dots (co-doped of S and N elements) (S,N-CDs) with red (R), green (G) and blue (B) fluorescence were synthesized using 2,5-Diaminobenzenesulfonicacid as the only precursor by a simple, environmentally friendly solvent modulation method, which neither needed complex precursor formulations nor tedious post-processes to obtain multi-color performance. Compared to the previous S,N-CDs, our CDs has a higher fluorescence quantum yield and tunable colors which implies a higher resolution in detection and deeper penetration in tissue observation. We present their outstanding roles in chemical trace detection and light source application to demonstrate their application potential. The three CDs were highly sensitive and could selectively recognize Ag+ and Fe3+ with low limit of detection of up to 35 and 23 nM, respectively. The CDs were mixed to fabricate WLED in solution, solid (with lotus root powder) and xerogel forms, achieved satisfactory white light properties with CIE (1931) coordinates (0.32,0.33), (0.31, 0.32) and (0.33, 0.35), respectively, almost pure white light. This is digestible light source and fluorescent biomarker that open up possibilities for in vivo recycling-free imaging applications.
Keywords
Carbon dot
Trichromatic
Ion detection
WLEDs
Fluorescent

1 Introduction
Carbon dots (CDs) as a new type of luminous material have great application potential due to their high fluorescent quantum yield (QY), high photostability, low toxicity, and good biocompatibility (Wang et al., 2017; Liu et al., 2020; Liu et al., 2018). Thus, they have received extensive attention and was researched in many fields such as biological imaging (Chen et al., 2021; Zhang et al., 2022; Ding et al., 2020), trace sensing (Zhang et al., 2021), photoelectric conversion, lighting, and light detection (Cui et al., 2022; Dai et al., 2022; Das et al., 2022). Achieving multi-color emission is important for the development of all-CD-based white light LEDs (WLEDs) and bioimaging (Ding et al., 2021; Gao et al., 2017; Wu et al., 2023). Full CD WLEDs can avoid toxic heavy metals (Yuan et al., 2019; Yuan et al., 2018; Han et al., 2022). The long-wavelength fluorescence can decrease the damage to biological tissues (Zhang et al., 2021; Ding et al., 2018; Ding et al., 2017) and scattering effects, further increasing tissue penetration (Zhao et al., 2023; Ji et al., 2022; Liu et al., 2022), thus facilitating high-resolution and large-depth imaging of biopsies (Li et al., 2020; Li et al., 2022; Li et al., 2021). As a result, the preparation techniques for multi-color CDs have become an issue of interest in CD research. Currently, multi-color CDs are synthesized mainly from the following methods.
Use doping techniques. For example, Jiang et al., by doping N in CDs, successfully achieved full-color emissions of CDs (Jiang et al., 2015); Yang et al. obtained blue-green and yellow fluorescent CDs by doping S and Se, respectively (Yang et al., 2014); Wang et al. obtained blue, blue-green, green, green-yellow and yellow emission by S,N co-doping strategy (Wang et al., 2020). However, doping requires heterogeneous precursors and complex synthesis conditions, such as high temperature and pressure, and the doping mechanism is not fully understood. Therefore, doping is an unmanageable process, and to maintain consistent doping levels and binding states from one production batch to another is difficult.
Use different precursor formulations. Yan et al. used citric acid (CA) and polyacrylonitrile (PAN) to synthesize CDs with different emission wavelengths by adjusting the ratio of raw materials (Yan et al., 2019); Zhang et al. prepared multi-colored fluorescent CDs using phenol-derived sources and different oxidants (Zhu et al., 2019). Many biomass materials also been used to synthesize multi-colored CDs or long-wavelength CDs, such as mango leaves (Kumawat et al., 2017), lemon juice (Ding et al., 2017), and pumpkin (Gong et al., 2015). Although these biomass CDs obtained a high QY, due to the difference in raw materials, they were difficult to industrialize. There is no doubt that formulating precursor compositions can realize CDs with multi-color emission, but this method suffers from many problems, such as low QY and non-uniform CD compositions and size distributions, thus limiting the application of CDs.
Use various post-processes or environmental manipulations. The luminesce color of some CDs could change with factors, such as dispersion types, pH values, and their own oxidation state. Gao et al. obtained green and red fluorescent quantum dots by coating blue fluorescent CDs with polyethyleneimines (PEIs) of different molecular weights (Gao et al., 2017). Liu et al., by adjusting the pH of the solution, the fluorescence of the synthesized CDs can be switched between blue and green (Chen et al., 2019). Although this method can achieve a certain range of wavelength, however, in practical applications, the emission wavelength is easily affected by the external environment, which limits its further application.
Recently, the research on multi-color CD development is booming; however, low QY (long-wavelength fluorescent CDs, especially, have much lower QY than blue CDs), heterogeneous source formulations and complex post-processes hinder the development and popularity of CDs; hence, new techniques for preparing multi-color CDs are highly desired.
At present, single precursor-based CDs have been realized by some researchers because it can reduce the variety of precursors and thus improve the uniformity and consistency of CDs5, (Yang et al., 2021; Xian and Li, 2022; Liu et al., 2020; Liu et al., 2019), further avoiding time-consuming source formulation and optimization, thus enhancing the industrialization of CD. In addition, this method also allows the self-doping of CDs, thus further improving the CD performance (Li et al., 2021).
Here, 2,5-Diaminobenzenesulfonic acid was used as the only precursor to synthesize red (R), green (G), and blue (B) trichromatic CDs by self-doping achieved S and N co-doping. Our method neither requires strong oxidants or complex precursor formulations nor post-processing to tune the fluorescence wavelength, minimizing the environmental effects on its optical properties. The prepared S,N-CD has a high fluorescence QY (B = 41 %, G = 33 %, R = 39.3 %) (Liu et al., 2017; Miao et al., 2017; Bai et al., 2022; Lv et al., 2021; Zhu et al., 2019; Lan et al., 2017; Gao et al., 2023).
To investigate the practical applicability of CDs and facilitate their engineering, we explored applications of CDs for chemical trace sensing (Ag+ and Fe 3+) and full CD-based white light LED. Our CDs show outstanding chemical detection capabilities with low detection limits and high selectivity. At the same time, the prepared three-color CDs show their application potential in the field of fluorescent ink. For light source applications, we explored WLEDs based on wet state CDs and solid-state phosphors, especially solid phosphors from edible lotus root powder, which are degradable and digestible, thus facilitating circulation-free in vivo medical procedures, such as imaging of gastric or intestinal tissues. The WLED exhibits excellent lighting performance achieved CIE (1931) coordinates of (0.32,0.33), which corresponds to almost pure natural light. Our work inspires single-source double-doped CD synthesis, full-color CD tuning, fluorescent sensing, and full CD-based light source technology, but also promotes the further development and application of CDs.
2 Experimental section
2.1 Materials
2,5-Diaminobenzenesulfonicacid, 1-Methyl-2-pyrrolidinone (NMP), Dichloromethane, Methanol, Formamide, N,N-Dimethylformamide (DMF), Cd(NO3)2, CoCl2, NaCl, CuSO4, ZnCl2, MgCl2, HgCl2, Ni(NO3)2, MnCl2, NH4Cl, Al2(SO4)3 were purchased from Sinopharm Chemical Reagent Co., ltd. All chemicals and solvents were of analytical grade and were used without further purification. Deionized water was used throughout the experiments.
2.2 Apparatus and characterization
The lateral size of the quantum dots was measured using transmission electron microscopy (TEM; JEOL JEM-2100F). The elemental composition and chemical state of the N-CDs were determined by X-ray photoelectron spectroscopy (XPS; Semeron Escalab 250Xi). The absolute fluorescence QY were determined using a fluorescence spectrometer (Edinburgh Instruments FLS1000). Fourier transform infrared spectroscopy (FTIR) measurements were carried out using a Nicolet 5700 infrared spectrometer, and use Perkin Elmer (Lambda 35) record the UV absorption spectrum of the solution, the Solid-Phase fluorescence and Solution-Phase fluorescence were recorded using Hitachi F-7000 fluorescence spectrometer and Perkin Elmer (LS55) respectively.
2.3 Synthesis of S,N-CDs
S,N-CDs were synthesized by a one-step solvothermal method using 2,5-Diaminobenzenesulfonicacid as the C,N, and S sources. The reaction scheme for the preparation of the S,N-CDs and detection mechanisms are presented in Fig. 1.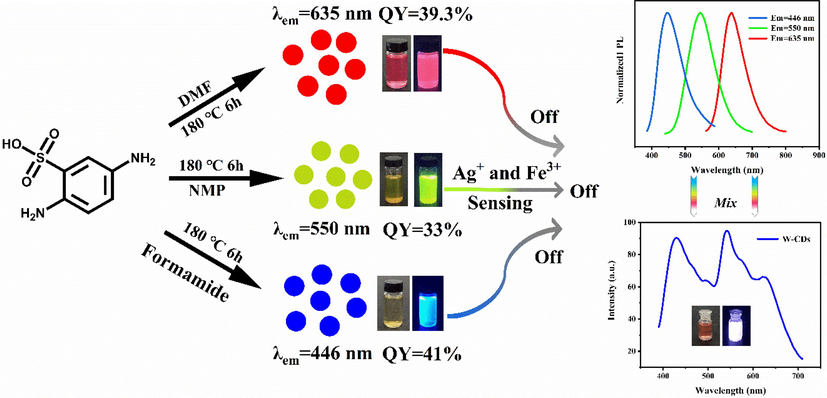
Schematic synthesis and detection of the RGB-CDs.
25 mg of 2,5-Diaminobenzenesulfonicacid and 10 mL solvent (NMP, DMF, or formamide) were added to a 25 mL stainless steel reactor and then reacted at 180 °C for 6 h. After cooling to room temperature, the resulting CDs were eluted and purified by silica gel column chromatography with methanol and dichloromethane as the eluents. The purified CDs were freeze-dried, collected, and stored at 4 °C.
CDs with various wavelengths were realized by changing the solvent. R-, G-, B-CDs were synthesized in DMF, NMP, and formamide, respectively.
2.4 Preparation of solid CD phosphors and xerogels
Preparation of CD composite phosphors: 2 mL of 0.5 mg/mL blue (B)-, green (G)-, and red (R)-CD solution were separately sonicated and mixed with 1 g of edible lotus root powder and then dried at 60 °C. The as-obtained products were named B-CDs-1, G-CDs-1, and R-CDs-1, respectively.
The preparation of porous CDs xerogel: 3 g of phosphors (B-, G-, and R-CDs-1) was added separately to 30 mL deionized water, stirred in a water bath at 90 °C for 2 h. Next, the solutions were cooled to room temperature and freeze-dried. Finally, the CD porous materials were obtained and named B-, G-, and R-CDs-2, respectively.
2.5 Preparation of white fluorescent CDs
For the application of the CDs in WLED, we mixed the R, G, and B-CDs in ethanol solution with a weight ratio of 1:3:3, respectively, to obtain the white light emission solution named W-CDs. Similarly, white solid CD phosphors (W-CDs-1) and xerogels (W-CDs-2) were obtained in the same way.
2.6 Fluorescence assays of Fe3+ and Ag+
The detection of Ag+ and Fe3+ by R-, G-, and B-CDs was carried out at room temperature. Various standard concentrations of Ag+ or Fe3+ were added to 3 mL of 0.5 mg/mL R-CD methanol dispersion and then uniformly mixed at room temperature. The fluorescence spectrum of the solution was recorded after 1 min. This procedure was repeated with 0.5 mg/mL G- and B-CDs. Other ions were added to the R-, G-, and B-CDs under the same conditions, and the parameters remained constant during the measurement.
3 Result and discussion
3.1 Morphological and chemical states of S,N-CDs
Fig. 2(a), (b), and (c) show TEM images of B-, G-, and R-CDs, respectively. It can be seen that all our CDs have good dispersions and narrow particle size distributions. The statistical measurement results (nearly 200 points), indicate that the average sizes of the CDs are ∼ 4.5 nm (B-CDs), ∼5 nm (G-CDs), and ∼ 6.5 nm (R-CDs), respectively. Through high-resolution transmission electron microscopy (HR-TEM) observation (insets in Fig. 2), it can be clearly seen that the lattice spacing of CDs for the different quantum dots is 0.21 nm, which is consistent with the previously reported lattice spacing of sp2 graphite carbon (1 0 0).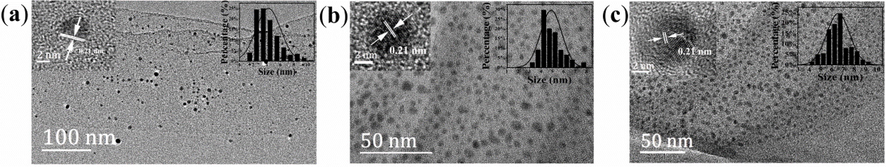
TEM images of B-CD (a), G-CD (b) and R-CD (c), and the insets show the lattice spacing and grain size distribution of carbon dots, respectively.
XPS was used to study the chemical state and doping species in trichromatic CDs. In addition to the C 1 s (284 eV) and O 1 s (531 eV) peaks, N 1 s (399 eV) and S 2p (169 eV) peaks also exist in the XPS profiles (Fig. 3), indicating the successful doping of N and S elements into the CDs.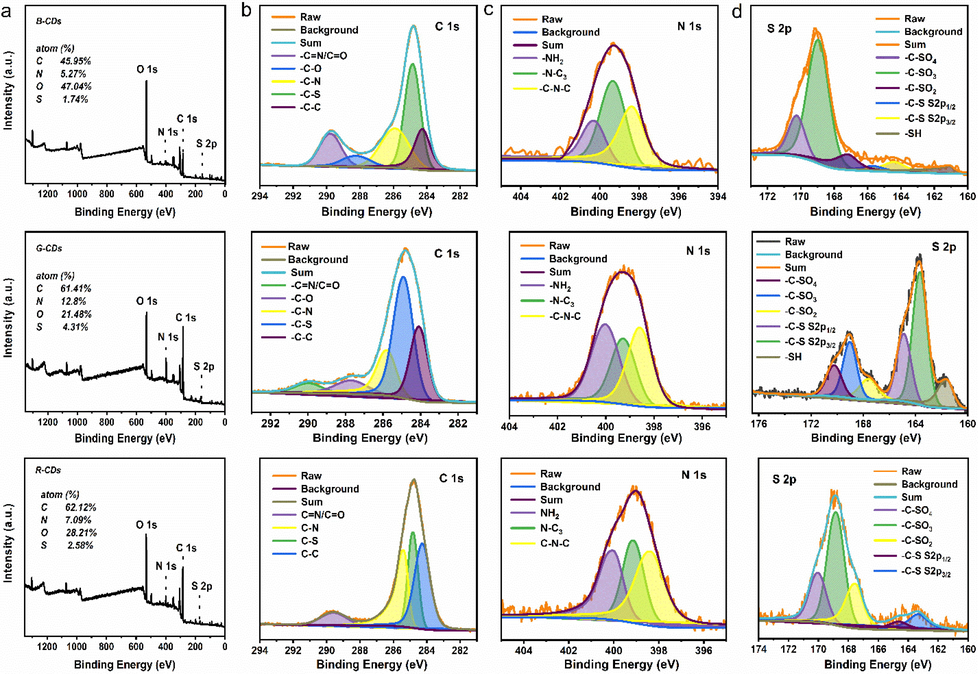
XPS spectra of B-CDs, G-CDs and R-CDs, (a), (b), (c) and (d) are the full spectrum and high-resolution spectra of C 1 s (b) and N 1 s (c) and S 2p (d), respectively.
Fig. 3 shows high-resolution spectra of B-CDs and the left, center, and right insets correspond to C 1 s, N 1 s, and S 2p, respectively. C⚌O/C⚌N (∼290 eV), C—O (∼287.8 eV), C—N (∼285.8 eV), C—S (∼284.9 eV), and C—C (∼284.1 eV) peaks appear in the C 1 s spectra; –NH2 (∼400 eV), N–C3 (∼399.3 eV), C—N—C (∼398.6 eV) peaks appear in the N 1 s spectra; and six characteristic peaks, C–SO4 (∼170.25 eV), C–SO3 (∼169 eV), C–SO2 (∼167.6 eV), C—S 2p1/2 (∼164.6 eV), C—S 2p3/2 (∼163.3 eV), and -SH (∼161.7 eV) peaks appear in the S 2p spectra. G-CDs and R-CDs (Fig. 3) presented similar XPS results to that of B-CDs, but the characteristic peaks, C—S (S 2p1/2 at ∼ 164.6 eV and S 2p3/2 at ∼ 163.3 eV) and -SH (∼161.7 eV) significantly increased in G-CDs S2p high-resolution spectra, whereas the peaks, C—O (∼287.8 eV) and -SH (∼161.7 eV), of R-CDs clearly disappear in its C 1 s and S 2p of high-resolution spectra. At the same time, we calculated the chemical contents of the trichromatic CDs; for B-CDs: C 45.95 %, N 5.27 %, O 47.04 %, and S 1.74 %; G-CDs: C 61.41 %, N 12.8 %, O 21.48 %, and S 4.31 %; and R-CDs: C 62.12 %, N 7.09 %, O 28.21 %, and S 2.58 %. XPS observations confirmed that the trichromatic CDs had various surface and doping states and B- and G-CDs have abundant amino and sulfhydryl groups, while R-CDs have abundant carbonyl and amino group. In the XPS data of all three CDs, C⚌N peaks appeared, indicating that –NH2 was involved in the condensation process of carbon core during the synthesis. And the B-CDs had the most O doping, implying a higher surface oxidation state of the B-CDs, which may be due to the high amount of doping caused by the solvent. The characteristic peak of -SH appears in G-CDs due to the good reduction of NMP, while in R-CDs, probably due to the involvement of the –NH2 of DMF in the condensation reaction of carbon core, the XPS data show a higher proportion of large conjugated structures of C1s in R-CDs, which is consistent with the TEM results.
In addition, FTIR spectra was used to validate the functional groups of the trichromatic CDs (Fig. 4). The peak at 3384 cm−1 is attributed to the stretching vibrations of OH and –NH2, verifying again that the surface of the trichromatic CDs has abundant amino and hydroxyl groups. The peaks at 2976 and 2904 cm−1 correspond the stretching vibration of C—H. The peak at 2098 cm−1 corresponds to the characteristic peak of -SH, while the peak at 1660 cm−1 corresponds to the vibration absorption of C⚌O. The peaks at 1400 and 600 cm−1 correspond to the stretching vibrations of C—N and S—C, respectively. From the FTIR spectra, it can be seen that the characteristic peak of -SH in R-CDs disappears, whereas the vibration absorption peak of C⚌O at 1660 cm−1 is significantly reduced relative to those of B-CDs and G-CDs. These facts are consistent with the XPS results. Consequently, we can conclude that the luminous difference among trichromatic CDs is related to their surface states (Lv et al., 2021).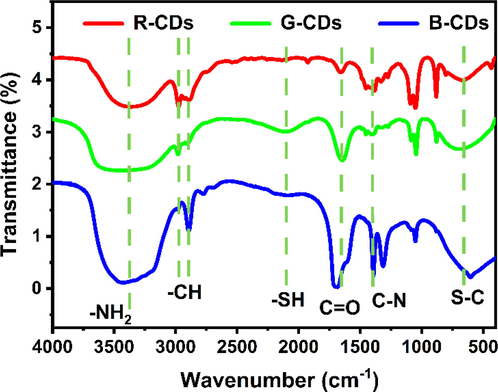
The FTIR spectra of B-CDs, G-CDs and R-CDs.
3.2 Optical properties of S,N-CDs
The prepared B-CDs, G-CDs and R-CDs all have good absorption and emission capabilities. Fig. 5a, b and c show the UV absorption spectrum and fluorescence spectrum of B-CDs, G-CDs and R-CDs, respectively. In the UV absorption spectrum (Fig. 5a), the B-CDs showed two n-π* absorption peaks at 265 and 320 nm, the G-CDs have a smoother absorption spectrum with no pronounced absorption peaks (Fig. 5b), while the R-CDs exhibit remarkable absorption peaks at 320 nm and 265 nm, reflecting the n-π* absorption in the R-CDs (Fig. 5c). The Fluorescence (FL) spectra of these CDs were recorded and three primary colors were verified. The most intense fluorescence peak vs excitation pairs are as follows: for B-CDs, Ex (Excitation wavelength) = 396 nm and Em (Emission wavelength) = 446 nm; G-CDs, Ex = 400 nm and Em = 550 nm; and R-CDs, Ex = 550 nm and Em = 635 nm (Fig. 5a, b and c). Evidently, larger CDs experience a stronger red shift (refer to TEM images in Fig. 2), according to the quantum dot size effect (Ding et al., 2018). When the excitation wavelength changes, the emission of B-CDs (Ex = 330–450 nm) clearly exhibits a certain excitation wavelength dependence (Fig. 5d), whereas the emissions of G-CDs (Ex = 340–480 nm) and R-CDs (Ex = 440–580 nm) do not change significantly (Fig. 5e and f), implying weak excitation wavelength dependences. All the CDs have a decent QY; B-CDs = 41 %, G-CDs = 33 %, and R-CDs = 39.3 %. The corresponding CIE (1931) coordinates (Fig. 6a) are (0.16, 0.15), (0.36, 0.57), and (0.68, 0.32) for B-, G-, and R-CDs, respectively. Fig. 5 shown that the fluorescence spectra of R-, G-, and B-CDs significantly overlap. These single chromatic CD solutions can emit white fluorescence (Ex = 365 nm, Fig. 5b) with CIE (1931) coordinates of (0.32, 0.33), when mixed in the ratio B-CD: G-CD: R-CD = 1:3:3. Fig. 6c was the multicolor LEDs based on CDs.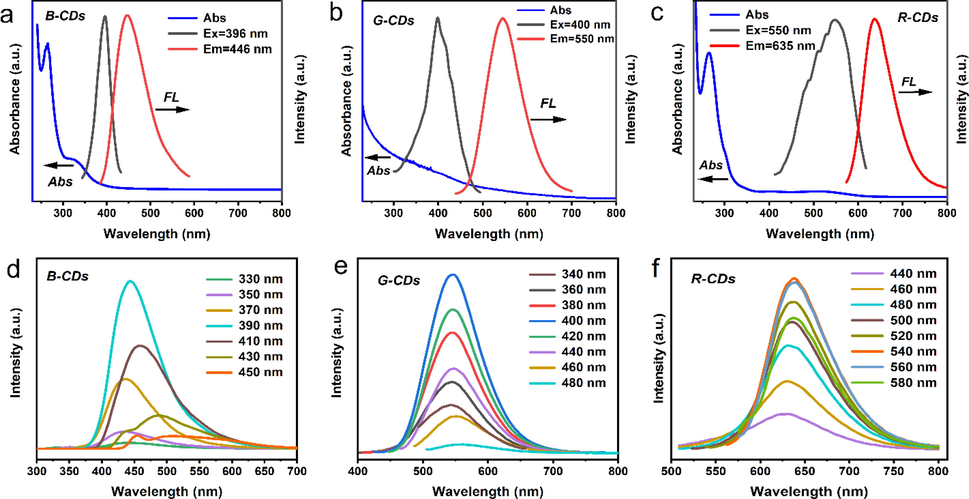
UV–visible absorption spectrum of B-CDs (5a), G-CDs (5b) and R-CDs (5c). The fluorescence spectrum of B-CDs (5d), G-CDs (5e) and R-CDs (5f) at different excitation wavelengths (Ex).
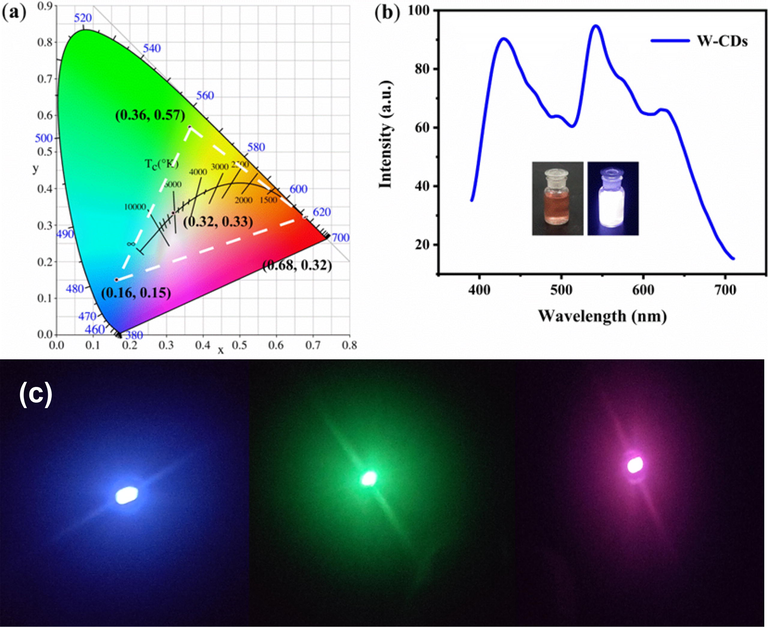
The CIE (1931) coordinates of B-CDs, G-CDs and R-CDs (a). The FL spectrum of W-CDs (b). Inset show the picture of sunlight (left) and 365 nm UV-light (right). (c) The multicolor LEDs based on CDs.
3.3 Fluorescence detection performance
Trichromatic CDs have a good luminescence stability, and so they are used to construct a turn-off sensor for Fe3+ and Ag+ detection.
As shown in Fig. 7a and e, due to the excitation at 396 nm, the strong fluorescence emitted by B-CDs at 450 nm can be effectively quenched with the gradual addition of Ag+ or Fe3+. When the concentration of Ag+ is increased from 0 to approximately 1 μM, there is a good linear relationship between the (I0-I)/I0 and Ag+. The linear equation is y = 0.434x + 0.0168 (R2 = 0.99, n = 13) and the detection limit for Ag+ is as low as 69 nM (3σ/K) (σ is the standard deviation after correcting the blank signal and K is the slope of the fitting line) (Fig. 7c). Similarly, the B-CDs can recognize Fe3+ with a detection limit of 62 nM and concentration of 0–1.3 μM (Fig. 7e).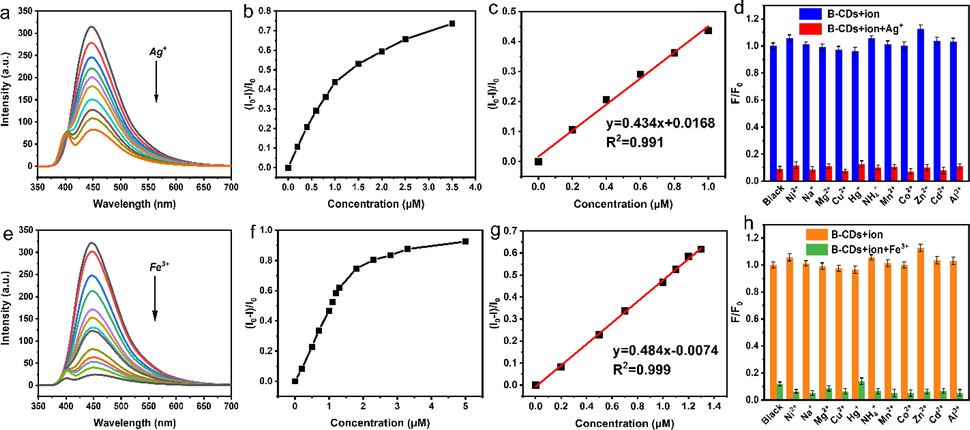
Fluorescence spectra of solutions with increasing concentrations of Ag+ and Fe3+(a, e), fluorescence recovery factor (I0-I)/I0 versus Ag+ and Fe3+ concentrations (b, f), inset shows the linear relationship between fluorescence recovery factor (I0-I)/I0 and Ag+ and Fe3+ concentrations (c, g). The selectivity and anti-interference of B-CDs for the detection of Ag+ and Fe3+ (d, h).
The detection of Ag+ and Fe3+ by G-CDs is shown in the Fig. 8a and d, when the concentration of Ag+ is 0 ∼ 0.7 μM, there is a good linear relationship between the concentration of (I0-I)/I0 and Ag+ (Fig. 8b). The linear equation is y = 0.8465x + 0.1356 (R2 = 0.99, n = 13), and the detection limit for Ag+ is as low as 35 nM (3σ/K). When the concentration of Fe3+ was 0 ∼ 3 μM, there was linear correlation y = 0.221x + 0.0963 (R2 = 0.992, n = 13), and the detection limit was 136 nM (Fig. 8e).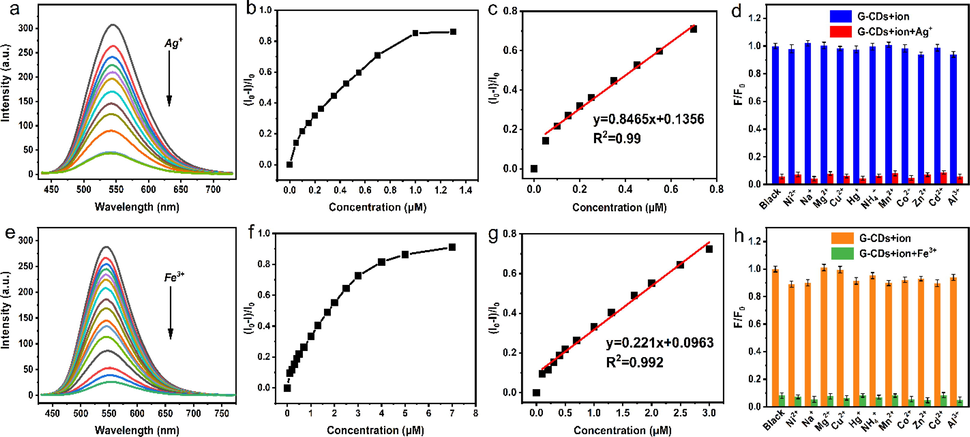
Fluorescence spectra of solutions with increasing concentrations of Ag+ and Fe3+ (a, e), fluorescence recovery factor (I0-I)/I0 versus Ag+ and Fe3+ concentrations (b, f), inset shows the linear relationship between fluorescence recovery factor(I0-I)/I0 and Ag+ and Fe3+ concentrations (c, g). The selectivity and anti-interference of G-CDs for the detection of Ag+ and Fe3+ (d, h).
The R-CDs also show high detectability for Ag+ and Fe3+ (Fig. 9a and e). When Ag+ and Fe3+ concentrations were 0 ∼ 1.5 μM and 0 ∼ 0.5 μM, respectively, the linear equations y = 0.314x + 0.0181 (R2 = 0.991, n = 13) (Fig. 9b) and y = 1.317x + 0.00512 (R2 = 0.995, n = 13) (Fig. 9f), existed for (I0-I)/I0 with Ag+ or Fe3+ concentrations respectively. The detection limits (3σ/K) for Ag+ and Fe3+ are 95 nM and 23 nM, respectively.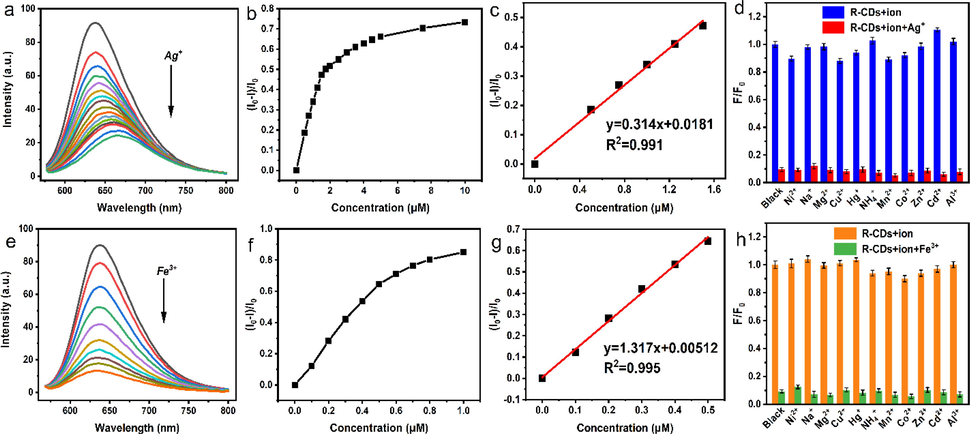
Fluorescence spectra of solutions with increasing concentrations of Ag+ and Fe3+ (a, e), fluorescence recovery factor (I0-I)/I0 versus Ag+ and Fe3+ concentrations (b, f), inset shows the linear relationship between fluorescence recovery factor (I0-I)/I0 and Ag+ and Fe3+ concentrations (c, g). The selectivity and anti-interference of R-CDs for the detection of Ag+ and Fe3+ (d, h).
In the presence of representative ions (Cd2+, Na+, Cu2+, Zn2+, Mg2+, Hg+, Ni2+, NH4+, Co2+, Al3+, and Mn2+), selective determination and anti-interference measurements were carried out at a concentration of 50 μM. As in Fig. 7d and h, Fig. 8d and h, and Fig. 9d and h, it can be seen that, after adding Ag+ or Fe3+, the fluorescence intensity of the trichromatic CD solution is significantly reduced, and other ions produce little or no effects. The fact strongly validated that the trichromatic CDs have good selectivity for Fe3+ and Ag+, laying a positive foundation for the development of CD-based highly selective fluorescent sensors for Ag+ and Fe3+. We also explored the testing capability for Fe3+ and Ag+ in real water samples (tap water and river water from the Fenhe River, Taiyuan City, China). The CDs presented excellent recognizing performance, with recovery rates of 92.8–110.2 % (Table 1).
Recovery (%)
CDs type
Water type
Ag+
0.25(μM)Ag+
0.5(μM)Fe (Liu et al., 2018)+
0.25(μM)Fe3+
0.25(μM)
B-CDs
Tap water
98.5 %
100.2 %
99.7 %
104.5 %
Fenhe River
104.8 %
109.7 %
101.6 %
97.8 %
G-CDs
Tap water
105.2 %
109.5 %
96.4 %
97.9 %
Fenhe River
92.8 %
98.5 %
102.7 %
110.2 %
R-CDs
Tap water
101.3 %
99.9 %
99.4 %
107.5 %
Fenhe River
94.7 %
97.6 %
95.2 %
99.3 %
3.4 Solid CD phosphors and xerogels and WLED applications
We observed the microscopic morphologies of the fluorescent powder and xerogels material, to estimate the specific surface areas that determine the CDs on pristine lotus root powder absorption on and the potential in sensing of composite phosphors. The scanning electron microscopy images show a cylindrical topological morphology in the pristine lotus root powder (Fig. 10a and b), whereas a typical lamellar structure is exhibited by the composite xerogels. The lamellar structure has a large surface area and is conducive to absorption and sensing.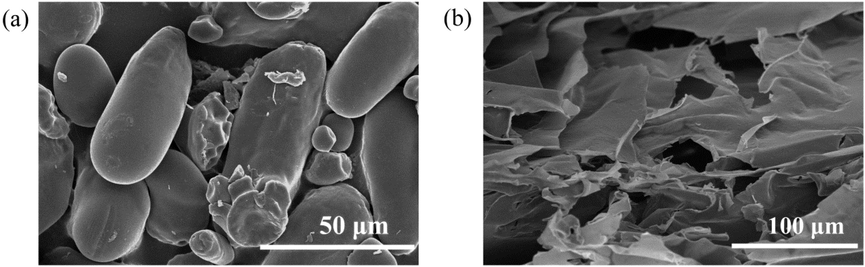
The SEM images of lotus root powder before (a) and after cross-linking (b), respectively.
The optical properties were also investigated. It was found (Fig. 11) that the prepared solid phosphors and CD xerogels exhibited different degrees of blue shifts in the position of the emission peaks compared to that of the solution fluorescence. We calculated the CIE coordinates of these solid fluorescent materials to better evaluate their suitability for solid lighting. The CIE (1931) coordinates (Fig. 12a) of these solid phosphors are (0.16, 0.07) for B-CDs-1, (0.19, 0.35) for G-CDs-1, and (0.62, 0.38) for R-CDs-1. The CIE (1931) coordinates of xerogels (Fig. 12c) are (0.16, 0.07) for B-CDs-2, (0.22, 0.37) for G-CDs-2, and (0.62, 0.38) for R-CDs-2. Evidently, the solid phosphors and CD xerogels hold outstanding FL. The CIE (1931) coordinates of W-CDs-1 and W-CDs-2 were up to (0.31, 0.32) and (0.33, 0.35), respectively, which are close to that of pure white light (Fig. 12a and c). In the inset in Fig. 11b and d, we present a picture W-CDs-1 and W-CDs-2 under sunlight (left) and 365 nm-UV-light (right). The feasibility of the resulting multiple-color emissive CDs in color printing and WLED devices can be observed.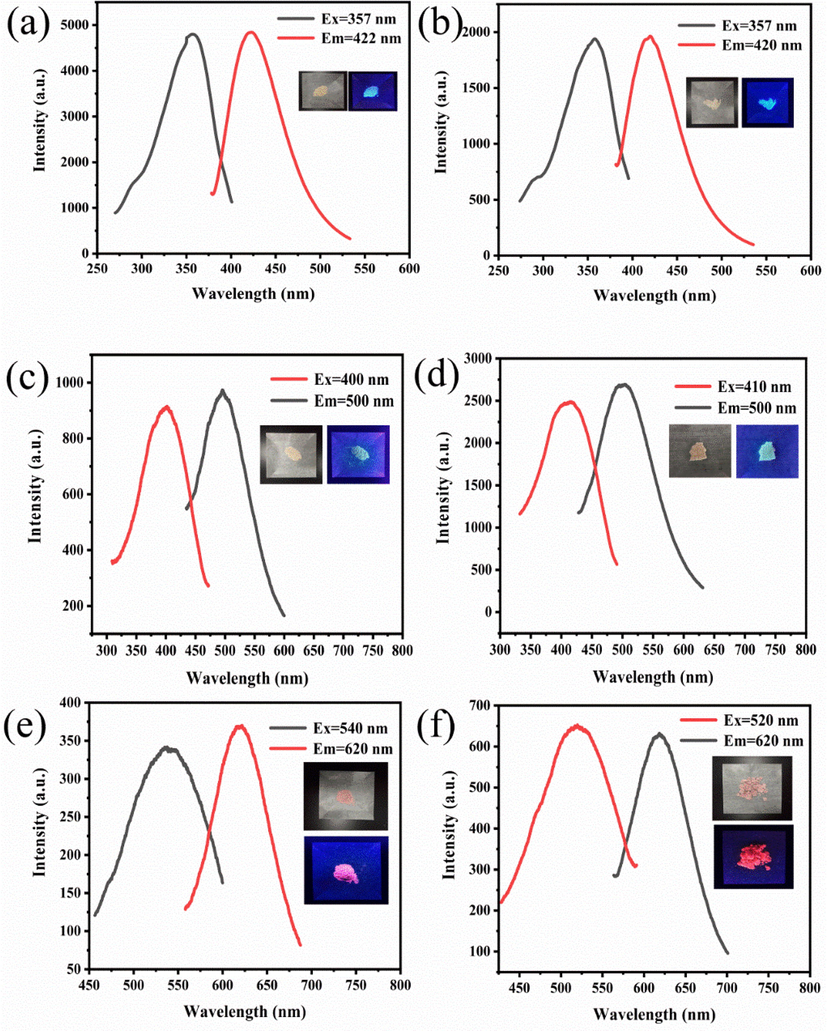
Fluorescence spectra of B-CDs-1 (a) and B-CDs-2 (b), G-CDs-1 (c) and G-CDs-2 (d), R-CDs-1 (e) and R-CDs-2 (f).
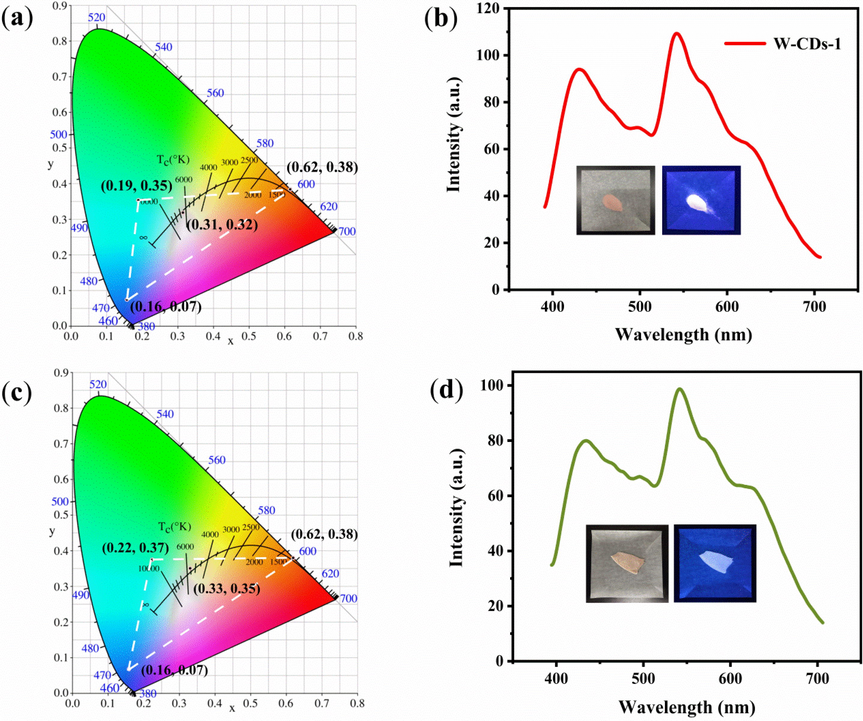
CIE (1931) coordinates of B-CDs-1, G-CDs-1, R-CDs-1 and W-CDs-1, (a) FL spectrum of W-CDs-1 (b), inset shows pictures of sunlight (left) and 365 nm UV (right). CIE (1931) coordinates of B-CDs-2, G-CDs-2, R-CDs-2 and W-CDs-2 (c), FL spectrum of W-CDs-2 (d). The inset shows pictures of sunlight (left) and 365 nm UV (right).
4 Conclusion
In this study, B- (Em = 446 nm), G- (550 nm), and R-CDs (635 nm) were prepared by changing the solvent type. At the same time, heteroatomic double-doping of these CDs (S,N-CDs) was successfully synthesized by a one-step solvothermal method with only 2,5-Diaminobenzenesulfonic acid as C,N and S sources. The single sources avoid complex precursor formulations and post-processing, ensuring the uniformity and consistency of the synthesized CDs to a large extent. All the prepared CDs have excellent optical and sensing properties and can be used to construct turn-off fluorescence sensors for the Fe3+ and Ag+. By mixing the prepared R-, G-, and B-CDs, the WLED application was demonstrated, and the CIE coordinates of white light (solution) increased up to (0.32,0.33). The environmentally friendly CD phosphors and CD xerogels were obtained with CIE (1931) coordinates of up to (0.31, 0.32) and (0.33, 0.35), respectively. Our work shows the application potentials of CDs in many fields such as ion detection and LEDs.
Author Contributions
The manuscript was written through contributions of all authors. All authors have given approval to the final version of the manuscript. ‡These authors contributed equally.
Conflicts of Interest
There are not conflicts of interest to declare.
Funding sources
This work was supported by the Natural Science Foundation of Shanxi Provnice China (201901D111140), the National Science Fund for Distinguished Young Scholars under Grant 51425505, the National Natural Science Foundation of China (Youth Project) under Grant 51505435 and China Postdoctoral Science Foundation under Grant 2014 M551061. And Authors are very grateful to the North China University Education Reform Project in 2019 (2019067).
References
- A Smart Near-Infrared Carbon Dot-Metal Organic Framework Assemblies for Tumor Microenvironment-Activated Cancer Imaging and Chemodynamic-Photothermal Combined Therapy. Adv. Healthc. Mater.. 2022;11(12):e2102759.
- [Google Scholar]
- Multifunctional sensing applications of biocompatible N-doped carbon dots as pH and Fe3+ sensors. Microchem. J.. 2019;149
- [Google Scholar]
- Synthesizing Red Fluorescent Carbon Dots from Rigid Polycyclic Conjugated Molecules: Dual-Mode Sensing and Bioimaging in Biochemical Applications. Part. Part. Syst. Char.. 2021;38(7)
- [Google Scholar]
- Colorful, time-dependent carbon dot-based afterglow with ultralong lifetime. Chem. Eng. J.. 2022;431
- [Google Scholar]
- Controllable Modulation of Efficient Phosphorescence Through Dynamic Metal-Ligand Coordination for Reversible Anti-Counterfeiting Printing of Thermal Development. Adv. Funct. Mater. 2022
- [Google Scholar]
- Revealing the nature of optical activity in carbon dots produced from different chiral precursor molecules. Light Sci. Appl.. 2022;11(1):92.
- [Google Scholar]
- Highly Efficient Red-Emitting Carbon Dots with Gram-Scale Yield for Bioimaging. Langmuir. 2017;33(44):12635-12642.
- [Google Scholar]
- Facile synthesis of red-emitting carbon dots from pulp-free lemon juice for bioimaging. J. Mater. Chem. B. 2017;5(26):5272-5277.
- [Google Scholar]
- Solvent-Controlled Synthesis of Highly Luminescent Carbon Dots with a Wide Color Gamut and Narrowed Emission Peak Widths. Small. 2018;14(22):e1800612.
- [Google Scholar]
- Carbon dots with red/near-infrared emissions and their intrinsic merits for biomedical applications. Carbon. 2020;167:322-344.
- [Google Scholar]
- Large scale synthesis of full-color emissive carbon dots from a single carbon source by a solvent-free method. Nano Res.. 2021;15(4):3548-3555.
- [Google Scholar]
- Renal clearing carbon dots-based near-infrared fluorescent super-small nanoprobe for renal imaging. Carbon. 2023;201:805-814.
- [Google Scholar]
- Red, Yellow, and Blue Luminescence by Graphene Quantum Dots: Syntheses, Mechanism, and Cellular Imaging. ACS Appl. Mater. Interfaces. 2017;9(29):24846-24856.
- [Google Scholar]
- Low temperature synthesis of phosphorous and nitrogen co-doped yellow fluorescent carbon dots for sensing and bioimaging. J. Mater. Chem. B. 2015;3(33):6813-6819.
- [Google Scholar]
- Multicolor and Single-Component White Light-Emitting Carbon Dots from a Single Precursor for Light-Emitting Diodes. ACS Applied Nano Materials. 2022;5(10):15914-15924.
- [Google Scholar]
- Phenylenediamine-derived near infrared carbon dots: The kilogram-scale preparation, formation process, photoluminescence tuning mechanism and application as red phosphors. Carbon. 2022;192:198-208.
- [Google Scholar]
- Red, green, and blue luminescence by carbon dots: full-color emission tuning and multicolor cellular imaging. Angew. Chem. Int. Ed. Engl.. 2015;54(18):5360-5363.
- [Google Scholar]
- Graphene Quantum Dots from Mangifera indica: Application in Near-Infrared Bioimaging and Intracellular Nanothermometry. ACS Sustain. Chem. Eng.. 2017;5(2):1382-1391.
- [Google Scholar]
- Two-photon-excited near-infrared emissive carbon dots as multifunctional agents for fluorescence imaging and photothermal therapy. Nano Res.. 2017;10(9):3113-3123.
- [Google Scholar]
- Targeted tumour theranostics in mice via carbon quantum dots structurally mimicking large amino acids. Nat. Biomed. Eng.. 2020;4(7):704-716.
- [Google Scholar]
- Optical Properties of Carbon Dots in the Deep-Red to Near-Infrared Region Are Attractive for Biomedical Applications. Small. 2021;17(43):e2102325.
- [Google Scholar]
- Formation and fluorescent mechanism of red emissive carbon dots from o-phenylenediamine and catechol system. Light Sci. Appl.. 2022;11(1):298.
- [Google Scholar]
- Red Emission B, N, S-co-Doped Carbon Dots for Colorimetric and Fluorescent Dual Mode Detection of Fe(3+) Ions in Complex Biological Fluids and Living Cells. ACS Appl. Mater. Interfaces. 2017;9(14):12663-12672.
- [Google Scholar]
- Deep Red Emissive Carbonized Polymer Dots with Unprecedented Narrow Full Width at Half Maximum. Adv. Mater.. 2020;32(17):e1906641.
- [Google Scholar]
- Rational synthesis of highly efficient ultra-narrow red-emitting carbon quantum dots for NIR-II two-photon bioimaging. Nanoscale. 2020;12(3):1589-1601.
- [Google Scholar]
- Toward Strong Near-Infrared Absorption/Emission from Carbon Dots in Aqueous Media through Solvothermal Fusion of Large Conjugated Perylene Derivatives with Post-Surface Engineering. Adv Sci (Weinh). 2022;9(23):e2202283.
- [Google Scholar]
- Synthesis of Luminescent Carbon Dots with Ultrahigh Quantum Yield and Inherent Folate Receptor-Positive Cancer Cell Targetability. Sci. Rep.. 2018;8(1):1086.
- [Google Scholar]
- Efficient Red/Near-Infrared-Emissive Carbon Nanodots with Multiphoton Excited Upconversion Fluorescence. Adv Sci (Weinh). 2019;6(17):1900766.
- [Google Scholar]
- Long-wavelength (red to near-infrared) emissive carbon dots: Key factors for synthesis, fluorescence mechanism, and applications in biosensing and cancer theranostics. Chin. Chem. Lett.. 2021;32(12):3653-3664.
- [Google Scholar]
- Red Emissive Sulfur, Nitrogen Codoped Carbon Dots and Their Application in Ion Detection and Theraonostics. ACS Appl. Mater. Interfaces. 2017;9(22):18549-18556.
- [Google Scholar]
- Tunable multicolour S/N co-doped carbon quantum dots synthesized from waste foam and application to detection of Cr(3+) ions. Luminescence 2020
- [Google Scholar]
- 53% Efficient Red Emissive Carbon Quantum Dots for High Color Rendering and Stable Warm White-Light-Emitting Diodes. Adv. Mater. 2017:29. (37)
- [Google Scholar]
- Nickel-doped carbon dots with enhanced and tunable multicolor fluorescence emission for multicolor light-emitting diodes. Carbon. 2023;201:796-804.
- [Google Scholar]
- Hydrothermal Synthesis of High-Yield Red Fluorescent Carbon Dots with Ultra-Narrow Emission by Controlled O/N Elements. Adv. Mater.. 2022;34(21):e2201031.
- [Google Scholar]
- Multicolor carbon dots with concentration-tunable fluorescence and solvent-affected aggregation states for white light-emitting diodes. Nano Res.. 2019;13(1):52-60.
- [Google Scholar]
- Large-scale fabrication of heavy doped carbon quantum dots with tunable-photoluminescence and sensitive fluorescence detection. J. Mater. Chem. A. 2014;2(23)
- [Google Scholar]
- Solid-phase synthesis of red dual-emissive nitrogen-doped carbon dots for the detection of Cu2+ and glutathione. Microchem. J.. 2021;169
- [Google Scholar]
- Engineering triangular carbon quantum dots with unprecedented narrow bandwidth emission for multicolored LEDs. Nat. Commun.. 2018;9(1):2249.
- [Google Scholar]
- Highly efficient and stable white LEDs based on pure red narrow bandwidth emission triangular carbon quantum dots for wide-color gamut backlight displays. Nano Res.. 2019;12(7):1669-1674.
- [Google Scholar]
- Bright blue emissions N-doped carbon dots from a single precursor and their application in the trace detection of Fe3+ and F−. Inorg. Chim. Acta. 2021;515
- [Google Scholar]
- Self-carbonization synthesis of highly-bright red/near-infrared carbon dots by solvent-free method. J. Mater. Chem. C. 2022;10(8):3153-3162.
- [Google Scholar]
- Solid-State Red Laser with a Single Longitudinal Mode from Carbon Dots. Angew. Chem. Int. Ed. Engl.. 2021;60(48):25514-25521.
- [Google Scholar]
- Near-infrared I/II emission and absorption carbon dots via constructing localized excited/charge transfer state for multiphoton imaging and photothermal therapy. Chem. Eng. J.. 2023;452
- [Google Scholar]
- Ethanothermal synthesis of phenol-derived carbon dots with multiple color emission via a versatile oxidation strategy. Opt. Mater.. 2019;88:412-416.
- [Google Scholar]
- Red carbon dots: Optical property regulations and applications. Mater. Today. 2019;30:52-79.
- [Google Scholar]


