

Translate this page into:
Synthesis, physico-chemical characterization, antimicrobial activity and toxicological features of Ag—ZnO nanoparticles
⁎Corresponding author. magdalena.lungu@icpe-ca.ro (Magdalena Valentina Lungu),
-
Received: ,
Accepted: ,
This article was originally published by Elsevier and was migrated to Scientific Scholar after the change of Publisher.
Abstract
Silver-zinc oxide nanoparticles (Ag—ZnO NPs) were chemically synthesized by the deposition of Ag NPs on the surface of ZnO NPs using silver nitrate, three types of anionic polyelectrolytes and citric acid as reagents. The Wavelength Dispersive X-ray Fluorescence (WDXRF) spectrometry of Ag—ZnO NPs revealed 0.41–0.69 wt% Ag, and balance ZnO. The existence of Ag NPs on the surface of ZnO NPs with hexagonal wurtzite structure was highlighted by X-ray Diffraction (XRD) analysis, scanning electron microscopy (SEM), and Ultraviolet–Visible (UV–Vis) spectroscopy. The diffuse reflectance absorption of Ag—ZnO NPs in the visible light region increased with the increase of Ag NPs content. The Fourier Transform Infrared (FTIR) spectrometry revealed no chemical bonding between Ag NPs and ZnO NPs and confirmed the presence of functional groups characteristic to ZnO and carboxylic acid salts. The newly synthesized Ag—ZnO NPs displayed antimicrobial activity against all the tested medically relevant pathogens, with minimal (biofilm) inhibitory concentrations ranging from 1.875 mg/mL to 7.5 mg/mL. Although the in vitro genotoxicity assay revealed a relatively high micronuclei index, the in vivo micronucleus (MN) test revealed a low MN frequency in animals treated with Ag—ZnO NPs. The histopathological analysis revealed non-significant structural changes of the hepatic parenchyma, renal cortex and intestinal mucosa and minimal inflammatory reactions. The Ag—ZnO NPs administration induced TUNEL positive nuclei of Kupffer cells in the liver parenchyma. The present study shows that the newly synthesized Ag—ZnO NPs are active against planktonic and adherent microorganisms and could be exploited to develop novel antimicrobial strategies for the biotechnology and biomedical fields. Easy scalability of the developed chemical synthesis is a major advantage in producing large batches of Ag—ZnO NPs with reproducible properties.
Keywords
Chemically synthesized Ag—ZnO nanoparticles
Anionic polyelectrolytes
Medically relevant pathogens
Antimicrobial activity
Genotoxicity
Immunohistopathology

1 Introduction
Engineered nanomaterials (ENMs) based strategies received much attention due to their unique physico-chemical properties, such as small size and high surface-to-volume ratio, which enable intimate interactions with different surfaces, including cellular membranes (Meng et al., 2016; Morones et al., 2005). ENMs have a large economic impact in a wide range of fields, such as cosmetics (Jain et al., 2009), medicine (with dual function roles as diagnostic and active therapeutic agents for the treatment of various diseases) (Bostan et al., 2016; Chaloupka et al., 2010; Cristache et al., 2011; Furno et al., 2004; Ma et al., 2016; Oyarzun-Ampuero et al., 2015; Samuel et al., 2004; Sharma et al., 2015; Zheng et al., 2010), food industry (food additives, food preservation) (Mohammed Fayaz et al., 2009; Schluesener and Schluesener, 2013), textile industry (Rivero et al., 2015), water treatment (Li et al., 2008) etc. However, besides their important applications, there are serious concerns about their safety and environmental impact (Debia et al., 2016). A lot of current investigations are dealing with evaluating the risk associated with their introduction in the environment (Bruneau et al., 2016; Cupi et al., 2016; Durenkamp et al., 2016; Markus et al., 2016), and their effects on human health (Bostan et al., 2016; Fröhlich and Fröhlich, 2016).
Engineered metallic and metal oxide nanoparticles (ENPs) are considered to be advantageous compared to organic compounds due to their stability, chemical inertness, and potential biotechnological applications (Ma et al., 2016; Singh et al., 2015). Different inorganic NPs, such as silver (Ag), titania (TiO2) and zinc oxide (ZnO) have been used in the functionalization of fibers and fabrics achieving significantly improved products with new macroscopic properties (Rivero et al., 2015).
Silver has a long history as an antimicrobial agent, being used since at least 1000 BCE. Therefore, silver nanoparticles (Ag NPs) were intensively investigated for their potential antimicrobial activity (Morones et al., 2005; Das et al., 2015; Jeon et al., 2003; Kim et al., 2007; Lu et al., 2008; Panáček et al., 2006). The investigation of the antimicrobial mechanism of Ag NPs revealed that they adhere to cell membranes producing cavities. Inside the cell they effectively inhibit the protein activity, thus altering microbial cell function (Li et al., 2010). Also, the released Ag+ ions penetrate microbial cells, affect the protein and DNA synthesis, and generate reactive oxygen species (ROS), which are toxic for the microbial cell. The oxidative damage caused by the ROS generation is considered a key mechanism that, synergistically with the effect of Ag+ ions, contributes to the bacterial killing activities of Ag NPs (Shahverdi et al., 2007).
ZnO nanomaterials are highly attractive for a large spectrum of applications in many different areas, such as solar cells, sensors, piezoelectric devices, photodiode devices, sunscreens, antireflection coatings, and photocatalysis. ZnO based textiles exhibited excellent photocatalytic and antibacterial activities, as well as a promising sensing response (Hatamie et al., 2015). Previous studies also demonstrated a synergistic effect between zinc and silver on the antimicrobial activity of the Zn/Ag-Y zeolite materials (Ferreira et al., 2016). ZnO is known to be less toxic than metallic NPs, too. Therefore, it was expected that the coating of Ag NPs with a thin layer of ZnO would decrease the toxicity of Ag NPs. (Gondal et al., 2012; He et al., 2011) have shown the significant antifungal activity of ZnO against Botrytis cinerea, Penicillium expansum and Candida albicans. Zn NPs showed potent bactericidal activity against Escherichia coli and Vibrio cholerae (Salem et al., 2015).
Nanocomposites (NCs) may preserve the antibacterial activity of the metallic NPs while increasing the biocompatibility of the resultant composite structure. NCs with a metallic core and a ceramic shell nanostructure could protect the metallic NPs against agglomeration and leaching out in real operating medium, but also could retain the antimicrobial activity of the metallic NPs (Lu et al., 2008; Motshekga et al., 2013; Totu et al., 2018). The investigations revealed that the core–shell Ag@ZnO NCs obtained by the coating of biogenic Ag NPs with a thin layer of ZnO inhibited the growth of C. krusei at 250 μg/mL. Before applying the ceramic coating, the metallic Ag NPs were synthesized using Andrographis paniculata and Aloe vera. The possible antifungal mechanism of Ag@ZnO NCs suggested by the investigators is the ROS generation, which may degrade cellular compounds (Das et al., 2016). Oxidative stress has increasingly been demonstrated as playing a key role in the biological response induced by NPs (Delaval et al., 2017).
Although the cytotoxic effects of Ag NPs and ZnO NPs on different mammalian cells have been reported in many studies (mediated by the induction of oxidative stress, inflammatory responses, DNA damage, genotoxicity, chromosome aberration, cellular membrane damage, and apoptosis), no general consensus concerning the toxicity of inorganic NPs to human cells could be established due to the large variations in the applied methodology and experimental models (Debia et al., 2016; Cinteza et al., 2018; Gardner et al., 2014; Lopes et al., 2016; Mao et al., 2016; Ng et al., 2017; Song et al., 2014; Strużyński et al., 2014; Yin et al., 2013; Zhang et al., 2014).
The present study aimed to evaluate the efficacy of the chemically synthesized Ag—ZnO NPs on the planktonic growth of medically relevant pathogens, to determine their potential antibiofilm activity and to evaluate their toxicological features by using in vitro and in vivo assays.
2 Materials and methods
2.1 Materials
ZnO NPs powder (min. 99.5%, hexagonal wurtzite structure, average primary size of about 60 nm), silver nitrate (AgNO3, p.a., crystallized, min. 99.9%, Mw of 169.87 g/mol), poly(acrylic acid sodium salt), PAAS (C3H3NaO2, Mw of 5,100), poly(4-styrenesulfonic acid-co-maleic acid) sodium salt, PSSA-co-MA (C12H10Na2O7S with 4-styrenesulfonic acid:maleic acid mole ratio of 1:1, Mw of ∼ 20,000), sodium carboxymethyl cellulose, CMC (C28H30Na8O27, average Mw of 700,000, degree of substitution of 0.8–0.95), citric acid (C6H8O7·H2O, min. 99.5%, Mw of 210.14 g/mol). All chemicals were used without further purification. Bi-distilled water was utilized for preparing aqueous solutions of reducing and stabilization agents.
2.2 Synthesis of Ag—ZnO NPs
Ag—ZnO NPs were prepared from colloidal suspensions of 15% w/v ZnO NPs and 0.1% w/v Ag NPs. The deposition of Ag NPs on the surface of ZnO NPs was carried out by chemical synthesis in situ, by reduction of Ag+ ions from aqueous solutions of 25 mM AgNO3 containing ZnO NPs using a weak reducing agent that is also an electrostatic stabilizer of anionic polyelectrolyte (PE) type (PAAS, PSSA-co-MA and CMC) and then citric acid as a second reducing agent. The w/w ratio between PE and Ag was 3:1. Previously, ZnO NPs were dispersed in an aqueous solution of PE (0.8 wt%) by ultrasonication for 30 min. The formed suspension was heated to ∼95 °C and the AgNO3 aqueous solution was added dropwise under vigorously stirring. Then the reaction was continued until the formation of the first Ag NPs was visible by naked eye, when the color of the suspension changed from milky white to milky light brown. The cooled suspension was kept at 15 °C for 24 h to grow and age the formed Ag NPs. The remaining Ag+ ions were reduced at ∼95 °C by adding dropwise an aqueous solution of citric acid (2 wt%) under vigorously stirring using a molar ratio between citric acid and Ag of 8:1 and the stirring continued for 1 h. The suspensions of Ag—ZnO NPs were centrifuged for 5 min at 8500 rpm (8481 RCF) using a Hettich Universal 320 centrifuge with 6 place angle (35°) rotor with a radius of 105 mm. Then the NC powders were washed with bi-distilled water and ethyl alcohol and dried in air at 70 °C for 3 h for further characterization. The obtained Ag—ZnO NPs were coded as NC1, NC2, and NC3, where NC1 was synthesized using PAAS, NC2 with PSSA-co-MA, and NC3 with CMC, respectively.
2.3 Elemental composition analysis
The elemental composition of the synthesized Ag—ZnO NPs was determined on NC powder pellets by Wavelength Dispersive X-ray Fluorescence (WDXRF) spectrometry using a Bruker S8 Tiger WDXRF spectrometer. An amount of 8 g of each NC powder was pressed with 150 MPa in aluminum sample cups to obtain pressed pellets with 40 mm in diameter and 2 mm in thickness.
2.4 XRD analysis
The crystal structure determination, phase identification and structural parameters of the synthesized Ag—ZnO NPs and undoped ZnO NPs were performed by XRD analysis using a Bruker-AXS D8 Advance diffractometer with a Cu sealed tube X-ray source producing Cu Kα radiation at a wavelength of 1.5406 Å from a generator operating at 40 kV and 40 mA. The XRD data were collected at RT, in a 2theta (2θ) scan range from 10° to 100°, at a step of 0.04° and 1 s/step.
2.5 Surface morphology
The surface morphology of the synthesized Ag—ZnO NPs was investigated on NC powder samples by scanning electron microscopy (SEM) using a Carl Zeiss Auriga CrossBeam station working in vacuum at 5 kV DC acceleration voltage.
2.6 Optical properties of Ag—ZnO NPs
The diffuse reflectance absorption and reflection spectra of Ag—ZnO NPs in form of powder compacts with 20 mm in diameter and 1 mm in thickness were recorded at room temperature (RT) in UV–Vis spectral range by diffuse reflectance spectroscopy (DRS) using a Jasco V-570 spectrophotometer having a double beam system with a single monochromator. The measurements were performed in ambient conditions using a Jasco ISN-470 integrative sphere accessory having a barium sulfate (BaSO4) coated inside. The spectra were recorded in a wavelength range from 800 nm to 300 nm with a slow response for a data interval of 1 nm, a spectral bandwidth of 0.2 nm, and a scan speed of 100 nm/min. The baseline was previously measured with a Spectralon reference tile.
The direct optical band gap (Eg) was determined from the Tauc’s plot (αhν)2 versus photon energy (hν) by extrapolating the straight line region of the plotted curve to the photon energy axis, where α (cm−1) is the absorption coefficient.
The values of α (cm−1) were computed from the absorbance spectra (Abs(λ) (arb. units) versus wavelength λ (nm)) using the Eq. (1), where d (Å) is the sample thickness:
The values of hν (eV) were calculated using the Eq. (2), where λ (nm) is the wavelength:
2.7 FTIR spectrometry
The surface functional groups were analyzed by Fourier Transform Infrared (FTIR) spectrometry on KBr pellets in which NC powders of Ag—ZnO NPs or PE polymers (∼0.2% w/w) were dispersed. The FTIR spectra were recorded using a Jasco 4200 spectrometer by collecting 50 scans over a spectral range of 4000–350 cm−1 with a resolution of 4 cm−1.
2.8 Antimicrobial activity assay on planktonic cultures
The following microbial strains from the American Type Culture Collection (ATCC) were used in the study: Enterococcus faecalis ATCC 29212, Staphylococcus aureus ATCC 6538 (Gram-positive bacteria), Escherichia coli ATCC 8739 (Gram-negative bacteria), Pseudomonas aeruginosa ATCC 27853 (Gram-negative bacteria) and Candida albicans ATCC 10231 (fungal strain). All the tested strains were stored at −80 °C and subcultured twice on blood agar plates before experiments. A single colony of each type of microbial strain was inoculated in 10 mL of sterile Muller-Hinton broth (MHB) medium (Sigma-Aldrich), and incubated overnight at 37 °C with shaking. The resulted liquid cultures were diluted to reach a final density of 1.5 × 10⁸ CFU/mL, equivalent to the 0.5 McFarland nephelometric standard, ready to be used for the experiments described below.
For the qualitative assay of the antimicrobial activity, pressed pellets of NC powders of Ag—ZnO NPs with 8 mm in diameter and 1 mm in height were used. The Ag—ZnO NPs specimens were sterilized by UV exposure, in a laminar flow cabinet, for 30 min on each side. The values of the diameters of the growth inhibition zone (DGIZ) against the tested pathogenic strains in the presence of the Ag—ZnO NPs pellets were determined by an adapted disk diffusion method. The pressed pellets were deposited in Petri dishes with MHB medium (Sigma-Aldrich) previously seeded with standardized microbial inocula prepared from each microbial strain of 0.5 Mac Farland density. The Petri dishes were then incubated at 37 °C for 24 h, and the DGIZ values were measured with a ruler (Nuta et al., 2017; Stecoza et al., 2009).
After the qualitative screening, the broth serial two-fold microdilutions technique was used to determine the minimal inhibitory concentration (MIC) values. The sterile yeast peptone glucose (YPG) broth medium for yeasts and MHB medium for bacteria was added in sterile 96-well plates and binary dilutions of each tested suspension were performed in a final volume of 100 μL. After performing the binary dilutions, an amount of 10 μL of microbial suspension was added in each well. Positive (microbial culture) and negative (sterile broth) controls were used. The MIC values were established by the macroscopic analysis of the wells’ content at the lowest concentration at which the wells’ content remained clear, similar to the negative control, being confirmed by the spectrophotometric measurement of the optical density at 600 nm, using an ELISA reader.
2.9 Antibiofilm assay
The quantitative assay of the influence of the tested NPs on the microbial adherence and initial biofilm development on the inert substrate was determined by the microtiter plate method. In this purpose, the content of the 96-multiwell plastic plates used for the MIC assay were discarded, washed three times with tap water to remove the planktonic bacteria, while those adhered to the plastic substratum were fixed with cold methanol for 5 min, colored with 1% violet crystal for 15 min, washed again with tap water and resuspended in 33% acetic acid. The MHB was used as a negative control. The inhibitory activity of the tested NPs on the bacterial adherence and initial biofilm formation was assessed quantitatively, by measuring the absorbance of the colored suspension at 490 nm, the obtained values being proportional to the number of the adhered microbial cells (Telcian et al., 2017). The minimal biofilm inhibitory concentration (MBIC) was established as the lowest NPs concentration, which inhibited the bacterial biofilm formation, as revealed by the absorbance values lower than those of the positive control. All the antimicrobial experiments were performed in triplicate.
2.10 In vitro genotoxicity micronucleus (MN) test
MNvit was conducted in compliance with the recommendations of the Organisation for Economic Cooperation and Development (OECD), Test no. 487: In vitro mammalian cell micronucleus test. Human lymphocyte cultures were initiated. Peripheral blood was taken from a middle-aged, healthy female who volunteered for this study, signed an informed consent and had not been recently exposed to genotoxic agents (chemical substances, ionizing radiations, bacterial/viral infections). Peripheral blood was collected using heparin-based anticoagulant. About 0.5 mL of heparinized blood was transferred in a tube containing 10 mL PB-MAX (GIBCO) medium supplemented with phytohemagglutinin (mitotic agent), bovine serum albumin (BSA), amino acids and antibiotic. The culture was incubated at 37 °C, 5% CO2 for 24 h. The Ag—ZnO NPs were inoculated in the human lymphocytes culture at 24 h after the culture was initiated. They were previously sterilized by exposure to UV for 15 min. Three concentrations (1.25 mg/mL, 2.5 mg/mL, and 5 mg/mL) were tested for each type of Ag—ZnO NPs, respectively, NC1, NC2, and NC3. The tested concentrations were selected to cover the range of the MIC values obtained in the antimicrobial assays for the five strains. A sample (free of NPs) was used as control. Each sample was tested in duplicate. The cultures were sacrificed 72 h after Ag—ZnO NPs were added, a duration which is considered sufficient for the cells to undergo several cell division rounds so that potential DNA damage in the form of micronuclei in interphase cells could be identified. The culture was developed without adding cytochalasin B (cytoB – actin polymerization inhibitor). In the next steps, the cultures were sacrificed by hypotonization using potassium citrate solution, and cells were fixed in 3:1 methanol/acetic acid solution. Microscope slides were prepared and stained using Giemsa solutions. An Olympus BX40 microscope was used to analyze the slides.
2.11 Animal studies
2.11.1 In vivo micronucleus test
MN in vivo assay was performed in compliance with the recommendations of the OECD, Test no. 474: Mammalian erythrocyte micronucleus test. The rodent Mus musculus BALB/c was chosen as a mammalian model organism. Adult mice (22–25 g weight) were kept in constant environmental conditions (12:12 light:dark cycle, 22 ± 3 °C temperature, 30% humidity). The animals were fed with standard granules and had access to drinking water ad libitum.
The animals were exposed to the tested substances by intraperitoneal injection of 20 mL/kg body weight (from the stock solution of 5 mg/mL in Phosphate-buffered Saline – PBS) in three shots at 72 h intervals. The experiment included two groups of mice: a group of tested mice (n = 10 for each sample) and a control group (n = 10), fed with standard granules, kept in the same environmental conditions, and injected as the tested group, but with PBS only.
To collect the biological samples, the animals were sacrificed 24 h after the third dose, in compliance with the European Council (86/609/CEE/24.11.2004) recommendations regarding to the protection of animals used for experimental and scientific purposes.
2.11.2 Giemsa staining of the bone marrow cells
The cells from the bone marrow were collected from the femur and prepared in compliance with standard methods. The spinal canal was washed with 0.05% potassium citrate solution. Hypotony was achieved using 0.05 M potassium citrate for 40 min and then centrifuged for 10 min at 1000 rpm. Samples were fixed in 3:1 methanol: acetic acid overnight. Slides were stained with Giemsa solution, washed and then analyzed using an Olympus BX40 microscope.
2.11.3 Histopathology
Liver, kidney and small intestine biopsies were fixed in 10% paraformaldehyde and embedded in paraffin. Paraffin sections of 5 µm thickness were stained with hematoxylin-eosin (H&E), examined using an Olympus BX43 microscope, and photographed using a digital camera (Olympus XC30).
2.11.4 Immunohistochemistry
The sections from the representative paraffin-embedded liver, kidney, and small intestine samples were deparaffinized, rehydrated, and incubated overnight at 4 °C, with the primary antibody against tumor necrosis factor alpha (TNF-α) (1:100 dilution; Santa Cruz). The detection was performed using a polymer detection system (Novolink max Polymer detection system, Novocastra Leica Biosystems) and diaminobenzidine (DAB), as a chromogenic substrate. H&E staining was applied before dehydration and mounting. Negative controls included the substitution of the primary antibody with normal mouse serum. A section of the model group was used as the positive control. The images were acquired by light microscopy, using an Olympus BX43 microscope.
2.11.5 In situ detection of DNA fragmentation by TUNEL assay
TdT-FragEL DNA Fragmentation Detection Kit (Calbiochem, EMD Chemicals Inc., San Diego, USA) was used to assess in situ the nuclear DNA fragmentation on liver, kidney and small intestine tissues, by terminal deoxynucleotidyl transferase (TdT), according to the manufacturer’s protocol. The incorporation of biotinylated nucleotides allows chromosomal DNA fragmentation to be visualized by binding streptavidin horseradishperoxidase (HRP) followed by reaction with DAB, which generates an insoluble dark brown substrate at the site of DNA fragmentation. The nuclear counterstaining was performed with methyl green solution included in the kit. The sections were examined by light microscopy, using an Olympus BX43 microscope.
3 Results
3.1 Elemental composition analysis
In Table 1 are summarized the results obtained by WDXRF spectrometry for the pressed pellets of Ag—ZnO NPs, where the most intense spectral line was Zn KA1-HR-Tr for ZnO and Ag KA1-HR-Tr for Ag, and the analyzed layer had a value of 72 ppm for ZnO and 128 ppm for Ag.
Ag—ZnO NPs type
Concentration (wt%)
Net intensity (kcps)
Stat. error (%)
Lower limit of detection (ppm)
ZnO
Ag
ZnO
Ag
ZnO
Ag
ZnO
Ag
NC1
99.59
0.41
5157
0.894
0.079
6.27
89.6
140.0
NC2
99.54
0.46
4661
0.908
0.084
6.25
82.3
149.9
NC3
99.31
0.69
4704
1.302
0.083
5.20
83.7
173.5
The elemental composition analysis of the developed Ag—ZnO NPs revealed a content of Ag ranging from 0.41 wt% to 0.69 wt% that increased in the following order: NC1 < NC2 < NC3. The balance was composed of ZnO (Table 1). Other elements were not detected by the WDXRF spectrometry, revealing the high purity of the synthesized Ag—ZnO NPs.
3.2 XRD analysis
The XRD patterns of the synthesized Ag—ZnO NPs and undoped ZnO NPs (Fig. 1) revealed strong and narrow diffraction peaks indicating the polycrystalline structure of the nanopowders.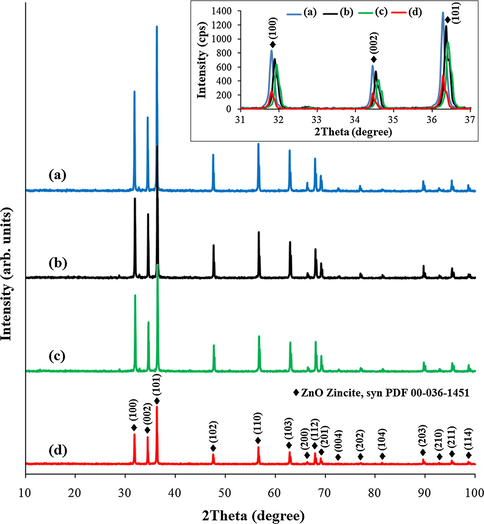
XRD spectra of Ag—ZnO NPs of (a) NC1, (b) NC2, and (c) NC3 type, and of (d) undoped ZnO NPs recorded between 10° and 100°. The inset displays the XRD spectra between 31° and 37° showing the principal lattice planes of the investigated nanopowders.
For all the Ag—ZnO and ZnO nanopowders, only the characteristic diffraction peaks of ZnO were identified by the PDF 00-036-1451 of the International Centre for Diffraction Data (ICDD) database. This reference is attributed to ZnO zincite, syn with a hexagonal wurtzite crystal structure with space group P63mc (186), cell parameters: a = 3.2498 Å, and c = 5.2066 Å, and cell axial ratio, c/a = 1.6021. As was expected, the diffraction peaks corresponding to Ag were not detected. This is due to the low content of Ag (<0.69 wt%) from the Ag—ZnO NPs that is lower than the limit of detection (2%) of crystalline phases using a Bruker-AXS D8 Advance diffractometer. No diffraction peaks from the impurity phase were observed, suggesting the high purity of the investigated nanopowders.
All the Ag—ZnO and ZnO nanopowders (Fig. 1) are found to have (1 0 1) lattice plane as the preferred orientation direction, followed by (1 0 0) and (0 0 2) lattice planes.
The interplanar distance (d) between (hkl) planes determined by the Miller indices (h, k, l) was calculated from the Bragg’s law (Eq. (3)) (Bindu and Thomas, 2014; Lungu et al., 2018), where n is the order of diffraction (n = 1), λ is the X-ray wavelength employed in the XRD measurements (λ = 1.5406 Å), and θ is the Bragg diffraction angle:
The lattice parameters (a and c) were determined for the (1 0 1) plane in the case of a, respectively for the (0 0 2) plane in the case of c, using the Eqs. (4) and (5), and converting θ in radians (Bindu and Thomas, 2014):
The mean crystallite size (Dmean) was computed as an average value of the crystallite size (D) determined from the Debye Scherrer's formula (Eq. (6)) for the principal crystal planes, namely (1 0 1), (1 0 0) and (0 0 2) planes, by considering β equal with the full width at half-maximum (FWHM) (Acharya et al., 2014; Lungu et al., 2018):
The cell volume (V) was computed for the hexagonal crystal structure, according to the Eq. (7) (Mote et al., 2013):
The mean dislocation density (δmean) was determined from the Eq. (8) (Bindu and Thomas, 2014) by considering Dmean:
The Zn—O bond length (L) was calculated using the Eq. (9), where u is the positional parameter in the hexagonal crystal structure, being determined from the Eq. (10) (Bindu and Thomas, 2014):
The XRD results are summarized in Table 1, and Table 2, respectively.
Sample
2θ (°)
Intensity (cps)
d (Å)
FWHM (°)
Dmean (nm)
Miller indices
h
k
l
Ag—ZnO NC1
31.805
837
2.81130
0.136
61.95
1
0
0
34.441
623
2.60193
0.128
0
0
2
36.276
1379
2.47441
0.139
1
0
1
Ag—ZnO NC2
31.882
716
2.80469
0.140
60.47
1
0
0
34.524
538
2.59586
0.127
0
0
2
36.359
1184
2.46895
0.147
1
0
1
Ag—ZnO NC3
31.916
634
2.80178
0.140
60.01
1
0
0
34.559
415
2.59331
0.129
0
0
2
36.411
943
2.46555
0.148
1
0
1
ZnO NPs
31.798
252
2.81191
0.143
71.01
1
0
0
34.442
228
2.60186
0.090
0
0
2
36.279
481
2.47421
0.133
1
0
1
By comparing the XRD spectra of Ag—ZnO NPs with the XRD spectrum of ZnO NPs, it can be noticed small shifts in the positions of the peaks, in general towards higher 2theta values, along with an increase in intensities, and small changes in interplanar distance and FWHM. Moreover, the mean crystallite size of Ag—ZnO NPs decreased and FWHM was broadened with the increase of the content of Ag (Table 2). These changes can be explained by the formation of Ag NPs on the surface of ZnO NPs rather than the incorporation of the Ag atoms into the lattice of ZnO matrix (or only to a certain extent) that caused some crystal lattice defects or distortions on the interface between ZnO NPs and Ag NPs (Parvin et al., 2012; Acharya et al., 2014; Lungu et al., 2016). All the Ag—ZnO NPs and ZnO NPs have lower lattice parameters than the ZnO reference because of the probable appearance of point or extended defects. The presence of defects was revealed by the mean dislocation density values that increased with the increase of Ag content (Table 3). It is known that the dislocation density is an indicator of the number of defects within a sample (Bindu and Thomas, 2014).
Sample
a (Å)
c (Å)
c/a
V (Å3)
δmean (nm−2)
L (Å)
u
Ag—ZnO NC1
3.2462
5.2039
1.6031
47.49
0.261 × 10⁻³
1.9755
0.380
Ag—ZnO NC2
3.2386
5.1917
1.6031
47.16
0.273 × 10⁻³
1.9709
0.380
Ag—ZnO NC3
3.2352
5.1866
1.6032
47.01
0.278 × 10⁻³
1.9688
0.380
ZnO NPs
3.2469
5.2037
1.6027
47.51
0.198 × 10⁻³
1.9759
0.380
ZnO reference
3.2498
5.2066
1.6021
47.62
–
1.9776
0.380
All the investigated nanopowders exhibited the cell axial ratio (c/a) value of about 1.603, which is almost equal with the c/a value of the ZnO reference (1.602). This result suggests a homogeneous dispersion of Ag NPs within the matrix of ZnO NPs (Parvin et al., 2012; Acharya et al., 2014; Lungu et al., 2016).
It was found that the cell volume decreased with the increase of Ag content in all the synthesized Ag—ZnO NPs, as well as with the decrease of the lattice parameters a and c. The small decrease in the Zn—O bond length from the Ag—ZnO NPs could be the effect of the electrostatic repulsion between Ag+ ions and Zn2+ ions (Acharya et al., 2014; Lungu et al., 2016). However, the results of the XRD analysis confirmed that the Ag NPs deposition on the surface of ZnO NPs did not damage the hexagonal wurtzite crystal structure of ZnO NPs, as other literature reports agreed (Acharya et al., 2014; Lungu et al., 2016; Kulyk et al., 2009).
3.3 Surface morphology
The SEM micrographs of the synthesized Ag—ZnO NPs are depicted in Fig. 2. In all the cases, polydisperse ZnO NPs with regular hexagonal prism shape as majority crystalline phase can be seen, in agreement with the XRD results. The size of ZnO NPs varies in a broad range having the side length of the hexagonal base of mainly up to 100 nm and the height of the hexagonal prism ranging from 50 nm to 600 nm. The tendency for agglomeration of all NC powders along with a non-homogeneous distribution of Ag NPs of spherical shape was observed. However, Ag NPs deposited randomly on the surface of ZnO NPs did not affect the hexagonal wurtzite structure of ZnO NPs, as the XRD analysis disclosed. This remark agrees well with the observations revealed in another study performed by us using a different approach for chemically and mechanically synthesized Ag—ZnO NPs (Lungu et al., 2016) and with other literature studies (Choi et al., 2015; Mahanti and Basak, 2012). A higher Ag NPs content with an average diameter of about 25–30 nm is noticed for the NC3 sample, while the NC1 and NC2 samples show a slightly lower size of Ag NPs (up to 10–20 nm). This result is consistent with the WDXRF results (Table 1).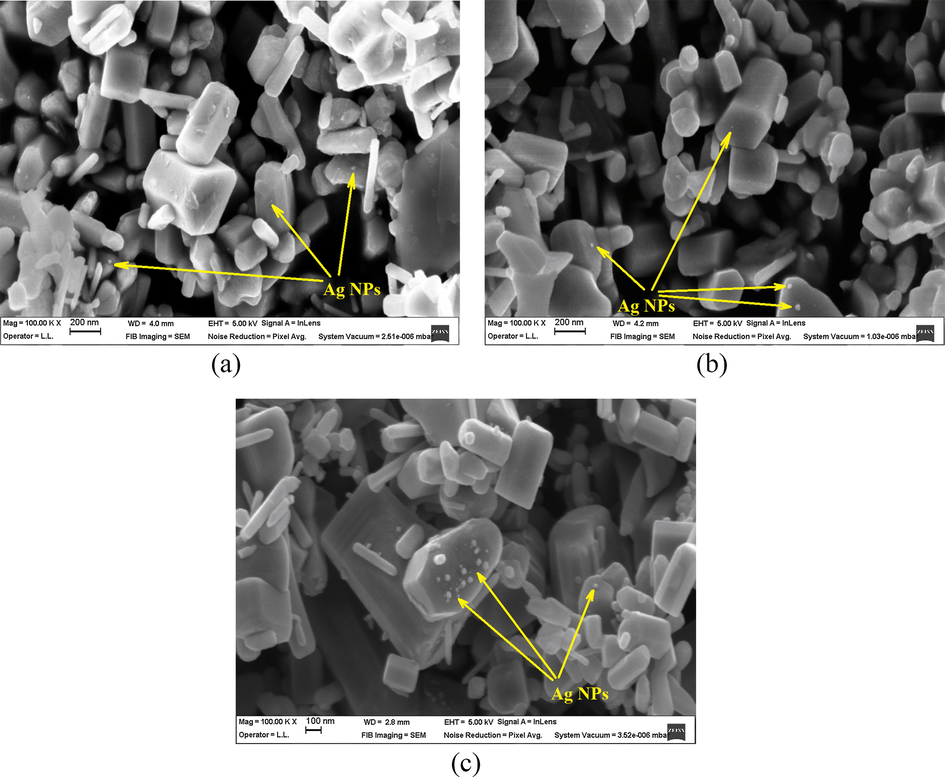
SEM micrographs of Ag—ZnO NPs of (a) NC1, (b) NC2, and (c) NC3 type.
3.4 Optical properties
The UV–Vis DRS absorption and reflection spectra of the synthesized Ag—ZnO NPs in form of powder compacts are displayed in Fig. 3 and Fig. 4, respectively.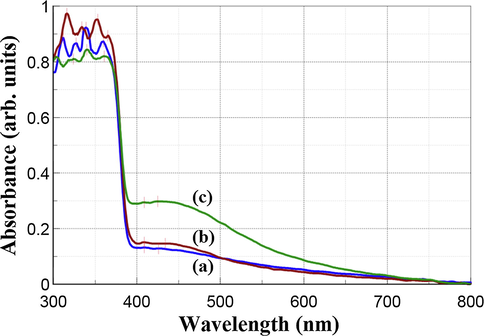
UV–Vis DRS absorption spectra of Ag—ZnO NPs of (a) NC1, (b) NC2, and (c) NC3 type.
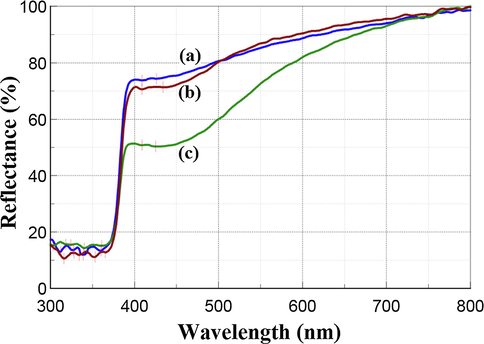
UV–Vis DRS reflection spectra of Ag—ZnO NPs of (a) NC1, (b) NC2, and (c) NC3 type.
The optical behavior of the NC1 and NC2 samples is similar, being revealed by small differences in their DRS absorption and reflection spectra. The NC2 sample showed the lowest absorption (Fig. 3), and accordingly, the highest reflectance (Fig. 4) in the visible spectral range from 500 nm to 800 nm, while between 300 nm and 500 nm was vice-versa. The NC3 sample exhibited the lowest reflectance in the visible light region.
The strong optical absorption peaks in the UV light region ranging 303–365 nm are assigned to polydispersed ZnO NPs. The observed bands are blue shifted comparatively with the conventional band for pure bulk ZnO that is usually reported in the literature around 373 nm (Lungu et al., 2016). This occurred due to the quantum confinement effects induced by the nanocrystalline size of ZnO NPs (Adhikari et al., 2015). The peaks from the visible light region ranging from 409 nm to 434 nm are characteristic of the surface plasmon resonance (SPR) of Ag NPs since SPR can be adjusted to any wavelength in the visible light region (Evanoff and Chumanov, 2005). Moreover, the number of SPS peaks decreases as the symmetry of Ag NPs increases (Noginov et al., 2007). Asymmetrical SPR peaks of Ag NPs can be noticed in Figs. 3 and 4 for all the synthesized Ag—ZnO NPs. The existence of two SPR peaks of Ag NPs at 409 nm and 426 nm for NC1, 409 nm and 434 nm for NC2, 409 nm and 425 nm for NC3 suggest the formation of polydisperse Ag NPs distributed into the host matrix of ZnO. The Mie’s theory predicted that spherical or quasi-spherical shape of nanocrystals can be assigned mainly to a single SPR peak having a symmetric shape due to isolated spheres of Ag NPs (Amendola et al., 2010; Mie, 1908). The spherical shape of Ag NPs from the synthesized Ag—ZnO NPs was revealed in the SEM micrographs (Fig. 2).
It is well known that bulk ZnO white powder does not absorb visible light but ZnO doped or decorated with Ag NPs exhibits improved absorbance in visible light due to the SPR peaks of Ag NPs (Lungu et al., 2016; Choi et al., 2015; Mahanti and Basak, 2012; Simović et al., 2017). The color of Ag—ZnO NPs in the form of NC powders can vary from light brown to dark brown due to the different content of Ag NPs getting darker with higher Ag NPs content. All the three powders developed in our study exhibited light brown color due to the Ag NPs content of 0.41–0.69 wt% (Table 1). In the SPR peaks found in the recorded DRS spectra, the absorption intensity increased (Fig. 3), respectively the reflection intensity decreased (Fig. 4) with Ag NPs content increase. Similar results were found in other literature studies for Ag—ZnO NPs with SPR of spherical Ag NPs included mostly between 400 nm and 600 nm (Lungu et al., 2016; Simović et al., 2017; Pathak et al., 2018).
The direct optical band gap (Eg) of the synthesized Ag—ZnO NPs was determined from the Tauc’s plot (αhν)2 versus (hν) by extrapolating the straight line region of the plotted curve to (hν) axis (Fig. 5).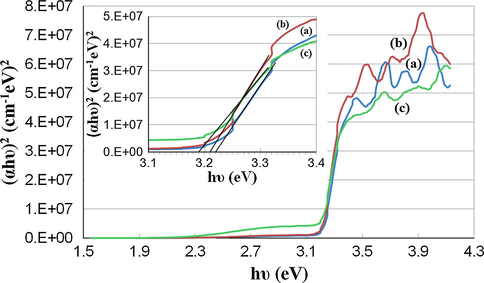
Plots of (αhν)2 versus photon energy (hν) showing the direct optical band gap (Eg) for Ag—ZnO NPs of (a) NC1, (b) NC2, and (c) NC3 type.
The obtained Eg values were 3.22 eV for NC1, 3.21 eV for NC2, and 3.19 eV for NC3. A decrease of the optical band gap value with an increase of Ag NPs content was noticed for the synthesized Ag—ZnO NPs. This can occur mainly when Ag+ ions are situated in the neighboring of the grain boundaries of ZnO since Ag+ ions have the ionic radius of 0.122 nm that is greater than the one of Zn2+ ions (0.074 nm) (Kulyk et al., 2009). The obtained Eg values are consistent with other literature results reported for Ag—ZnO NPs with various Ag content (Simović et al., 2017; Pathak et al., 2018; Hosseini et al., 2015; Jayabharathi et al., 2016). All the Eg values obtained in our study for the Ag—ZnO NPs are lower than the wide direct band gap at RT of pure bulk ZnO semiconductor that is usually reported at 3.37 eV (Lungu et al., 2016; Simović et al., 2017; Hosseini et al., 2015).
3.5 FTIR spectrometry
The FTIR spectra recorded in the frequency range of 4000–350 cm−1 (Fig. 6) indicate the presence of surface functional groups in the case of Ag—ZnO NPs, but not for the PE polymers. The significant functional groups/assignment of Ag—ZnO NPs and PE polymers determined by FTIR spectrometry are presented in Table 4.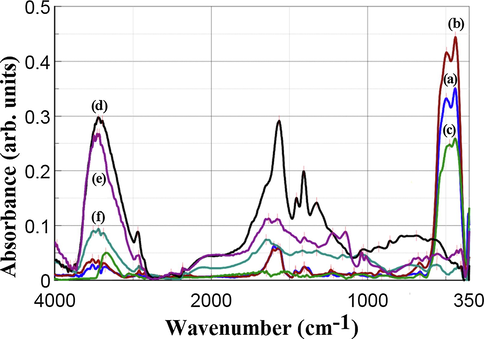
FTIR spectra of Ag—ZnO NPs of (a) NC1, (b) NC2, and (c) NC3 type, and PE polymers of (d) PAAS, (e) PSSA-co-MA, and (f) CMC type.
Functional group/assignment
Wavenumber (cm−1)/material
References
Ag—ZnO NPs type
PE polymers type
NC1
NC2
NC3
PAAS
PSSA-co-MA
CMC
Stretching of O—H
3521, 3444, 3357
3522, 3445, 3380
3351
3444, 3392
3501, 3460, 3380
3510, 3445, 3380
[66,67]
Asymmetric C—H stretching of CH2 group
2927
2924
2905
2940
2928
2925
[66,67,68]
Symmetric C—H stretching of CH2 group
2856
2853
2818
–
2858
2857
[66,67,69]
Asymmetric stretching of (COO−)
1600, 1562
1604, 1572
1647, 1535
1566
1577
1650, 1631
[69]
Symmetric stretching of (COO−)
1462, 1409
1461, 1404
1389
1409
1405
1417
[69]
Stretching of Zn—O
497, 440
495, 438
475, 440
–
–
–
[53,67,70]
The FTIR spectra of NC1, NC2, and NC3 samples revealed broad absorption peaks located at about 3600–3200 cm−1. These absorption peaks correspond to the stretching mode of the O—H group suggesting the presence of a small amount of surface adsorbed water molecules or hydroxyl (—OH) group (Rangelova et al., 2014; Saoud et al., 2015). All the PE polymers exhibited more prominently absorption maxima in this region than Ag—ZnO NPs samples due to their hydrophilic nature.
The absorption peaks noticed in the IR spectra of Ag—ZnO NPs and PE polymers at 2940–2905 cm−1 and 2858–2818 cm−1 were assigned to the asymmetric and symmetric C—H stretching vibrations of methylene (—CH2) groups of the PE polymers and citric acid that is a hydrocarboxylic acid (Rangelova et al., 2014; Saoud et al., 2015; Matai et al., 2014).
The absorption peaks observed in the range of 1650–1540 cm−1 and 1450–1360 cm−1 were ascribed to the asymmetric and symmetric stretching of carboxylate anion (COO−) (Grabowska and Holtzer, 2009). The FTIR spectra of NC1 and NC2 had a similar aspect due to the functional groups present in the samples at close absorption bands.
In the frequency range of 1350–550 cm−1, some small absorption peaks were observed that can be attributed to various residual groups (Saoud et al., 2015). The presence of the typical bands for carboxylic acid salts proved the capping of the synthesized Ag—ZnO NPs with the employed anionic PE polymers.
The dominant absorption peaks of all the synthesized Ag—ZnO NPs located in the frequency range of 530–400 cm−1 were assigned to the characteristic optical stretching modes of the Zn—O bond. There were found two absorption peaks, one at 497–475 cm−1, and the second one at 440–438 cm−1 due to the hexagonal prism shape of ZnO NPs used as a matrix for Ag NPs deposition. Two absorption peaks between 510 cm−1 and 420 cm−1 were revealed also in other literature studies for ZnO nanorods (Anžlovar et al., 2012). The Zn—O vibrational mode was reduced for NC3, as compared to NC1 and NC2, due to the lower ZnO NPs content, respectively higher Ag NPs content.
Vibrations related to Ag band were not detected in the IR spectra of the synthesized Ag—ZnO NPs, suggesting the lack of the chemical bonding between Ag NPs and ZnO NPs, as also suggested by SEM analysis. These findings are in line with other literature data reported for chemically deposited Ag NPs on ZnO NPs surface (Lungu et al., 2016; Saoud et al., 2015; Matai et al., 2014; Georgekutty et al., 2008).
3.6 Antimicrobial activity of the tested Ag—ZnO NPs against planktonic bacterial and fungal cells
3.6.1 DGIZ values (mm)
The DGIZ and standard deviation (SD) values (mm) against the tested pathogenic strains in the presence of Ag—ZnO NPs in form of pressed pellets with 8 mm in diameter and 1 mm in height are presented in Table 5.
Ag—ZnO NPs type
Average DGIZ ± SD (mm) against the tested pathogenic strains
P. aeruginosa
E. coli
S. aureus
E. faecalis
C. albicans
ATCC
ATCC
ATCC
ATCC
ATCC
27853
8739
6538
29212
10231
NC1
24 ± 0.02
22 ± 0.02
22 ± 0.02
16 ± 0.02
15 ± 0.02
NC2
25 ± 0.03
22 ± 0.02
23 ± 0.02
13 ± 0.01
26 ± 0.03
NC3
23 ± 0.02
24 ± 0.02
21 ± 0.02
15 ± 0.02
13 ± 0.01
The average of the DGIZ ± SD values was 19.8 ± 0.02 mm for NC1, 21.8 ± 0.02 mm for NC2 and 19.2 ± 0.02 mm for NC3. Moreover, NC2 exhibited the highest DGIZ ± SD values of 26 ± 0.3 mm against C. albicans fungal strain, respectively of 25 ± 0.03 mm against P. aeruginosa and 23 ± 0.02 mm against S. aureus bacterial strain. From the qualitative analysis of the antimicrobial activity defined by the obtained DGIZ values, it was found that P. aeruginosa, E. coli, and S. aureus bacterial strains proved to be more sensitive to the tested Ag—ZnO NPs than E. faecalis bacterial strain and C. albicans fungal strain.
3.6.2 Minimum inhibitory concentration (MIC)
The results of the MIC assay of the newly synthesized Ag—ZnO NPs are presented in Table 6. Regarding the MIC assay results, our data showed that the newly synthesized Ag—ZnO NPs exhibited a moderate inhibitory effect against the microbial growth of all the tested strains, with MIC values ranging from 1.25 mg/mL to 5 mg/mL. C. albicans ATCC 10231 was the most sensitive to the tested Ag—ZnO NPs with average MIC ± SD values of 3.125 ± 2.652 mg/mL for NC1, and 1.875 ± 0.884 mg/mL for NC2 and NC3, followed by P. aeruginosa ATCC 27853 and E. coli ATCC 8739 bacterial strains with MIC values of 2.5 mg/mL for all the tested Ag—ZnO NPs.
Ag—ZnO NPs type
Average MIC ± SD (mg/mL) against the tested pathogenic strains
P. aeruginosa
E. coli
S. aureus
E. faecalis
C. albicans
ATCC
ATCC
ATCC
ATCC
ATCC
27853
8739
6538
29212
10231
NC1
2.500 ± 0.000
2.500 ± 0.000
2.500 ± 0.000
3.750 ± 1.768
3.125 ± 2.652
NC2
2.500 ± 0.000
2.500 ± 0.000
5.000 ± 0.000
5.000 ± 0.000
1.875 ± 0.884
NC3
2.500 ± 0.000
2.500 ± 0.000
5.000 ± 0.000
5.000 ± 0.000
1.875 ± 0.884
3.7 Antibiofilm activity of the tested Ag—ZnO NPs against bacterial and fungal biofilms developed on the inert substratum
The results of the antibiofilm activity of the newly synthesized Ag—ZnO NPs are presented in Table 7. The results showed that the Ag—ZnO NPs exhibited a good inhibitory activity of bacterial adherence to the plastic substratum of the 96-well plate. The inhibition of initial biofilm development was quantified by establishing the MBIC values, ranging from 1.25 mg/mL to 10 mg/mL. The biofilms formed by P. aeruginosa ATCC 27853, S. aureus ATCC 6538, and C. albicans ATCC 10231 were the most sensitive to NC1 and NC2, the lowest average MBIC ± SD value being 1.875 ± 0.884 mg/mL (Table 7).
Ag—ZnO NPs type
Average MBIC ± SD (mg/mL) against the tested pathogenic strains
P. aeruginosa
E. coli
S. aureus
E. faecalis
C. albicans
ATCC
ATCC
ATCC
ATCC
ATCC
27853
8739
6538
29212
10231
NC1
2.500 ± 0.000
3.750 ± 1.768
1.875 ± 0.884
7.500 ± 3.536
1.875 ± 0.884
NC2
1.875 ± 0.884
5.000 ± 0.000
2.500 ± 0.000
5.000 ± 0.000
1.875 ± 0.884
NC3
2.500 ± 0.000
3.750 ± 1.768
3.750 ± 1.768
5.000 ± 0.000
2.500 ± 0.000
3.8 Genotoxicity of the tested Ag—ZnO NPs in the in vitro MNvit analysis
For each NC type of Ag—ZnO NPs, three NP concentrations were used: 1.5 mg/mL, 2.5 mg/mL, and 5 mg/mL.
3.8.1 Cell proliferation analysis
As the cultures were developed without cytoB, it was necessary to measure the Relative Increase in Cell Count (RICC) index to demonstrate the fact that the cells in the culture had undergone cell division. Otherwise false negative responses could be recorded. According to the RICC index, cytotoxicity was calculated for each concentration. For the concentrations of 2.5 mg/mL and 5 mg/mL, the maximum permissible concentration for a correct assessment, without false positive results, was exceeded (Table 8). For over 60% cytotoxicity MN emerged as a secondary effect of cytotoxicity, so MN incidence could not be assessed as a result of the substance genotoxic capacity.
Ag—ZnO NPs type
Ag—ZnO NPs concentration in culture medium (%)
1.5 mg/mL
2.5 mg/mL
5 mg/mL
NC1
42.4 ± 0.2
59.9 ± 0.9
72.3 ± 2.1
NC2
49.0 ± 0.7
62.2 ± 1.2
74.9 ± 2.6
NC3
50.1 ± 0.1
61.4 ± 0.5
68.1 ± 0.9
3.8.2 Micronucleus frequency
The concentration of 5 mg/mL was too high to allow for assessing the MN incidence, as the genetic material was seriously damaged – pulverized nuclei/chromosomes, atypical and deformed nuclei with numerous acentric fragments, some of them linked by chromatin bridges. This could be explained by the fact that at the highest tested concentration, the NPs precipitated forming aggregates and directly binding to DNA, synergistically resulted in changing drastically the quality and integrity of DNA.
In the case of the concentration of 2.5 mg/mL, regardless of NC type, the MN incidence analysis indicated a high degree of genotoxicity and the presence of gross lesions in the genetic material. The presence of endomitosis, as well as of “double minutes” formations, markers that usually appear as a result of a high degree of toxicity of the exogenous factors (especially characteristic to ionizing radiation), demonstrates that this concentration is too high to allow for a correct assessment of genotoxicity.
The Ag—ZnO NPs concentration of 1.5 mg/mL in the culture medium resulted in a relatively high incidence of MN compared to the negative control sample. However, this concentration favors the assessment of the genotoxic capacity (Table 9). Due to the NPs physico-chemical properties, they interact with the genetic material, especially during the cell division period when the nucleus is devoid of the cell membrane, thus disturbing the cell cycle by blocking cell division. Compared to the control sample, low cell proliferation was found. The analysis of microscope slides revealed that the Ag—ZnO NPs are directly binding to DNA, inducing the emergence of micronuclei, as well as of other types of chromosomal aberrations, atypical nuclei included.
Ag—ZnO NPs type
Ag—ZnO NPs concentration in culture medium (‰)
1.5 mg/mL
2.5 mg/mL
5 mg/mL
NC1
7.5 ± 0.1
21.8 ± 0.9
–
NC2
8.8 ± 0.4
30.9 ± 0.6
–
NC3
7.8 ± 1.3
18.3 ± 2.1
–
Negative control
5.2 ± 0.6
3.9 In vivo studies results
3.9.1 In vivo micronucleus test
The in vivo micronucleus test revealed a similar MN frequency among the tested animal batches, with only a slightly increased MN frequency in animals treated with NC1 and NC2 (Fig. 7).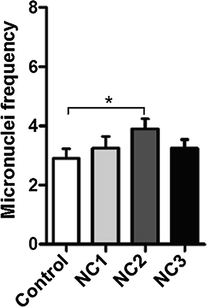
Unpaired t-test of micronuclei frequency in the four groups of mice.*p < 0.05 (p value = 0.0495).
3.9.2 Histopathology analysis
Ag—ZnO NPs treated mice exhibited non-significant structural changes of the hepatic parenchyma, renal cortex, and intestinal mucosa, compared to the control (Fig. 8). However, sinusoidal dilatations and Kupffer cell hyperplasia were seen in the liver of mice injected with the three NC samples. Also, mild vascular congestions of renal glomeruli were noticed (Fig. 8).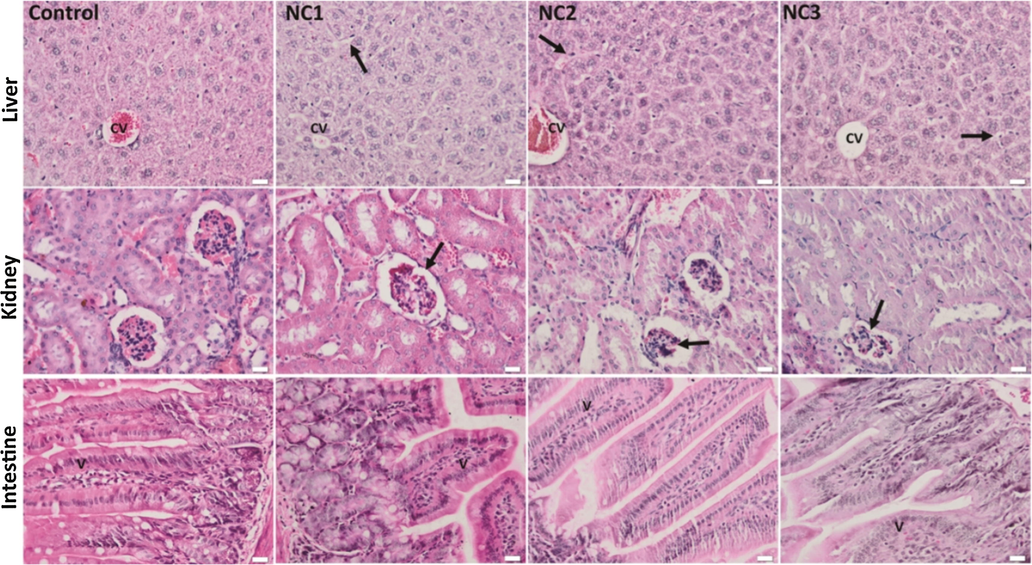
The histological aspect of the liver, kidney, and intestinal mucosa of the experimental groups. H&E staining; Liver: CV - central vein; arrow - sinusoids with hyperplastic Kupffer cell; Kidney: arrow - mild congestion of renal glomeruli; Intestine: V - intestinal villi, x 50, scale bar: 25 μm.
3.9.3 Immunohistochemical analysis
The Ag—ZnO NPs administration induced minimal inflammatory reactions, accompanied by the TNF-α immunopositivity of the liver parenchyma, renal tubules and connective tissue core of the intestinal villi (Fig. 9) compared to the control.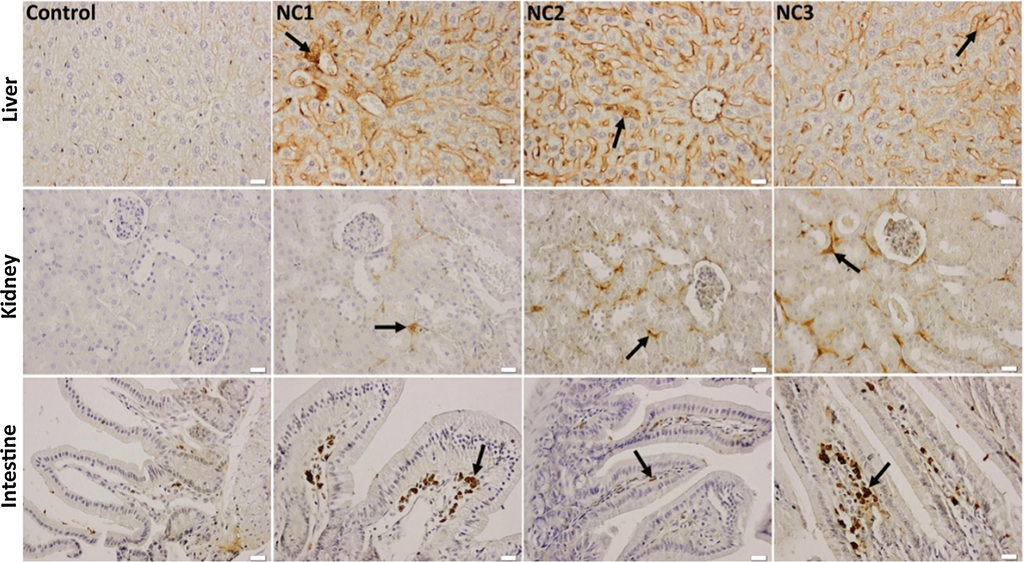
Effect of Ag—ZnO NPs on the immunohistochemical expression and specific distribution of TNF-α in the liver, kidney, and intestinal mucosa. Arrow - immunopositivity of TNF-α in hepatic parenchyma, renal cortex, and intestinal villi, x 50, scale bar: 25 μm.
3.9.4 Analysis of DNA fragmentation
The apoptotic DNA fragmentation was evaluated by light microscopy using the TUNEL assay. The Ag—ZnO NPs administration induced TUNEL positive nuclei of Kupffer cells in the liver parenchyma, and no reaction to the renal and intestinal cells was noticed (Fig. 10).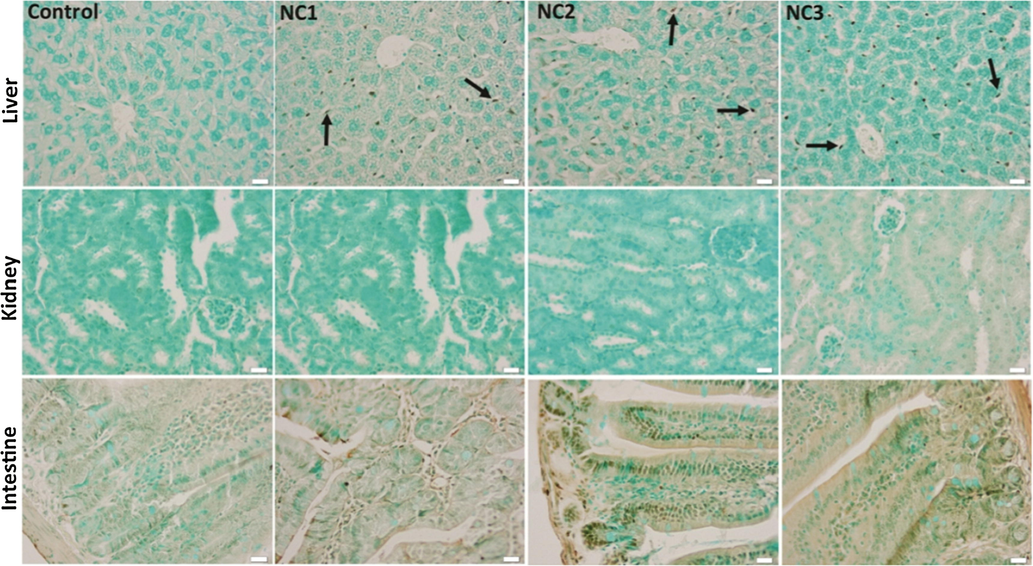
TUNEL staining of the liver, kidney, and intestine tissues of the experimental groups. Arrow - TUNEL positive Kupffer cells nuclei, x 50, scale bar: 25 μm.
4 Discussion
Antibiotic resistance, amplified by the ability of bacterial and fungal cells to develop biofilm associated infections represents one of the most important 20 public health problems at a global level, urging for the discovery of novel and efficient antimicrobial strategies to control them (de Kraker et al., 2016). Nanotechnology offers enormous potential in medicine including the use of ENPs as biocides. Many of these ENPs are composed of heavy metals or metal oxides such as silver, gold, zinc, titanium dioxide, and zinc oxide. Silver-based hybrid nanomaterials are gaining interest as potential alternatives for conventional antimicrobial agents. Their microbial selectivity, stability, ease of production and low cost make them attractive alternatives to current antimicrobial strategies.
Ag NPs are widely used in food packaging materials and also being proposed for use in diverse healthcare applications including but not limited to wound dressings, bandages, ointments, lotions, water purifications and medical devices (Li et al., 2006; Siqueira et al., 2014; Thomas et al., 2007; Ulubayram et al., 2015), as well as protective agents for patients with HIV (Graves et al., 2015; Shameli et al., 2012). Antimicrobial activity of Ag NPs has been proven efficient at very low concentration, going down to picomolar levels, against different microbial strains, either susceptible or resistant, i.e. P. aeruginosa, E. coli, Acinetobacter baumannii, S. aureus, E. faecalis, and C. albicans (Rivero et al., 2015; Li et al., 2006; Aramwit et al., 2010; Chaudhari et al., 2016; Ibănescu et al., 2014; Korshed et al., 2016; Quinteros et al., 2016; Ribeiro et al., 2017; Xu et al., 2017).
In our study, we have synthesized Ag—ZnO NPs by chemical deposition of Ag NPs on the surface of ZnO NPs using silver nitrate, three types of anionic polyelectrolytes (PAAS, PSSA-co-MA and CMC) and citric acid as reagents. Their antimicrobial features have been tested by using qualitative and quantitative assays to establish their efficiency against both planktonic and adherent bacterial and fungal cells.
In the present study, the newly developed Ag—ZnO NPs proved a good microbicidal effect against both Gram-negative and Gram-positive bacteria and also against C. albicans fungal strain.
Previous studies regarding the antimicrobial activity of Ag—ZnO NCs report MIC values of 550 μg/mL on antibiotic resistant E. coli (Matai et al., 2014), 400 μg/mL for S. aureus, 600 μg/mL for E. coli (Lu et al., 2011) and 250 μg/mL for C. krusei (Das et al., 2016).
In our study, the chemically synthesized Ag—ZnO NPs inhibited the growth of C. albicans fungal strain at a higher MIC value, i.e 1.875 ± 0.884 mg/mL.
(Costerton et al., 1999) have been demonstrated that microbial cells within a biofilm phenotypically differ from their free-living or planktonic counterparts. In particular, biofilm microbial cells generally exhibit a much higher tolerance to antimicrobial agents (Chifiriuc et al., 2014; Naves et al., 2010). For this reason, we also assessed the inhibitory effect of the newly synthesized Ag—ZnO NPs against the initial stages of biofilm formation of the tested microorganisms. The results showed a good antibiofilm activity of NC1 and NC2 samples with a low MBIC value of 1.875 ± 0.884 mg/mL against biofilms of P. aeruginosa ATCC 27853, S. aureus ATCC 6538 and C. albicans ATCC 10231.
Overall, these results indicate that the newly developed Ag—ZnO NPs could be further exploited for their inhibitory activity against planktonic and adherent bacterial and fungal strains growth, to develop various antimicrobial applications in the biotechnology and biomedical fields, including the eradication of undesired biofilms.
Despite their numerous beneficial properties and applications, including the antimicrobial ones, the potential toxicity of NPs is currently a subject of intense research and scientific debate. Therefore, the investigation of the impact of such nanomaterials on human health should be performed for any novel nanomaterial. Moreover, it has been shown that the accumulation of NPs of different sizes, shapes and concentrations in the environment extends their genotoxic potential.
Over the past decade, significant progress has been made in the field of identifying, testing and assessing the genotoxic capacity of chemical compounds and especially of nanomaterials due to the collaborative effort of the scientific community. The genotoxic assessment is presently conducted employing different methods, such as Comet-assay, Ames test, MN test, etc. (Gopalan et al., 2009; Hackenberg et al., 2011; Kwon et al., 2014; Osman et al., 2010; Sharma et al., 2011). Extensive comparative studies have been conducted on variations in test protocols (Gonzalez et al., 2011), exposure time of the test material in cell culture (Fowler et al., 2012) and choice of cell lines (Fowler et al., 2012; Kroll et al., 2011).
In 2010, the OECD developed a methodological guide to test and assess the genotoxic capacity of different substances, using in vitro and in vivo assays. This guide is periodically reviewed and updated. According to the OECD, the in vitro micronucleus test no. 487 is recommended as a basic test to assess and characterize the genotoxic capacity of chemical/pharmaceutical agents. It is used to detect the micronuclei in the cytoplasm of interphase cells. Micronuclei are acentric (without centromere), chromosomal fragments or whole chromosomes being unable to migrate to one of the two poles of the cell during anaphase. This test detects the clastogenic and aneugenic activity of certain chemical agents in cells that undergo cell division during or after exposure to the tested substance. Through the in vitro micronucleus test (MNvit) can be rapidly determined the frequency of chromosomal damage, as well as of the disturbances in the cell cycle progression caused by a chemical agent (which is tested). This test has become more popular than the chromosomal aberrations test (CAAT) because it is more feasible, easy to conduct, rapid, and more sensitive in detecting subtle damage caused by aneugenic and clastogenic agents. The OECD mammalian in vivo micronucleus test no. 474 is a standardized test used to detect chromosomal damage, as well as a disturbance in the cell cycle progression, especially in the mitotic phase, produced by a chemical compound (which is tested). The changes are studied by analyzing the hematopoietic cells taken from bone marrow, and/or peripheral blood taken from animals, especially rodents (Kwon et al., 2014). The in vivo micronucleus test is relevant to assess the mutagenic potential of certain substances because metabolic and pharmacokinetic factors, as well as DNA repair capacity, are also considered.
It must be mentioned that the cytotoxicity and genotoxicity studies are currently performed on ZnO NPs and Ag NPs separately (Sharma et al., 2011; Osman et al., 2010; AshaRani et al., 2009; Ghosh et al., 2012; Landsiedel et al., 2010; Mărchidanu et al., 2017; Monteiro-Riviere et al., 2011) and only a few reports exist on Ag—ZnO NPs genotoxicity (Das et al., 2016).
In our study, the Ag—ZnO NPs tested concentrations were selected to be in the range of the MIC values obtained in the antimicrobial activity assays, i.e. 1.5 mg/mL, 2.5 mg/mL and 5 mg/mL. The in vitro assays could not be performed for concentrations higher than 2.5 mg/mL due to the occurrence of precipitates and NPs tendency to agglomerate and flocculate. The in vitro analysis revealed potential genotoxic activity for Ag—ZnO NPs in different types of cell lines.
Toxicological information on the frequently metallic and composite ENMs is of pivotal importance in terms of risk assessment and management, as these are either already in use (e.g. contrast agents for magnetic resonance imaging – MRI, cosmetics, and textiles) or may be applied in the future in numerous other fields of interest. Nanotoxicological research on the potential adverse health effects of ENMs, and especially NPs, has investigated only some of the numerous available NP types. However, most of the cytotoxic and genotoxic effects of NPs have been documented only in vitro studies.
The in vivo micronucleus assay revealed for all the samples, MN incidence similar to the control sample, with a slightly increased incidence in the case of the first two samples. However, one of the limitations of our study is that the animals were exposed to Ag—ZnO NPs for a short to medium duration (72 h). Therefore, it can be concluded that, in the case of in vivo treatment, due to the body’s ability to react to the action of exogenous factors and because of the DNA intrinsic ability to repair lesions, the Ag—ZnO NPs genotoxic capacity is very low to zero.
Our histopathological findings showed activated Kupffer cells (enlarged and prominent) lining the walls of sinusoids after the administration of Ag—ZnO NPs. The Kupffer cell hyperplasia might suggest the activation of the defense mechanism of detoxification, generating hepatic oxidative stress induced by these particles. However, in this regard, we have observed that the administrated Ag—ZnO NPs induced the DNA fragmentation of the Kupffer cells, but did not affect other cells of the analyzed tissue.
Our results showed minimal inflammatory reactions in all the analyzed tissues, which suggest the protective role of Ag NPs deposited on the surface of ZnO NPs.
5 Conclusions
In conclusion, the present study shows that the newly synthesized Ag—ZnO NPs are active both against planktonic and adherent microorganisms and could be exploited to develop novel antibacterial and antifungal strategies, which may find applications in both biotechnology and biomedical fields. Easy scalability of the developed chemical synthesis is a major advantage in producing large batches of Ag—ZnO NPs with reproducible properties. The in vitro and in vivo toxicological evaluation recommends these materials for biomedical applications.
Author contributions
M.V.L. designed and carried out the chemical synthesis of Ag—ZnO NPs and performed UV–Vis spectroscopy. E.M.L. performed FTIR spectrometry. S.M. performed WDXRF spectrometry. XRD analysis was carried out by G.S. Genotoxicity analysis was performed by L.B., N.C. and C.B. Antimicrobial activity study was performed by M.C.C., M.P. and L.M. Histopathology analysis was performed by A.H. The conceptual approach, drafting and review of the manuscript were performed by M.C.C., L.B., A.H., and M.V.L.
Funding
This work was performed through the Partnerships in Priority Areas program – PN II, developed with the support of Ministry of National Education (MEN) – Executive Unit for Financing Higher Education, Research, Development and Innovation (UEFISCDI), Romania, grant no. 215/2014.
Declaration of Competing Interest
The authors declare no conflict of interest. The funders had no role in the design of the study; in the collection, analyses or interpretation of the data; in the writing of the manuscript, or in the decision to publish the results.
References
- Tuning of TCO properties of ZnO by silver addition. Superlattices Microstruct.. 2014;67:97-109.
- [CrossRef] [Google Scholar]
- Photocatalytic inactivation of E. Coli by ZnO–Ag nanoparticles under solar radiation. RSC Adv.. 2015;5:51067-51077.
- [CrossRef] [Google Scholar]
- A study of the surface plasmon resonance of silver nanoparticles by the discrete dipole approximation method: effect of shape, size, structure, and assembly. Plasmonics. 2010;5:85-97.
- [CrossRef] [Google Scholar]
- Polyol-mediated synthesis of zinc oxide nanorods and nanocomposites with poly(methyl methacrylate) J. Nanomater.. 2012;2012 760872
- [CrossRef] [Google Scholar]
- In vitro evaluation of the antimicrobial effectiveness and moisture binding properties of wound dressings. Int. J. Mol. Sci.. 2010;11:2864-2874.
- [CrossRef] [Google Scholar]
- Cytotoxicity and genotoxicity of silver nanoparticles in human cells. ACS Nano. 2009;3:279-290.
- [CrossRef] [Google Scholar]
- Estimation of lattice strain in ZnO nanoparticles: X-ray peak profile analysis. J. Theor. Appl. Phys.. 2014;8:123-134.
- [CrossRef] [Google Scholar]
- Fate of silver nanoparticles in wastewater and immunotoxic effects on rainbow trout. Aquat. Toxicol.. 2016;174:70-81.
- [CrossRef] [Google Scholar]
- Nanosilver as a new generation of nanoproduct in biomedical applications. Trends Biotechnol.. 2010;28:580-588.
- [CrossRef] [Google Scholar]
- A novel covalent approach to bio-conjugate silver coated single walled carbon nanotubes with antimicrobial peptide. J. Nanobiotechnol.. 2016;14:58.
- [CrossRef] [Google Scholar]
- Quorum sensing inhibitors from the sea: lessons from marine symbiotic relationships. Curr. Org. Chem.. 2014;18:823-839.
- [CrossRef] [Google Scholar]
- Band gap-engineered ZnO and Ag/ZnO by ball-milling method and their photocatalytic and Fenton-like photocatalytic activities. Appl. Surf. Sci.. 2015;356:615-625.
- [CrossRef] [Google Scholar]
- Rational design of silver nanoparticles with reduced toxicity and enhanced antimicrobial activity. Rom. Biotechnol. Lett.. 2018;23:13878-13886.
- [Google Scholar]
- Bacterial biofilms: a common cause of persistent infections. Science. 1999;284:1318-1322.
- [CrossRef] [Google Scholar]
- Influence of pH and media composition on suspension stability of silver, zinc oxide, and titanium dioxide nanoparticles and immobilization of Daphnia magna under guideline testing conditions. Ecotoxicol. Environ. Saf.. 2016;127:144-152.
- [CrossRef] [Google Scholar]
- Understanding the antifungal mechanism of Ag@ZnO core-shell nanocomposites against Candida krusei. Sci. Rep.. 2016;6:36403.
- [CrossRef] [Google Scholar]
- Solar-photocatalytic disinfection of vibrio cholerae by using Ag@ZnO core–shell structure nanocomposites. J. Photochem. Photobiol. B Biol.. 2015;142:68-76.
- [CrossRef] [Google Scholar]
- Will 10 million people die a year due to antimicrobial resistance by 2050? PLOS Med.. 2016;13:e1002184
- [CrossRef] [Google Scholar]
- A systematic review of reported exposure to engineered nanomaterials. Ann. Occup. Hyg.. 2016;60:916-935.
- [CrossRef] [Google Scholar]
- Assessment of the oxidative potential of nanoparticles by the cytochrome c assay: assay improvement and development of a high-throughput method to predict the toxicity of nanoparticles. Arch. Toxicol.. 2017;91:163-177.
- [CrossRef] [Google Scholar]
- Nanoparticles within WWTP sludges have minimal impact on leachate quality and soil microbial community structure and function. Environ. Pollut.. 2016;211:399-405.
- [CrossRef] [Google Scholar]
- Synthesis and optical properties of silver nanoparticles and arrays. ChemPhysChem. 2005;6:1221-1231.
- [CrossRef] [Google Scholar]
- Microbial growth inhibition caused by Zn/Ag-Y zeolite materials with different amounts of silver. Colloids Surf. B Biointerfaces. 2016;142:141-147.
- [CrossRef] [Google Scholar]
- Reduction of misleading (“false”) positive results in mammalian cell genotoxicity assays. I. Choice of cell type. Mutat. Res. Toxicol. Environ. Mutagen.. 2012;742:11-25.
- [CrossRef] [Google Scholar]
- Cytotoxicity of nanoparticles contained in food on intestinal cells and the gut microbiota. Int. J. Mol. Sci.. 2016;17:509.
- [CrossRef] [Google Scholar]
- Silver nanoparticles and polymeric medical devices: A new approach to prevention of infection? J. Antimicrob. Chemother.. 2004;54:1019-1024.
- [CrossRef] [Google Scholar]
- Ambient fine particulate air pollution triggers ST-elevation myocardial infarction, but not non-ST elevation myocardial infarction: a case-crossover study. Part. Fibre Toxicol.. 2014;11:1.
- [CrossRef] [Google Scholar]
- A highly efficient Ag-ZnO photocatalyst: synthesis, properties, and mechanism. J. Phys. Chem. C. 2008;112:13563-13570.
- [CrossRef] [Google Scholar]
- In vitro and in vivo genotoxicity of silver nanoparticles. Mutat. Res. Toxicol. Environ. Mutagen.. 2012;749:60-69.
- [CrossRef] [Google Scholar]
- Morphology and antifungal effect of nano-ZnO and nano-Pd-doped nano-ZnO against Aspergillus and Candida. J. Environ. Sci. Heal. Part A. 2012;47:1413-1418.
- [CrossRef] [Google Scholar]
- Adaptations of the in vitro MN assay for the genotoxicity assessment of nanomaterials. Mutagenesis. 2011;26:185-191.
- [CrossRef] [Google Scholar]
- The effect of zinc oxide and titanium dioxide nanoparticles in the Comet assay with UVA photoactivation of human sperm and lymphocytes. Nanotoxicology. 2009;3:33-39.
- [CrossRef] [Google Scholar]
- Structural examination of the cross-linking reaction mechanism of polyacrylate binding agents. Arch. Metall. Mater.. 2009;54:427-437.
- [Google Scholar]
- Rapid evolution of silver nanoparticle resistance in Escherichia coli. Front. Genet.. 2015;6:42.
- [CrossRef] [Google Scholar]
- Repetitive exposure to zinc oxide nanoparticles induces DNA damage in human nasal mucosa mini organ cultures. Environ. Mol. Mutagen.. 2011;52:582-589.
- [CrossRef] [Google Scholar]
- Zinc oxide nanostructure-modified textile and its application to biosensing, photocatalysis, and as antibacterial material. Langmuir. 2015;31:10913-10921.
- [CrossRef] [Google Scholar]
- Antifungal activity of zinc oxide nanoparticles against Botrytis cinerea and Penicillium expansum. Microbiol. Res.. 2011;166:207-215.
- [CrossRef] [Google Scholar]
- Effect of Ag doping on structural, optical, and photocatalytic properties of ZnO nanoparticles. J. Alloys Compd.. 2015;640:408-415.
- [CrossRef] [Google Scholar]
- Photocatalytic and antimicrobial Ag/ZnO nanocomposites for functionalization of textile fabrics. J. Alloys Compd.. 2014;610:244-249.
- [CrossRef] [Google Scholar]
- Silver nanoparticles in therapeutics: Development of an antimicrobial gel formulation for topical use. Mol. Pharm.. 2009;6:1388-1401.
- [CrossRef] [Google Scholar]
- Hybrid organic-inorganic light emitting diodes: effect of Ag-doped ZnO. J. Photochem. Photobiol. A Chem.. 2016;325:88-96.
- [CrossRef] [Google Scholar]
- Preparation and antibacterial effects of Ag–SiO2 thin films by sol–gel method. Biomaterials. 2003;24:4921-4928.
- [CrossRef] [Google Scholar]
- Synthesis and characterization of antibacterial Ag−SiO2 nanocomposite. J. Phys. Chem. C. 2007;111:3629-3635.
- [CrossRef] [Google Scholar]
- The molecular mechanisms of the antibacterial effect of picosecond laser generated silver nanoparticles and their toxicity to human cells. PLoS ONE. 2016;11 e0160078
- [CrossRef] [Google Scholar]
- Cytotoxicity screening of 23 engineered nanomaterials using a test matrix of ten cell lines and three different assays. Part. Fibre Toxicol.. 2011;8:9.
- [CrossRef] [Google Scholar]
- Influence of Ag, Cu dopants on the second and third harmonic response of ZnO films. J. Alloys Compd.. 2009;481:819-825.
- [CrossRef] [Google Scholar]
- Current investigations into the genotoxicity of zinc oxide and silica nanoparticles in mammalian models in vitro and in vivo: carcinogenic/genotoxic potential, relevant mechanisms and biomarkers, artifacts, and limitations. Int. J. Nanomed.. 2014;9:271-286.
- [CrossRef] [Google Scholar]
- Gene toxicity studies on titanium dioxide and zinc oxide nanomaterials used for UV-protection in cosmetic formulations. Nanotoxicology. 2010;4:364-381.
- [CrossRef] [Google Scholar]
- Antimicrobial effect of surgical masks coated with nanoparticles. J. Hosp. Infect.. 2006;62:58-63.
- [CrossRef] [Google Scholar]
- Antimicrobial nanomaterials for water disinfection and microbial control: Potential applications and implications. Water Res.. 2008;42:4591-4602.
- [CrossRef] [Google Scholar]
- Antibacterial activity and mechanism of silver nanoparticles on Escherichia coli. Appl. Microbiol. Biotechnol.. 2010;85:1115-1122.
- [CrossRef] [Google Scholar]
- Joint toxicity prediction of nanoparticles and ionic counterparts: Simulating toxicity under a fate scenario. J. Hazard. Mater.. 2016;320:1-9.
- [CrossRef] [Google Scholar]
- Surface charge transfer properties of high-performance Ag-decorated ZnO photocatalysts. J. Phys. D. Appl. Phys.. 2011;44 315502
- [CrossRef] [Google Scholar]
- Tyrosine-assisted preparation of Ag/ZnO nanocomposites with enhanced photocatalytic performance and synergistic antibacterial activities. Nanotechnology. 2008;19 445711
- [CrossRef] [Google Scholar]
- Functional properties improvement of Ag-ZnO thin films using Inconel 600 interlayer produced by electron beam evaporation technique. Thin Solid Films. 2018;667:76-87.
- [CrossRef] [Google Scholar]
- Investigation of optical, structural, morphological and antimicrobial properties of carboxymethyl cellulose capped Ag-ZnO nanocomposites prepared by chemical and mechanical methods. Mater. Charact.. 2016;120:69-81.
- [CrossRef] [Google Scholar]
- Synthesis of ZnS:Ag, Co water-soluble blue afterglow nanoparticles and application in photodynamic activation. Nanotechnology. 2016;27 315602
- [CrossRef] [Google Scholar]
- Highly enhanced UV emission due to surface plasmon resonance in Ag-ZnO nanorods. Chem. Phys. Lett.. 2012;542:110-116.
- [CrossRef] [Google Scholar]
- Engineered nanoparticles as potential food contaminants and their toxicity to Caco-2 cells. J. Food Sci.. 2016;81:T2107-T2113.
- [CrossRef] [Google Scholar]
- Review: cytotoxicity and genotoxicity aspects of ZnO and silver nanoparticles designed for antimicrobial applications. Rom. Arch. Microbiol. Immunol.. 2017;76:91-101.
- [Google Scholar]
- Modelling the transport of engineered metallic nanoparticles in the river Rhine. Water Res.. 2016;91:214-224.
- [CrossRef] [Google Scholar]
- Antibacterial activity and mechanism of Ag–ZnO nanocomposite on S. aureus and GFP-expressing antibiotic resistant E. coli. Colloids Surf. B Biointerfaces. 2014;115:359-367.
- [CrossRef] [Google Scholar]
- Supercritical fluid synthesis and tribological applications of silver nanoparticle-decorated graphene in engine oil nanofluid. Sci. Rep.. 2016;6:31246.
- [CrossRef] [Google Scholar]
- Contributions to the optics of turbid media, particularly of colloidal metal solutions. Ann. Phys.. 1908;330:377-445.
- [CrossRef] [Google Scholar]
- Mycobased synthesis of silver nanoparticles and their incorporation into sodium alginate films for vegetable and fruit preservation. J. Agric. Food Chem.. 2009;57:6246-6252.
- [CrossRef] [Google Scholar]
- Safety evaluation of sunscreen formulations containing titanium dioxide and zinc oxide nanoparticles in UVB sunburned skin: an in vitro and in vivo study. Toxicol. Sci.. 2011;123:264-280.
- [CrossRef] [Google Scholar]
- The bactericidal effect of silver nanoparticles. Nanotechnology. 2005;16:2346-2353.
- [CrossRef] [Google Scholar]
- Effect of Mn doping concentration on structural, morphological and optical studies of ZnO nano-particles. Nanosci. Nanoeng.. 2013;1(2):116-122.
- [CrossRef] [Google Scholar]
- Microwave-assisted synthesis, characterization and antibacterial activity of Ag/ZnO nanoparticles supported bentonite clay. J. Hazard. Mater.. 2013;262:439-446.
- [CrossRef] [Google Scholar]
- Differences in the in vitro susceptibility of planktonic and biofilm-associated Escherichia coli strains to antimicrobial agents. J. Chemother.. 2010;22:312-317.
- [CrossRef] [Google Scholar]
- Zinc oxide nanoparticles exhibit cytotoxicity and genotoxicity through oxidative stress responses in human lung fibroblasts and Drosophila melanogaster. Int. J. Nanomed.. 2017;12:1621-1637.
- [CrossRef] [Google Scholar]
- The effect of gain and absorption on surface plasmons in metal nanoparticles. Appl. Phys. B. 2007;86:455-460.
- [CrossRef] [Google Scholar]
- In vitro evaluation of the antimicrobial activity of N-phenyl carbamothioyl benzamides against planktonic and adherent microbial cells. Rom Biotechnol. Lett.. 2017;22:13163-13168.
- [Google Scholar]
- Genotoxicity and cytotoxicity of zinc oxide and titanium dioxide in HEp-2 cells. Nanomedicine. 2010;5:1193-1203.
- [CrossRef] [Google Scholar]
- Nanoparticles for the treatment of wounds. Curr. Pharm. Des.. 2015;21:4329-4341.
- [CrossRef] [Google Scholar]
- Silver colloid nanoparticles: synthesis, characterization, and their antibacterial activity. J. Phys. Chem. B. 2006;110:16248-16253.
- [CrossRef] [Google Scholar]
- Photocatalytic degradation of municipal wastewater and brilliant blue dye using hydrothermally synthesized surface-modified silver-doped ZnO designer particles. Int. J. Photogr.. 2012;2012:1-8.
- [CrossRef] [Google Scholar]
- Structural and plasmonic properties of noble metal doped ZnO nanomaterials. Phys. B Condens. Matter. 2018;535:114-118.
- [CrossRef] [Google Scholar]
- Silver nanoparticles: biosynthesis using an ATCC reference strain of Pseudomonas aeruginosa and activity as broad spectrum clinical antibacterial agents. Int. J. Biomater.. 2016;2016:5971047.
- [CrossRef] [Google Scholar]
- Preparation and characterization of SiO2/CMC/Ag hybrids with antibacterial properties. Carbohydr. Polym.. 2014;101:1166-1175.
- [CrossRef] [Google Scholar]
- Antibacterial silk fibroin/nanohydroxyapatite hydrogels with silver and gold nanoparticles for bone regeneration. Nanomed. Nanotechnol., Biol. Med.. 2017;13:231-239.
- [CrossRef] [Google Scholar]
- Nanomaterials for functional textiles and fibers. Nanoscale Res. Lett.. 2015;10:501.
- [CrossRef] [Google Scholar]
- Antibacterial activity of silver and zinc nanoparticles against Vibrio cholerae and enterotoxic Escherichia coli. Int. J. Med. Microbiol.. 2015;305:85-95.
- [CrossRef] [Google Scholar]
- Prevention of catheter-related infections: the potential of a new nano-silver impregnated catheter. Int. J. Antimicrob. Agents. 2004;23:75-78.
- [CrossRef] [Google Scholar]
- Synthesis of supported silver nano-spheres on zinc oxide nanorods for visible light photocatalytic applications. Mater. Res. Bull.. 2015;63:134-140.
- [CrossRef] [Google Scholar]
- Nanosilver: application and novel aspects of toxicology. Arch. Toxicol.. 2013;87:569-576.
- [CrossRef] [Google Scholar]
- Synthesis and effect of silver nanoparticles on the antibacterial activity of different antibiotics against Staphylococcus aureus and Escherichia coli. Nanomed. Nanotechnol., Biol. Med.. 2007;3:168-171.
- [CrossRef] [Google Scholar]
- Investigation of antibacterial properties silver nanoparticles prepared via green method. Chem. Cent. J.. 2012;6:73.
- [CrossRef] [Google Scholar]
- Metal nanoparticles: a theranostic nanotool against cancer. Drug Discov. Today. 2015;20:1143-1151.
- [CrossRef] [Google Scholar]
- Zinc oxide nanoparticle induced genotoxicity in primary human epidermal keratinocytes. J. Nanosci. Nanotechnol.. 2011;11:3782-3788.
- [CrossRef] [Google Scholar]
- Enhanced photocatalytic degradation of RO16 dye using Ag modified ZnO nanopowders prepared by the solvothermal method. Process. Appl. Ceram.. 2017;11:27-38.
- [CrossRef] [Google Scholar]
- Chemical and biological metal nanoparticles as antimycobacterial agents: A comparative study. Int. J. Antimicrob. Agents. 2015;46:183-188.
- [CrossRef] [Google Scholar]
- Evaluation of antimicrobial activity of silver nanoparticles for carboxymethylcellulose film applications in food packaging. J. Nanosci. Nanotechnol.. 2014;14:5512-5517.
- [CrossRef] [Google Scholar]
- In vitro cytotoxicity of silver nanoparticles and zinc oxide nanoparticles to human epithelial colorectal adenocarcinoma (Caco-2) cells. Mutat. Res. Mol. Mech. Mutagen.. 2014;769:113-118.
- [CrossRef] [Google Scholar]
- Synthesis, characterization and antimicrobial activity evaluation of some new derivatives of 6,11-dihydrodibenzo[b, e]thiepin 5,5-dioxide. Rev. Chim.-Bucharest. 2009;60:137-141.
- [Google Scholar]
- Markers of oxidative stress in hepatopancreas of crayfish (Orconecteslimosus, Raf.) experimentally exposed to nanosilver. Environ. Toxicol.. 2014;29:1283-1291.
- [CrossRef] [Google Scholar]
- Assessment of the anti-biofilm activity and biocompatibility of novel PE and PVC polymers. Rom Biotechnol. Lett.. 2017;22:12997-13004.
- [Google Scholar]
- A versatile strategy to fabricate hydrogel–silver nanocomposites and investigation of their antimicrobial activity. J. Colloid Interface Sci.. 2007;315:389-395.
- [CrossRef] [Google Scholar]
- Preliminary studies on cytotoxicity and genotoxicity assessment of the PMMA-TiO2 nanocomposites for stereolithographic complete dentures manufacturing. Rev. Chim.-Bucharest. 2018;69:1160-1165.
- [Google Scholar]
- Nanofibers based antibacterial drug design, delivery and applications. Curr. Pharm. Des.. 2015;21:1930-1943.
- [CrossRef] [Google Scholar]
- Antibacterial and antifouling properties of a polyurethane surface modified with perfluoroalkyl and silver nanoparticles. J. Biomed. Mater. Res. Part A. 2017;105:531-538.
- [CrossRef] [Google Scholar]
- Silver nanoparticle exposure attenuates the viability of rat cerebellum granule cells through apoptosis coupled to oxidative stress. Small. 2013;9:1831-1841.
- [CrossRef] [Google Scholar]
- Cytotoxic potential of silver nanoparticles. Yonsei Med. J.. 2014;55:283-291.
- [CrossRef] [Google Scholar]
- The use of BMP-2 coupled – Nanosilver-PLGA composite grafts to induce bone repair in grossly infected segmental defects. Biomaterials. 2010;31:9293-9300.
- [CrossRef] [Google Scholar]


