

Translate this page into:
Synthesis, physicochemical elucidation, biological screening and molecular docking studies of a Schiff base and its metal(II) complexes
-
Received: ,
Accepted: ,
This article was originally published by Elsevier and was migrated to Scientific Scholar after the change of Publisher.
Peer review under responsibility of King Saud University.
Abstract
A Schiff base 1-((3-nitrophenylimino)methyl)naphthalen-2-olate (HL) and its two novel complexes with Zn(II) and Co(II) metals were successfully synthesized and characterized by FTIR, 1H NMR, 13C NMR, elemental analysis, magnetic susceptibility, TGA and EIS-MS. Crystal of Schiff base was also characterized by X-ray analysis and experimental parameters were found in line with the theoretical parameters. Quantum mechanical approach was also used to compare structural and calculated parameters and to ensure the geometry of metal complexes. The photometric behaviors of all the synthesized compounds were investigated in a wide pH range using BR buffers. Appearance of isosbestic point suggested the existence of Schiff base molecules in different tautomeric forms. Binding of synthesized complexes with calf thymus DNA was explored by photometric and voltammetric titrations and binding constants were calculated. The results indicated that ligand and its metal complexes bind to DNA by intercalation mode. Docking studies indicate their binding possibilities with topoisomerase II. Moreover, all these prepared compounds were screened for enzyme inhibition, antibacterial, cytotoxic and in vivo antidiabetic activities and found active against one or other activity. This effort just provides preliminary data for some biological properties and which can act as foundation stone for their application in drug development.
Keywords
Schiff base-metal complexes
Spectroscopy
X-ray analysis
DNA binding
Molecular docking

1 Introduction
Schiff bases and transition metal complexes have received utmost attention of researchers since the last few decades. Schiff bases can be easily synthesized by the condensation reaction of amines with carbonyl compounds (Da Silva et al., 2011). High electron density on nitrogen atom of azomethine group makes them good chelating agents (Prakash and Adhikari, 2011). Presence of —OH group increases their coordination ability, especially when —OH group is present in the vicinity of azomethine group (Rauf et al., 2017). Literature survey indicates that both Schiff bases and their metal complexes have been successfully used in variety of applications. In synthetic chemistry, Schiff bases have been utilized to produce number of compounds like benzoxazines, formazans, metal chelates and quinolone derivatives (Brodowska and Łodyga-Chruścińska, 2014; Kajal et al., 2013). Photochromic and thermochromic properties of Schiff bases and their metal complexes make them useful in modern technology including optical computers, imaging systems, photostabilizers and solar filters. They have been used in electronic and photonic devices due to their non-linear optical behavior (Atta et al., 2006; Jia et al., 2011). High electron density of azomethine nitrogen atom makes them good corrosion inhibitor of different metals (Brodowska and Łodyga-Chruścińska, 2014; Emregul et al., 2006). Their metal complexes are considered as good oxidation catalysts in different reactions due to their thermal and chemical stability (Sheldon and Kochi, 1976). In industry they are also used as pigments, dyes and polymer stabilizers (Dhar and Taploo, 1982). In drug development, these compounds possess good anticancer, antibacterial, antifungal, antipyretic, antiproliferative and antidiabetic activities. A plethora of metal complexes have been reported to possess biological activities (Merzougui et al., 2016; Prakash and Adhikari, 2011). Khan et al. have documented some transition metal complexes as antimicrobial agent (Khan et al., 2017). Halim et al. reported some metal complexes to exhibit strong potency against cancer cells (El-Halim et al., 2017). Aziz et al. reported DNA binding studies of several transition metal complexes (Aziz et al., 2017).
Zn(II) and Co(II) are subunits in a broad range of transition metals, which display interesting pharmacological and biological applications. More et al. reported Co(II) complexes to exhibit strong antitubercular activities (More et al., 2017). Kavitha et al. explored some Co(II) complexes to show pronounced DNA cleavage activity (Kavitha et al., 2016). Emam reported Zn(II) complexes of Schiff bases to possess antitumor activity (Emam, 2017). Although extensive literature is available on their applications, still there is a need to synthesize and explore their biological and industrial applications. In continuation to our previous research on Schiff bases and metal complexes (Rauf et al., 2015, 2017a,b), present study is an effort to synthesize Co(II) and Zn(II) complexes of a Schiff base and to explore their useful insights.
2 Experimental
2.1 Materials and reagents
2-Hydroxynaphthaldehyde and 3-nitroaniline were received from Sigma Aldrich, USA. Zinc acetate and cobalt acetate were purchased from Fluka, Switzerland. The analytical grade solvents like, chloroform, n-hexane, ethanol and dimethyl sulfoxide were obtained from Merck, Germany. All BR buffer solutions were prepared according to reported protocol (Huang et al., 2010;Qureshi et al., 2015) using analytical grade reagents and doubly distilled water (conductivity ≤0.1 μS cm−1). All experiments were carried out at room temperature (25 ± 1 °C) with freshly prepared solutions.
2.2 Instrumentation and methods
FTIR spectra were recorded on Thermo Nicolet 6700 FTIR spectrophotometer in the range of 4000–100 cm−1. Bruker AC Spectrometer was used to obtain 1H and 13C NMR spectra using TMS as internal reference. Absorption spectra were recorded on Shimadzu 1601 spectrophotometer and the pH measurements were carried out with a Crison micro pH 2001 pH-meter with an Ingold combined glass electrode. Magnetic susceptibility of the complexes was performed on a Sherwood MSB mark1 Gouy balance while electron ionization mass spectra (EI-MS) were recorded by JEOL-GC Mass Spectrometer MATE-2. Briton Robinson (BR) universal buffers of wide pH range were used for studying the effect of pH on the photometric behavior. Fresh working solutions of the analytes were prepared in 50% ethanol and 50% BR buffers. Voltammetric experiments were performed on μAuto-lab running with GPES 4.9 software, Eco-Chemie, Utrecht, The Netherlands. Glassy carbon electrode with surface area of 0.063 cm2, Pt wire and Ag/AgCl (3M KCl) were used as working, counter and reference electrodes, respectively. Surface of working electrode was polished with 0.3 µm alumina powder before each experiment followed by through rinsing with bi-distilled water. GAUSSIAN 09 software was used to optimize geometry of Schiff base and its metal complexes using 6-311++G∗∗ and 6-311G++ basis sets, respectively.
2.3 Synthesis of 1-((3-nitrophenylimino)methyl)naphthalen-2-olate (HL)
Schiff base was synthesized according to reported method (Popović et al., 2004). 0.172 g of 2-hydroxynaphthaldehyde (1 mM) was added to the solution of 3-nitroaniline (0.138 g, 1 mM) in 30 ml ethanol. Refluxing the mixture for 3 h produced orange red colored precipitates which were filtered, washed with ethanol and crystallized in mixture of chloroform and pet ether (3:1).
C17H12N2O3: Mol. Wt. 292.29 gmol−1, Yield 85%, M.P. 175.8–176.4 °C; FTIR (KBr, υ/cm−1): 1625 (HC⚌N Schiff base), 3010 (C—H Aromatic), 1435 & 1519 (C⚌C Aromatic). Anal. Calc.: Found% (Calc%): C, 69.86 (69.82); H, 4.14 (4.15); N, 9.58 (9.55); O, 16.42 (16.46). 1H NMR (CDCl3, ppm, 300 MHz) δ: 9.50 (s, 1H, CH⚌N), 14.91 (s, 1H, NH), 8.14–8.21 (m, 3H), 7.57–7.70 (m, 3H), 7.17 (d, 1H), 7.41 (t, 1H), 7.79 (d, 1H), 7.89 (d, 1H), 13C NMR (CDCl3, ppm, 75 MHz) δ: 166.6 (C—OH), 158.5 (CH⚌N), 148.5 (C—NO2), 149.1 (C—N), 136.9–109.19 (Aromatic Carbons).
2.4 Synthesis of transition metal (II) complexes
Metal complexes were prepared by the following general method. Corresponding metal (II) acetate salts were added to hot ethanol solution of Schiff base ligand in 1:2 M ratio, respectively. After few minutes, the colored complex was precipitated out in each case. The complexes were filtered and washed with ethanol.
2.4.1 Bis(((3-nitrophenyliminio)methyl)naphthalen-2-olate)zinc (ZnL2)
C34H22N4O6Zn: Mol. Wt.: 647.94 g mol−1 Yield: 72%, M.P. 280–284.2 °C; FTIR (KBr, υ/cm−1): 1590 (HC⚌N Schiff base), 3015 (C—H Aromatic), 1437 & 1521 (C⚌C Aromatic), 453 (Zn—O), 425 (Zn—N). Anal. Calc.: Found% (Calc%): C, 63.02 (63.05); H, 3.42 (3.41); N, 8.65 (8.63); O, 14.82 (14.83). 1H NMR (DMSO‑d6, ppm, 300 MHz) δ: 9.23 (s, 1H, CH⚌N), 6.79 (t, 1H), 7.02 (dd, 1H), 6.90 (dd, 1H), 7.49 (d, 2H), 7.82 (d, 2H), 13C NMR (DMSO‑d6, ppm, 75 MHz) δ: 152.6 (CH⚌N), 145.6 (C—O), 147.3 (C—OH), 151.6 (C—N), 135.2–110.3 (Aromatic Carbons). EI-MS/DMSO [m/z(%)]: 646 (20), 616 (18), 583 (23), 530 (10), 402 (1 0 0) (see Fig. S1).
2.4.2 Bis(((3-Nitrophenyliminio)methyl)naphthalen-2-olate)cobalt (CoL2)
C34H22N4O6Co: Mol. Wt.: 641.49 g mol−1 Yield: 78%, M.P. >310 °C; FTIR (KBr, υ/cm−1): 1598 (HC⚌N Schiff base), 3016 (C—H Aromatic), 1431 & 1530 (C⚌C Aromatic), 545 (Co—O), 458 (Co—N); Anal. Calc.: Found% (Calc%): C, 63.66 (63.64); H, 3.46 (3.45); Co, 9.19 (9.16); N, 8.73 (8.75); O, 14.96 (14.92), μeff (BM): 4.32. EI-MS/DMSO [m/z(%)]: 641 (15), 549 (26), 497 (1 0 0). (TGA data is given in Table 1).
Complexes
Temp. range °C
Evolved components
% Weight loss
% Residue
Observed
Calculated
Observed
Calculated
ZnL2
334–419
2NO2
13.14
14.20
15.80
15.02
552–612
2C17H11N
71.25
70.81
ZnO2
CoL2
350–395
2NO2
14.85
14.34
8.12
9.18
484–512
2C17H11NO
76.92
76.41
Co
2.5 X-ray structure determination
Crystals of HL were prepared in chloroform and pet ether (3:1) mixture. A suitable crystal was selected and mounted on a Bruker Kappa APEX II CCD diffractometer keeping the temperature constant at 296.15 K during data collection. Using Olex2 (Dolomanov et al., 2009), the structure was solved with the SIR2004 structure solution program (Burla et al., 2007) using Direct Methods and refined with the olex2 refine (Bourhis et al., 2015) refinement package using Gauss-Newton minimization.
2.6 Assay of alkaline phosphatase activity
Inhibition of alkaline phosphatase enzyme by Schiff base (HL) and metal complexes was investigated according to the reported procedure (Galdiero et al., 2012). Reagent A (ethanolamine pH 9.8 mol/dm3 and Magnesium chloride 0.5 mmol/dm3) and reagent B (p-nitrophenyl phosphate 50 mmol/dm3) were mixed in 4:1 ratio and incubated for 5 min at 298 K. 40 µL of human blood serum having activity of 165 IU/L was mixed with 2 mL of the substrate and activity of the enzyme was ensured by measuring absorbance after 1 min incubation. Appearance of yellow colour confirmed the hydrolysis of p-nitrophenyl phosphate in the presence of ALP (Scheme 1). Finally different amounts of synthesized compounds were added periodically from the stock solution, absorbance was recorded after 3 min incubation and percentage inhibition was calculated.
Hydrolysis of alkaline phosphatase.
2.7 Antimicrobial activities
Disc diffusion method was used to investigate the antibacterial and antifungal activities of HL and its metal complexes (Jabeen et al., 2012). Bacterial and fungal strains were grown on the nutrient agar and potato dextrose agar, respectively. Activity was confirmed by the formation of clear inhibition zones around the discs which were measured in millimeters using a zone reader.
2.8 In vitro cytotoxicity activity
2.8.1 Cell culture
Human hepatocellular carcinoma HepG2 (ATCC HB-8065™) cell line was cultured in DMEM supplemented with FBS (10%), Na-pyruvate (1 mM), l-glutamine (2 mM), penicillin (100 U/ml) and streptomycin (100 µg/ml). The cultures were maintained under humidified conditions in the presence of 5% CO2 at 310 K.
2.8.2 Cytotoxicity analysis
In vitro cytotoxicity analysis of the synthesized ligand and complexes was done by sulforhodamine B (SRB) assay as reported (Skehan et al., 1990). Actively growing HepG2 cells (10,000 cells/well) were exposed to the compounds at 200 μM concentration for 24 h under standard culture conditions while DMSO (solvent) treated and untreated cultures were included as experimental control. Cultures were fixed using pre-chilled trichloroacetic acid (50%) for 1 h at 277 K and air dried after washing with deionized water. The cells were then stained with SRB solution (0.05%) for 30 min, washed with acetic acid (1%), dried overnight and photographed with a Olympus IMT-2 inverted microscope equipped with digital camera. The incorporated dye was solubilized in 10 mM Tris and absorbance (OD) was measured on microplate reader (AMP PLATOS R-496) at the wavelength of 565 nm. Percent (%) viability was calculated relative to the untreated sample using standard formula (Rauf et al., 2017a) and results are represented after applying statistics.
2.9 In vivo antidiabetic activity
Healthy BALB/c strain mice (average body wt = 30 ± 4.5 g) were used in the current study. Five experimental groups were constituted with five mice in each group. Animals were fasted overnight and then made diabetic by injecting single dose of alloxan monohydrate (145 mg/kg b.w) intraperitoneally. All animals had free access of rodent diet and water. Control diabetic mice were maintained alongside.
2.9.1 Experimental design and treatment
A total of twenty-five diabetic adult male BALB/c mice were used in the experiments. Three groups of diabetic mice were treated separately with ligand HL and its metal complexes and , which were dissolved in dimethyl sulfoxide (DMSO) according at the rate of 35.0 mg/kg body weight. The remaining two diabetic groups served as positive and negative control groups. Animals of the positive group were treated with the reference antidiabetic compound glibenclamide (Sigma chemical Co. USA) prepared in distilled H2O at the dose of 10 mg/kg b.w, while the negative group was treated with normal saline. The blood glucose level of the samples collected from the tail vein was determined with a glucometer (Accu-Check Active, Roche, Germany). The plasma glucose level was monitored at −1 (pre diabetic sample), 0 (post diabetic sample), 1, 2, 3, 4, 5, 6 and 7 h (post treatment with compounds samples). Triglycerides and cholesterol levels (mg/dl) of the blood were analyzed after sacrificing the mice at the end of experiment using commercial kits (Globe Diagnostic Company, Italy).
2.9.2 Statistical analysis
Statistical comparison of mean value from each group was performed through one-way analysis of variance (ANOVA), followed by least significant difference tests (LSD) for the multiple comparison of various groups. The mean ± S.D data is expressed as line graphs in case of diabetes and bar graphs in case of both cholesterol and triglycerides concentrations. The values were considered statistically significant when P < .05.
2.10 DNA binding experiments
The stock solution of ct-DNA was prepared in doubly distilled water. The concentration of solution was determined from the absorbance values at 260 nm using the reported ɛ value of 6600 M−1 cm−1 while ratio of absorbance at 260 and 280 nm (A260/A280 > 1.8), ensured that DNA is free from protein impurities (Shah et al., 2013).
For spectroscopic investigation, concentrations of ligands and metal complexes were kept constant (20 µM) while concentration of ct-DNA was varied successively and photometric response was recorded after allowing the solution to incubate for 2 min. All the experiments were done at physiological pH 7.4 using phosphate buffer. From the absorbance values the binding constants of synthesized compounds with ct-DNA were calculated using the following Benesi-Hildebrand equation. where Kb is the binding constant. Ao and A are the absorbance values of drugs in the absence and presence of ct-DNA, respectively. Ao/A − Ao is plotted against 1/[DNA] and Kb values were calculated from the ratio of intercept to slope.
Cyclic voltammetry is widely used for the determination of binding mode of interaction and strength of binding between drug and DNA. Variation in peak current and peak potential helps in the determination of binding sites and values of binding constant while shift in the peak position ensures the mode of interaction. For electrochemical investigation, successive amounts of ct-DNA solution were added to 1 mM drug solutions at pH 7.4 and their cyclic voltammograms were recorded. Strength of binding was quantified using following equation. where K is the binding constant, Io and I are the peak currents in the absence and presence of DNA, respectively. Values of K were determined from the intercept of the plot of log(1/[DNA]) versus log(I/Io − I).
2.11 Molecular docking analysis
Topoisomerase II manage the supercoiling and tangling of DNA strands and helps in the phosphodiester backbone rejoining of DNA strands, therefore inhibitors of topoisomerase II are required to arrest cell cycle (Willmore et al., 2004). Molecular docking was performed to explore the inhibition of topoisomerase II using in silico approach, (Saleh et al., 2016). 3D crystal structure of topoisomerase II enzyme with PDB ID: 4FM9 was downloaded from RCSB protein data bank (Wendorff et al., 2012). The proteins structure was prepared by removing water molecules and Gasteiger charges were added while ligand structures were prepared by CHEM DRAW ULTRA 12. 0 and their energies were minimized by CHEM 3D pro 12.0. The ligands were then docked in the protein structures with defined grid parameters in their center using AUTODOCK 4.2 and MGL TOOL 1.5.6 (Morris et al., 2009). Fifty orientations were generated for each ligand and results with surface analysis of graphical representation are shown using Discovery Studio Visualizer (Panda et al., 2016).
3 Results and discussion
3.1 Structural characterization
FTIR spectrum of HL showed a strong absorption peak at 1625 cm−1 due to azomethine group indicating the condensation of precursors to produce Schiff base. Appearance of resonance signals related to azomethine group in 1H and 13C NMR spectra respectively confirmed the formation of Schiff base. Moreover, absence of primary amine peak revealed its purity. Metal complexes were confirmed by the shifting of azomethine signal to lower wavenumber in FTIR spectra and appearance of new M–O and M–N peaks at specific regions. NMR spectra also ensured the coordination of ligand molecules with metal ion by up-field shifting of azomethine resonance signals and disappearance of proton resonance signal related to hydroxyl/nitrogen. The effective magnetic moment per metal atom was calculated from the expression (Dhankar et al., 2012; Ibrahim et al., 2014). where χm is the molar susceptibility of the complex obtained after applying diamagnetic corrections by the use of Pascal’s constant for other atoms and groups in the complex using Hg[Co(SCN)4] as the callibrant (Dhankar et al., 2012). The magnetic moment values obtained at 298 K for the cobalt complex under study was found to be 4.32 revealing paramagnetic character of the complex with distorted tetrahedral geometry around the Co(II) ion (Ispir, 2009; Tümer et al., 2006). These values are characteristics of monomeric d7 (e4g, t2g3) systems showing the presence of three unpaired electrons. Thermogravimetric analysis was used to explore the thermal stability of these newly synthesized compounds and to verify the status of water or solvent molecules whether to be inside or outside of the coordination sphere of the complexes (Ebrahimi et al., 2014; Shebl, 2014). Results of thermal analysis are in good agreement with the theoretical formulae as suggested from spectral analyses. TGA plot of ZnL2 complex gives distorted two decomposition steps. The first step is observed between 334 and 419 °C with a 13.14% (Calc.14.20%) loss belonging to the two —NO2 groups on the benzene rings. The remaining part of the complex decomposes in the second step between 552 and 754 °C with a loss of 72.96% (Calc.73.23%) leaving behind ZnO. CoL2 decomposed in the same manner with metallic cobalt as final residue. Details of TGA data are given in Table 1. The mass spectrum of [C34H22N4O6Zn] shows a molecular ion peak at m/z 646 due to [Zn(L)2]⨥ which is in accordance with the proposed formula of the complex. The other peaks at m/z values 616 and 586 may be due to the fragments [C34H22N3O5Zn]⨥ and [C34H22N2O4Zn]⨥ because of loss of NO. moiety. The peak at m/z 530 for the fragment [C34H22N2O4Zn]⨥ is due to the loss of 2CO.. The base peak at m/z 402 may be due to the fragment [C22H14N2O2Zn]⨥ (zinc metal linked to the various parts of the ligand) (Chandra et al., 2009; Khalil et al., 2012). The molecular ion peak for the Co(II) complex observed at 641 confirms the stoichiometry of metal chelates as [ML2] type. The weak peak at m/z 549 corresponds to [C34H22N2O2Co]⨥ formed by the loss of —NO2 group of the complex while the base peak at m/z 497 indicates possible formation of a fragment [C30H18N2O2Co]⨥ might be due to the loss of acetylene part (Anitha et al., 2013).
3.2 Crystal structure description
Molecular structure of HL along with numbering scheme is depicted in Fig. 1. Details of structural refinements and crystal data are summarized in Table 2. Selected bond lengths and bond angles are compared with computationally optimized parameters (Table 3). Results indicate the existence of Schiff base in keto form and computational findings are also in line with this confirmation (Fig. 4). Aromatic rings are present in the form of distorted hexagons due to the presence of attached groups. Literature survey also indicates similar findings for such compounds (Blagus et al., 2010). There exists a six membered ring due to intramolecular H-bonding of N—H⋯O type (Table 4) and the molecules are interlinked due to C—H⋯O interaction where C—H is from naphthalene ring and O-atom is of —NO2 group as shown in Fig. S2.
View of the molecular structure of HL (C17H12N2O3) with complete atom labeling scheme. Thermal ellipsoids are drawn at the 50% probability level. The H-atoms are drawn as small circles of arbitrary radii.
Identification code
HL
Empirical formula
C17H12N2O3
Formula weight
292.30
Temperature/K
296.15
Crystal system
Monoclinic
Space group
P21/n
a/Å
10.4631(13)
b/Å
4.7301(4)
c/Å
27.180(3)
α/°
90
β/°
97.700(5)
γ/°
90
Volume/Å3
1333.0(3)
Z
4
ρcalcg/cm3
1.4563
μ/mm–1
0.102
F(0 0 0)
608.3
Crystal size/mm3
0.42 × 0.28 × 0.24
Radiation
Mo Kα (λ = 0.71073)
2Θ range for data collection/°
3.02–52
Index ranges
−13 ≤ h ≤ 12, −5 ≤ k ≤ 5, −33 ≤ l ≤ 33
Reflections collected
10,745
Independent reflections
2603 [Rint = 0.0436, Rsigma = 0.0524]
Data/restraints/parameters
2603/0/199
Goodness-of-fit on F2
1.029
Final R indexes [I ≥ 2σ (I)]
R1 = 0.0473, wR2 = 0.1040
Final R indexes [all data]
R1 = 0.0992, wR2 = 0.1295
Largest diff. peak/hole/e Å−3
0.33/−0.37
Exp.
Calc.
Δ
Bond distance (Å)
O1
C1
1.288
1.255
−0.033
O2
N2
1.217
1.225
0.008
O3
N2
1.224
1.223
−0.001
N1
C11
1.312
1.342
0.030
N1
C12
1.404
1.398
−0.006
N2
C14
1.472
1.484
0.012
C10
C11
1.403
1.386
−0.017
Bond angles (°)
C12
N1
C11
128.1
127.9
−0.2
O3
N2
O2
122.9
124.7
1.8
C14
N2
O2
119.3
117.7
−1.6
C10
C11
N1
122.2
123.6
1.4
C2
C1
O1
118.9
120.2
1.3
C10
C1
O1
122.8
122.3
−0.5
C10
C1
C2
118.3
117.4
−0.9
C9
C10
C1
119.7
120.2
0.5
C11
C10
C1
118.7
118.7
0.0
C13
C12
N1
123.4
123.2
−0.2
C13
C14
N2
118.3
118.0
−0.3
C15
C14
C13
123.4
123.2
−0.2
D
H
A
d(D-H)/Å
d(H-A)/Å
d(D-A)/Å
D-H-A/°
N1
H1
O1
0.8600
1.818
2.531
139.04
3.3 Electronic absorption spectroscopy
Absorption spectra of 20 µM HL, ZnL2 and CoL2 in 9:1 mixture of ethanol and DMSO are depicted in Fig. 2(A). HL shows an intense peak at 222 nm with a shoulder peak at 248 nm and less intense peaks in the range 290–420 nm. The intense peak at 222 nm is thought to be due to benzene ring while the shoulder peak at 248 nm can be related to naphthalene moiety. The bathochromic shift in the peak position occurs due to the electron releasing —OH group at ortho position (Munir et al., 2013). Less intense peak at 315 nm can be attributed to π–π∗ transitions of imine group (—C⚌N) while the peaks at 369 and 418 nm are due to n-π∗ transitions of —C⚌N and —C⚌O groups. In case of metal complexes, shifting to peaks to longer wavelengths and appearance of new peak at 440 nm (for CoL2) and 483 nm (for ZnL2) can be assigned to ligand to metal charge transfer (MLCT) (Dhankar et al., 2012).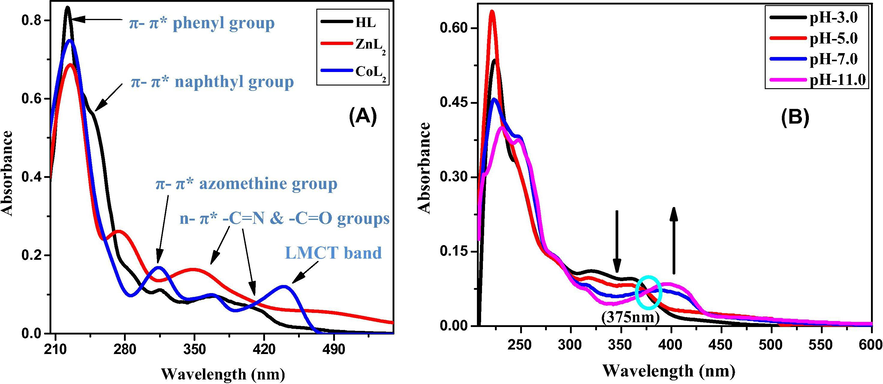
UV–Vis spectra of 20 µM HL, ZnL2 and CoL2 (A) and 20 µM HL in different pH media (B).
In order to determine the values of apparent dissociation constant (pKa), absorption spectra were also recorded in different pH media. Fig. 2(B) and Fig. S3 demonstrates the effect of pH on the UV–visible spectra of HL and ZnL2, respectively. It can be seen that change in the pH from acidic to basic region induces bathochromic shift which is due to the deprotonation of molecules in the basic region causing decrease in the band gap hence making the transitions more favorable (Munir et al., 2013). Detailed observation of the spectra reveals that the peaks in the range 340–420 nm are strongly affected by the change in pH of the medium. In case of HL, appearance of an isosbestic point at 375 nm is due to —OH group and it ensures the existence of its tautomeric forms with same value of molar absorptivity coefficient (Ahmad et al., 2014; Blagus et al., 2010). No regular shift was observed in the peak positions of CoL2. Molar extinction coefficient (ɛ) and acid dissociation constant (pKa) of these molecules are given in Table 5.
Codes
λmax (nm)
ɛ × 10−4 (M−1 cm−1)
pKa
Kb × 10−3 (M−1)
K × 10−3 (M−1)
HL
222
4.05
7.0
2.09
4.81
ZnL2
225
3.82
7.0
5.68
9.03
CoL2
225
3.34
–
4.60
8.52
3.4 Cyclic voltammetry
Fig. 3 represents cyclic voltammograms of HL and its metal complexes obtained at 100 mV s−1 in the medium of pH-7.0. In case of HL, starting the potential sweep from 0 to +1.5 V an oxidation signal a1 appeared at 0.8 V followed by another oxidation signal a2 at 1.14 V. Absence of counter reduction peaks in the reverse scan confirmed the irreversible nature of both the oxidation steps.
Cyclic voltammograms of HL, ZnL2 and CoL2 obtained at 100 mV s−1 in solution of pH 7.0.
Inhibition profile of alkaline phosphatase at different concentrations of HL, ZnL2 and CoL2.
Two reduction peaks, c1 at −0.37 V and c2 at −0.82 V appear in the negative potential window with counter oxidation peaks at −0.61 V ( ) and −0.14 V ( ) respectively, indicating the oxidation of reduced products in the reverse scan. Same number of peaks was observed in the second and third scan with decrease in the peak current indicating the adsorption of reduced products on the surface of working electrode. ΔEp values greater than 60 mV and ipc/ipa ratio less than one ensured the quasi-reversible nature of both the reduction steps (Munir et al., 2013). Moreover, half peak width of 38 mV and 63 mV indicated involvement of two electrons at peak c1 and one electron at peak c2, respectively. For metal complexes similar voltammograms were observed with cathodic shift in the peak potentials. This shift indicates the modulation in the basic structure of electrophores after the substitution of metal ions which increases the charge density of the related atoms (Shah et al., 2013). These finding are also supportive to spectroscopic and computational results.
3.5 Computational studies
Geometries of HL and metal complexes were optimized at B3LYP level using 6-311++G∗∗ and 6-311G++ basis sets, respectively. Reason for selection of these sets was their success towards charge calculation (Rauf et al., 2017a). Keto form of HL appeared to be most stable configuration as evidenced by X-ray analysis and calculated bond lengths and bond angles are in good agreement with experimental results (Table 3). Both metal complexes were found to possess tetrahedral geometry as shown in Fig. S4.
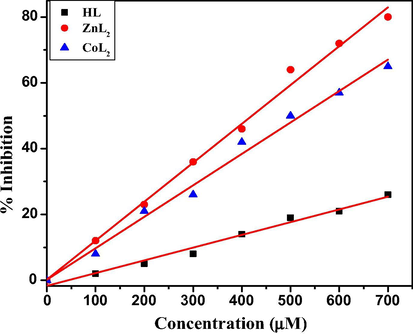
3.6 Inhibition of ALP
Alkaline phosphatase is a clinically important hydrolase enzyme responsible for dephosphorylation of molecules to enhance diffusion of molecules into interior of the cells and to provide inorganic phosphates to cell during phosphate starvation (Galdiero et al., 2012; Horiuchi et al., 1959). In humans, it is produced in placenta, kidney, liver and growing bones and its abnormal amounts cause many diseases like hypothyroidism, leukemia and breast cancer (Lorente et al., 1999; Rauf et al., 2015). Schiff bases and their metal complexes are reported to show best inhibition activities against ALP enzymes by blocking their active sites (Rauf et al., 2017a), therefore an effort was made to explore the potential of inhibition. Results reveal that inhibition of enzyme increases in concentration dependent manner and metal complexes were found potent inhibitors as compared to HL (Fig. 4).
3.7 Antimicrobial activities
HL and its metal(II) complexes were screened to see their in vitro response against various bacterial strains (Escherichia coli, Bacillus subtilis, Staphlocuccus aureus and Pasturella multocida) and fungi (Alternaria alternata, Ganoderma lucidum Aspergillus niger and Penicillium notatum) by disc diffusion method (Hussain et al., 2015). Streptomycin and fluconazole were used as the positive controls for antibacterial and antifungal screening tests, respectively. A recommended concentration of a reference drug (1mg/1ml of solvent) (Bhalodia and Shukla, 2011) was introduced into the discs and the zones of inhibition were measured in millimeters. All the measurements were repeated thrice and the average inhibition data has been represented in Fig. 5. The free ligand (HL) was found less active against the microorganisms. The coordination of ligand molecules with metal ions has induced markable antimicrobial activities in consequent complexes. The results demonstrate that each of the coordinated metals (Zn & Co) plays an important role in biological actions of such complexes. The efficacy of complexes was found to be more potent inhibitors of fungi as compared to bacterial growth while the zinc complex
was found to exhibit greater inhibition activity.
Comparison of antibacterial and antifungal activities of HL, ZnL2, CoL2. Concentration = 1 mg/mL in DMSO; 0 = No activity, 5–10 = Activity present, 11–25 = Moderate activity, 26–40 = Strong activity; Antibacterial values are mean ± S.D of samples analyzed individually in triplicate at p < .1.
3.8 In vitro cytotoxicity analysis
Ligand and its metal derivatives (ZnL2 and CoL2) were investigated for their morphological (Fig. 6A) and cytotoxic (Fig. 6B) effects against HepG2. Cultures were exposed to the synthesized compounds at a concentration of 200 μg/ml for 24 h, and their percentage viability was measure by SRB assay. The compounds induced strong growth arrest and morphological changes in the cells causing them to become fibrous and elongated. HL (relative viability = 21.7 ± 2.15) have shown strong toxic effect against the cells, this effect was further enhanced in ZnL2 (relative viability = 6.23 ± 1.51) whereas CoL2 (relative viability = 69.02 ± 3.57) exhibited only moderate effect on the viability of HepG2 cells. The induction of morphological changes in cells is associated with intricate molecular mechanisms leading to programmed cell death (Alam et al., 2016; Ke et al., 2016).
(A) Morphological effects of HL, ZnL2, CoL2 on HepG2 cells. Unexposed, DMSO (negative control) and Doxorubicin (positive control) were included as experimental controls (B) Effect of the synthesized Schiff base and its metal complexes (HL, ZnL2, CoL2) on viability of HepG2 cells. Exponentially growing cultures were treated with the compounds (200 µg/ml) for 24 h and percentage viabilities (mean ± SD) were calculated relative to the unexposed samples using SRB assay. *P < .01 when compared to untreated control sample, **P < .01 in comparison with respective Schiff base (two tailed t-test).
3.9 In vivo antidiabetic activity
Statistically significant difference was observed in the blood glucose level of diabetic mice treated with all three synthesized compounds (F = 170, P < .001). HL has shown antidiabetic potential, while
and
have shown diabetic potential. Treatment with HL significantly lowered the blood glucose level of the mice as compared to negative control group of mice (P < .001), positive control group (P < .05),
treated group mice (P < .001) and
treated group mice (P < .001). In contrast, a high level of increase (P < .001) was observed in the glucose level of mice treated with
and
as compared to the positive control group. The concentration was comparable (P > .05) in case of
treated group versus saline treated group. The antidiabetic potential of
compound was lower than the HL compound but higher as compared to
(P < .001) and the negative control group (P < .001) (Fig. 7A).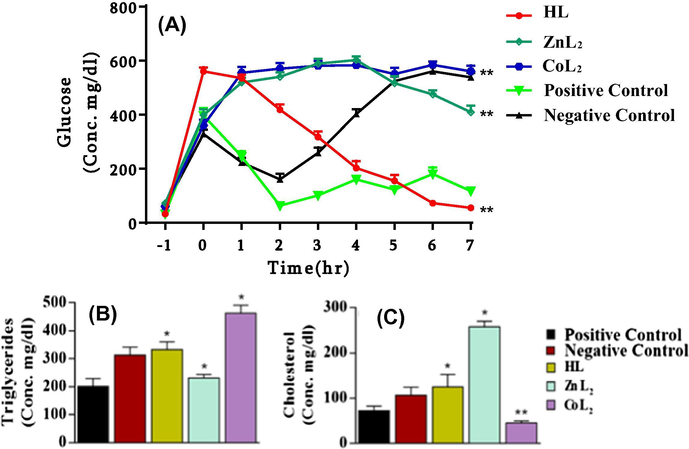
Blood glucose concentration (A), Serum triglycerides concentration (B) and cholesterol concentration (C) in mice treated with the compounds HL,
and
. **P < .001 and *P < .05.
Treatments with these synthesized compounds have also shown marked effects on the concentrations of both serum triglycerides and cholesterol of diabetic mice (F = 15.42, P < .001; F = 28.08, P < .001). Serum triglycerides level of HL treated mice group was higher in comparison with positive group animals (P < .01) and treated animals (P < .05). Likewise the increase was also observed upon treatment with complexes but has produced a significant increase (P < .001) than as compared to the negative control group mice (P < .01) (see Fig. 7A). Fig. 7B indicates that HL and increased the blood cholesterol level (P < .05) while has produced marked decrease (P < .001) as compared to positive as well as negative controls.
3.10 Interaction with DNA
Electronic absorption spectroscopy is an easy and efficient method to validate binding information of chemical compounds with different biological molecules. Hyperchromic or hypochromic effect with or without bathochromic or hypsochromic effect produced in the absorption spectrum, after binding of the compound with DNA (or any other biological molecule) gives a diagnostic criterion towards the binding mode of interaction (Ghosh et al., 2011;Ghosh et al., 2010). The absorption spectra of 20 µM HL and its zinc complex in the presence of different amounts of ct-DNA are shown in Fig. 8. Addition of successive amounts of ct-DNA to HL solution induced hypochromic effect with slight bathochromic shift and this effect is quite markable in case of metal complexes. Both these effects indicate the intercalation of drug molecules with base pairs of ct-DNA. Interaction of π orbital of DNA molecule with π∗ orbital of drug molecule decreases energy of π∗ orbital, hence band gap decreases and a bathochromic shift is observed. Moreover, coupling of drug with DNA decreases probability of electronic transition causing hypochromic effect (Rajski and Williams, 1998; Shujha et al., 2010; Sirajuddin et al., 2013). In order to quantify the binding of compound with ct-DNA, Benesi-Hildebrand equation was applied and the most intense band was used to measure the changes in absorbance. Plots of Ao/A − Ao versus 1/[DNA] are shown in Fig. 8C and the values of binding constants are given in Table 5. Smaller values of Kb are suggestive weak interaction between drug molecules and the nucleotides.![UV–Vis spectra of 20 µM HL (A), ZnL2 (B) at pH-7.4 (phosphate buffer) in the absence and presence of different amounts of DNA. Plot of A/A-Ao against 1/[DNA] for the titration of CT-DNA with HL, ZnL2, CoL2 (C).](/content/184/2020/13/1/img/10.1016_j.arabjc.2017.09.015-fig9.png)
UV–Vis spectra of 20 µM HL (A), ZnL2 (B) at pH-7.4 (phosphate buffer) in the absence and presence of different amounts of DNA. Plot of A/A-Ao against 1/[DNA] for the titration of CT-DNA with HL, ZnL2, CoL2 (C).
Cyclic voltammetry is also a very useful technique to find interaction of drug molecules with DNA. Cathodic or anodic peak shift with increase or decrease in peak current indicates mode of interaction. Cyclic voltammograms of 1mM HL and metal complexes in the absence and presence of 100 nm ct-DNA at physiological pH-7.4 are depicted in Fig. 9. Negative potential window was selected to record cyclic voltammograms due to sharp and well resolved reduction peaks and peak C1 was used for measurement of binding constants. Addition of ct-DNA induced anodic shift in peak potential accompanied with the decrease in peak current. This positive shift is produced because of increase in charge density after interaction with anionic phosphate base pairs making the reduction more feasible and is suggestive towards intercalation of drug into base pair pockets of DNA (Shah et al., 2013; Sirajuddin et al., 2013). Decrease in the intensity of peak can be explained by the unavailability of compounds after interacting with DNA and it was used to calculate binding constant from the intercept of the plot of
versus
shown in (Fig. 9C). The K values are in the range of 4.81 − 9.03 × 10³ indicate their moderate interaction via intercalation mode and indicate their potential as anti-cancer drug. However, these findings do not provide enough data for their clinical usage and more experiments are required to clarify the interactions.![Cyclic voltammograms of HL (A) and CoL2 (B) in the absence and presence of 100 nM CT-DNA at pH-7.4 (using phosphate buffer) obtained at scan rate of 100 mV s−1. Plots of log (1/[DNA]) against log (I/Io − I) (C).](/content/184/2020/13/1/img/10.1016_j.arabjc.2017.09.015-fig10.png)
Cyclic voltammograms of HL (A) and CoL2 (B) in the absence and presence of 100 nM CT-DNA at pH-7.4 (using phosphate buffer) obtained at scan rate of 100 mV s−1. Plots of log (1/[DNA]) against log (I/Io − I) (C).
3.11 Molecular docking analysis
The molecular docking studies help to describe the inhibitory potential and predict the binding mode or mechanism of chemical moieties in the enzyme pocket (Qurrat-Ul-Ain et al., 2014). The appropriate orientation of compound HL, ZnL2 and CoL2 was predicted with respect to topoisomerase II and its geometric and energetic conformations in the binding site of enzyme were obtained. It has been observed that ZnL2 and CoL2 showed putative binding energy and competent chemistry in binding pocket of topoisomerase II. Schiff base have shown two π–alkyl interactions with LYS 798 and MET 766 along with weak π-sulfur bond between MET 766 and DG 10 with aromatic rings. In case of zinc metal complex, two hydrogen bonds were observed between the —NO2 of ZnL2 with THR 934 and GLN 938 while LYS 798 and MET 766 were found to show two π-alkyl interactions with the aromatic rings adjacent to zinc atom. Other weak π-cation and π-anion interactions were also observed with the DA8, DC9 and DG10 nucleotides of DNA stand as shown in Fig. 10. Three hydrogen bonds were observed in case of CoL2, two were between the —NO2 group of nitroaniline with GLN938, and THR934 and one between the aromatic part of nitroaniline and LYS798. A π–sulfur interaction was also observed by the sulfur group of MET766 and weak π-anion interactions were observed with DA8, DC9 and DG10 base pairs of DNA strand, as shown in Fig. S5.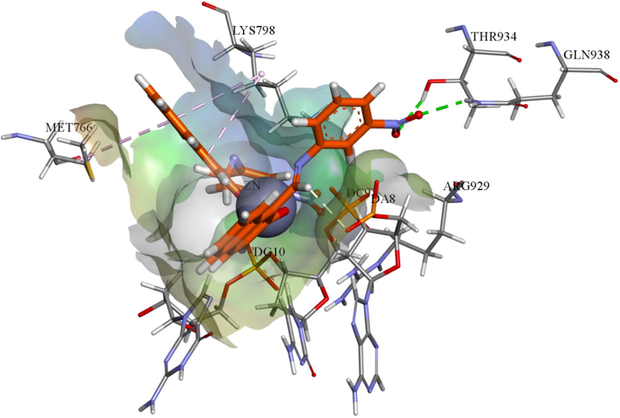
The binding affinities of compounds ZnL2; Ball and stick, showing hydrogen bonds (green doted lines) and π-alkyl interactions (rose pink doted lines) involving flexible docking into 4FM9.
4 Conclusion
A novel Schiff base and its two metal complexes were synthesized and characterized by various techniques. FTIR, NMR, elemental analysis, EIS-MS and TGA ensured the formation of compounds. XRD results indicated the existence of Schiff base molecule in keto form and presence of H-bonding. Computational studies were also used to support these outputs and ensure the geometry of metal complexes. Combining all these results leads to tetrahedral geometry of metal complexes. Photometric behavior was evaluated in a wide pH range and it was found to be strongly pH dependent. In electrochemistry, Schiff base as well as metal complexes were found to oxidize and reduce in two steps. Furthermore, metal complexes were found good inhibitors of alkaline phosphatase enzyme as well as fungal/bacterial growth than Schiff base. Moreover, biological screening indicates that ligand has good antidiabetic activity as compared to metal complexes. Cholesterol and triglyceride levels were also affected by ligand as well as metal complexes and appeared as potent candidate for anti-cholesterol uses. ZnL2 was found to be most active against cancer cell. Photometric and voltammetric titration results indicate that these compounds bind to ct-DNA through intercalation mode. Docking studies also indicates the binding sites and their interaction with topoisomerase II. As per in vitro analysis, the significance of metal complexes was more efficient than no metallic moiety. Further efforts should be made to precisely explore the possible in vivo as well as in vitro application and mechanism of their activity.
Acknowledgements
The authors gratefully acknowledge the financial support of the Higher Education Commission of Pakistan through project number 21-1209, CIIT Abbottabad and Quaid-i-Azam University Islamabad.
References
- BioMed. Res. Int. 2016
- [CrossRef]
- RSC Adv.. 2014;4:31657-31665.
- PloS One. 2016;11:e0167536.
- Int. J. Inorg. Chem. 2013
- Prog. Org. Coat.. 2006;56:100-110.
- J. Mol. Struct.. 2017;1141:563-576.
- J. Adv. Pharm. Technol. Res.. 2011;2:104-109.
- Maced. J. Chem. Chem. Eng.. 2010;29:117-138.
- Acta Crystallogr. Sect. A. 2015;71:59-75.
- CHEMIK nauka-technika-rynek. 2014;1:129-134.
- J. Appl. Crystallogr.. 2007;40:609-613.
- Bioinorg. Chem. Appl. 2009
- [CrossRef]
- J. Adv. Res.. 2011;2:1-8.
- Spectrochim. Acta Part A. 2012;93:348-353.
- J. Sci. Ind. Res.. 1982;41:501-506.
- J. Appl. Crystallogr.. 2009;42:339-341.
- Spectrochim. Acta Part A. 2014;117:485-492.
- J. Mol. Struct.. 2017;1146:153-163.
- J. Mol. Struct.. 2017;1134:444-457.
- Corros. Sci.. 2006;48:3243-3260.
- Curr. Protein Pept. Sci.. 2012;13:843-854.
- Inorg. Chim. Acta. 2011;375:77-83.
- Eur. J. Med. Chem.. 2010;45:3770-3779.
- Nature. 1959;183:1529-1530.
- J. Lumin.. 2010;130:360-364.
- J. Coord. Chem.. 2015;68:662-677.
- Dyes Pigm.. 2009;82:13-19.
- J. Iran. Chem. Soc.. 2012;9:307-320.
- Chem. Phys. Lett.. 2011;514:114-118.
- J. Catal.. 2013;2013
- [CrossRef]
- J. Saudi Chem. Soc.. 2016;20:69-80.
- Med. Res. Rev.. 2016;36:983-1035.
- Open J. Inorg. Chem.. 2012;2:13.
- Microb. Pathog.. 2017;110:414-425.
- Eur. J. Nucl. Med.. 1999;26:625-632.
- J. Mol. Struct.. 2016;1120:239-244.
- J. Saudi Chem. Soc. 2017
- [CrossRef]
- J. Comput. Chem.. 2009;30:2785-2791.
- Electrochim. Acta. 2013;88:858-864.
- Genomics Data.. 2016;7:189-194.
- Struct. Chem.. 2004;15:587-598.
- Int. J. Chem. Tech. Res.. 2011;3:1891-1896.
- Talanta. 2015;132:541-547.
- Inorg. Chim. Acta. 2014;423:220-228.
- Chem. Rev.. 1998;98:2723-2796.
- Spectrochim. Acta Part A. 2015;138:58-66.
- Spectrochim. Acta Part A. 2017;176:155-167.
- J. Mol. Struct.. 2017;1145:132-140.
- J. Electrochem. Sci. Eng.. 2013;3:19-27.
- Spectrochim. Acta Part A. 2014;117:127-137.
- Adv. Catal.. 1976;25:272-413.
- Eur. J. Med. Chem.. 2010;45:2902-2911.
- J. Photochem. Photobiol. B. 2013;124:1-19.
- J. Natl. Cancer Inst.. 1990;82:1107-1112.
- Transit. Met. Chem.. 2006;31:1-12.
- J. Mol. Biol.. 2012;424:109-124.
- Blood. 2004;103:4659-4665.
Appendix A
Supplementary material
Supplementary data associated with this article can be found, in the online version, at https://doi.org/10.1016/j.arabjc.2017.09.015.
Appendix A
Supplementary material
Supplementary data 1
Supplementary data 1


