

Translate this page into:
Synthesis, spectral study and application of solid state fluorescent reactive disperse dyes and their antibacterial activity
⁎Corresponding author: Dyeing, Printing & Textile Auxiliaries Department, Textile Research Division, National Research Centre, 33 El Buhouth st, PO Box: 12311, Dokki, Giza, Egypt. tarekaysha@hotmail.com (Tarek Aysha)
-
Received: ,
Accepted: ,
This article was originally published by Elsevier and was migrated to Scientific Scholar after the change of Publisher.
Peer review under responsibility of King Saud University.
Abstract
New solid state hydrazone fluorescent reactive disperse dyes based on pyrrolinone ester and temporarily anionic sulfatoethylsulfone moiety were prepared. The NMR of all prepared dyes was studied in details; these dyes were observed only in pure hydrazone form as a mixture between E/Z isomers. Spectral properties of prepared dyes were studied and all dye derivatives showed significant fluorescence at low temperature (77 K) as well as in polycrystalline solid state. The dyeing application of these dyes was investigated on polyamide 6 and wool fabrics. The emission spectra on the dyed fabrics were measured. The antibacterial activity of the reactive disperse dyes as well as dyed fabrics at different concentrations was studied against Staphylococcus aureus as Gram-positive bacteria and Escherichia coli as Gram-negative bacteria. The dyed samples exhibited a higher antibacterial activity compared with selected antibiotics as reference standard.
Keywords
Reactive disperse dyes
Fluorescence
Hydrazone dyes
Antibacterial
Polyamide
Wool

1 Introduction
Azo dyes represent the most interesting class of dyes among all known categories of dyestuffs which contributes to more than 60% of colorants in the dye market. The synthesis of azo dyes is economically advantaged, by diazotization of a broad variety of aromatic or heteroaromatic amines and coupling with a wide choice of coupling components offering many derivatives of azo dyes (Zollinger, 1991). Azo dyes with at least one aprotic group in conjugation with the azo group are characterized by forming azo-hydrazon tautomerization (Kelemen et al., 1982). In some cases a pure hydrazone dyes can be prepared by diazo-coupling reaction as a mixture between E/Z isomers, and earlier we studied the azo coupling reaction based on pyrrolinone ester; the hydrazone tautomers of the diazo-coupling product have been confirmed by 13C and 15N chemical shifts, and characterized as a mixture of E/Z isomers according to nJ (15N, 13C) coupling constants (Lycka et al., 2010; Aysha et al., 2011; Aysha et al., 2013a,b). Furthermore, heterocyclic azo dyes have received considerable attention in the field of advanced colorants (Manuela et al., 2009; Shawali et al., 2002; Fozooni et al., 2008; Kamlet et al., 2007; Ahmad et al., 2015; Katritzky and Rees, 1984). Nevertheless, the majority of the developments concerning heterocyclic dyes have tended to focus on specific compounds incorporating new chemical functionalities for potential application in diverse fields including biological applications, photodynamic therapy, lasers, reprographic technology, functional colorants, nonlinear optical systems and data storage applications (Sternberg and Dolphin, 1990; Gregory, 1994; Mekkawi and Abdel-Mottaleb, 2005; Matsuoka, 1990; Sainsbury, 1991; Waring and Hallas, 1990). Fluorescence properties of dyes can be observed due to the absorption and emission of electromagnetic radiation in visible area. Solid state fluorescent azo dye is rare and not easy to prepare such solid state dyes due to quenching of fluorescence by azo group. The application of the fluorescent dyes in textile dyeing can be used for increasing the brightness of the color and can be used for some specific materials as high visibility textile product (Szuster et al., 2004). Further approaches toward the development of new disperse dyes bearing a temporarily anionic sulfatoethylsulfone (SES) group have been investigated (Mousa et al., 2006; Youssef et al., 2007; Hinks et al., 2003; Lee et al., 2001). Incorporation of such fiber reactive group onto the disperse dye molecule opens the prospect of increasing dye-fiber fixation and fastness properties for polyamide fibers because of its temporarily anionic and water solubility characters.
Bacteria and fungi cause biological degradation of the textile materials and have hazard effect on their properties so that several studies made to impart its antibacterial properties finishing with some natural and synthetic dyes especially the dyes that contain a heterocyclic moiety that increases the antibacterial affinity (Farouk et al., 2013; Abou-Zied et al., 2013; Rizk et al., 2015; Rizk et al., 2017).
As part of our ongoing interest to improve the synthetic approaches of pyrrolinone ester based disperse dyes, it is envisioned that the introduction of SES into pyrrolinone azo dye structure can form a hydrazone reactive disperse dyes which may serve as high performance derivatives. In the present study, we report the synthesis and characterization of a series of new reactive disperse dyes based on pyrrolinone ester coupling components and SES based diazo derivatives. The absorption and emission spectra of the prepared dyes in different environments (at low temperature 77 K and solid state) were studied. Dyeing and color fastness properties of the dyes on wool and polyamide fabrics were studied. The emission on the dyed fabrics was studied. The antibacterial activity of the dye solutions and the dyed fabrics were also investigated.
2 Experimental
2.1 Materials and equipments
1-Aminobenzene-4-β-sulfatoethylsulfone (PABSES; 95%) was obtained from Synthesia a.s. Pardubice, Czech Republic. Pyrrolinone ester intermediates PES (ethyl-4,5-dihydro-5-oxo-2-aryl(1H)pyrrole-3-carboxylate) were prepared according to previously reported procedures [3-5]. 2-Methyltetrahydrofurane (spectroscopic grade) was purchased from Fluka.
The absorption spectra were measured at room temperature in water using a Perkin-Elmer Lambda 35 spectrophotometer with 1 cm path length quartz cuvettes. Spectrophotometer Perkin-Elmer (P.-E.) LS 55 was used for the measurement of fluorescence spectra at low temperature. 2-Methyltetrahydrofuran (MTHF) was used as a solvent to create an organic frozen glass to measure low temperature fluorescence spectra using a commercial low temperature accessory also from P.-E. This accessory contains an isolated box filled by liquid nitrogen and the measurements are carried out in a round cuvette (diameter about 1 mm). The solid state luminescence spectra were recorded also on the same instrument equipped with a P.-E accessory for solid state measurements. Polycrystalline samples were placed under quartz plate and the emission spectra were recorded using front face geometry. The emission spectra on the dyed fabrics (polyamide-6 and wool) were measured by JASCO FP8300 spectrofluoremeter instrument using a special sphere holder for dyed textile sample measurements.
An EA 1108 FISONS instrument was used for the elemental analysis. Thin-layer chromatography (TLC) was performed by a Kieselgel 60 F254 (Merck, Darmstadt, Germany), for observation of reaction progress and determination of the purity of the prepared intermediates and dyes.
Positive-ion and negative-ion atmospheric pressure chemical ionization (APCI) mass spectra were measured on an ion trap analyzer Esquire 3000 (Bruker Daltonics, Bremen, Germany) in the range m/z 50–1000. The samples were dissolved in acetonitrile and analyzed by direct infusion at the flow rate 100 μL⋅min−1. The selected precursor ions were further analyzed by MS/MS analysis under the following conditions: the isolation width m/z = 4, the collision amplitude in the range 0.7–1.0 V depending on the precursor ion stability, the temperature of drying gas was 330 °C, the APCI temperature was 400 °C, the tuning parameter compound stability was 100%, and the flow rate and the pressure of nitrogen were 4 mL⋅min−1 and 45 psi, respectively.
FT/IR spectra were recorded using JASCO FT/IR-4700 spectrometers with high resolution 0.4 cm−1 using ATR accessory.
The 1H and 13C NMR spectra were recorded at room temperature on a Bruker Avance II 400 spectrometer at 400.13 MHz and 100.62 MHz, respectively. The samples were dissolved in hexadeuteriodimethyl sulfoxide. The 1H and 13C NMR chemical shifts were referenced to the central signal of the solvent (δ = 2.55 and 39.6, respectively).
2.2 Synthesis of dyes
Starting pyrrolinone esters (PES) intermediates (ethyl-4,5-dihydro-5-oxo-2-phenyl(1H)pyrrole-3-carboxylate (1), ethyl-4,5-dihydro-5-oxo-2-thienyl(1H)pyrrole-3-carboxylate (2) and ethyl-4,5-dihydro-5-oxo-2-(4-bromophenyl)(1H)pyrrole-3-carboxylate (3) were synthesized according to procedures published earlier (Aysha et al., 2013a,b; Aysha et al., 2015).
General procedure for dye synthesis
The diazo-coupling reaction was carried out by diazotization of primary aromatic amines (PABSES) followed by a coupling reaction. 2.95 g, 0.01 mol of 1-aminobenzene-4-β-sulfatoethylsulfone (PABSES; 95%) was suspended in water (30 mL) at 20 °C. The pH of the suspension was increased to 5.5 by adding some drops of 2 M sodium carbonate solution and the resulting solution was filtrated to separate any solid impurities. To this solution hydrochloric acid (36%; 2.8 mL; 3 mol) and ice (15 g) were added. The temperature of the above mentioned solution was decreased to 0 °C. A solution of sodium nitrite (0.7 g; 0.01 mol) in water (10 mL) was introduced in small portions over 30 min to the mixture. After the addition of all sodium nitrite the reaction was stirred under the above conditions for further 30 min. By using iodide-starch paper, the excess of nitrous acid was checked by forming blue color on the paper, and this excess was destroyed by adding small portion of sulfamic acid till this blue color disappear (Lewis et al., 2001).
The appropriate PES derivative (0.01 mol) was dissolved in 100 mL ethanol by refluxing under inert gas to avoid the oxidation, and then the mixture was cooled down in an ice bath, at 0 °C. The previously prepared diazonium salt was added portionwise to the PES dispersion, the mixture was allowed to stirring at low temperature for further 4 h and the temperature was gradually increased to room temperature, the reaction mixture was stirred overnight at RT. To the reaction mixture 5%/volume of sodium chloride salt was added to precipitate the dye in its salt form. The resulting precipitated product was collected by filtration, washed well with a 50% ethanol-water mixture and dried in a vacuum oven at 50 °C, to offered dyes 1, 2 and 3, respectively. The dyes were purified by dissolving in DMF at RT and reprecipitated by cyclohexan.
Ethyl-4-[2-(4-phenylsulfonylethylsulfate)hydrazinylidene]-5-oxo-2-phenyl-4,5-dihydro-1H-pyrrole-3-carboxylate (Dye 1). Brilliant yellow powder. Yield (76%); m.p = 186–189 °C.
1H NMR (400 MHz, DMSO-d6, δ, ppm) Z isomer: 1.22 (3H, t, 3J = 7.2 ± 0.2 Hz, CH3); 3.60 (2H, t, 3J = 7.2 ± 0.2 Hz, CH2); 3.95 (2H, t, 3J = 7.2 ± 0.2 Hz, CH2); 4.18 (2H, q, 3J = 7.2 ± 0.2 Hz, CH2); 7.40–7.88 (9H, m, aromatic protons); 11.46 (1H, br. s, —CONH—); 13.18 (1H, br. s, —NHN⚌).
1H NMR (400 MHz, DMSO-d6, δ, ppm) E isomer: 1.02 (3H, t, 3H, t, 3J = 7.2 ± 0.2 Hz, CH3); 3.51 (2H, t, 3J = 7.2 ± 0.2 Hz, CH2); 3.85 (2H, t, 3J = 7.2 ± 0.2 Hz, CH2); 4.07 (2H, q, 3H, t, 3J = 7.2 ± 0.2 Hz, CH2); 7.40–7.88 (9H, m, aromatic protons); 11.39 (1H, br. s, —CONH—); 13.05 (1H, br. s, —NHN⚌).
13C NMR (100 MHz, DMSO-d6, δ, ppm): 13.98 (CH3), 55.99, 55.19, 59.80 (3 × CH2), 113.01, 127.74, 128.91, 129.9, 130.50 (all CH), 102.12, 129.30, 131.7, 132.31, 146.96, 149.09 (all quaternary C), 161.19 (COO), 164.20 (C⚌O).
MS analysis, M = 545.5; positive-ion MS: m/z 546.5 [M+H]+, 100%; m/z 500 [M+H-C2H5OH]+, negative-ion MS: m/z 544 [M−H]−, 100%; m/z 498 [M−H-C2H5OH]−.
IR (ATR), νmax/cm−1: 3451, 3203, 3026, 2982, 1684, 1550, 1501, 1416, 1217, 1126, 1052, 983, 756, 553.
Elemental analysis: calculated (C21H20N3NaO9S2): C (46.24%), H (3.70%), N (7.70%). Found: C (46.31%), H (3.79%), N (7.75%).
Ethyl-4-[2-(4-phenylsulfonylethylsulfate)hydrazinylidene]-5-oxo-2-thienyl-4,5-dihydro-1H-pyrrole-3-carboxylate (Dye 2). Brilliant orange powder. Yield (71%); m.p = 189–191 °C.
1H NMR (400 MHz, DMSO-d6, δ, ppm) Z isomer : 1.38 (3H, t, 3J = 7.2 ± 0.2 Hz, CH3); 3.61 (2H, t, 3J = 7.2 ± 0.2 Hz, CH2); : 3.95 (2H, t, 3J = 7.2 ± 0.2 Hz, CH2); 4.32 (2H, q, 3J = 7.2 ± 0.2 Hz, CH2); 7.25 (1H, t, J = 4.6 ± 0.2 Hz, CH thieny); 7.61 (2H, d, J = 8.4 ± 0.2 Hz, 2 × CH phenyl) 7.85 (2H, d, J = 8.4 ± 0.2 Hz, 2 × CH phenyl); 7.93 (1H, d, J = 4.6 ± 0.2 Hz, CH thieny); 7.96 (1H, d, J = 4.6 ± 0.2 Hz, CH thieny); 11.60 (1H, br. s, —CONH—); 13.05 (1H, br. s, —NHN⚌).
1H NMR (400 MHz, DMSO-d6, δ, ppm) E isomer: 1.10 (3H, t, 3J = 7.2 ± 0.2 Hz, CH3); 3.51 (2H, t, 3J = 7.2 ± 0.2 Hz, CH2); 3.80 (2H, t, 3J = 7.2 ± 0.2 Hz, CH2); 4.15 (2H, q, 3J = 7.2 ± 0.2 Hz, CH2); 7.25 (1H, t, J = 4.6 ± 0.2 Hz, CH thieny); 7.61 (2H, d, J = 8.4 ± 0.2 Hz, phenyl) 7.85 (2H, d, J = 8.4 ± 0.2 Hz, phenyl); 7.93 (1H, t, J = 4.6 ± 0.2 Hz, CH thieny); 7.96 (1H, t, J = 4.6 ± 0.2 Hz, CH thieny); 11.38 (1H, br. s, —CONH—); 12.65 (1H, br. s, —NHN⚌).
13C NMR (100 MHz, DMSO-d6, δ, ppm): 14.24 (CH3), 55.01, 59.25, 60.06 (3 × CH2), 114.20, 127.27, 129.66, 131.68, 133.30 (all CH), 100.55, 130.09, 132, 132.21, 141.78, 147 (all quaternary C), 161.08 (COO), 162.52 (C⚌O).
MS analysis, M = 551.54; positive-ion MS: m/z 552.5 [M+H]+, 100%; m/z 506 [M+H-C2H5OH]+, negative-ion MS: m/z 550 [M−H]−, 100%; m/z 504 [M−H-C2H5OH]−.
IR (ATR), νmax/cm−1: 3454, 3214, 3083, 2979, 1676, 1562, 1502, 1434, 1212, 1124, 1059, 982, 730, 532.
Elemental analysis: calculated (C19H18N3NaO9S3): C (41.38%), H (3.29%), N (7.62%). Found: C (41.49%), H (3.36%), N (7.70%).
Methyl-4-[2-(4-phenylsulfonylethylsulfate)hydrazinylidene]-5-oxo-2-(4-bromophenyl)-4,5-dihydro-1H-pyrrole-3-carboxylate (Dye 3). Brilliant yellow powder. Yield (79%); m.p = 210–212 °C.
1H NMR (400 MHz, DMSO-d6, δ, ppm) Z isomer : 3.72 (3H, s, 3J = 7.2 ± 0.2 Hz, CH3); 3.55 (2H, t, 3J = 7.2 ± 0.2 Hz, CH2); 3.95 (2H, t, 3J = 7.2 ± 0.2 Hz, CH2); 7.58 (2H, dd, J = 8.6 ± 0.2 Hz, CH ArH); 7.63 (2H, d, J = 8.6 ± 0.2 Hz, 2 × CH ArH); 7.70 (2H, dd, J = 8.6 ± 0.2 Hz, 2 × CH ArH); 7.86 (2H, d, J = 8.6 ± 0.2 Hz, 2 × CH ArH); 11.53 (1H, br. s, —CONH—); 13.07 (1H, br. s, —NHN⚌).
1H NMR (400 MHz, DMSO-d6, δ, ppm) E isomer: 3.64 (3H, s, 3J = 7.2 ± 0.2 Hz, CH3); 3.52 (2H, t, 3J = 7.2 ± 0.2 Hz, CH2); 3.84 (2H, t, 3J = 7.2 ± 0.2 Hz, CH2); 7.58 (2H, dd, J = 8.6 ± 0.2 Hz, CH ArH); 7.63 (2H, d, J = 8.6 ± 0.2 Hz, 2 × CH ArH); 7.70 (2H, dd, J = 8.6 ± 0.2 Hz, 2 × CH ArH); 7.86 (2H, d, J = 8.6 ± 0.2 Hz, 2 × CH ArH); 11.42 (1H, br. s, —CONH—); 12.97 (1H, br. s, —NHN⚌).
13C NMR (100 MHz, DMSO-d6, δ, ppm): 51.15 (CH3), 55.03, 59.22, (2 × CH2), 114.39, 129.68, 129.96, 130.86 (all CH), 102.19, 123.95, 128.95, 131.92, 132.53, 146.84, 148.04 (all quaternary C), 161.07 (COO), 162.38 (C⚌O).
MS analysis, M = 610.38; positive-ion MS: m/z 611 [M+H]+, 100%; m/z 565 [M+H-C2H5OH]+, negative-ion MS: m/z 609 [M−H]−, 100%; m/z 563 [M−H-C2H5OH]−.
IR (ATR), νmax/cm−1: 3465, 3132, 3066, 2953, 1692, 1535, 1487, 1437, 1352, 1289, 1218, 1117, 1024, 925, 738, 533.
Elemental analysis: calculated (C20H17BrN3NaO9S2): C (39.35%), H (2.81%), N (6.88%). Found: C (39.48%), H (2.89%), N (6.92%).
2.3 Dyeing procedure
For dyeing polyamide (PA) fabrics, all the reactive disperse dyes (1–3) were applied at various pH 4–10 using 1% (o.w.f.) dye concentration, 2 g/L of anionic dispersing agent (Sera Gal P-LP, DyStar, Egypt) as an auxiliary to improve dispersion of dye by the substrate and L:R 1:40 in Memmert checker water bath while wool fabrics were dyed at a constant pH 5. The dyeing process was performed at 100 °C for wool and polyamide fabrics, allowing the temperature of the dyebath to increase to 100 °C by the rate of 3 °C/min. The dyeing was continued at 100 °C for further 1 h. At the end of the dyeing process, the samples were thoroughly rinsed with water and air-dried. The dye concentration effect was studied by dyeing wool and polyamide fabrics by preparing different dyebath concentrations (0.5, 1, 1.5, 2%) o.w.f at pH 8 for polyamide and pH 5 for wool.
2.4 Dyeing measurements
Measurements and testing dye exhaustion uptake of dyes 1 and 2 by the wool and polyamide fabrics were measured by sampling the dyebath before and after dyeing. The dye concentration (g/l) of the dyebath, diluted 20-fold with 50% aqueous dimethylformamide, was measured on a Shimadzu UV-2401PC UV-visible spectrophotometer at the λmax value using a calibration curve previously obtained using known dye concentrations (g/l) in 50% aqueous dimethylformamide. The percentage of dyebath exhaustion (%E) was calculated using Eq. (1):
The dye fixation (%F), that is the percentage of the exhausted dye chemically bound on the wool fabric, was measured by refluxing the wool dyed samples in 50% aqueous dimethylformamide (20:1 liquor ratio) for 15 min to extract the unfixed dye (Burkinshaw et al., 2001). This procedure was repeated until the extract was clear. The concentration of the extract was then measured spectrophotometrically at the λmax value of each dye and the dye fixation ratio calculated using Eq. (2):
From the dyebath exhaustion (%E) and dye fixation (%F), the total dye fixation (%T), which is the percentage of dye chemically bound relative to the total amount of dye used, was calculated for dyeings using Eq. (3).
The relative color strength (K/S) and CIELAB coordinates (L∗ a∗ b∗) of the dyed fabrics were also measured using a HunterLab UltraScan PRO spectrophotometer (USA) under illuminant D65, 10° standard observer. The K/S values of dyed fabrics were measured by the light reflectance technique using Kubelka-Munk Eq. (4) (Judd and Wysezcki, 1975). The reflectance (R) of the dyed fabrics was measured according to the following equation.
R = Decimal fraction of the reflection of the dyed fabric
K = Absorption coefficient, and S = scattering coefficient
Fastness testing
Dyed polyamide and wool samples with 1% shade (o.w.f) after washing-off using 2 g/l nonionic detergent at 80 °C for 15 min, were tested by standard ISO methods (Methods of Tests for Colour Fastness of Textiles and Leather, 1990). Wash fastness [ISO 105-C02 (1989)], and fastness to perspiration [ISO 105-E04 (1989)] were evaluated using the visual ISO grey scale for color change. Light fastness (Xenon arc) was evaluated using ISO 105-B02.
2.5 Evaluation of antibacterial activity in vitro
2.5.1 Materials
Two bacterial strains from Bacterial Lab, Botany Department, the Faculty of women for Art, Science & Education, Ain Shams University, Cairo, Egypt, were employed. They include Staphylococcus aureus (S. aureus) as Gram-positive (G +ve) bacteria and Escherichia coli (E. coli) as Gram-negative (G −ve) bacteria. S. aureus and E. coli were selected as test cells because they are the most frequent bacteria in the wound infection and represent Gram positive and Gram negative bacteria, respectively. Fresh inoculants for antibacterial assessment were prepared on nutrient broth at 37 °C for 24 h.
2.5.2 Test method
The antibacterial activity of treated and dyed samples was determined against the test bacteria by disk diffusion method on an agar plate (Farouk et al., 2013; Abou-Zied et al., 2013). Briefly, 1 cm diameter blended film samples were cut and put into 10 mL of nutrient agar, to which 10 μl of microbe culture was inoculated, after the solidification. The plates were incubated at 37 °C for 24 h, after which the diameter of inhibition zone was measured and recorded.
3 Results and discussions
3.1 Synthesis
The synthesis of dyes 1, 2 and 3 was performed by diazo-coupling reaction, the diazotization of p-aminobenzene sulfatoethylsulfone was carried out in aqueous media using HCl 36% and sodium nitrite at 0 °C, using iodide-starch paper, and any excess of nitrous was destroyed by adding traces of sulfamic acid till the blue color on iodide-starch paper disappears. The coupling reaction on different analogue of PES was done in ethanol at 0–5 °C as shown in Scheme 1. Before the coupling reaction, the PES was dissolved in ethanol under reflux using inert gas to avoid oxidative dimerization reaction on PES due to the presence of the active methylene group in position 4 in pyrrolinone ring, then followed by fast cooling to form fine precipitate and promote the coupling reaction with diazonium salt. The reaction yield of prepared dyes was relatively high in all derivatives; it was over 70% in all cases. The obtained dyes were formed in pure hydrazone form as a mixture of E/Z as confirmed by NMR analysis.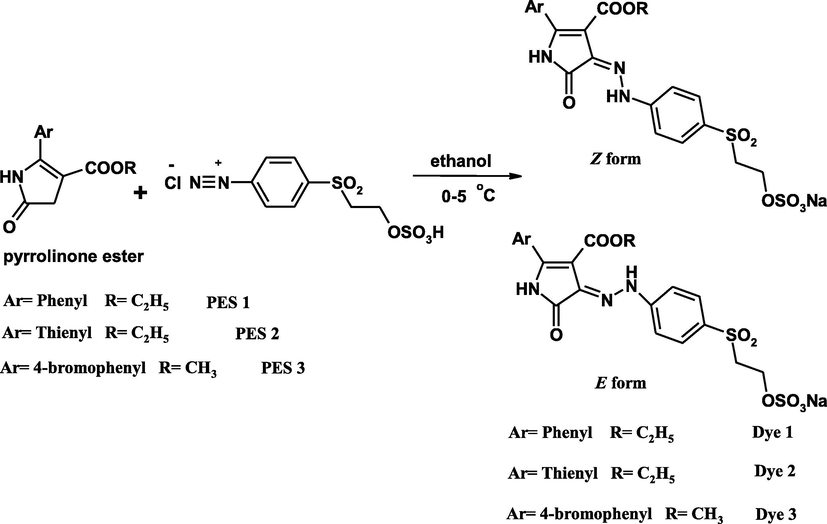
Synthesis of reactive disperse dyes 1–3.
The NMR was studied in detail for the prepared dyes in DEMSO-d6 solution which proves that, all compounds exist as a mixture of E and Z isomer as pure hydrazone tautomer. In our previous study N15 labeled hydrazone derivatives as a product of azo-coupling reaction of phenyl pyrrolinone ester with aromatic amine was prepared and NMR was studied in detail, and the possibility to differentiate between E and Z isomer was proved and studied (Lycka et al., 2010). These reactive disperse dyes show similar results from the NMR study, the Z isomer always appear in higher percent comparing with E isomer in the mixture by comparing the 1H NMR chemical shift as a definitive indicator for this comparison, and the 1H chemical shifts of Z isomer are shifted to higher frequencies comparing with E isomer as summarized in Table 1.
Dye
—NHN⚌
—CONH—
OCH2CH3
Aromatic protons
%
1H Chemical shift (ppm)
1 (Z)
13.18
11.46
4.18, 1.22
7.40–7.88
70
(E)
13.03
11.39
4.07, 1.02
30
2 (Z)
13.05
11.60
4.32, 1.38
7.25–7.96
88
(E)
12.65
11.38
4.15, 1.10
12
3 (Z)
13.07
11.53
3.72a
7.58–7.86
84
(E)
12.97
11.42
3.64b
16
3.2 Absorption and emission spectra
The absorption spectra of prepared dyes were measured in water at room temperature by preparing a solution (1 × 10⁻⁵ mol/L) of the dye concentration. The spectral shape of all dyes showed a strong HOMO-LUMO band without any vibronic structure in visible region between 435 and 456 nm as illustrated in Figs. 1–3 which ascribes to the π-π∗ transition. There was no significant change in absorption spectra between dyes 1 and 3 while a bathochromic shift (20 nm) was observed comparing with dye 2 due to the presence of thienyl substituent ring in position 2. Molar absorption coefficient for the prepared dyes was calculated and is summarized in Table 2. A higher molar absorption was observed for dye 2 at (36,500) L⋅mol−1⋅cm−1 while the lower value was observed for dye 1 at (33,400) L mol−1 cm−1.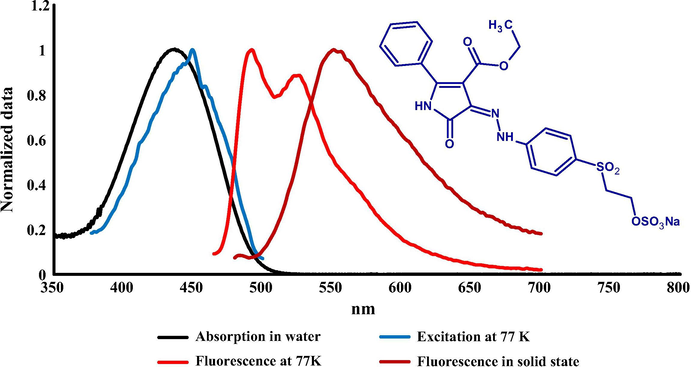
Absorption (H2O) at RT, excitation and emission spectra at 77 K (MTHF) of dye 1 together with its solid-state emission at RT.
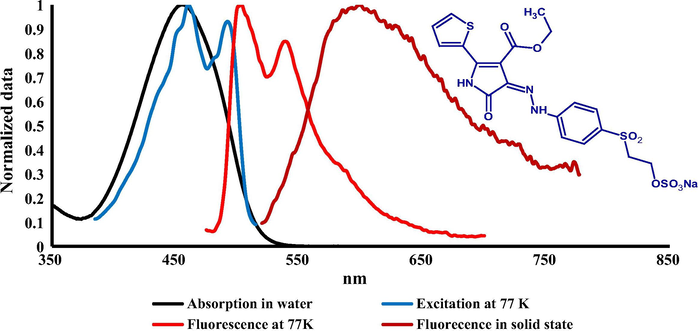
Absorption (H2O) at RT, excitation and emission spectra at 77 K (MTHF) of dye 2 together with its solid-state emission at RT.
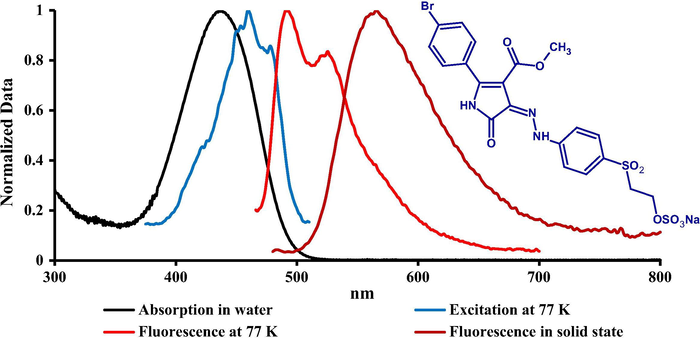
Absorption (H2O) at RT, excitation and emission spectra at 77 K (MTHF) of dye 3 together with its solid-state emission at RT.
Dye
Absorption λmax nm (H2O)
Excitation at 77 K λmax nm (MTHF)
Emission at 77 K λmax nm (MTHF)
Emission λmax nm (solid)
Emission on the dyed fabrics λmax nm
εmax [L mol−1 cm−1]
0–1
0–0
0–0
0–1
W
PA6
1
435
450
455
492
523
551
538
540
33,400
2
456
461
492
504
539
599
562
562
36,500
3
436
460
478 (sh)
491
526
556
541
545
36,000
The fluorescence emission spectra of the prepared dyes were measured in two different conditions (77 K) using liquid nitrogen in 2-methyltetrahydrofuran as a solvent and in solid state as shown in Figs. 1–3 and emission maxima are summarized in Table 2. There was no significant emission for these dyes in solution at room temperature. The fluorescence excitation and emission spectra at low temperature exhibited a clear resolved vibronic sub-band (0–0, 0–1) with similar intensity. Fluorescence excitation maxima were bathofluoric shifted in glass phase comparing with the absorption at RT, indicating a dominant role of the isomer absorbing at longer wavelengths which is attributable to Z isomer as proved for similar derivatives of these compounds by TD DFT calculations in our previous study (Lycka et al., 2010). The fluorescence efficiency between E and Z isomers is common, as in the case of arylmethyliden-oxindoles (Luňák et al., 2010). The results of emission spectra at 77 K indicated that there was no-significant shift between dyes 1 and 2 (1–3 nm) while a moderate bathfluoric shift was observed comparing dye 2 with dyes 1 and 3 (12–16 nm), respectively. A strong fluorescence emission in polycrystalline phase (solid state) of all prepared dyes was observed and a clear emission band without vibronic structure was recorded at 551, 599 and 556 nm for dyes 1, 2 and 3 respectively which shows a high bathofluoric shift comparing with the emission at 77 K due to the intermolecular CO-NH hydrogen bonding in solid state.
3.3 Dyeing application on wool (W) and polyamide 6 (PA6) fabrics
The prepared reactive disperse dyes 1–3 were applied on wool and polyamide according to the dyeing procedure as shown in the dyeing diagram in Fig. 4. The temperature of dyebath was then gradually raised to 100 °C at rate of 3 °C/min.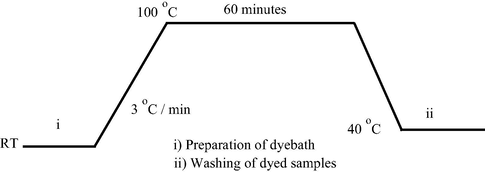
Dyeing diagram for polyamide and wool fabrics.
The dyeing mechanism of the prepared dyes which contain a terminal sulfatoethylsulfone reactive moiety on wool and polyamide substrates was described as shown in Scheme 2. At boiling of the dyebath the β-elimination reaction on sulfatoethylsulfone group in the dye molecule occurs and vinylesulfone was formed which easily reacts with the substrate by nucleophilic addition reaction (Mousa et al., 2006).
3.3.1 Effect of pH
One important factor in dyeing of polyamide fabric with reactive disperse dyes is the dyebath pH. All dyes 1, 2 and 3 were used for dyeing polyamide fabric at different pH (4, 6, 8 and 10) and dye concentration was constant (1% o.w.f.). For polyamide dyeings conducted at pH 8 as optimum pH, very high exhaustion (97, 98 and 99 %E) and total fixation (95, 97 and 97 %T) were recorded for dyes 1, 2 and 3, respectively as shown in summarized data in Table 3 and Fig. 5. These results indicate that there was no significant effect of the aryl substituent groups in the dye structure. This seems reasonable as the dyeing properties largely depend on the dye-fiber interaction through the dye vinylsulfone derivative, generated by the β-elimination reaction of the temporarily anionic sulfatoethylsulfone group, and the polyamide nucleophilic NH2 group as given in Scheme 2. The K/S values of dyed polyamide fabrics at different pH values (4–10) are given in Table 3 from which it is clear that the high buildup of all dyes was also observed at pH 8, probably due to the higher fixation efficiency of these dyes on the fiber.
Dye 1
Dye 2
Dye 3
pH
%E
%T
K/S
%E
%T
K/S
%E
%T
K/S
4
95.43
92.50
12.85
92.56
90.05
16.64
90.31
88.50
13.09
6
96.64
93.94
13.62
95.70
92.67
17.65
90.86
88.94
14.20
8
97.77
96.65
16.63
97.06
95.24
18.71
94.08
92.66
16.90
10
97.46
96.52
16.15
96.34
95.62
18.22
93.22
92.02
13.41
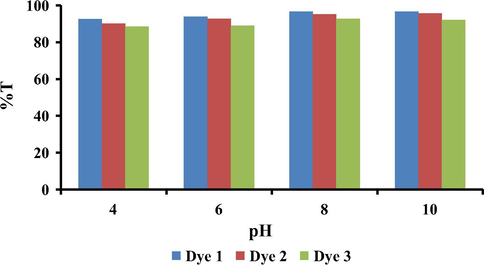
Effect of pH on dye %T for dyes 1–3 on polyamide.
The dyeing of wool fabric using the prepared dyes exhibited very good exhaustion and total fixation as well as the K/S values on the fiber at pH 5, the extent of dye exhaustion and total fixation ranged in the order Dye 1 > Dye 2 > Dye 3 as shown in Table 4 and Fig. 6. As dye 3 has a substituent bromophenyl group in position 2, its high molecular weight resulted in a lower affinity toward the fiber with reduced levels of exhaustion and total fixation comparing to the other two dyes 1 and 2.
Dye
%E
%T
K/S
1
94.27
92.14
24.10
2
91.70
88.42
26.61
3
86.19
84.43
22.40
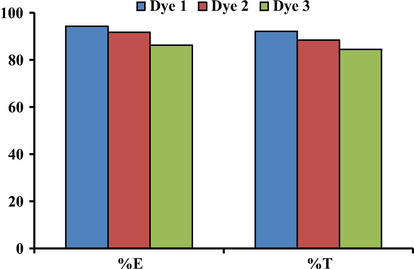
%E and %T on wool at pH 5 for dyes 1–3.
3.3.2 Effect of dye concentration
The dye exhaustion and total fixation yield on wool and polyamide fabric with different concentrations of the reactive disperse dyes 1, 2 and 3 (0.5–2% o.w.f.) were investigated. The wool dyeings were carried out at the optimum conditions at pH 5 and dyeings of polyamide carried out at pH 8. The results illustrated in Figs. 7 and 8 indicate that, at lower dye concentrations (0.5% and 1% o.w.f.), higher exhaustion and total fixation values of all dyes were observed. Meanwhile, at higher dye concentrations, the dyes exhibited lower levels of exhaustion on both wool and polyamide particularly in the case of dye 3. It is believed that the lower dye concentration applied would not be enough to saturate the fiber and the extent of dye exhaustion and fixation for all dyes decreases with increase in dye concentration. This seems reasonable due to the lowering of the dye affinity at higher amounts of dye concentrations which may due to increase in dye aggregation as well as decrease in the number of available dye sites on the fibers.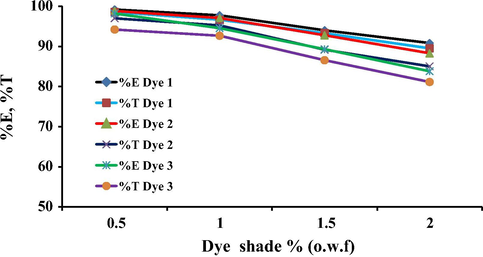
Effect of the dye concentration on the total exhaustion on polyamide for dyes 1–3.
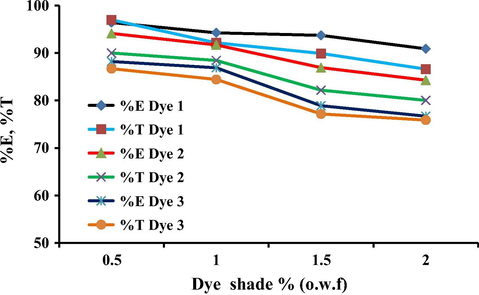
Effect of the dye concentration on the total exhaustion on wool for dyes 1–3.
3.3.3 The emission spectra on the dyed wool and polyamide
The emission spectra on the dyed wool and polyamide with 1% depth of shade (o.w.f) were measured as shown in Table 2 and Figs. 4 and 5. The emission maxima of dyes 1, 2 and 3 on both wool and polyamide were almost similar which indicate that the dye/fiber reaction was of the same mechanism. There was a significant hypsofluoric shift in the emission spectra on dyed samples comparing with the solid state emission of the dye powder 11, 27 and 9 nm for dyes 1, 2 and 3 respectively which may be due to the dye fiber interaction, as shown in Scheme 2, indicating that the terminal electron withdrawing group (OSO3Na) of the original dye structure was replaced by electron donating to form (Dye-SO2-CH2-CH2-NH-wool/polyamide). Interestingly, all dyeings showed very high emission intensity always higher than 1500 with low excitation bandwidth (2.5 nm) as shown in Figs. 9 and 10.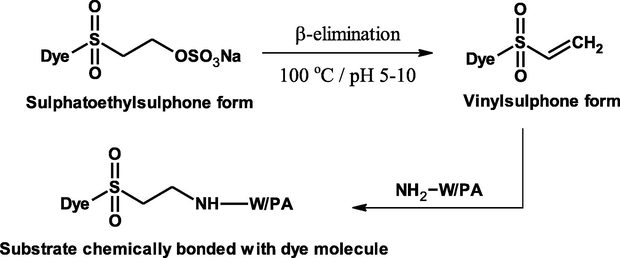
Dyeing mechanism of wool and polyamide.
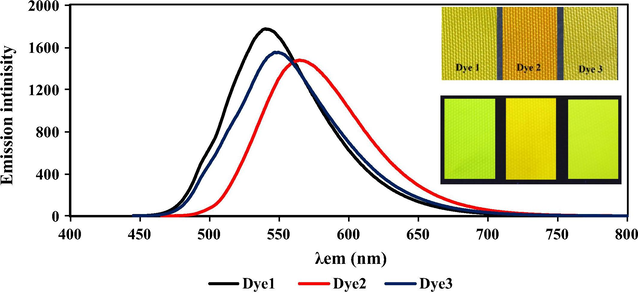
The emission spectra on dyed polyamide for dyes 1–3, the inside picture showing the dyed fabric under daylight (up) and dyed fabrics under UV lamp (down).
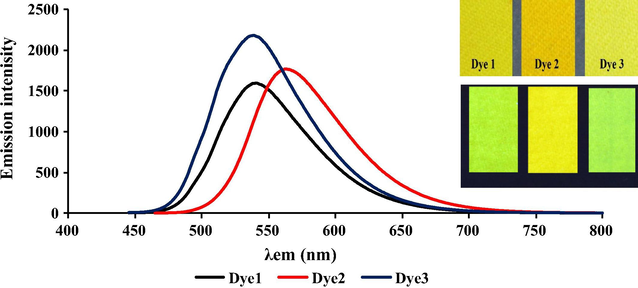
The emission spectra on dyed wool for dyes 1–3, the inside picture showing the dyed fabric under daylight (up) and dyed fabrics under UV lamp (down).
3.3.4 CIE Lab Color measurements
The colorimetric CIE Lab data on dyed wool and polyamide-6 fabrics using dyes 1, 2 and 3 are shown in Table 5. The values of L∗ a∗ b∗ C∗ h for the dyed wool and PA-6 fabrics by prepared dyes indicate that both dyes 1 and 3 have almost same colorimetric data of a yellowish color due to their relatively similar chemical structures while a significant change into orange color coordinated was observed for dye 2 due to the presence of thinly ring.
Dye
Fabric
L∗
a∗
b∗
C∗
h
1
W
78.34
−0.47
76.64
76.64
90.35
PA-6
73.18
−2.34
76.88
76.91
91.74
2
W
72.17
22.65
91.31
94.08
76.07
PA-6
63.29
22.62
78.05
81.26
73.84
3
W
77.99
2.97
95.36
95.41
88.22
PA-6
71.94
−1.37
84.48
84.49
90.93
3.3.5 Dye fastness on polyamide and wool fabrics
The color fastness of the dyed wool and polyamide fabrics with dyes 1, 2 and 3 is shown in Table 6. All samples showed high fastness properties such as washing, rubbing and perspiration fastness. Also, light fastness ratings of all dyes were approximately similar on both fabrics. PA polyamide, W wool, Alt alteration, SC staining to cotton, SW staining to wool.
Dye
Dyed sample
K/S
Fastness to rubbing
Wash fastness
Fastness to perspiration
Light
Dry
Wet
Alt.
SC
SW
Alkaline
Acidic
Alt
SC
SW
Alt
SC
SW
1
PA
18.71
4–5
4–5
4–5
4–5
4–5
4–5
4–5
4–5
4–5
4–5
4–5
4
W
26.52
4–5
4–5
4–5
4–5
4–5
4–5
4–5
4–5
4–5
4–5
4–5
4–5
2
PA
16.90
4–5
4–5
4–5
4–5
4–5
4–5
4–5
5
4–5
5
4–5
4–5
W
22.63
4–5
4–5
4–5
4–5
4–5
4–5
4–5
4–5
4–5
4–5
4–5
5
3
PA
16.15
4–5
4–5
4–5
4–5
4–5
4–5
4–5
4–5
4–5
4–5
4–5
4–5
W
27.54
4–5
4–5
4–5
4–5
4–5
4–5
4–5
4–5
4–5
4–5
4–5
5
3.4 Antibacterial activities of the reactive disperse dyes
The prepared dyes were tested for their antibacterial activity in vitro through disk diffusion method by using two bacterial strains, S. aureus as Gram-positive bacteria and E. coli as Gram-negative bacteria, taking tetracycline and ciprofloxacin as standard drugs. Table 7 shows that dyes 1 and 3 showed an excellent activity toward S. aureus and very good activity toward E. coli although dye 2 showed very good activity toward both S. aureus and E. coli with respect to standard drugs. It is apparent that these dyes are bactericidal not bacteriostatic.
Dye no.
Zone of inhibition (diameter in mm)
S. aureus
E. coli
1
22
19.5
2
19
18.5
3
26
24
Ciprofloxacin
24
23
Tetracycline
21
20
The effect of dye concentration for dyed fabrics on antibacterial activity was studied and the results are summarized in Table 8. The inhibition zone was recorded in each case. The results of undyed samples show that they do not inhibit bacterial activity, although dyed fabrics inhibit bacterial growth as is evident from the absence of growth under all treated samples.
Dye no.
Dye concentration, %
Wool fabric
Nylon fabric
Zone of inhibition (diameter in mm)
S. aureus
E. coli
S. aureus
E. coli
1
1
7.0
5.5
0.0
0.0
2
14.0
12.5
13.0
11.0
3
20.5
18.0
15.5
11.0
2
1
6.5
4.5
1.5
0.5
2
12.5
10.5
11.5
10.5
3
17.5
15.0
12.5
12.0
3
1
8.5
7.5
2.5
1.5
2
16.5
13.0
15.0
10.5
3
22.5
19.5
18.5
15.5
It was observed that as the dye concentration increases the inhibition zone increases. The increase is much larger for dyes 1 and 3 than dye 2.
These dyes contain —NHN⚌ and —CONH— groups in their molecular structure that allow dye molecules to be adsorbed readily onto bacterial surfaces, and then penetrate the cell membrane, followed by destruction of cell membranes and leakage of cell inclusion body causing bacteria death. These dyes showed better efficacy against the S. aureus than E. coli due to their cell wall structure (Minghua and Gang, 2005; Junshu and Gang, 2008; Minghua et al., 2003; Shen et al., 2007). The antibacterial activity of dyes 1 and 3 for all the tested samples is more than that of dye 2 because of the presence of phenyl and 4-bromophenyl groups in its molecular structure which increases conjugation and carbon skeleton. In addition, it was clear that from Table 8 that antibacterial activity of all wool-dyed samples is higher than nylon-dyed samples due to fabric nature and structure of wool characterized by higher dye-uptake of the dye into the wool comparing with polyamide which may be the reason of the higher antibacterial on wool than polyamide.
4 Conclusion
A three solid state fluorescence hydrazone reactive disperse dyes based on aryl derivatives of pyrrolinone ester were prepared; these dyes were formed in pure hydrazone as a mixture of E/Z isomers as proven by NMR study. These dyes show significant emission on polycrystalline phase as well as at 77 K. The dyed fabrics are characterized by high bright color due to the emission of dye in solid state. The dyeing application of the prepared dyes on wool and polyamide-6 fabrics showed excellent dyeing properties. The antibacterial activity of dye solution as well as the dyed fabrics was excellent – exhibited a large inhibition for S. aureus and E. coli.
These dyes can be considered as high performance dyes for polyamide and wool fabrics based on the definition and the meaning of high performance “high performance properties in its end use application”.
Acknowledgment
We thanks the National Research Centre, Giza, Egypt through project 10070001 (Innovation and development of textile dyeing and printing via nano, bio and other frontier sciences technology) for the financial support.
References
- J. Mater. Sci. Eng. Adv. Technol.. 2013;7(2):93-123.
- J. Adv. Res.. 2015;6:721-726.
- Color. Technol.. 2015;131:333-341.
- Dyes Pigm.. 2011;91(2):170-176.
- Dyes Pigm.. 2013;98(3):530-539.
- Dyes Pigm.. 2013;98(3):547-556.
- Dyes Pigm.. 2001;48(3):245-251.
- World Appl. Sci. J.. 2013;26(10):1280-1287.
- Arkivoc. Xiv 2008:115-123.
- Color. Technol.. 2003;119:70-75.
- Colour in Business, Science and Industry (third ed.). New York: John Wiley & Sons; 1975.
- Dyes Pigm.. 2008;77(2):380-386.
- Prog. Phys. Org. Chem.. 2007;13:485-630.
- Comprehensive Heterocyclic Chemistry. Oxford: Pergamon Press; 1984. 3–57
- Dyes Pigm.. 1982;3(1):27-47.
- Color. Technol.. 2001;117(4):212-216.
- Dyes Pigm.. 2001;47(1–2):151-167.
- Dyes Pigm.. 2010;85:171-176.
- Tetrahedron Lett.. 2010;51:3149-3151.
- Dyes Pigm.. 2009;83(1):59-65.
- Infrared Absorbing Dyes. New York: Plenum Press; 1990.
- Int. J. Photoenergy. 2005;7(2):95-101.
- Methods of Tests for Colour Fastness of Textiles and Leather, fifth ed. (Bradford: SDC), 1990.
- Dyes Pigm.. 2005;66(1):33-41.
- Dyes Pigm.. 2003;58(1):27-35.
- Color. Technol.. 2006;122:338-344.
- Dyes Pigm.. 2015;112:86-92.
- Arab. J. Chem.. 2017;10(Suppl. 2):S3303-S3309.
- Sainsbury, M., 1991. Elsevier; Distributors for the U.S. and Canada, Elsevier Science Pub. Co., New York, NY, U.S.A.
- Tetrahedron. 2002;58:2875-2880.
- Dyes Pigm.. 2007;75(2):255-262.
- Matsuoka M., ed. Infrared Absorbing Dyes. New York: Plenum; 1990. p. :193-212.
- Fibers Text. Eastern Europe. 2004;12(1):70-75.
- The Chemistry and Application of Dyes. New York: Plenum Press; 1990.
- Color. Technol.. 2007;123:312-316.
- Color Chemistry: Syntheses, Properties, and Applications of Organic Dyes and Pigments (second rev. ed.). Weinheim; New York: VCH; 1991.


