

Translate this page into:
Synthesis, spectroscopic characterization and study the effect of gamma irradiation on VO2+, Mn2+, Zn2+, Ru3+, Pd2+, Ag+ and Hg2+ complexes and antibacterial activities
⁎Corresponding author. samar.mostafa@gebri.usc.edu.eg (S.A. Aly)
-
Received: ,
Accepted: ,
This article was originally published by Elsevier and was migrated to Scientific Scholar after the change of Publisher.
Peer review under responsibility of King Saud University.
Abstract
Novel complexes of VO2+, Mn2+, Zn2+, Ru3+, Pd2+, Ag+ and Hg2+ have been prepared by reacting their metal salts with ligand, named (4-(4-chlorophenyl)-1-(2-(phenylamino) acetyl) thiosemicarbazone). Study of synthesized metal complexes was confirmed by different analytical and spectral techniques (1H NMR, MS, FT-IR, UV–Vis, EPR and Powder X-ray diffraction), thermogravimetric studies as well as molecular modeling. FT-IR spectra showed that the compound behave as neutral or monobasic tetradentate. In case of complexes of Mn2+, Zn2+, Ag+ and VO2+, through (N2—H), (C⚌O) or (C—O) groups. While, the ligand behave as neutral bidentate in case of complexes with Pd2+ and Hg2+. X-ray diffraction pattern of Mn2+, Pd2+ and Ag+ complexes before and after irradiation are recorded. XRD studies exhibited that decrease in the crystalline size of sample Mn2+ as compared of samples Ag+ and Pd2+ upon irradiation and irradiation influenced the crystallinity of the complexes. The possible structures of the ligand, Mn2+, Pd2+ and Hg2+complexes have been computed by means of the molecular mechanic calculations using the hyper chem. 8.03 molecular modeling program. The bond length, bond angle, HOMO, LUMO and dipole moment have been studied to verify the geometry of Mn2+, Pd2+ and Hg2+ complexes. The effect of gamma irradiation was investigated by recording the new results of pervious spectroscopic techniques and other measurements. Thermal studies of these chelates before and after γ-irradiation showed that the complexes after γ-irradiation were more thermally stable than before γ-irradiation. The compound and its metal complexes have been experienced for their inhibitory outcome on the growth of microorganisms against gram positive and gram negative. The results proved that the complexes B1–B7 have potent antibacterial activity as compared to that of ligand.
Keywords
γ-irradiation
Metal complexes
IR
X-ray diffraction
Molecular modeling
Antibacterial activity

1 Introduction
Thiosemicarbazones are artificially active pharmacophores and their activities strengthen chelation with metal ions. The transition metal complexes with these compounds have elevated interest with several researchers and they persist to be subjected to numerous applications. Thiosemicarbazones generally operate as chelating compounds for transition metal ions by bonding via the sulphur and azomethine nitrogen atoms; while, in a few cases they act as monodentate ligand wherever connect via sulphur only (Murali et al., 2009).
Metal ions are necessary for biological purposes like iron which is found in hemoglobin and myoglobin; zinc which is required to superoxide dismutase enzyme; and also, sodium and potassium which play vital roles in homeostatic processes. Silver salts have been used as an antiseptic collyrium to shun ophthalmic infections in newborns (Gustavo et al., 2012).
X-ray diffraction patterns of ferric, copper and zinc of complexes of thiosemcarbazide derivatives have been synthesized. These complexes exhibit different physical properties. Ferric complex has triclinic crystal structure, however copper and zinc complexes of ligand have monoclinic crystal structures with diverse unit cell parameters by using x-ray powder diffraction. These complexes showed significant activities against microorganisms and fungi as compared to that of ciprofloxacin treatment (Gavhane et al., 2015).
Radiation is extensively used in the biomaterials science for surface modification, disinfection and to develop bulk possessions. Radiation is also used for improvement of biochips, and in situ photopolymerizable of bioglues. The energy sources most usually used in the irradiation of biomaterials are great-energy electrons, gamma radiation and UV. Surface adjustment includes placement of selective chemical moieties on the surface of a material by chemical reactions to develop bio interaction for cell connection and propagation. The exposure of a polymer to radiation, specially ionizing radiation, can is due to chain scission or crosslinking with variation in bulk and surface properties. Disinfection by irradiation is considered to inactivate greatest pathogens from the surface of biomedical processes. An indication of the use of gamma and UV radiation to develop surface of material compatibility, bulk things and surface things for wear resistance, development of hydrogels and curing dental sealants and bone glues is existing (Benson, 2002).
A series of thiouracil complexes of Ni2+, Pt4+, UO22+, VO2+ and Pd2+ of ligand (5,5-((1E,10E)-(4-chloro-1,2-phenylene) bis(diazene-2,1-diyl) bis(2-thioxo-2,3-dihydropyrimidin-4(1H)-one) was synthesized and characterized by spectroscopic techniques and different measurements. VO2+ complex was irradiated by using Gamma radiation to through a light on the possibility of geometry variations with the effect of radiation. The parameters exhibited from ESR spectra before and after γ-irradiation reproduce the inflexibility of the complex towards the effect. XRD patterns were displayed that importance on the nature of the particles and the purity of products. The ligand, Pt4+ and Pd2+ are originated in nanometer range.
The aim of this work is preparation and characterization of VO2+, Mn2+, Zn2+, Ru3+, Pd2+, Ag+ and Hg2+ complexes by using different spectral and physical tools before and after γ-irradiation. The possible antibacterial activities of ligand and its metal complexes before and after γ-irradiation were also investigated.
2 Experimental
2.1 Material and methods
All organic compounds and the solvents were purchased from Fluka or Merck, Naser City, Egypt. The metal salts VOSO4·3H2O, MnSO4, ZnSO4, RuCl3·3H2O, PdCl2, AgNO3 and HgCl2 were obtained from Fluka and used for complex preparation without further purification.
2.2 Preparation of the metal complexes
The organic ligand 4-(4-chlorophenyl)-1-(2-(phenylamino) acetyl) thiosemicarbazone (B) was previously prepared and characterized (Samar and Ayman, 2017). Metal complexes were prepared by adding Stoichiometrical amount of MX2·nH2O, where M = VO2+, Mn2+, Zn2+, Ru3+, Pd2+, Ag+ and Hg2+ and X = SO42−, Cl−, NO3− and n = 0–3 in absolute ethanol to hot solution of the ligand in (1:1) molar ratio leading to the complexes are represented in Scheme 1. The resulting mixture was magnetically stirred at 60 °C for 6–8 h. The formed precipitate was filtered off while hot, otherwise the solution was left at 35 °C to evaporate some of solvent to promote crystallization. The crystals were collected by vacuum filtrations, washed several times with anhydrous diethyl ether and dried under vacuum in presence of P4O10.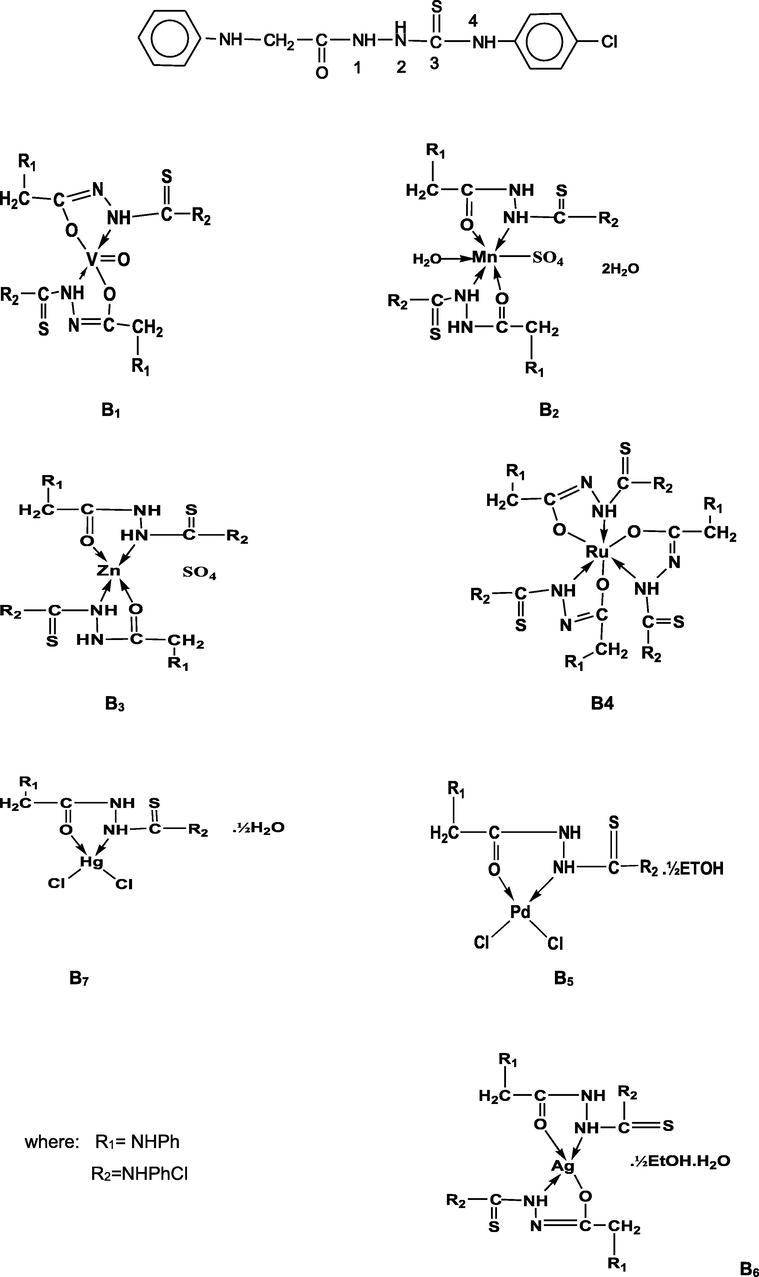
Suggested chemical structures of metal complexes (B1–B7).
2.3 Physical measurement
Elemental analyses (C, H and N) were performed at Microanalytical unit, Cairo University. Metal content was estimated complexometric using EDTA following standard literature methods (Bassett et al., 1978). The Fourier Transform Infrared (FT-IR) measurements were performed (4000–400 cm−1) in KBr discussing. Nenexeus-Nicolidite-640-MSAFT-IR, Thermo-Electronics Co. (Central Lab, Faculty of Science, Menoufia University, Egypt). 1H NMR spectra was recorded in DMSO- d6 using 300 MHz Varian NMR spectrometer (Micro Analytical Center). The UV–visible absorption spectra was measured in DMF solution (10−3 M) using 4802 UV/vis double beam spectrophotometer. The molar conductivity measurements were made in DMF solution (10−3 M) using a Tacussel conductometer type CD6N. The magnetic susceptibilities of the complexes were measured by the modified Gouy method at room temperature using Magnetic Susceptibility Johnson Matthey Balance. The effective magnetic moments were calculated using the relation µeff = 2.828(χmT)1/2 B.M., where χm is the molar magnetic susceptibility corrected for diamagnetism of all atoms in the compounds using Selwood and Pascal’s constants.
Thermal analysis (TGA/DTG) was obtained out by using a Shimadzu DTG-50 Thermal analyzer with a heating rate of 10 °C/min in nitrogen atmosphere with a following rate 20 ml/min in the temperature range 25–800 °C using platinum crucibles at Central Lab, Faculty of Science, Menoufia University, Egypt.
X-ray powder diffraction analyses of unirradiated B2, B5, B6 and irradiated A2, A5, A6 of solid samples were measured using Rigku Model ROTAFLEX Ru-200 at The National Research Center, Cairo, Egypt. Morphology and structural analysis by x-ray diffractograms give computer control formally finished by PHILIPS®MPDX́PERT X-ray diffractometer ready with Cu radiation CuKα (λ = 1.540 56 Å). The x́pert diffractometer has the Bragg- Brentano geometry. The X-ray tube was used for a copper tube operating at 40 kV and 30 mA. The scanning range (2θ) was 20–80° with step size of 0.02° and counting time of 3 s/step. Quartz was used as the standard material to accurate for the instrumental expansion. This identification of the complexes was done by a known method (Uarikumaran and Appukuttan, 2012) from the fit identified Scherrer formula, the average crystallite size, L, is where λ is the X-ray wavelength in the manometer, K (constant equal to 0.9) is related to crystallite shape, and ß is the peak width at half maximum height. The value of ß in the 2θ axis of diffraction shape must be in radians. The θ is the Bragg angle and be able to in radians since the Cos θ compatible with the same number.
2.4 Theoretical calculation (molecular modeling)
Molecular modeling was applied to investigate the three dimensional arrangements for atoms in the complexes by employing semi-empirical molecular orbital calculations at the PM3 level provided by the HyperChem program.
2.5 Antibacterial activity
The highly pathogenic bacterium Streptococcus pyogenes isolated from human sources which is classified into Lancefield’s group A bacteria and E. coli isolated from the soil of Menoufia governorate were used in this study. Brain heart infusion (BHI) broth medium (MP Bio) contained 27.5 g nutrient substrate (brain extract, heart extract and peptones), 2 g D(+) glucose, 5 g NaCl, and 2.5 g Na2HPO4 per liter. The pH was adjusted to 7.4 by the addition of diluted NaOH. Nutrient broth (NB) medium contained 1 g D(+)glucose, 15 g peptone, 6 g sodium chloride, 3 g yeast extract per liter was used to grow the bacterial strains and monitoring SK activity during growth curve of the microbes. The pH was adjusted to 7.4 by the addition of diluted NaOH.
The in vitro antibacterial activities of the tested complexes were assessed as described (Hanaa et al., 2016) with some modification. The inhibitory effects of synthesized ligand and its complexes before and after exposure to γ-irradiation were tested on the pathogenic Gram-positive organism Streptococcus pyogenes and the Gram–negative bacterium Escherichia coli. Brain Heart Infusion (BHI) broth was used to grow Streptococcus pyogenes cells and nutrient broth medium was used to grow E. coli cells. Compounds were dissolved in DMSO which has no inhibition activity on both microbes. Two different concentrations (1 μg/ml, 5 μg/ml, 7 μg/ml and 10 μg/ml) were prepared. Bacterial strains were prepared by activating them on the proper broth media with shaking. The bacteria were cultured for 24 h at 37 °C in an incubator. One milliliter of the standard bacterial culture was used as inoculation in a broth medium. For growth studies, S. pyogenes and E. coli cultures were inoculated and grown aerobically on BHI broth medium and NB medium respectively. Growth was calculated turbidometrically at 650 nm using conventional spectrophotometer. After growing bacterial cultures on media that contain the ligand, the complex and the control, absorption measurements were accomplished by spectrophotometer after 24 and 48 h of incubation to determine the number of viable cells count per milliliter of sample and were used to the calculated the inhibition percentage.
2.6 Irradiation studies
For irradiation studies of solid samples of complexes B1–B7 were subjected to γ-irradiation to a dose of 60 kGy using Indian 60Co γ-ray cell type GE-4000 A (at room temperature at the Egyptian Atomic Energy Authority Nasr City, Egypt) at a dose rate of 2.2 kGy h−1. After removing the samples from the radiation field the FT-IR, absorption spectra and thermal analysis (TG/DTG) XRD, antibacterial activities of the irradiated samples were investigated. X-ray powder diffraction analyses of unirradiated B1–B7 and irradiated A1–A7 samples of complexes were carried out at the National Research center, Dokki, Cairo, Egypt by using Rigku Model ROTAFLEX Ru-200. Divergence and receiving slits were 1 and 0.1, respectively.
3 Results and discussion
3.1 Physical data
The data shows that the reactions of the ligand with oxovanadium, manganese, zinc sulfate, ruthenium, palladium, mercuric chloride and silver nitrate in 1 M:1L molar ratio are resulted in given metal complexes B1–B7 (Table 1). The molar conductivities in DMF (10−3 M) solution exhibited that all metal complexes are non-electrolytes in nature (Geary, 1971). Where:
No
Compound
Color
Yield%
Mol.Wt
Found (Calc) %
C
H
N
Cl
M
Ʌm
B
H2L
Pale brown
75
334.5
53.43(53.81)
4.46(4.48)
16.47(16.7)
10.83(10.6)
–
–
B1
VO (HL)2
Brown
60
733.9
49.23(49.05)
3.71(3.81)
15.52(15.26)
9.80(9.67)
6.23(6.94)
20
B2
Mn (H2L)2SO4.2H2O
Brown
60
856
42.75(43.16)
3.64(3.97)
12.9 (13.08)
8.87(8.29)
6.32(6.41)
34
B3
Zn (H2L)2SO4
Pale Brown
65
830.8
43.0(43.33)
3.33(3.61)
13.36(13.4)
8.87(8.55)
7.62(7.87)
20
B4
Ru(HL)3
Black
75
1101.5
49.4(49.0)
3.74(3.81)
14.70(15.2)
9.60(9.96)
10.1(9.17)
35
B5
Pd (H2L)Cl2.½ETOH
Yellow
70
534.8
35.57(35.9)
3.12(3.36)
10.2(10.4)
20.20(19.9)
19.49(19.87)
18
B6
Ag(HL)(H2L).½ETOH.H2O
Brown
70
816.9
45.74(45.54)
3.94(4.16)
13.4(13.71)
8.87(8.69)
13.66(13.2)
12
B7
Hg (H2L)Cl2.½H2O
Pale Brown
75
615.1
29.5(29.26)
2.86(2.60)
8.83(9.10)
17.57(17.3)
32.93(32.61)
20
3.2 Spectroscopic analysis
3.2.1 Proton nuclear magnetic resonance spectra
Comparison of the proton nuclear magnetic resonance of B and A (ligand before and after γ-irradiation) were recorded in DMSO‑d6 solution (Fig. 1). The 1H NMR spectra of B and A in DMSO‑d6 revealed a chemical shift (δ, ppm) = 2.5 ppm, the N(4)H signal appeared at 8.85, 8.07 ppm and the N(2)H signal appeared at 9.7, 9.04 ppm and the peak of N(1)H appeared at 9.04, 8.9 ppm. The singlet signal appeared at 3.3, 3.2 ppm that are attributed to the protons of CH2, the multiplet signal appeared at 6.7–7.5, 6.8–7.4 ppm that are attributed to the aryl protons. The intensity of irradiated (A) is higher than unirradiated (B) (Samar and Ayman, 2017; Samar, 2017). Also, 1H NMR spectrum of [Pd(H2L)Cl2]·½ ETOH complex (Fig. 2) was recorded in DMSO‑d6. After γ-irradiation the spectrum of [Pd(H2L)Cl2]·½ ETOH complex showed new peaks at 8.07, 9.0, 9.2 and 9.09 ppm is attributed to N(4)H, N(2)H, N(1)H, but the signal of N(2)H in B5 is downfield 9.09 ppm as a comparison of B at 9.7 ppm. By using gamma ray the intensity of bands is higher than unirradiated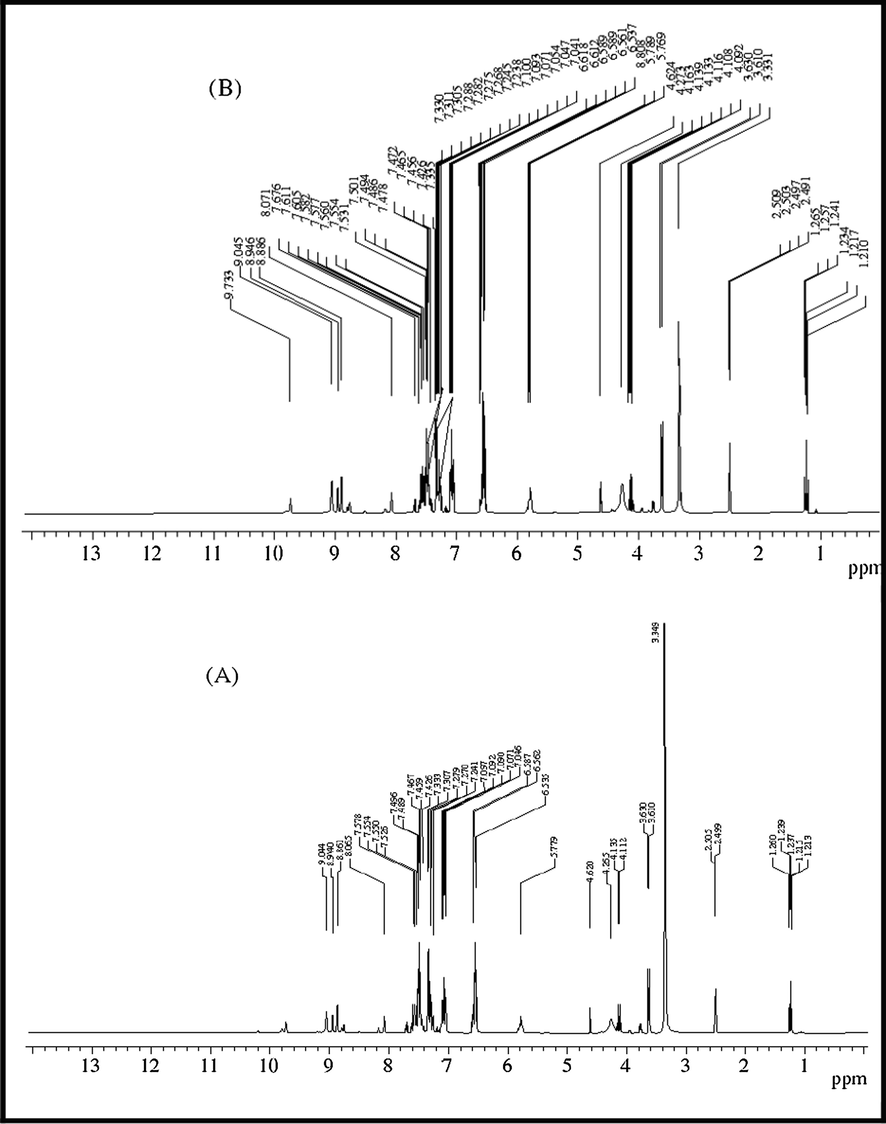
1H NMR spectra of ligand in DMSO‑d6 solution before and after irradiation (B, A).
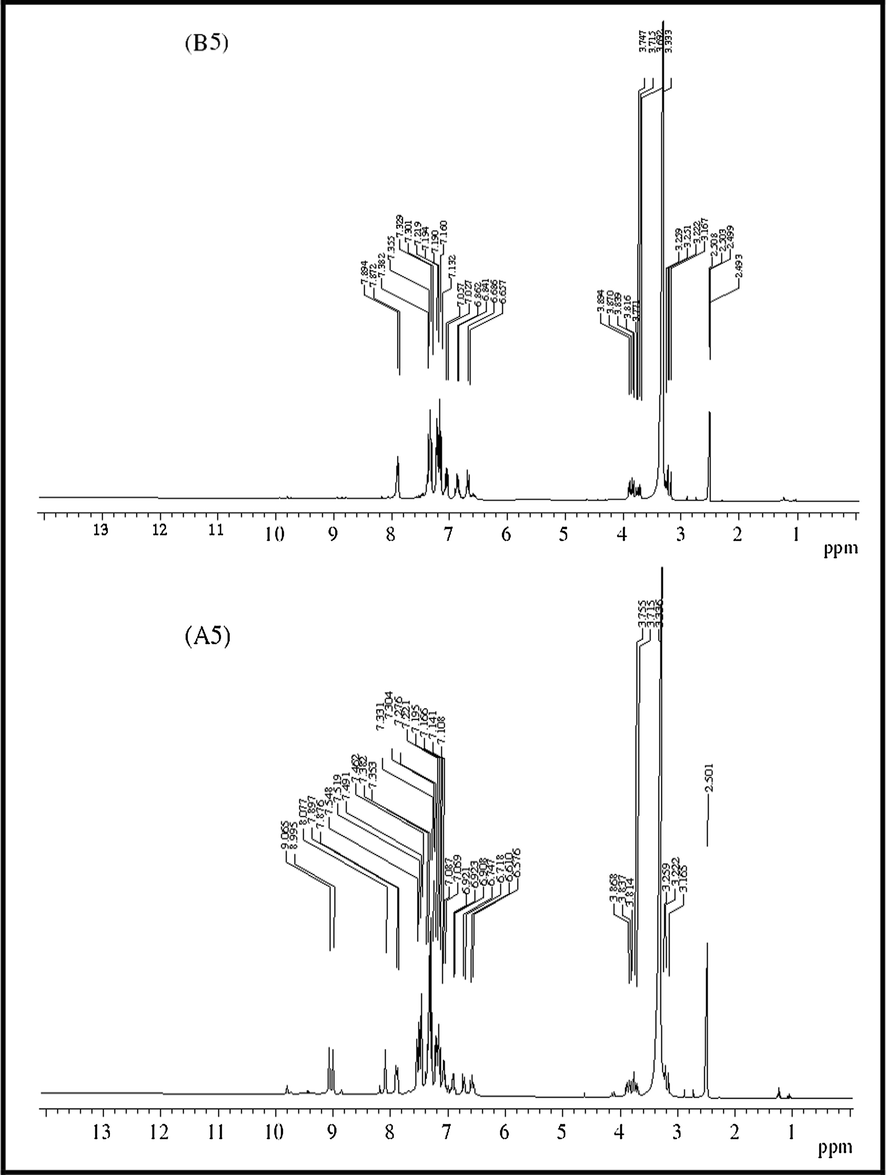
1H NMR spectra of Pd(II) complexes in DMSO‑d6 solution before irradiation and after irradiation (B5, A5).
3.2.2 Mass spectroscopy
The mass spectrum of the ligand exhibited a molecular ion peak at m/z = 336 amu (Calc. m/z = 334.5). The important fragment ions appear at: m/z 77 for [C6H4-3H]+, 112 for [C6H5Cl-H]+, 127 for [C6H5NCl- 2H]+, 201 for [C7H9N3SCl]+, 228.5 for [C8H9N3SOCl-H]+, 259 for [C9H10N4OSCl-2H]+, 336 for [C15H15N4OSCl] (Fig. 3). Also, the spectrum of complex [Hg(H2L)Cl2]·½ H2O proceed the suggested formula by appearing a molecular ion peak at m/z 590 amu in proportion to [Hg(H2L)Cl2]·½ H2O](B7) which agree with its formula weight (calculated m/z = 606.1 amu). The additional fragments of A7 and B7 provide the peaks with various intensities at diverse m/z values approximating at: Calc/Found 76/77 [C6H4]+,91/90 [C6H4NH]+, 126.5/127[C6H4NHCl]+, 327.1/327[C6H4NHClHg]+, 362.6/361[C6H4NHCl2Hg]+, 398.1/398[C6H4NHCl3Hg]+, 498.1/498[M-(C9H9N3Cl3HgS]+, 590.1/593 [M-(C15H15N4Cl3 HgOS)]+, 606.1/606 [M-½H2O]+. After γ-irradiation, the molecular ions tend to be more stable and break into fragments with higher intensity than before γ-irradiation.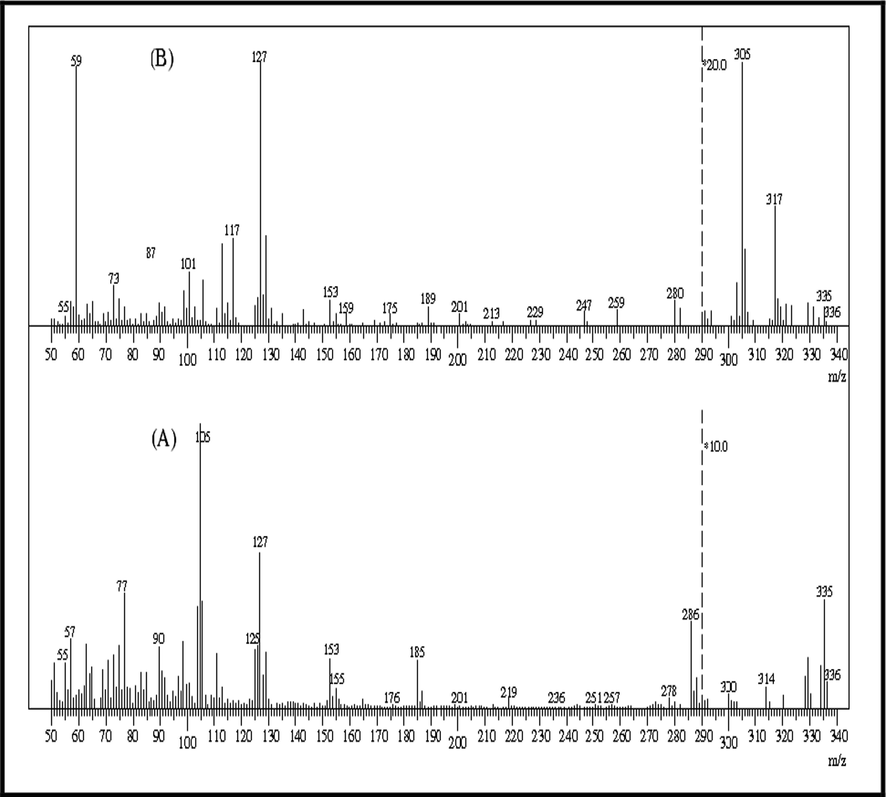
Mass spectra of ligand before and after irradiation (B, A).
3.2.3 IR spectra
The most important assignments of the IR spectra of the free organic ligand and its metal complexes B1–B7 and A1–A7 are done in the range 4000–400 cm−1. The comparison between the functional groups for unirradiated and irradiated ligand B and A is presented in Fig. 4 and Table 2. It was found that the functional groups of the ligand B appear at 3302; 3302 cm−1, 3100; 3103 cm−1, 1670; 1668 cm−1 and 750; 751 cm−1 respectively are attributed to the stretching frequencies of υ(N2—H), υ(N1—H), υ(C⚌O) and υ(C⚌S), respectively. After γ-irradiation their corresponding bands υ(N1—H) and υ(C⚌S) were shifted to higher wave numbers as compared to that of free B. While, the functional group of υ(C⚌O) shifted to lower wave number after γ-irradiation) (Morsy et al., 2011). After γ-irradiation the intensity of the peaks become more sharper than that of unirradiated ligand. Where: B = before γ-irradiation. A = after γ-irradiation.
IR spectra of ligand and VO(II), Mn(II), Hg(II) complexes before and after irradiation (B, B1, B2, B7 and A, A1, A2, A7).
Compound
ν(N4—H)
ν(N2—H)
ν(N1—H)
ν(C⚌O)
ν(C⚌S)
ν(M—N)
ν(M—O)
B
H2L
3335
3302
3100
1670
750
–
–
A
H2L
3481
3302
3103
1668
751
–
–
B1
VO(HL)2
3430
3358
3301
–
758
509
634
A1
VO(HL)2
3422
3295
3233
–
757
467
636
B2
Mn(H2L)2SO4·2H2O
3502
3296
3101
1672
753
436
634.5
A2
Mn(H2L)2SO4·2H2O
3408
3296
2927
1672
755
508
633.5
B3
Zn(H2L)2SO4
3499
3296
3102
1631
725
467
635
A3
Zn(H2L)2SO4
3470
3296
3104
1632
756
468
635
B4
Ru(HL)3
3450
3296
3101
–
756
468
638
A4
Ru(HL)3
3480
3296
3101
–
755
465
638
B5
Pd(H2L)Cl2·½ETOH
3444
3296
3197
1602
760
457
601
A5
Pd(H2L)Cl2·½ETOH
3424
3296
3196
1603
761
465
603
B6
Ag(H2L)(HL)H2O·½ETOH
3428
3296
3100
1633
753
549
409
A6
Ag(H2L)(HL)H2O·½ETOH
3430
3295
3100
1633
753
507
413
B7
Hg (H2L)Cl2·½H2O
3465
3297(m)
3104
1632
755
509
550
A7
Hg (H2L)Cl2·½H2O
3420
3296
2926
1633
755
509
555
Coordination modes of respective unirradiated B1–B7 and irradiated metal complexes A1–A7 have been proven by comparing with ligand B. VO(II) and Ru(III) complexes B1, B4, and A1, A4 are shown significant changes showed significant changes compared to the spectrum of free B. The most important diagnostic spectral bands are exhibited at 3358–3296, 3233–3101 and 758–755 cm−1 in B1, B4. Also, the IR spectra of A1, A4 are showed bands at 3233–3101 and 757–756 cm−1, respectively, which attributed to the stretching frequencies of υ(N2—H), υ(N1—H) and υ(C⚌S). The bands corresponding to υ(N2—H), υ(C⚌S) were shifted to lower frequency of complexes A1 and A4. However, the IR spectra of VO(II) and Ru(III) complexes before and after γ-irradiation were showed that υ(C⚌O) disappeared upon complexes formation, indicating the coordination of the ligand in enol-form and the ligand behaves as monobasic tetradentate. Also, coordination takes place via N(2)H and enolic oxygen (C—O). On the other side, IR spectra (Fig. 4) of complexes before B2, B3, B5, B6 and B7 and after γ-irradiation A2, A3, A5, A6 and A7 show four strong bands at 3296; 3100–3197; 1601–1672 and 725–760 respectively, also bands at 3101–3295; 3297–3196; 1601–1672 and 753–761 cm−1, respectively that are attributed to υ(N4—H), υ(N2—H), υ(N1—H), υ(C⚌O) and υ(C⚌S). After γ- irradiation, the bands corresponding to υ(N1—H) was shifted to lower frequency as compared to those of complexes B2, B5 and B7. However, the band attributed to υ(C⚌S) was shifted to higher wave number and higher intensity of band of irradiated. While, in complexes A4 and A6 the υ(C⚌O) is shifted to higher wave number as compared to that unirradiated complexes. The new bands appeared at 638–549; 638–507, 509–409 and 508–413 cm−1 are assigned to υ(M—O) and υ(M—N) for B1–B7 and A1–A7 complexes, respectively (Krishnan et al., 2010; Seena and Kurup, 2007). The IR spectra of VO(II) complexes before and after γ-irradiation display new bands at 1012 and 1014 cm−1 assigned to υ(V⚌O) (Maany et al., 2006).
3.2.4 Electronic spectra and magnetic measurements
The electronic spectral bands of the ligand B, irradiated A and complexes B1–B7 and irradiated complexes A1–A7 (λmax, nm) in DMF solution and (µeff B.M.) are measured. UV/vis spectra of complexes B1 and A1 exhibit one band at 600 and 620 nm. The observed bands are assigned to 2B2 → 2E electronic transition suggesting a square pyramidal geometry around VO2+ ion. The magnetic moment values are found to be 1.56 B.M and 1.57 B.M. for B1 and A1 which is an indicative of square pyramidal geometry) (Adly, 2011).
The electronic spectra of zinc complexes B2 and A2 display two bands at 320 nm and 340 nm which may be attributed to π-π* and n-π* transitions, respectively. The Zn2+ complexes show no d-d band. The coordination of the sulfate ion to the tetrahedral zinc center is proved by its non-electrolytic character in dimethyl formamide solution. The electronic spectrum exhibits tetrahedral structure around the Zn2+ ion which is additional proved by its diamagnetic character (Singh et al., 2014; Raja and Ramesh, 2010).
Ru3+ and Mn2+ complexes before and after γ-irradiation B2, B4 and A2, A4 show bands at 500; 550 and 320, 330; 340 nm are assigned to 2T2g → 4T1g transition and 6A1g → 4T1g, 6A1g → 4Eg and 6A1g → 4T1g electronic transition respectively suggesting octahedral geometry around M3+,2+ ion (Raja and Ramesh, 2010; Chandra and Kumar, 2005). The magnetic susceptibility measurements are found to be (1.54 and 5.4, 6.1 B.M.) for B4, A4 and B2, A2 (Hanaa and Ocala, 2015).
Pd2+, Ag+ and Hg2+ complexes before γ-irradiation B5, B6, B7 and A5, A6, A7 give three, two and one bands at 600, 450, 420; 360, 240; 340 nm. While electronic spectra of the complexes A5, A6 and A7 after γ-irradiation appear bands at 620, 450; 380, 300, and 360 nm attributed to 1A1g → 1A2g, 1A1g → 1B1g and 1A1g → 1Eg transitions in B5 and A5 (Geeta et al., 2010) intra ligand and charge transfer transitions. Diamagnetic behavior and molar conductance value confirming the square planar geometry of B5, B6 and B7 (Piyali et al., 2015; Nabil and Hegab, 2005; Aliakbar et al., 2017; Elena et al., 2001; Nadia et al., 2017; Jeragh and El-Asmy, 2014).
The spectral bands of the complexes confirmed some better determined in structures with an amazingly higher absorbance by using radiation and no change in the geometry of metal complexes
3.3 X-ray diffraction patterns
XRD analysis was performed for the solid samples of Mn2+, Pd2+, Ag+ B2, B5, B6 and A2, A5, A6 to confirm the crystal structure of these complexes. The XRD patterns of the created complexes were approved in order to provide insight about the lattice parameters of the prepared complexes.
Figs. 5a–5c represents XRD patterns for complexes Mn2+, Pd2+, Ag+. The observed peak sharpness in the diffraction pattern indicates that Mn2+, Pd2+, Ag+ complexes are in the nanometer range. The diameter of particles are found in nanorange as fellow: Mn2+, 3–130 nm; Pd2+, 3–172 nm; Ag+, 3–151 nm. The nanoparticles size of complexes may serve strongly in different application fields in between the biological one (Uarikumaran and Appukuttan, 2012). The X-ray diffraction patterns of uniradiated and irradiated complexes demonstrate that:
-
The characteristics of the material is developed
-
Dislocation of longer interplanar spacing.
-
New peaks appeared
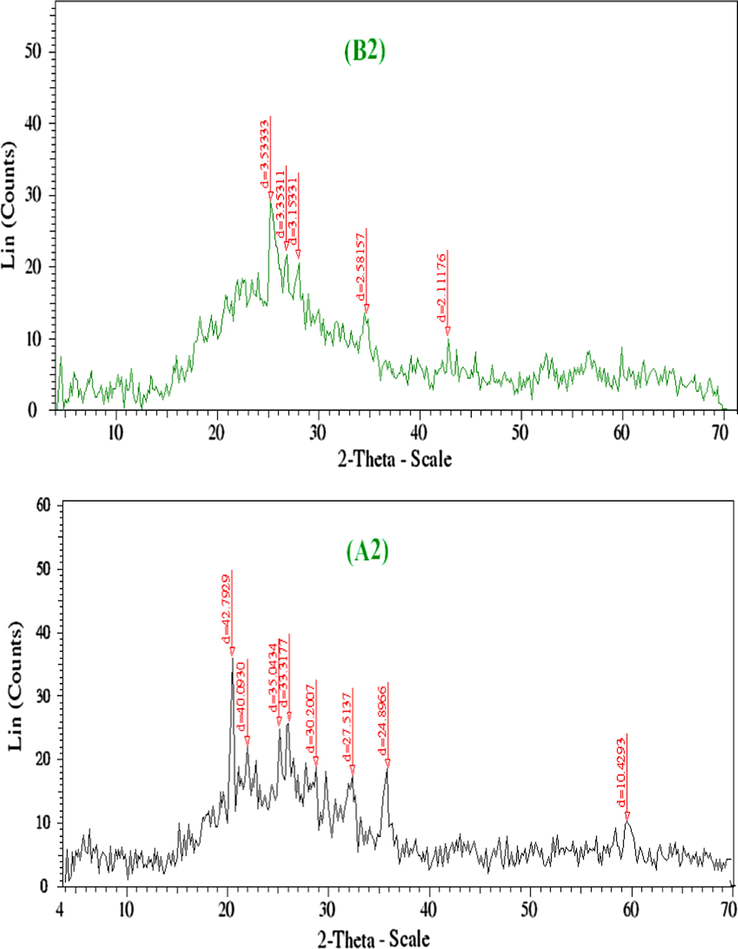
- XRD spectra of Mn(II) complexes before and after irradiation (B2 and A2).
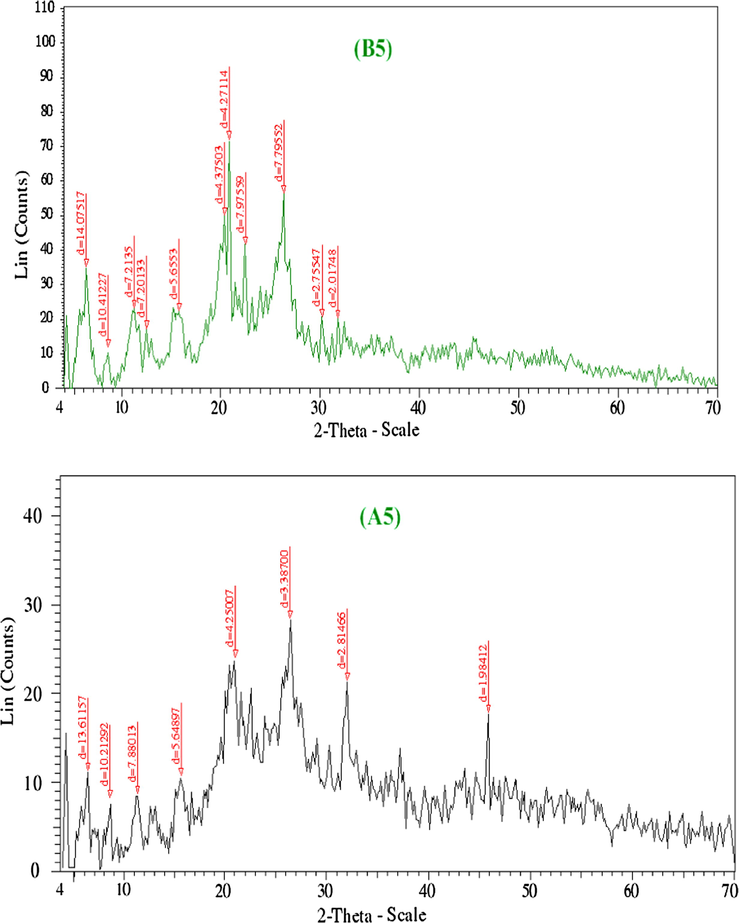
- XRD spectra of Pd(II) complexes before and after irradiation (B5 and A5).
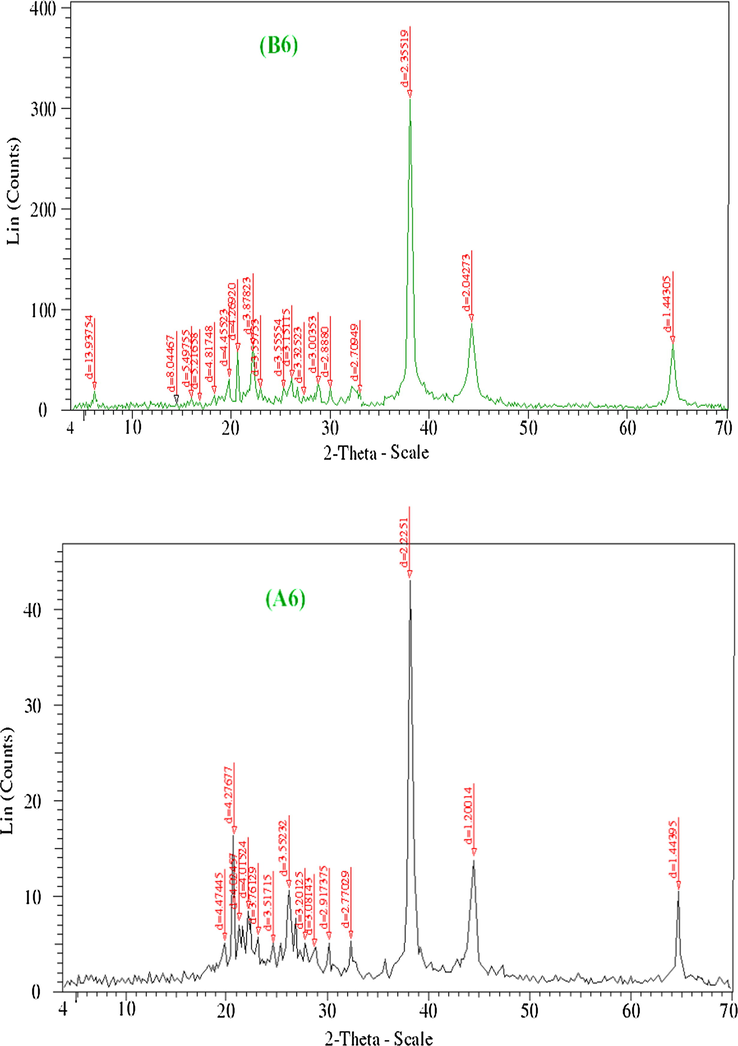
- XRD spectra of Ag(I) complexes before and after irradiation (B6 and A6).
As shown in Figs. 5a–5c, complexes of Mn2+, Pd2+, Ag2+ showed new peaks and some of them displaced to longer interplanar spacings. After irradiation, the position of atoms in the lattice changes and consequently, the scattering power also changed, leading to changes in intensity which exhibited a high intensity (Jayashri et al., 2014). It is noted that the effect of γ-irradiation caused a noticeable transform in the intensity of the peaks. In fact, the intensity of the peaks of irradiated is sharper than unirradiated.
3.4 Thermal studies (TGA/DTG)
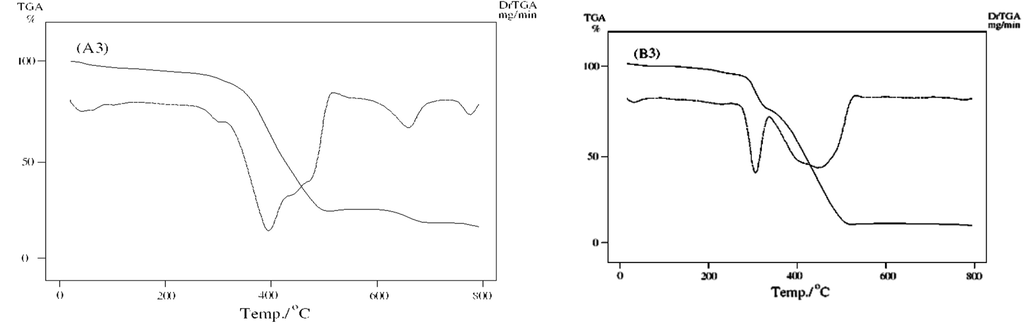
The thermal behavior of the B and its previously synthesized B1–B7 complexes and A1–A7 are listed in Table 3 and Figs. 6a–6d. The thermal behaviors of the ligands and their complexes B1–B7 and A1–A7 were investigated by thermogravimetric studies in temperature range 25–800 °C. The character of anticipated chemical change with temperature and percent of metal oxide achieved is summarized in Table 3. aDehydration. bDesolvation. cFinal product percent. dDecomposition.
No.
Compound
TAG(A)/°C
Wt. loss Calc. (Found) %
Reaction
Leaving species
B
H2L
At 190
–
–
Melting
190–633
99.9
d
Gradaual decomp
A
H2L
At 190
–
–
melting
240–680
100
d
Gradaual decomp
B1
VO(HL)2
210–570
86(84.02)
d
Completion of decomp
At 750
14.02(15.98)
VO + 3C
A1
VO(HL)2
210–570
86(84.02)
d
Completion of decomp
At 750
14.02(15.98)
VO + 3C
B2
Mn(H2L) SO4·2H2O
30–279
4.2(4.9)
a
-2H2O
279–719
82(81.4)
d
Completion of decomp
At 798
13.8(13.7)
MnO + 3C
A2
Mn(H2L) SO4·2H2O
30–279
4.2(4.9)
a
-2H2O
279–719
83.4(81.4)
d
Completion of decomp
At 798
12.48(13.7)
MnO + 3C
B3
Zn(H2L)2SO4
395–719
87.4(86.22)
d
Completion of decomp
At 798
12.6(13.78)
ZnO + 2C
A3
Zn(H2L)2SO4
395–719
87.4(86.22)
d
Completion of decomp
At 798
12.6(13.78)
ZnO + 2C
B4
Ru(HL)3
210–389
87.9(88.7)
d
Completion of decomp.
389–688
12.07(12.1)
RuO2
A4
Ru(HL)3
180–493
77.3(79.5)
d
Completion of decomp.
493–680
22.6(20.5)
Ru2O3
B5
Pd(H2L)Cl2·½ETOH
30–196
4.3(4.9)
b
_½EtOH
196–383
70 (70.67)
d
Completion of decomp.
At 561
24.9(25.02)
PdO + C
A5
Pd(H2L)Cl2·½ETOH
30–200
4.9(4.3)
b
-½EtOH
200–332
77.2 (75.9)
d
Completion of decomp
At 699
17.9(19.8)
Pd
B6
Ag(HL)(H2L)·½ETOH·H2O
30–113
5.1(7.03)
a + b
-½ETOH + H2O
390–642
87.49(86)
d
Completion of decomp
At 799
7.5(6.96)
½AgO
A6
Ag(HL)(H2L)·½ETOH·H2O
30–113
5.1(7.03)
a + b
-½ETOH + H2O
390–642
87.49(86)
d
Completion of decomp
At 799
7.5(6.96)
½AgO
B7
Hg (H2L)Cl2·½H2O
30–100
1.4(1.39)
a
-½H2O
395–615
81(79.9)
d
Completion of decomp
At 799
17.6(18.7)
½HgO
A7
Hg (H2L)Cl2·½H2O
30–100
1.4(1.39)
a
½H2O
395–615
81(79.9)
d
Completion of decomp
At 799
17.6(18.7)
½HgO
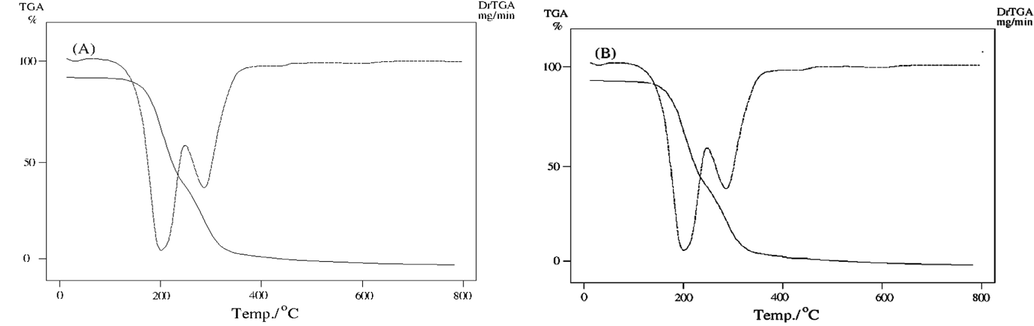
TGA/DTG curves of ligand before and after irradiation (B and A).
TGA/DTG curves of unirradiated (B3) and irradiated (A3).
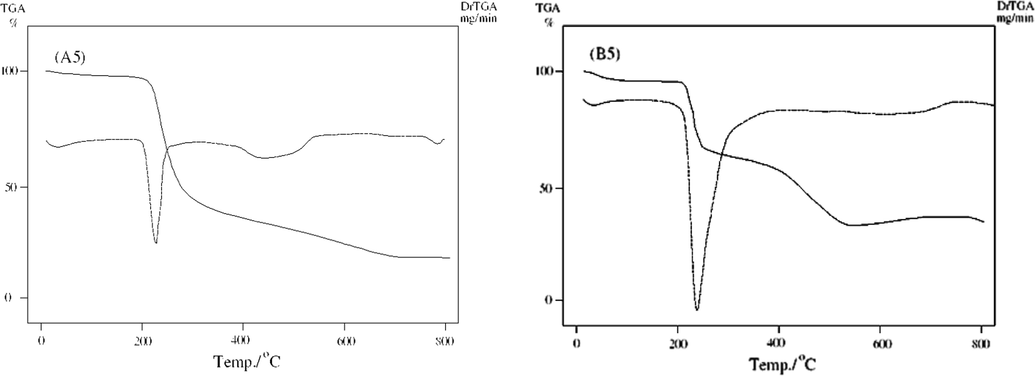
TGA/DTG curves of unirradiated (B5) and irradiated (A5).
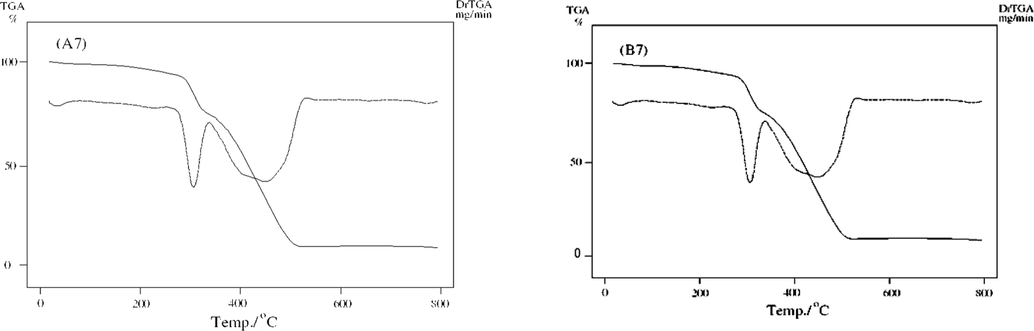
TGA/DTG curves of unirradiated (B7) and irradiated (A7).
The TG curve of B and A (Fig. 6a) showed a thermal stability till 150 °C and also showed two decomposition steps in the temperature range 150–633 °C; 155–680 °C with total weight loss of calc 99.9% (Found 100%); calc100% (Found 100%) before and after γ-irradiation, respectively. After γ-irradiation, the thermogravimetric analyses curves of the ligand revealed that γ-irradiation persuaded thermal stability to the substance than that of unirradiated. These results coincide well with the structure of the ligand resolute from elemental analysis and IR spectrum.
The TG curve of VO2+complexes B1 and A1 (Table 3) exhibited a gradual decomposition at a temperature range 195–570 °C, leaving VO as ending remainder at 570 °C. The TG curve after γ-irradiation is similar to that of before irradiation
TGA curve for B2 and A2 exhibited three degradation stages before and after γ-irradiation (Fig. 6b). TG curves of B2 exhibited weight loss in the temperature range 30–100 °C (Calc./Found % 4.2/4.9 that was allocated to loss of two molecules of water. The TG curve showed gradual decomposition at a temperature range 279–490 °C, leaving MnO as final remainder at 798 °C. The TG curve after γ-irradiation is similar to that of before irradiation
As shown in Fig. 6c, TGA curve of Zn2+ complexes B3 and A3 illustrated the first stage at temperature range 233–719 °C and second stage ended with leaving ZnO as final residue at 798 °C. The TG curve after irradiation of complex A3 reveals no change as compared to B3 before irradiation.
The TG curve of Ru3+complexes exhibited two degradation stages before and after γ-irradiation (Table 3). For B4, the first stage starts at temperature range 150–389 °C and the second stage ended with leaving RuO2 as final residue at 688 °C. For A4, the TG curve showed a gradual decomposition at a temperature range 180–493 °C, leaving Ru2O3 as ending remains at 680 °C.
Pd2+ complexes B5 and A5 demonstrated weight loss in the temperature range 30–196 °C (Calc./Found % 4.3/4.9) that was assigned to loss of half ethanol molecule. The TG curve revealed gradual decomposition at a temperature range 196–383 °C, leaving PdO as final residue at 561 °C. But in case of A5, the TG curve of demonstrated weight loss in the temperature range 30–200 °C (Calc./Found% 4.3/4.9) that was assigned to loss of half molecule of ethanol (Figs. 6a–6d). The TG curve displayed steady rotting at a temperature range 200–332 °C, leaving Pd as final remainder at 699 °C.
The TG curve of Ag+ complexes before and after γ-irradiation B6 and A6 showed weight loss of (Calc./Found% 5.01/7.03) at temperature range 30–113 °C, that was assigned to loss of molecule of water and half molecule of ethanol (Table 3). On additional heating of B6 and A6 decomposed at 185–642 °C. The thermogram of complex illustrated one step of decomposition at 279 °C includes the completion of the decomposition process. The TG curve of A6 after γ-irradiation is similar to that of B6 before γ-irradiation.
Hg2+ complexes before and after γ-irradiation B7 and A7 displayed three degradation stages (Fig. 6d). The first stage of B7 exhibited weight loss in the temperature range 30–100 °C (Calc./Found% 1.4/1.39) that was assigned to loss of half molecule of water. The second stage exhibited a gradual decomposition at a temperature range 255–615 °C. The final stage at 799 °C assigned to leave half molecule of HgO. After γ- irradiation, the TG curve of A7 is similar to B7 before γ-irradiation.
It is noted that the slightly higher value produced for the percentage of the remainder when relative to the theoretical value of pure metal oxide in B1, A1, B2, A2, B3, A3 and B5 exhibited that the remains were impure with carbon. The character of the remains was accounted and recognized by infrared spectroscopy (Ahmed, 2006; Sanaa et al., 2015).
3.5 Molecular modeling
Molecular modeling was applied to investigate the three-‐dimensional arrangements of atoms in the chelates by employing semi‐empirical molecular orbital calculations at the PM3 level provided by the Hyperchem 8.03 program (HyperChem, 2007).
Several shots to develop suitable crystals for X-ray crystallography were ineffective. Using theoretical parameters helps to characterize the molecular structure of the investigated complexes. Thus, the geometries of the ligand, Mn2+, Pd2+ and Hg2+complexes were optimized by hyper chem. 8.03 Molecular Modeling and Analysis Program (Mohamed et al., 2015) using the molecular mechanics calculations (PM3). The calculated bond lengths and bond angles for the B, B2, B5 and B7 complexes are listed in tables (S1–S4).
Ligand (B)
Bond length
Bond angles
C(18) —C(19)
1.3884
C(18) —C(19) —C(14)
119.9606
C(17) —C(18)
1.3913
C(19) —C(18) —C(17)
120.3044
C(16) —C(17)
1.3913
C(18) —C(17) —C(16)
119.8587
C(15) —C(16)
1.3894
C(17) —C(16) —C(15)
120.4912
C(14) —C(19)
1.4016
C(16) —C(15) —C(14)
119.7169
C(14) —C(15)
1.4020
C(19) —C(14) —C(15)
119.6678
N(13) —C(14)
1.4412
C(19) —C(14) —N(13)
120.6384
C(12) —N(13)
1.4753
C(15) —C(14) —N(13)
119.4998
C(11) —O(21)
1.2198
C(14) —N(13) —C(12)
116.9405
C(11) —C(12)
1.5197
N(13) —C(12) —C(11)
114.9431
N(10) —C(11)
1.4462
O(21) —C(11) —C(12)
125.1036
N(9) —N(10)
1.4320
O(21) —C(11) —N(10)
118.4499
C(8) —S(24)
1.6585
C(12) —C(11) —N(10)
116.3376
C(8) —N(9)
1.4463
C(11) —N(10) —N(9)
119.2792
N(7) —C(8)
1.3841
N(10) —N(9) —C(8)
119.6348
C(6) —Cl(26)
1.6819
S(24) —C(8) —N(9)
120.7164
C(5) —C(6)
1.3958
S(24) —C(8) —N(7)
128.3888
C(4) —C(5)
1.3864
N(9) —C(8) —N(7)
110.6920
C(3) —N(7)
1.4378
C(8) —N(7) —C(3)
129.2920
C(3) —C(4)
1.4085
Cl(26) —C(6) —C(5)
119.5073
C(2) —C(3)
1.4000
Cl(26) —C(6) —C(1)
119.8414
C(1) —C(6)
1.3922
C(5) —C(6) —C(1)
120.6513
C(1) —C(2)
1.3909
C(6) —C(5) —C(4)
119.6804
C(5) —C(4) —C(3)
119.9811
N(7) —C(3) —C(4)
116.5052
N(7) —C(3) —C(2)
123.5420
C(4) —C(3) —C(2)
119.9522
C(3) —C(2) —C(1)
119.6851
C(6) —C(1) —C(2)
120.0495
B2 Complex
Bond length
Bond angles
O(64) —O(65)
1.5366
O(65) —O(64) —S(61)
137.6738
S(61) —O(64)
2.2716
O(64) —S(61) —O(63)
120.6658
S(61) —O(63)
1.4437
O(64) —S(61) —O(62)
119.0202
S(61) —O(62)
1.4394
O(64) —S(61) —Mn(28)
127.9320
C(52) —C(53)
1.3848
O(63) —S(61) —O(62)
117.2055
C(51) —C(52)
1.3860
O(63) —S(61) —Mn(28)
80.4077
C(50) —C(51)
1.3916
O(62) —S(61) —Mn(28)
78.3179
C(49) —C(50)
1.4064
C(52) —C(53) —C(48)
127.6463
C(48) —C(53)
1.3898
C(53) —C(52) —C(51)
116.4294
C(48) —C(49)
1.4281
C(52) —C(51) —C(50)
120.6844
N(47) —C(48)
1.4617
C(51) —C(50) —C(49)
117.6728
C(45) —N(47)
1.5120
C(50) —C(49) —C(48)
125.1593
C(43) —C(45)
1.5202
C(53) —C(48) —C(49)
110.2287
C(43) —O(44)
1.2056
C(53) —C(48) —N(47)
116.1241
N(42) —C(43)
1.2552
C(49) —C(48) —N(47)
133.4698
N(39) —N(42)
1.3246
C(48) —N(47) —C(45)
133.7278
C(38) —S(41)
1.5706
N(47) —C(45) —C(43)
123.0580
C(38) —N(39)
1.4823
C(43) —O(44) —Mn(28)
112.8550
N(37) —C(38)
1.3237
C(45) —C(43) —O(44)
122.2653
C(34) —Cl(36)
1.7138
C(45) —C(43) —N(42)
146.3721
C(34) —C(35)
1.4048
O(44) —C(43) —N(42)
91.0951
C(33) —C(34)
1.3923
C(43) —N(42) —N(39)
151.7469
C(32) —C(33)
1.3740
N(42) —N(39) —C(38)
120.1909
C(31) —N(37)
1.3869
N(42) —N(39) —Mn(28)
72.1193
C(31) —C(32)
1.4047
C(38) —N(39) —Mn(28)
119.2748
C(30) —C(35)
1.4056
S(41) —C(38) —N(39)
111.8708
C(30) —C(31)
1.4097
S(41) —C(38) —N(37)
113.0722
Mn(28) —S(61)
2.4755
N(39) —C(38) —N(37)
135.0570
Mn(28) —O(58)
1.9655
C(38) —N(37) —C(31)
125.3202
Mn(28) —O(44)
2.0268
C(34) —C(35) —C(30)
116.7059
Mn(28) —N(39)
2.1198
Cl(36) —C(34) —C(35)
126.5660
C(23) —C(24)
1.3969
Cl(36) —C(34) —C(33)
114.8739
C(22) —C(23)
1.3900
C(35) —C(34) —C(33)
117.9840
C(21) —C(22)
1.3908
C(34) —C(33) —C(32)
105.7759
C(20) —C(21)
1.4020
C(33) —C(32) —C(31)
111.3388
C(19) —C(24)
1.3970
N(37) —C(31) —C(32)
119.0564
C(19) —C(20)
1.4121
N(37) —C(31) —C(30)
132.1366
N(18) —C(19)
1.4445
C(32) —C(31) —C(30)
108.3607
C(16) —N(18)
1.5109
C(35) —C(30) —C(31)
118.3432
O(15) —Mn(28)
1.9317
S(61) —Mn(28) —O(58)
80.9487
C(14) —C(16)
1.5081
S(61) —Mn(28) —O(44)
87.0828
C(14) —O(15)
1.2272
S(61) —Mn(28) —N(39)
95.1401
N(13) —C(14)
1.2675
S(61) —Mn(28) —O(15)
175.5241
N(10) —Mn(28)
2.0354
S(61) —Mn(28) —N(10)
102.6261
N(10) —N(13)
1.3621
O(58) —Mn(28) —O(44)
167.1509
C(9) —S(12)
1.5935
O(58) —Mn(28) —N(39)
91.9307
C(9) —N(10)
1.4569
O(58) —Mn(28) —O(15)
94.8468
N(8) —C(9)
1.3153
O(58) —Mn(28) —N(10)
105.4010
C(5) —Cl(7)
1.7615
O(44) —Mn(28) —N(39)
84.4618
C(5) —C(6)
1.6584
O(44) —Mn(28) —O(15)
96.9765
C(4) —C(5)
1.6045
O(44) —Mn(28) —N(10)
81.6900
C(3) —C(4)
1.6056
N(39) —Mn(28) —O(15)
83.4170
C(2) —N(8)
1.4023
N(39) —Mn(28) —N(10)
156.7942
C(2) —C(3)
1.6962
O(15) —Mn(28) —N(10)
79.9041
C(1) —C(2)
1.7391
C(23) —C(24) —C(19)
123.2279
C(24) —C(23) —C(22)
120.5888
C(23) —C(22) —C(21)
117.5739
C(22) —C(21) —C(20)
118.5725
C(21) —C(20) —C(19)
125.0747
C(24) —C(19) —C(20)
111.7476
C(24) —C(19) —N(18)
123.1367
C(20) —C(19) —N(18)
124.5001
C(19) —N(18) —C(16)
133.8050
N(18) —C(16) —C(14)
112.2615
Mn(28) —O(15) —C(14)
115.6732
C(16) —C(14) —O(15)
122.6012
C(16) —C(14) —N(13)
119.4036
O(15) —C(14) —N(13)
117.0367
C(14) —N(13) —N(10)
121.1213
Mn(28) —N(10) —N(13)
104.3028
Mn(28) —N(10) —C(9)
119.4383
N(13) —N(10) —C(9)
111.0143
S(12) —C(9) —N(10)
124.2623
S(12) —C(9) —N(8)
119.0867
N(10) —C(9) —N(8)
114.4181
C(9) —N(8) —C(2)
130.0752
C(5) —C(6) —C(1)
120.1778
Cl(7) —C(5) —C(6)
119.3424
Cl(7) —C(5) —C(4)
19.1887
C(6) —C(5) —C(4)
120.4980
C(5) —C(4) —C(3)
122.7399
C(4) —C(3) —C(2)
119.7557
N(8) —C(2) —C(3)
112.9010
N(8) —C(2) —C(1)
127.3640
C(3) —C(2) —C(1)
116.9999
C(6) —C(1) —C(2)
119.5663
B5 Complex
Bond length
Bond angles
Pd(28) —Cl(30)
2.2962
Cl(30) —Pd(28) —Cl(29)
84.8166
Pd(28) —Cl(29)
2.3366
Cl(30) —Pd(28) —O(15)
82.0702
C(23) —C(24)
1.4250
Cl(30) —Pd(28) —N(10)
91.4175
C(22) —C(23)
1.3798
Cl(29) —Pd(28) —O(15)
84.4103
C(21) —C(22)
1.3954
Cl(29) —Pd(28) —N(10)
175.9945
C(20) —C(21)
1.3814
O(15) —Pd(28) —N(10)
93.7334
C(19) —C(24)
1.4275
C(23) —C(24) —C(19)
115.6252
C(19) —C(20)
1.4103
C(24) —C(23) —C(22)
122.9319
N(18) —C(19)
1.4370
C(23) —C(22) —C(21)
119.8203
C(16) —N(18)
1.4904
C(22) —C(21) —C(20)
119.5132
O(15) —Pd(28)
2.0015
C(21) —C(20) —C(19)
121.2321
C(14) —C(16)
1.4947
C(24) —C(19) —C(20)
120.3784
C(14) —O(15)
1.3351
C(24) —C(19) —N(18)
124.2776
N(13) —C(14)
1.4522
C(20) —C(19) —N(18)
115.0896
N(10) —Pd(28)
1.9935
C(19) —N(18) —C(16)
121.9717
N(10) —N(13)
1.5418
N(18) —C(16) —C(14)
108.1478
C(9) —S(12)
1.6337
Pd(28) —O(15) —C(14)
91.1223
C(9) —N(10)
1.4791
C(16) —C(14) —O(15)
121.7885
N(8) —C(9)
1.4651
C(16) —C(14) —N(13)
127.2815
C(5) —Cl(7)
1.6848
O(15) —C(14) —N(13)
110.5833
C(5) —C(6)
1.3859
C(14) —N(13) —N(10)
103.9664
C(4) —C(5)
1.3964
Pd(28) —N(10) —N(13)
93.5552
C(3) —C(4)
1.3834
Pd(28) —N(10) —C(9)
122.5539
C(2) —N(8)
1.4446
N(13) —N(10) —C(9)
113.6598
C(2) —C(3)
1.4047
S(12) —C(9) —N(10)
123.8522
C(1) —C(6)
1.4158
S(12) —C(9) —N(8)
124.2674
C(1) —C(2)
1.4263
N(10) —C(9) —N(8)
111.2228
C(9) —N(8) —C(2)
115.5962
C(5) —C(6) —C(1)
121.0817
Cl(7) —C(5) —C(6)
119.3014
Cl(7) —C(5) —C(4)
119.5419
C(6) —C(5) —C(4)
121.1561
C(5) —C(4) —C(3)
119.1813
C(4) —C(3) —C(2)
120.7993
N(8) —C(2) —C(3)
119.2049
N(8) —C(2) —C(1)
120.0554
C(3) —C(2) —C(1)
120.5987
C(6) —C(1) —C(2)
117.1317
B7 Complex
Bond length
Bond angles
Hg(28) —Cl(30)
2.2680
Cl(30) —Hg(28) —Cl(29)
150.5859
Hg(28) —Cl(29)
2.3082
Cl(30) —Hg(28) —O(15)
99.7028
C(23) —C(24)
1.3907
Cl(30) —Hg(28) —N(10)
123.1647
C(22) —C(23)
1.3909
Cl(29) —Hg(28) —O(15)
88.4495
C(21) —C(22)
1.3909
Cl(29) —Hg(28) —N(10)
85.8140
C(20) —C(21)
1.3893
O(15) —Hg(28) —N(10)
81.9673
C(19) —C(24)
1.3996
C(23) —C(24) —C(19)
119.3978
C(19) —C(20)
1.4007
C(24) —C(23) —C(22)
120.5707
N(18) —C(19)
1.4509
C(23) —C(22) —C(21)
119.9143
C(16) —N(18)
1.4850
C(22) —C(21) —C(20)
120.2707
O(15) —Hg(28)
2.0983
C(21) —C(20) —C(19)
119.7403
C(14) —C(16)
1.5229
C(24) —C(19) —C(20)
120.1041
C(14) —O(15)
1.2376
C(24) —C(19) —N(18)
120.5004
N(13) —C(14)
1.4250
C(20) —C(19) —N(18)
119.2458
N(10) —Hg(28)
2.1511
C(19) —N(18) —C(16)
115.8452
N(10) —N(13)
1.4696
N(18) —C(16) —C(14)
110.3420
C(9) —S(12)
1.6505
Hg(28) —O(15) —C(14)
112.2937
C(9) —N(10)
1.4818
C(16) —C(14) —O(15)
121.2779
N(8) —C(9)
1.3850
C(16) —C(14) —N(13)
118.7978
C(5) —Cl(7)
1.6757
O(15) —C(14) —N(13)
119.6768
C(5) —C(6)
1.3952
C(14) —N(13) —N(10)
117.8180
C(4) —C(5)
1.3996
Hg(28) —N(10) —N(13)
103.6116
C(3) —C(4)
1.3866
Hg(28) —N(10) —C(9)
107.4776
C(2) —N(8)
1.4395
N(13) —N(10) —C(9)
112.7155
C(2) —C(3)
1.4178
S(12) —C(9) —N(10)
123.6712
C(1) —C(6)
1.3960
S(12) —C(9) —N(8)
121.1920
C(1) —C(2)
1.4098
N(10) —C(9) —N(8)
115.0862
C(9) —N(8) —C(2)
131.8349
C(5) —C(6) —C(1)
120.3232
Cl(7) —C(5) —C(6)
119.8494
Cl(7) —C(5) —C(4)
119.7000
C(6) —C(5) —C(4)
120.4505
C(5) —C(4) —C(3)
119.8282
C(4) —C(3) —C(2)
120.3443
N(8) —C(2) —C(3)
115.7849
N(8) —C(2) —C(1)
124.5294
C(3) —C(2) —C(1)
119.3455
C(6) —C(1) —C(2)
119.7007
The energetic properties of these compounds are listed in Table 5. The optimized constructions of the ligand and B2, B5 and B7 are shown in Figs. 7a, b and 8a, b. The main selected bond lengths demonstrated in Table 4 elicited the following:
-
The obtained bond lengths of the N—N and C—OH groups for the ligand were 1.4320 and 1.2198 Å, respectively. The bond lengths of these groups appeared within the range 1.3246–1.5418 and 1.2056–1.3351 Å in the complexes which confirmed the coordination of these groups to the metal ions. The M—O bond length is found to be shorter than the M—N bond length, except for Pd complex.
-
The values of bond angle confirmed the octahedral geometry for B2 and square planer for B5 and B7 complexes (Mohamed et al., 2015). The compound with higher HOMO energy implies that the molecule is a superior electron donor.
-
The lower HOMO energy values illustrate that molecule donating electron aptitude is the weaker. On contrary, the LUMO energy presents the ability of a molecule receiving electron (Yousef et al., 2012; Seda et al., 2009). The energies of the HOMO and LUMO are negative which showed that the compounds under investigation were stable.
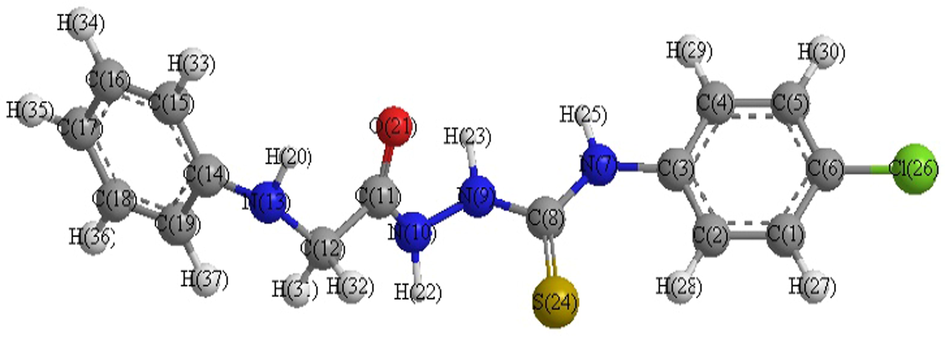
- Optimized molecular structure of ligand (B).
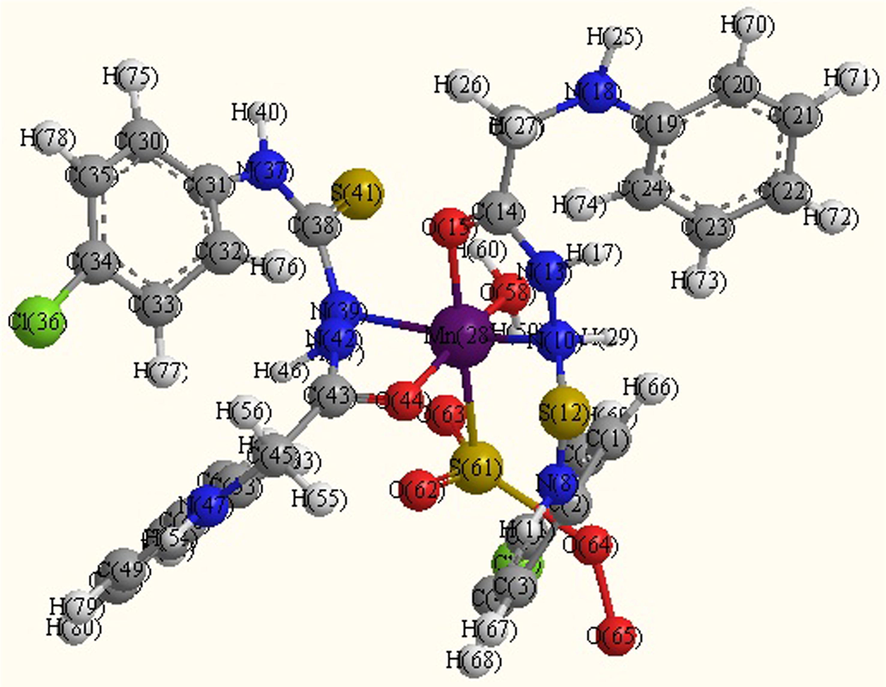
- Optimized molecular structure Mn complex (B2).
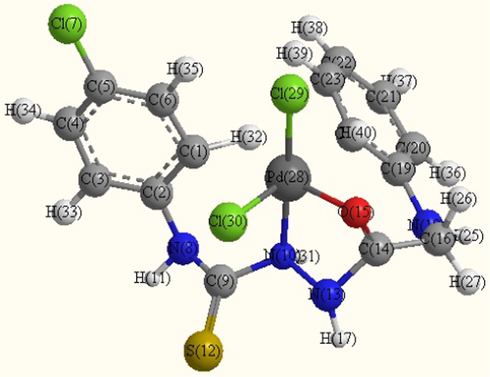
- Optimized molecular structure of Pdomplex (B5).
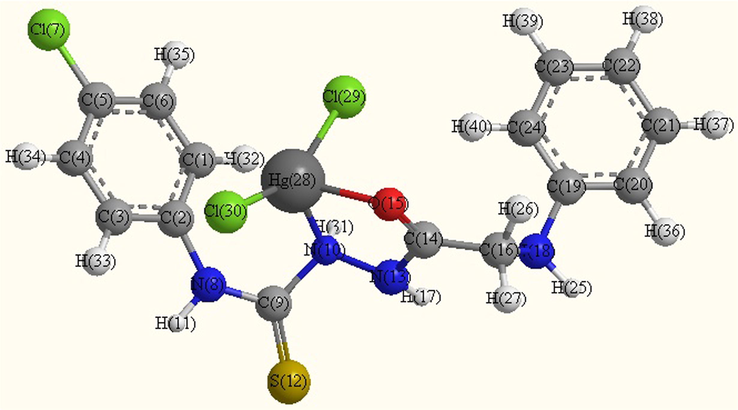
- Optimized molecular structure of Hg complex (B7).
| Compound | Bond length | ||||||
|---|---|---|---|---|---|---|---|
| N7—C8 (L) | C8—N9 (L) | N9—N10 (L) | N10—C11 (L) | C11—O21 (L) | C11—C12 (L) | C12—N13 (L) | |
| Ligand | 1.38 | 1.45 | 1.43 | 1.45 | 1.22 | 1.52 | 1.48 |
| N8—C9 | C9—N10 | N10—N13 | N13—C14 | C14—O15 | C14—C16 | C16—N18 | |
| Mn(II) | 1.32 | 1.46 | 1.36 | 1.27 | 1.23 | 1.51 | 1.51 |
| 1.32 | 1.48 | 1.32 | 1.26 | 1.21 | 1.52 | 1.51 | |
| Pd(II) | 1.47 | 1.48 | 1.54 | 1.45 | 1.34 | 1.49 | 1.49 |
| Hg(II) | 1.39 | 1.48 | 1.47 | 1.43 | 1.24 | 1.52 | 1.49 |
| The assignment of the theoretical parameters | Compound | |||
|---|---|---|---|---|
| Ligand | Mn | Pd | Hg | |
| Total energy, Kcal/mol | −3567.1399 | −8513.814 | −4220.632 | −3989.931 |
| Binding energy, Kcal/mol | −3713.8618 | −8551.775 | −4235.8677 | −4006.8366 |
| Potential energy, Kcal/mol | −79422.940 | −207356.48 | −118384.797 | −94919.801 |
| Isolated Atomic Energy, Kcal/mol | −75709.078 | −198804.706 | −114148.929 | −90912.965 |
| Electronic Energy, Kcal/mol | −548786.102 | −2509439.00 | −877684.483 | −696512.888 |
| Core-Core Interaction, Kcal/mol | 469363.162 | 2302082.52 | 759299.686 | 601593.087 |
| Heat of Formation | 237.9671 | −59.9166 | −136.058 | 17.6623 |
| Dipole moment (Debye) | 2.878 | 6.234 | 11.426 | 5.841 |
| HOMO (eV) | −8.414 | −7.287 | −7.419 | −9.465 |
| LUMO (eV) | −1.592 | −1.652 | −1.894 | −2.291 |
3.6 Antibacterial activity
The synthesized ligand and its metal complexes before and after γ-irradiation were tested for their potential antibacterial activities (Tweedy, 1964). Results in Tables 6 and 7 and Figs. 9 and 10 illustrated antibacterial activities against the experienced bacteria. It was established that antibacterial activities of the artificial compounds before and after γ-irradiation were proportionally increased with concentration. The tested compounds before and after γ-irradiation are found to have remarkable biological activities. The results indicated that Ru3+complexes exhibited a potent antibacterial activity. The antibacterial activities of the experienced ligand and complexes against E. coli were found to follow the order: Ru3+ > Pd2+ > Ag+ > Zn2+ > VO2+ > Hg2+ > Mn2+ > H2L for 1 µg before γ-irradiation. While, antibacterial activities of 5 μg/ml, 7 μg/ml and 10 μg/ml followed the order Ru3+ > Hg2+ > Pd2+ > H2L > VO2+ > Mn2+ > Zn2+ > Ag+ before γ-irradiation. Alternatively, antibacterial activity was evidenced when using the compound and metal complexes with S. pyogenes followed the order: Ag+ > H2L > Hg2+ > Zn2+ > Pd2+ > Ru3+ > Mn2+ > VO2+ with 1 μg/ml concentration (Hanaa et al., 2016). While, antibacterial activities of 5 μg/ml, 7 μg/ml and 10 μg/ml concentrations of compounds was in the following order: Hg(II) > Ru3+ > Ag+ > H2L > Mn2+ > Zn2+ > Pd2+ > VO2+ (Mehmet et al., 2010). The complexes formation could make the penetration across the cell membrane of E. coli easier and can be elucidated by Tweedy’s chelation theory (Tweedy, 1964). Chelation could improve the lipophilic character of the central metal atom which in rotate, which improved its penetration through the lipoid layer of the membrane thus causing the metal complex to cross the bacterial membrane more successfully thus increasing the activity of the complexes. In addition, many other reasons for instance solubility, dipole moment, conductivity influenced by metal ion may be probable causes for amazing antibacterial activities of these complexes (Chohan et al., 2006). Exposure to γ-irradiation remarkably enhanced the antibacterial activity for both the ligand and its complexes when it was used in case of E. coli. The activity also increased after irradiation in case of S. pyogenes. This may be attributed to the different nature of the cell wall for both microbes which may be correlated with the above factors (Mehmet et al., 2010). Additionally, exposure to γ-irradiation increased the antibacterial activity of both the free a cyclic ligand and their complexes when used with both concentrations (1 μg/ml, 5 μg/ml, 7 μg/ml and 10 μg/ml) in case of the Gram positive S. pyogenes bacterium. It was also observed that some moieties for instance N(2)H linkage introduced into such compounds exhibits widespread biological that may be accountable for raise in hydrophobic nature and lipo-solubility of the molecules in crossing the cell membrane of the bacteria and augment biological consumption ratio and activity of complexes activity (Har et al., 2016; Huang et al., 2018, 2019; Zhenzhen et al., 2017). It is concluded that these compounds have antibacterial activities and can be used in the future as therapeutic drugs for bacterial diseases. Where * after gamma irradiation (6Mega Rad). Where * after gamma irradiation (6Mega Rad).
Compound
Inhibition %
S. pyogenes
1 µg/ml
5 µg/ml
7 µg/ml
10 µg/ml
H2L
82.50
94.23
96
98
H2L *
82.88
96.00
97
99
VO(HL)2
58
65
70
75
VO(HL)2*
70.19
94.23
97
99
Mn(H2L)2SO4·2H2O
64.23
82.88
85
90
Mn(H2L)2SO4·2H2O*
90.38
94.8
96.5
98
Zn(H2L)2SO4
66.33
79.66
80
85
Zn(H2L)2SO4*
89.66
94.5
92
97
Ru(HL)3
64.5
96.16
98
99.3
Ru(HL)3*
89.5
98.33
99
99.6
Pd(H2L)Cl2·½ETOH
65.57
67.11
73
79
Pd(H2L)Cl2·½ETOH*
90
95.4
93
97
Ag(H2L)(HL)H2O·½ETOH
94.23
96
98
99
Ag(H2L)(HL)H2O·½ETOH*
74.42
95.38
97
99.6
Hg (H2L)Cl2·½H2O
80.19
99.23
99.5
99.8
Hg (H2L)Cl2·½H2O*
91.53
95.19
96
98
Compound
Inhibition %
E. coli
1 µg/ml
5 µg/ml
7 µg/ml
10 µg/ml
H2L
59.66
91.66
94
96
H2L*
76.16
97.11
98
99.2
VO(HL)2
82.16
87
92
94
VO(HL)2*
92.6
96.83
97.8
98.7
Mn(H2L)2SO4·2H2O
77.83
86.50
90.7
93.5
Mn(H2L)2SO4·2H2O*
78.16
95.16
97
99
Zn(H2L)2SO4
82.8
85.8
90
94
Zn(H2L)2SO4*
86.4
92.4
95.5
99
Ru(HL)3
91
95.4
95
99
Ru(HL)3*
93.6
96.8
96
99.2
Pd(H2L)Cl2·½ETOH
88
92.6
94
96
Pd(H2L)Cl2·½ETOH*
93.83
94.83
96
98
Ag(H2L)(HL)H2O·½ETOH
79.91
83
86
92
Ag(H2L)(HL)H2O·½ETOH*
85.66
97
90
99
Hg (H2L)Cl2·½H2O
82
93.4
95
97
Hg (H2L)Cl2·½H2O*
93.2
100
100
100
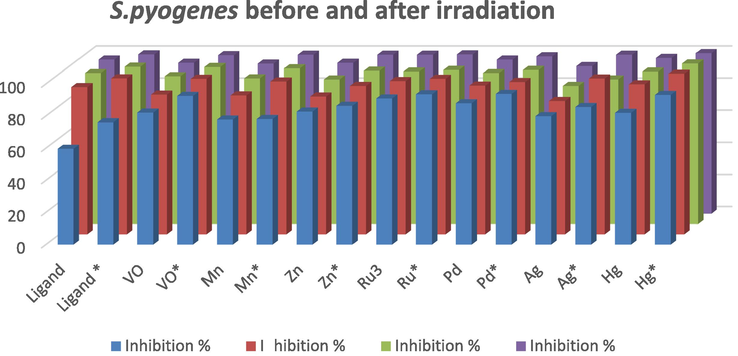
Antibacterial activity for the ligand and its metal complexes before and after irradiation against S. pyogenes.
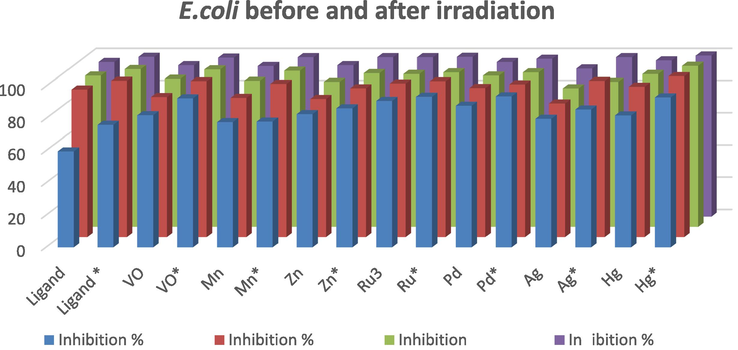
Antibacterial activity for the ligand and its metal complexes before and after irradiation against E. coli.
4 Conclusions
In summary, the effect of high energetic gamma ray on VO2+, Mn2+, Zn2+, Ru3+, Pd2+, Ag+ and Hg2+ of thiosemicarbazone ligand have been studied by different analytical and spectroscopic methods. The result confirmed the following:
-
The ligand behaves as mono basic tetradentate in complex B1 or neutral bi, tetradentate in complexes B5, B7 and B2, B3, B6, respectively.
-
1H NMR and IR exhibit higher intensity of the bands by using radiation
-
γ-ray improve the thermal stability of the compounds by using TGA.
-
X-ray diffraction pattern after irradiation show that the amorphous nature of the complexes changed to highly crystalline materials with high intensity and sharp line of diffraction.
-
γ-ray confirmed some better determined in structures with an remarkably higher absorbance and no change in the geometry of metal complexes
-
The suggested structures of complexes were geometrically adjusted and their structural limits were calculated. The computational calculations confirmed that B5 and B7 complexes have square planer geometry but Mn2+complex has octahedral geometry, this is also in a good contract with the trial results.
-
In vitro antibacterial activity showed that these chelates exhibited amazing antibacterial activity which increases after irradiation for some compound.
Declaration of Competing interest
The authors declare that they have no conflict of interest.
References
- Synthesis, molecular modeling, thermal and spectral studies of metal complexes of hydrazone derived from 5-acetyl-4-hydroxy-2H-1,3-thiazine-2,6(3H)-dione and thiosemicarbazide. Spectrochim. Acta A. 2011;79:1295-1303.
- [CrossRef] [Google Scholar]
- Synthesis and characterization of Cobalt(II) and Nickel(II) complexes of some Schiff bases derived from 3-hydrazino-6-methyl[1,2,4] triazin-5(4H)one. Trans. Met. Chem.. 2006;31:35-41.
- [CrossRef] [Google Scholar]
- Silver(I) thiosemicarbazone complex [Ag(catsc)(PPh3)2]NO3: synthesis, characterization, crystal structure, and antibacterial study. C. R. Chim.. 2017;20:534-539.
- [CrossRef] [Google Scholar]
- Vogel’s Textbook of Quantitative Inorganic Analysis Including Elementary Instrumental Analysis (fourth ed.). London: Longman Group; 1978. p. :316.
- Nucl. Instrum. Meth. Phys. Res. Sect. B. 2002;191:752.
- [CrossRef]
- Spectral and magnetic studies on manganese(II), cobalt(II) and nickel(II) complexes with Schiff bases. Spectrochim. Acta A. 2005;61:219-224.
- [CrossRef] [Google Scholar]
- Antibacterial, antifungal and cytotoxic properties of novel N-substituted sulfonamides from 4-hydroxycoumarin. J. Enz. Inhib. Med. Chem.. 2006;21:741-748.
- [CrossRef] [Google Scholar]
- Synthesis and characterisation of zinc, cadmium and mercury complexes of benzilbisthiosemicarbazone. Structure of cadmium derivative. Inorg. Chim. Acta. 2001;323:130-138.
- [CrossRef] [Google Scholar]
- X-ray diffraction study and biological analysis of transition metal complexes of N-4-disubstituted thiosemicarbazone. Res. J. Chem. Sci.. 2015;5:33-37.
- [Google Scholar]
- Silver(I) and gold(I) complexes with penicillamine: synthesis, spectroscopic characterization and biological studies. Polyhedron. 2012;34:210-214.
- [CrossRef] [Google Scholar]
- The use of conductivity measurements in organic solvents for the characterisation of coordination compounds. Coord. Chem. Rev.. 1971;7:81-122.
- [CrossRef] [Google Scholar]
- Binuclear cobalt(II), nickel(II), copper(II) and palladium(II) complexes of a new Schiff-base as ligand: synthesis, structural characterization, and antibacterial activity. Spectrochim. Acta A. 2010;77:911-915.
- [CrossRef] [Google Scholar]
- New 15-membered tetraaza (N4) macrocyclic ligand and its transition metal complexes: spectral, magnetic, thermal and anticancer activity. Spectrochim. Acta Part A. 2015;138:553-562.
- [Google Scholar]
- Macrocyclic [N5] transition metal complexes: synthesis, characterization and biological activities. J Inclu. Phenom. Macrocyclic Chem.. 2016;86:153-166.
- [CrossRef] [Google Scholar]
- Synthesis, spectral, DFT, and antimicrobial studies of tin(II) and lead(II) complexes with semicarbazone and thiosemicarbazones derived from (2-hydroxyphenyl)(pyrrolidin-1-yl)methanone. J. Coord. Chem.. 2016;69:343-353.
- [CrossRef] [Google Scholar]
- Differential behaviors of silver nanoparticles and silver ions towards cysteine: Bioremediation and toxicity to Phanerochaete chrysosporium. Chemosphere. 2018;203:199-208.
- [CrossRef] [Google Scholar]
- Alleviation of heavy metal and silver nanoparticle toxicity and enhancement of their removal by hydrogen sulfide in Phanerochaete chrysosporium. Chemosphere. 2019;224:554-561.
- [CrossRef] [Google Scholar]
- HyperChem,Release 8.03 for Windows, Molecular Modeling System, Hypercube Inc. 2007.
- Coordination of Fe(III), Co(II), Ni(II), Cu(II), Zn(II), Cd(II), Hg(II), Pd(II) and Pt(II) with 2,5-hexanedione bis(thiosemicarbazone), HBTS: crystal structure of cis-[Pd(HBTS)]Cl2 and 1-(2,5-dimethyl-1H-pyrrol-yl)-thiourea. Spectrochim. Acta A. 2014;130:546-552.
- [CrossRef] [Google Scholar]
- Effect of gamma-irradiation on thermal decomposition kinetics, X-ray diffraction pattern and spectral properties of tris(1,2- diaminoethane) nickel(II) sulphate. Radiat. Effects Defects Solids. 2014;169:1019-1030.
- [CrossRef] [Google Scholar]
- Synthesis and spectral investigations of Mn(II) complexes of pentadentate bis(thiosemicarbazones) Spectrochim. Acta A. 2010;75:585-588.
- [CrossRef] [Google Scholar]
- Enhancement of the catalytic activity of [Cu2(TS)(OH)2(OAc)] using superconductor cuprate sample. Trans. Met. Chem.. 2006;31:714-719.
- [CrossRef] [Google Scholar]
- Spectrochemical study and effect of high energatic gamma ray on copper (II) complexes. J. Solid State Sci.. 2011;13:2080-2085.
- [CrossRef] [Google Scholar]
- Synthesis, single crystal structure and DNA cleavage studies on first 4-N-ethyl substituted three coordinate copper(I) complex of thiosemicarbazone. Inorg. Chim. Acta. 2009;362:4185-4190.
- [CrossRef] [Google Scholar]
- Synthesis, spectroscopic and biological studies on the new symmetric Schiff base derived from 2,6-diformyl-4-methylphenol with N-aminopyrimidine. Eur. J. Med. Chem.. 2010;45:1935-1940.
- [CrossRef] [Google Scholar]
- Synthesis, spectral and theoretical studies of Ni(II), Pd(II) and Pt(II) complexes of 5-mercapto-1,2,4-triazole-3-imine-2'- hydroxynaphthaline. Spectrochim Acta A. 2015;137:919-929.
- [CrossRef] [Google Scholar]
- Synthesis and characterization of some transition metal complexes of thiosemicarbazones derived from 2-acetylpyrrole and 2-acetylfuran. Synth. React. Inorg. Metal-Org. Nano-Met. Chem.. 2005;35:391-399.
- [CrossRef] [Google Scholar]
- Synthesis, structural, chemical properties, and anti-bacterial screening of Sm(III) thiosemicarbazone complexes. Malaysian J. Anal. Sci.. 2017;21:560-570.
- [CrossRef] [Google Scholar]
- Palladium complexes of 2-formylpyridine thiosemicarbazone and two related ligands: synthesis, structure and spectral and catalytic properties. Inorg. Chim. Acta. 2015;425:67-75.
- [CrossRef] [Google Scholar]
- Mononuclear ruthenium(III) complexes containing chelating thiosemicarbazones: synthesis, characterization and catalytic property. Spectrochim. Acta A. 2010;75:713-718.
- [CrossRef] [Google Scholar]
- Synthesis, characterization of new copper complexes of thiosemicarbazone derivatives and their biological activities. Int. J. Res. Chem. Environ.. 2017;7:38-46.
- [Google Scholar]
- Spectrochemical study the effect of high energetic ionization radiation on Ru(III), Pd(II) and Hg(II) complexes. J. Rad. Res. App. Sci.. 2017;10:89-96.
- [CrossRef] [Google Scholar]
- Synthesis, spectral and structural studies of zinc(II) complexes of salicylaldehyde N4-phenylthiosemicarbazone. Spectrochim Acta A.. 2007;69:726-732.
- [CrossRef] [Google Scholar]
- Manganese(II) and zinc(II) complexes of 4-phenyl(2-methoxybenzoyl)-3- thiosemicarbazide: synthesis, spectral, structural characterization, thermal behavior and DFT study. Polyhedron. 2014;73:98-109.
- [CrossRef] [Google Scholar]
- Transition metal complexes of neocryptolepine analogues. Part I: synthesis, spectroscopic characterization, and in vitro anticancer activity of copper(II) complexes. Spectrochim. Acta A. 2015;138:942-953.
- [CrossRef] [Google Scholar]
- Theoretical and spectroscopic studies of 5-fluoro-isatin-3- (N-benzylthiosemicarbazone) and its zinc(II) complex. J. Mol. Struct.. 2009;917:63-70.
- [CrossRef] [Google Scholar]
- Plant extracts with metal ions as potential antimicrobial agents. Phytopathology. 1964;55:910-914.
- [Google Scholar]
- Syntheses, spectral, surface morphological and gamma ray irradiation studies of some oxomolybdenum(V) and dioxomolybdenum(VI) complexes of an azo dye derived from 4-aminoantipyrine. J. Korean Chem. Soc.. 2012;56:217-227.
- [CrossRef] [Google Scholar]
- Synthesis, spectroscopic characterization and thermal behavior of metal complexes formed with (Z)-2-oxo-2-(2-(2-oxoindolin-3-ylidene)hydrazinyl)-N-phenylacetamide (H₂OI) J. Mol. Struct.. 2012;1007:146-157.
- [CrossRef] [Google Scholar]
- Toxicity mechanisms and synergies of silver nanoparticles in 2,4-dichlorophenol degradation by Phanerochaete chrysosporium. J. Hazard. Mater.. 2017;321:37-46.
- [CrossRef] [Google Scholar]


