Translate this page into:
Synthesis, structural characterization, DNA/HSA binding, molecular docking and anticancer studies of some D-Luciferin complexes
⁎Corresponding author. maabdulaal@kau.edu.sa (Mostafa A. Hussien),
-
Received: ,
Accepted: ,
This article was originally published by Elsevier and was migrated to Scientific Scholar after the change of Publisher.
Abstract
Several species, such as bacteria, fungi, fish, and insects, produce light through biochemical processes. Firefly D-luciferin has been studied extensively since it possesses both a high quantum yield and a wide emission wavelength. Five transition metal complexes of D-luciferin (LN) with Mn(II), Co(II), Ni(II), Cu(II) and Zn(II) were synthesized using a 1:2 metal to ligand ratio. The structure of the synthesized complexes was confirmed utilizing spectroscopic techniques (FTIR, 1H NMR, EPR, and UV–Vis), elemental analysis, thermogravimetric analysis, molar conductivity, and magnetic susceptibility. Density functional theory (DFT/B3LYP) calculations were also used to confirm the structural characteristics and provide the fully optimized geometries of the ligand and its complexes. The results revealed that luciferin is bidentately coupled to the relevant metals in each of these complexes through two sulfur atoms of thiazole rings. Molar conductance values showed the non-electrolytic character of the synthesized complexes. Diverse techniques were employed to examine the complexes' binding affinity to calf thymus DNA, including UV–Vis, fluorescence, viscosity measurements and molecular docking. The results revealed that they bind non-covalently with DNA via groove binding. Furthermore, the interaction of these complexes with human serum albumin (HSA) was investigated via UV–Vis, fluorescence and molecular docking. The binding susceptibly of the complexes toward breast cancer (PDB: 3eqm) and liver cancer (PDB: 4mf9) proteins was assessed using molecular docking studies. Finally, human hepatocellular carcinoma cell line (HepG-2) and human breast cancer cell line (MCF-7) were used to investigate the cytotoxic activity of ligand and metal complexes. Among the five synthesized complexes, [Zn(LN)2Cl2]H2O complex has the best anticancer activity against MCF-7 and HepG-2 cell lines with IC50 values of 20 and 37.39 µM, respectively. The molecular docking studies and in vitro cytotoxicity assay showed a significant correlation.
Keywords
D-luciferin
DNA binding
HSA interaction
Molecular docking
DFT calculation
Breast cancer
1 Introduction
After heart disease, cancer is the second major cause of mortality globally, with more than half a million fatalities in the United States alone (Siegel et al., 2022). According to the World Health Organization (WHO), approximately 19.3 million new cancer cases and almost 10.0 million deaths from cancer are estimated worldwide in 2020. Furthermore, the world’s cancer burden is expected to increase by 47% in 2040, reaching 28.4 million cases (Sung et al., 2021). By 2030, there will be an estimated 42,000 cancer cases and approximately 21,200 cancer deaths in Saudi Arabia (Ferlay et al. 2021).
A breakthrough in the history of metal-based compounds occurred with the accidental discovery of cisplatin by Barnet Rosenberg in 1965, which used to treat various types of cancer, especially ovarian, testicular, bladder, and neck cancer (Monneret, 2011; Medici et al., 2015). Cisplatin was initially applied to cancer treatment in mice in 1968 (Sarcoma 180 and Leukemia L1210), and some of the studied mice survived for six months after therapy (B.Rosenberg, 1969). The clinical trials of cisplatin started in 1971, and it was approved by Food and Drug Administration (FDA) in 1978 under the name of Platinol®. Carboplatin (second generation) was developed in 1982, and approval by FDA was granted in 1989 as Paraplatin®. In 2002, the FDA authorized oxaliplatin (third generation) under the name of Eloxatin® (Kelland, 2007). Regardless of the therapeutic benefits of platinum compounds, they have serious side effects involving nausea, vomiting, poor blood cell and platelet formation in the bone marrow, and a reduced response to infection (Cotton et al., 1999). Furthermore, some of the most specific side effects include nephrotoxicity (kidney damage), neurotoxicity, and hearing loss (Florea and Büsselberg, 2011). As a result, an extensive series of new transition metal complexes have been developed with improved properties to overcome cisplatin’s unwanted disadvantages, including drug resistance, lack of selectivity, and systemic toxicity (Kelland, 2007; Medici et al., 2015). Thus, the primary objective of scientific research on anticancer drugs is to develop efficacious, less harmful, less resistant, and better pharmacological characteristics than cisplatin, the parent compound (Florea and Büsselberg, 2011). The general use of transition metals began when ancient Egyptians used copper containers to store drinking water and protected it against bacteria, fungi, yeast, and viruses (Medici et al., 2015;). In biochemistry, transition metal ions are necessary for their roles as therapeutics and diagnostic agents. Transition metal complexes have been employed as anticancer, anti-inflammatory, anti-infective, antidiabetic agents, neurological drugs, delivery probes, and diagnostic tools (Rafique et al., 2010).
One of the most important classes of heterocyclic compounds that have received a great deal of attention are thiazole and benzothiazole. They play a vital role in bioorganic and medicinal chemistry with applications in drug discovery due to their low toxicity, high bioavailability, and superior biocompatibility (Yadav et al., 2011; Sever et al., 2019; Chen et al., 2020). In the last two decades, thiazole and benzothiazole derivatives have gained considerable interest due to their potential as anticancer (Saeed et al., 2010; Kumbhare et al., 2012), anticonvulsant (Rana et al., 2008; Liu et al., 2016), mosquitocidal (Sever et al., 2019), antifungal (Ali and Siddiqui, 2013), anti-inflammatory (Venkatesh and Pandeya, 2009), antioxidant (Cressier et al., 2009), antimicrobial (Althagafi et al., 2019a), and antidiabetic agents (Mariappan et al., 2012). The combination of thiazole and benzothiazole constitute the structure of firefly D-luciferin. It’s name comes from the Latin Lucifer, which means “light-bringer” (Marques and Esteves Da Silva, 2009). In 1949, the first trial for luciferin isolation from fireflies was unsuccessful due to luciferin’s sensitivity to oxygen and light (Streiiler, 1949). In 1957, nine mg of crystalline firefly luciferin was isolated and purified from approximately 15,000 fireflies and the empirical formula of luciferin was assigned to be C13H12N2S2O3(Bitler, 1957). In 1963, the chemical structure of firefly luciferin was confirmed and identified as C11H8N2S2O3 and the IUPAC name was proved as (4S)-2-(6-hydroxy-1,3-benzothiazol-2-yl)-4,5-dihydrothiazole-4-carboxylic acid (White et al., 1963). The drug of this study, D-luciferin, is an antioxidant and substrate of bioluminescence reaction. Moreover, D-luciferin is an eco-friendly substrate leds to various applications including gene expression, immunoassays, ATP analysis, drug delivery, and cancer treatment (Kaskova et al., 2016).
To the best of our knowledge, no research has been studied the formed D-luciferin metal complexes and reported a full description with the biological applications. Thus, the present study focuses on the complexation of D-luciferin with five transition metals and the characterization of the synthesized complexes through various spectroscopic, thermal and analytical techniques. CT-DNA/HSA binding, molecular docking and cytotoxicity activity of D-luciferin and its synthesized metal complexes were performed as biological applications of the current research.
2 Experimental
2.1 Materials
D-luciferin (LN) was supplied from NANJING YANST BOI-TECH CO.LTD. Metal chloride salts (CuCl2·2H2O, MnCl2·4H2O, NiCl2·6H2O, ZnCl2, CoCl2), calf thymus DNA (CT-DNA) type 1A36 and human serum albumin (HSA) were purchased from Sigma-Aldrich (Hamburg, Germany). Doubly distilled water (pH 7.10) and DMSO were used as solvents. All chemicals and solvents were of analytical grade and used without further purification.
2.2 Instrumentation
The elements’ content of C%, H%, S% and N% was determined using CE-440 elemental analyzer. IR spectra of ligand and its synthesized metal complexes were recorded on Bruker Alpha in the range of 250–4000 cm−1. The melting point was measured using Stuart SMP10 automated melting point system. 1H NMR spectrum was examined by a Bruker ultrashield 600 MHz spectrometer using DMSO‑d6 as a solvent and TMS as an internal reference. Magnetic measurements were performed at room temperature using a Sherwood Scientific Magnetic Susceptibility Balance (MSB). EPR spectrum of Cu+2 complex in solid was recorded using the continuous wave Bruker EMX PLUS spectrometer (Bruker Biospin, Rheinstetten, Germany) and collected with Bruker Xenon Software. Conductivity measurements were measured by the OHAUS-STARTER 3100C conductivity meter at 25 ℃ using 1 × 10⁻³ M solutions in DMSO. Thermogravimetric analysis was performed using PerkinElmer TGA apparatus under a nitrogen atmosphere at a heating rate of 10 ℃/min for the temperature range 50–800 ℃. The UV–Vis absorption spectra of ligand and its complexes were recorded in DMSO using (1 × 10⁻⁴M) solution in the range of 200–800 nm on MutiSpec-1501 spectrophotometer fitted with a quartz cell 1.0 cm path length. The emission of compounds was measured using a HITACHI F-7000 fluorescence spectrophotometer.
2.3 Molar ratio method
The stoichiometry of the complexes was studied using the mole ratio method (Hussien and Salama, 2016; Basaleh et al., 2022a). The metal concentration was kept constant at (0.72 × 10⁻⁴M), while the ligand concentration was varied (0–2.52 × 10⁻⁴ M), as presented in Table S1. The absorbance of sample solutions was measured in DMSO in the range of 200–800 nm at room temperature. The relation between the maximum absorbance against [M]/[L] + [M] was plotted. The inflection of the obtained line shows the molar ratio of the complex.
2.4 Synthesis of D-luciferin metal complexes
All complexes with the general formula [M(LN)2Cl2]H2O, which M = Mn+2, Co+2, Ni+2, Cu+2 and Zn+2, were synthesized employing a 1:2 metal to ligand ratio(M:L). After conforming the ligand salt to the acidic form, pH of the mixture was adjusted to 8.00 by adding drops of NaOH (0.5 M)(deprotonated carboxylate). By adding the metal chloride salts (1 mmol) dissolved in distilled H2O to the ligand solution, the pH of the mixture was decreased, and the ligand returned to origin form. The resulted precipitate after refluxing for two hours was filtered and left in the air to evaporate. The metal complex was washed several times with ethanol, followed by diethyl ether, and allowed to dry overnight.
[Mn(LN)2Cl2]H2O: Yield: 80.30 %, M.wt: 704.47 g/mol, color: dark brown, M.p: >300 ℃, elemental analysis of (C22H18MnCl2N4O7S4) found%(calc%): C: 38.40 (38.49), H: 2.34 (2.35), N: 7.96 (8.16) and S: 18.55(18.68), IR(cm−1): 1488 (C = C), 1577 (C = N), 815 (C-S), 1555 (COO–)as, 1380 (COO–)s, 1244 (C-O) and 355 (M−S), Λm(10-3 M DMSO): 31.25 Ω−1 cm2 mole-1, µeff: 5.81B.M.
[Co(LN)2Cl2]H2O: Yield: 52.17 %, M.wt: 708.47 g/mol, color: dark brown, M.p: >300 ℃, elemental analysis of (C22H18CoCl2N4O7S4) found%(calc%): C: 38.14 (38.27), H: 2.38 (2.34), N: 8.04 (8.11) and S: 18.49 (18.57), IR(cm−1): 1481 (C = C), 1582 (C = N), 809 (C-S), 1551 (COO–)as, 1380 (COO–)s, 1243 (C-O) and 368 (M−S), Λm(10-3 M DMSO): 15.62 Ω−1 cm2 mole-1, µeff: 4.43B.M.
[Ni(LN)2Cl2]H2O: Yield: 68.57 %, M.wt: 708.23 g/mol, color: dark brown, M.p: >300 ℃, elemental analysis of (C22H18NiCl2N4O7S4) found%(calc%): C: 38.18 (38.28), H: 2.25 (2.34), N: 8.20 (8.12) and S: 18.40 (18.58), IR(cm−1): 1483 (C = C), 1582 (C = N), 816 (C-S), 1558 (COO–)as, 1380 (COO–)s, 1237 (C-O) and 348 (M−S), Λm(10-3M DMSO): 18.75 Ω-1cm2mole-1, µeff: 3.32B.M.
[Cu(LN)2Cl2]H2O: Yield: 69.57 %, M.wt: 713.08 g/mol, color: dark brown, M.p: >300 ℃, elemental analysis of (C22H18CuCl2N4O7S4) found %(calc%): C: 38.10 (38.02), H: 2.40 (2.32), N: 8.20 (8.06) and S: 18.35 (18.45), IR(cm−1): 1488 (C = C), 1582 (C = N), 816 (C-S), 1555 (COO–)as, 1382 (COO–)s, 1240 (C-O) and 363 (M−S), Λm(10-3M DMSO): 3.12 Ω-1cm2mole-1, µeff: 1.73B.M.
[Zn(LN)2Cl2]H2O: Yield: 51.39 %, M.wt: 714.95 g/mol, color: reddish brown, M.p: >300 ℃, elemental analysis of (C22H18ZnCl2N4O7S4) found%(calc%): C: 37.83 (37.92), H: 2.25 (2.31), N: 8.10 (8.04) and S: 18.31 (18.40), IR(cm−1): 1487 (C = C), 1583 (C = N), 811 (C-S), 1555 (COO–)as, 1382 (COO–)s, 1243 (C-O) and 367 (M−S), Λm(10-3M DMSO): 28.12 Ω-1cm2mole-1.
2.5 Theoretical calculations
The input files were built, and Gaussian 09 software was used to calculate the atomic and molecular properties of the free ligand and its metal complexes.
The free ligand and its synthesized metal complexes were optimized by GAUSSIAN 09 (Frisch et al., 2009) software package using hybrid DFT (B3LYP) (Becke, 1993) ) in the gas phase. The LanL2DZ (Hay and Wadt, 1985) and 6-311G(d,p) (McGrath and Radom, 1991) were used as mixed basis sets where the 6-311g(d,p) basis set was implemented for all atoms except for the metal atom and LanL2DZ basis set for the metal center . The vibrational frequencies were calculated to ensure that the optimized geometry corresponds to the minimum of the potential energy surface (absence of any imaginary frequency) and were scaled by a factor of 0.966 (Standards and Technology, 2018) . Gauss View (Dennington et al., 2016) software was used to visualize the output files and determine the HOMO-LUMO energies. The following equations were used to compute the reactivity descriptors: energy gap (ΔE), absolute electronegativities (χ), chemical potential (Pi), global hardness (ɳ), chemical softness (S), and electrophilicity (ω) (Alomari et al., 2022; Frisch et al., 1988; Hay and Wadt, 1985; Dennington et al., 2016, Sharfalddin et al., 2022):
2.6 Biological applications
2.6.1 CT-DNA binding studies
The interaction of CT-DNA with the ligand and its metal complexes has been performed using four techniques: electronic absorption spectroscopy (UV–Vis), fluorescence emission spectroscopy, viscosity measurements and molecular docking to study the mode and strength of binding. All DNA binding experiments were done in buffer containing Tris-HCl/EDTA (pH 7.4) at room temperature. The prepared stock of CT-DNA was stored at 4 °C and used within a week. The concentration of CT-DNA was calculated according to the absorption spectrum acquired at 260 nm and an extinction coefficient of 6600 M−1cm−1, while CT-DNA purity was determined by the ratio A260/A280, which was between 1.8 and 1.9 to ensure that DNA is adequately free of protein impurities (Sharfalddin et al., 2021b; Basaleh et al., 2022b).
2.6.1.1 Electronic absorption spectroscopy
Absorption titration experiments were carried out by keeping the concentration of compounds constant, while the concentration of CT-DNA was increased gradually. The resulting solutions were equilibrated for 30 min before recording their absorption using a Multispec-1501 spectrophotometer. The intrinsic binding constant Kb was calculated using Wolfe-Shimmer equation (Sharfalddin et al., 2021b):
Where [DNA] is the molar concentration of CT-DNA in base pairs, ԑa corresponds to the observed extinction coefficient Aobsd/[M], ԑb is the extinction coefficient of the compound when fully bound to CT-DNA, ԑf is the extinction coefficient of the free compound, and Kb is the intrinsic binding constant. The value of Kb was determined by the slope to intercept ratio in the plot of [DNA] /(ԑa-ԑf) versus [DNA].
2.6.1.2 Fluorescence emission spectroscopy
The fluorescence titration studies of ligand and complexes have been performed in the absence and presence of an increasing concentration of CT-DNA. With an excitation wavelength of 360 nm, the emission wavelength was recorded in the range of 380–700 nm. The excitation and emission slit widths were maintained at 2.5 nm, and the scan speed was 1200 nm/min. The changes in the fluorescence intensity and difference in the wavelength shift determined the binding affinity of these compounds with CT-DNA. The binding parameters were evaluated using Scatchard equation (Arshad et al., 2016):
Which Kb is the binding constant and n is the number of binding sites. They were determined from the intercept and slope of the plot of log(F0-F/F) versus log[Q], respectively. [Q] corresponds to the concentration of ligand or complex.
2.6.1.3 Viscosity measurements
In order to determine the mode of binding of molecules to CT-DNA, changes in the viscosity were measured by keeping the CT-DNA concentration constant and varying the concentration of ligand and complexes. A viscosity experiment was carried out using Calibrated Ostwald Viscometer (universal size 450) at 25 ℃. Flow time was recorded with a digital stopwatch for each sample three times, and an average flow time was calculated. The resulted data were plotted as (η/η0)1/3 versus [ligand/complex]/[DNA] ratio, where η and η0 are the relative viscosity of CT-DNA in the presence and absence of intitled compounds, respectively (Alamri et al., 2021).
2.6.2 HSA binding studies
The interaction of human serum albumin (HSA) with LN and its synthesized metal complexes was performed using three techniques: UV–Vis spectroscopy, fluorescence spectroscopy and molecular docking. The concentration of HSA was calculated according to the absorption spectrum acquired at 278 nm and an extinction coefficient of 35,219 M−1cm−1 (Sharfalddin et al., 2021a). All HSA binding experiments were done in buffer containing Tris-HCl/EDTA (pH 7.4) at room temperature.
2.6.2.1 Electronic absorption spectroscopy
During the absorption titration experiments, the concentration of HSA was maintained constant, while the concentration of LN and its complexes was increased gradually. The mixture was allowed to incubate for 30 min before recording its response absorption using a Multispec-1501 spectrophotometer. The intrinsic binding constant Kb was calculated using Benesi-Hildebrand equation (Sharfalddin et al., 2021b):
A0 and A correspond to the absorbance of HSA in the absence and presence of complexes, respectively. ԑHSA and ԑb are the extinction coefficients of HSA and HSA bound complex, respectively. Ccomplex is the concentration of [ligand/complex]. The binding constant Kb could be calculated from the ratio of the intercept to the slope by plotting 1/(A-A0) vs. 1/Ccomplex.
2.6.2.2 Fluorescence emission spectroscopy
The fluorescence quenching experiments of HSA have been recorded in the range of 300–700 nm. The excitation wavelength was set at 280 nm, and the emission of HSA was recorded in the absence and presence of an increasing concentration of the ligand and its complexes at a fixed HSA concentration. The mixture was allowed to incubate for five minutes before measuring its emission. The Stern-Volmer quenching constant (KSV) can be evaluated using the Stern-Volmer equation (Alanazi et al., 2021):
Where F0 and F are the fluorescence intensity in the absence and presence of quenchers (ligand/metal complexes), respectively. KSV is the Stern-Volmer quenching constant, [Q] is the concentration of the quencher (ligand/metal complexes). The value of KSV can be obtained from the slope of the plot of F0/F against [Q]. Kq is the bimolecular quenching rate constant of HSA (equal to Kq = KSV/τ0) and τ0 is the average lifetime of fluorophore (HSA) in the absence of quencher (τ0 = 10-8 s).
2.6.3 Molecular docking
The objective of the molecular docking studies was to fully understand the molecular interactions between the targets’ active site and the compounds under investigation. The docking studies were carried out using the Molecular Operating Environment (MOE) software on an Intel core i7, 3.8 GHz based machine running MS Windows 10 as the operating system. The Protein Data Bank (PDB) ( https://www.rcsb.org./) has been used to obtain the crystal structures of the targets: DNA (PDB: 1bna), HSA (PDB: 1h9z), breast cancer (PDB: 3eqm) and hepatocellular cancer (PDB: 4 fm9). Hydrogen atoms were introduced after removing all bound water molecules, cofactors, and the binding ligand from the proteins. The binding free energy and the formed hydrogen bonds between proteins and complexes were used to evaluate the binding affinity. The optimal binding pose was determined using RMSD (Root Mean Square Deviation) values (El-Boraey et al., 2022).
2.6.4 Cytotoxicity assay
The ligand and its synthesized complexes have been cytotoxically assessed against the human breast cancer cell line (MCF-7) and human hepatocellular liver carcinoma cell line (HepG-2). They were grown in Dulbecco’s Modified Eagle’s Medium (DMEM), which included 10% heat-inactivated fetal bovine serum, 1% L-glutamine, HEPES buffer, and 50 g/ml gentamycin. All cells were kept at 37 ℃ in a humidified atmosphere with 5% CO2, sub-cultured twice a week. The cytotoxicity of the ligand and metal complexes was assessed using the mean viability assay (Alamri et al., 2021). In this assay, cisplatin was used as a standard chemotherapeutic drug to compare with the investigated compounds. The examination was performed at the Regional Center for Mycology and Biotechnology (RCMB) at Al-Azhar University, Cairo, Egypt.
3 Result and discussion
The reaction of D-luciferin with five transition metals resulted in the complexes of the general formula [M(LN)2(Cl)2]H2O where M = Mn+2, Co+2, Ni+2, Cu+2 and Zn+2, as illustrated in (scheme 1). The synthesized metal complexes are colored and stable in air at room temperature. They are insoluble in water and other organic solvents, but they dissolve in DMSO. The physical properties, analytical data, magnetic susceptibility and molar conductance of the ligand and its metal complexes are summarized in (Table 1).
The synthesis of metal complexes, the pH adjusted at 8 for the ligand solution and shifted to low value after metal solution.
Sample code
Color
M.wt
(g/mol)Yield
(%)M.p
(℃)Elemental analysisFound
(calculated)Λm
(Ω−1 cm2 mol−1)µeff (B.M.)
Chemical formula
C%
H%
N%
S%
LN
Pale
yellow279.32
–
>300
41.99
(41.49)2.20
(2.22)7.99
(8.80)20.01
(20.14)4.68
–
C11H7N2O3S2
MnLN
Dark
brown704.47
80.30
>300
38.40
(38.49)2.34
(2.35)7.96
(8.16)18.55
(18.68)31.25
5.81
[Mn(LN)2Cl2]H2O
CoLN
Dark
brown708.47
52.17
>300
38.14
(38.27)2.38
(2.34)8.04
(8.11)18.49
(18.57)15.62
4.43
[Co(LN)2Cl2]H2O
NiLN
Dark
brown708.23
68.57
>300
38.18
(38.28)2.25
(2.34)8.20
(8.12)18.40
(18.58)18.75
3.32
[Ni(LN)2Cl2]H2O
CuLN
Dark
brown713.08
69.57
>300
38.10
(38.02)2.40
(2.32)8.20
(8.06)18.35
(18.45)3.12
1.73
[Cu(LN)2Cl2]H2O
ZnLN
Reddish
brown714.95
51.39
>300
37.83
(37.92)2.25
(2.31)8.10
(8.04)18.31
(18.40)28.12
–
[Zn(LN)2Cl2]H2O
3.1 . Molar ratio method
The molar ratio method was employed to examine the complexes’ stoichiometry (Tirmizi et al., 2012). The absorbance values of each addition of metal ion to LN ligand were plotted against the ratio [M]/([L] + [M]) and presented in (Fig. 1) while the rest of complexes are shown in (Fig. S1). According to the results, a ratio of 1:2 metal to ligand was observed in all complexes at an infliction point of 0.33.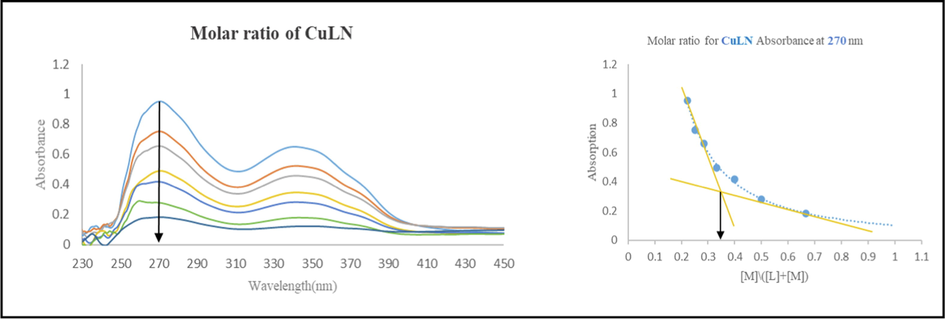
The molar ratio spectrum of CuLN.
3.2 . Molar conductance and magnetic susceptibility
The molar conductivity of the ligand and its metal complexes was investigated in DMSO at (1 × 10⁻³M), and it was in the range (3–31) Ω-1cm2mol−1. The low conductance values of compounds confirm their non-electrolytic nature (Ali et al., 2013). The magnetic measurements of complexes were done at room temperature. The magnetic moment of [Mn(LN)2Cl2]H2O is 5.81B.M, which undoubtedly suggests high spin octahedral geometry with five unpaired electrons. The [Co(LN)2Cl2]H2O complex has a magnetic moment of 4.43B.M, corresponds to three unpaired electrons which indicates that this complex has high spin octahedral geometry. The magnetic moment value of 3.32B.M for [Ni(LN)2Cl2]H2O, due to the presence of two unpaired electrons, possesses an octahedral geometry. Similarly, the octahedral geometry of [Cu(LN)2Cl2]H2O complex was suggested by its magnetic moment 1.73B.M, which is equal to the spin only value anticipated for one unpaired electron(Chandra and Kumar, 2005; Alamri et al., 2021).
3.3 Fourier transform infrared spectroscopy (FTIR)
The IR spectra of the complexes were compared with the free ligand to identify the coordination sites that may be involved in complexation. A peak’s location or intensity is expected to change after complexation. The IR spectra of the ligand and its synthesized complexes were recorded in the range of 250–4000 cm−1 and presented in (Fig. 2) and (Table 2). All complexes showed almost no change in the (C = N) vibration band at 1580 cm−1 in the ligand’s spectrum, indicating that the nitrogen atom was not involved in coordination (Althagafi et al., 2019b). The distinctive band of carbonyl (C = O) was replaced by antisymmetric (COO–)as and symmetric (COO–)s vibrational bands, which were observed at 1558 and 1380 cm−1, respectively in the spectrum of ligand, remained almost unchanged for all complexes, confirming the non-involvement of carboxylate ion in coordination (Ferraro, 1961). The thiazole sulfur appears around 748 cm−1 in the spectrum of ligand which has been shifted to higher wavenumbers in the range between 809 and 816 cm−1 in the complexes. The shift is due to the coordination of sulfur atoms of thiazole rings to metal ions(Sathyanarayanmoorthi et al., 2013). The presence of a broad band in the region of 3200–3600 cm−1, proved the existence of lattice water molecule in all complexes. The formation of complexes was further confirmed by the appearance of new bands in the regions of 348–368 cm−1 in the spectra of complexes which associated with the stretching frequency of (M−S) (Chandra and Kumar, 2005; Tyagi et al., 2017).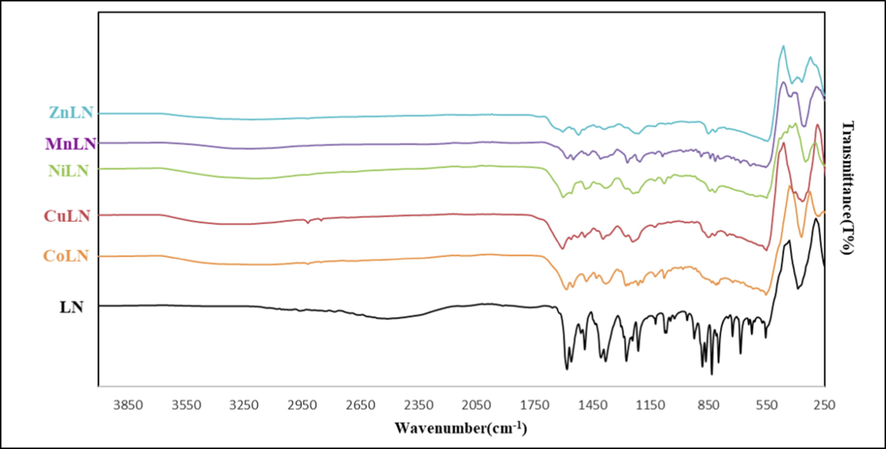
A comparison of the IR spectra of ligand and its synthesized metal complexes.
Peak
LN
MnLN
CoLN
NiLN
CuLN
ZnLN
C⚌C
Exp
DFT1488
14871488
14311481
15371483
15371488
15371487
1536
C⚌N
Exp
DFT1580
15791577
15801582
15801582
15801582
15791583
1598
C—S
Exp
DFT748
782815
862809
866816
865816
866811
863
(COO–)as
Exp
DFT1558
17761553
17571551
17571558
17511555
17521555
1744
(COO–)s
Exp
DFT1380
13161380
13411380
13431380
13441382
13461382
1346
C—O
Exp
DFT1241
12441244
12431243
12481237
12481240
12611243
1256
M−S
Exp
DFT–
-355
339368
333348
368363
388367
349
3.4 Nuclear magnetic resonance spectroscopy (1H NMR)
The 1H NMR spectral data of the ligand and its diamagnetic Zn(II) complex were performed in DMSO‑d6 with respect to TMS as an internal reference to confirm the binding mode of ZnLN complex. In the spectrum of LN, the multiplet signals between 8 and 6.5 ppm were due to aromatic protons in the benzene ring (Alanazi et al., 2021). The signals at 3.5 and 4.4 are assigned to CH1 and CH2, respectively. The observed signal of the phenolic proton appears upfield than the predicted value which supposed to be at 9 ppm. There is inconsistence with the experimental value that appears at 3.5 ppm. This variation between the calculated and observed peaks implies interactions between LN and the solvent molecules. An intermolecular hydrogen-bonding is formed between hydrogen in OH and oxygen in DMSO‑d6 that is responsible for the upfield chemical shift (Odai et al., 2009). Similar chemical shift patterns can be found in the spectrum of ZnLN as in LN’s spectrum. The chemical shifts of aromatic and thiazolyl proton-based signals are almost unaffected. However, the signal of CH2 is slightly shift downfield to 4.97 due to the complexation through sulfur atoms. The broadness of the signals in the complex can be attributed to the presence of the positive charge on metal ion (Alanazi et al., 2021). The strong peak in the spectra of ligand and its Zn(II) complex at 2.5 is caused by solvent residues of DMSO (Gottlieb et al., 1997). A comparison between the 1H NMR spectra of LN and ZnLN complex is illustrated in (Fig. 3) and (Table 3).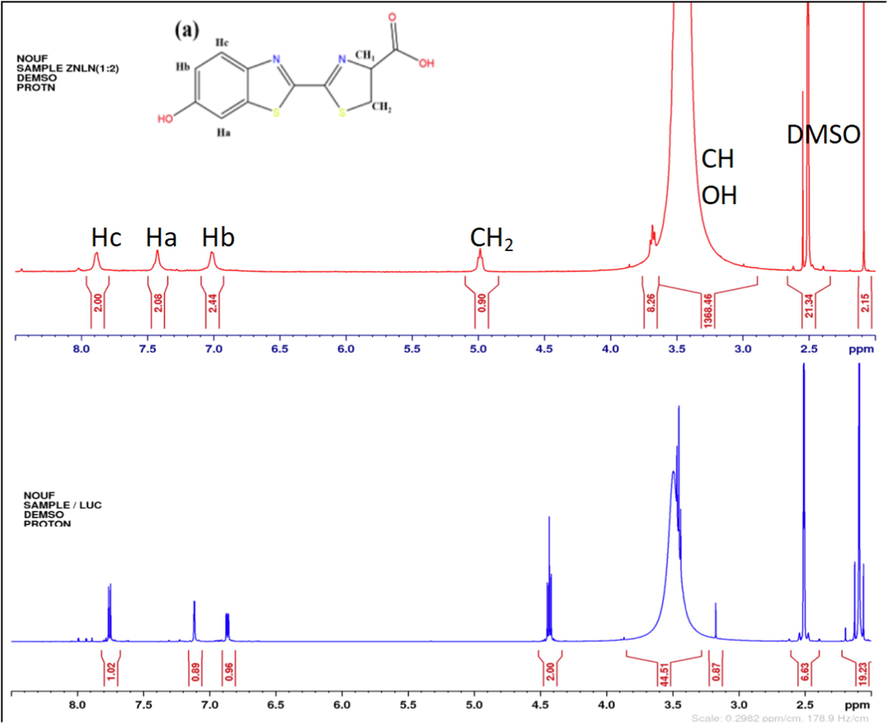
The 1H NMR spectral changes of ZnLN complex (a) and the free ligand (b).
Sample code
Aromatic protons
CH1
CH2
OH
DMSO
Hb
Ha
Hc
LN
6.8
7.2
7.7
3.5
4.4
3.5
2.5
ZnLN
7.00
7.4
7.8
3.45
4.97
3.45
2.5
3.5 Electron paramagnetic resonance spectroscopy (EPR)
The EPR spectrum of the solid [Cu(LN)2Cl2]H2O complex was recorded at room temperature in (Fig. 4). The complex possesses an axial symmetry with the following order gz > gx = gy in which g|| is equivalent to (gz) and g⊥ is equivalent to (gx = gy). In the axial symmetry, the g||(2.0080) > g⊥(2.0047) > ge(2.0023), this arrangement is common for an elongated octahedron which indicates that the unpaired electron is localized in the dx2-y2 orbital of Cu(II) as the ground state(Alamri et al., 2021). The g average (gave) value was computed using the following equation gave= (g||+2g⊥)/3 and it equals to 2.0058 which is lower than 2.3, implying that the Cu(II) metal ion is surrounded by a covalent environment (Ibrahim et al., 2015; Sharfalddin et al., 2021b). Moreover, the equation G = (g||-ge)/(g⊥-ge) has been used to calculate the value of the exchange interaction between the copper (II) centers in the polycrystalline solid. If G > 4, it implies a minimal exchange interaction, while G < 4 it denotes a significant exchange interaction. The calculated G was found to be 2.375 which revealed a considerable exchange interaction between Cu(II) centers (Ibrahim et al., 2015).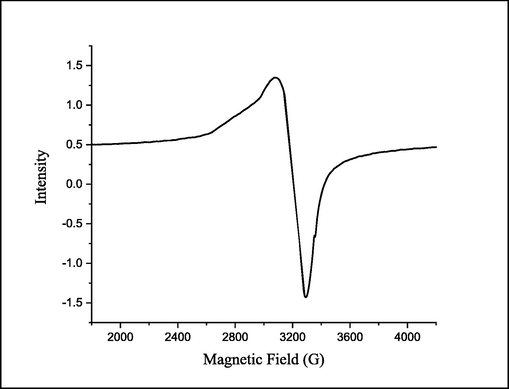
EPR spectrum of CuLN complex.
3.6 Thermal gravimetric analysis (TGA)
Thermogravimetric analysis of the synthesized metal complexes was performed under nitrogen atmosphere within a temperature range of 50–800 ℃ and presented in (Fig. 5) and (Table 4). The analysis was carried out to verify the molecular structure of the synthesized metal complexes and examine their thermal stability. As shown in (Fig. 5), the TG curves of the metal complexes are almost identical to each other and undergo the same thermal degradation processes. All complexes decomposed in two steps except CuLN which decomposed in three steps. A residue of metal oxides and carbon atoms left at a high temperature after the final step. A good correlation was found between the results of thermal analysis, IR and the suggested formula from the elemental analysis of metal complexes.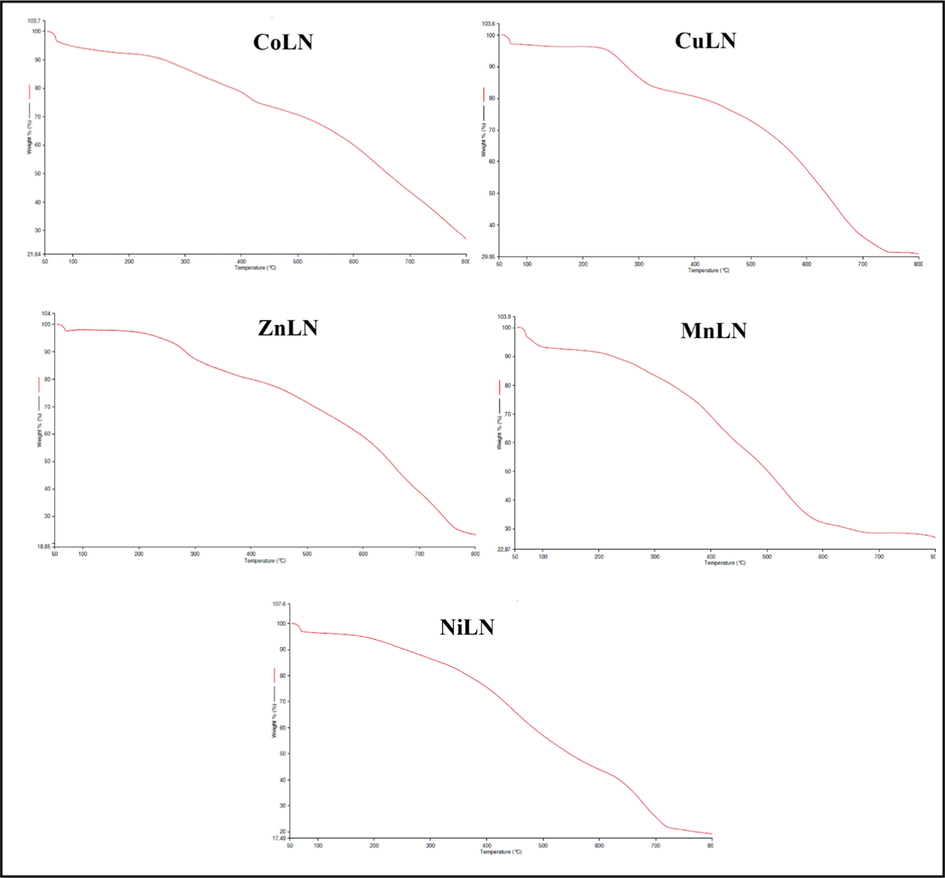
TGA curves of synthesized metal complexes.
Complex
Step
Temp.
range ℃Weight loss %found
(calc.)Assignments
Residue %found
(calc.)
MnLN
1st
2nd52–75
75–7802.5 (2.56)70.5
(70.6)H2O
5C2H2 + 4H2S + 4NO + CO + Cl2
MnO + 10C27
(27.11)
CoLN
1st
2nd57–75
75–8002.5 (2.54)70
(70.2)H2O
5C2H2 + 4H2S + 4NO + CO + Cl2
CoO + 10C27.5
(27.52)
NiLN
1st
2nd53–78
78–7852.5 (2.54)77.5
(77.78)H2O
7C2H2 + 4H2S + 4NO + CO + Cl2
NiO + 6C20
(20.7)
CuLN
1st
2nd
3rd50–80
80–310
310–7502.5 (2.52)12
(12.94)55.5
(56.33)H2O
C2H2 + H2S + NO
3C2H2 + 3H2S + 3NO + Cl2
CuO + 12C30
(31.35)
ZnLN
1st
2nd50–85
85–7902.5 (2.52)73.5
(73.3)H2O
6C2H2 + 4H2S + 4NO + CO + Cl2
ZnO + 8C24
(24.8)
The thermogravimetric curve of [Mn(LN)2Cl2]H2O complex exhibits two decomposition steps. MnLN started to degrade thermally at a temperature between 52 and 75 ℃ due to the dehydration of one water molecule with a weight loss of 2.5% (calc. 2.56%). When the loss of a water molecule occurs at this temperature range, the water molecule is of lattice type (Aziz et al., 2020). This is followed by decomposition of organic moiety including 5C2H2 + 4H2S + 4NO + CO + Cl2 in the temperature range 75–780 ℃ representing a weight loss of 70.5% (calc. 70.6%). The final products contain MnO and ten carbon atoms as residues with a mass loss of 27% (calc. 27.11%). The thermogravimetric curve of [Co(LN)2Cl2]H2O demonstrated that the decomposition occurred in two step. The dehydration of one water molecule in the first stage at 57–75 ℃ accounted for a mass loss of 2.5% (calc. 2.56%). The second step accompanied with a mass loss of 70% (calc. 70.2%) in the range between 75 and 800 ℃ which attributed to the decomposition of 5C2H2 + 4H2S + 4NO + CO + Cl2. The final products involved CoO and ten carbon atoms as residues with a weight loss of 27.50% (27.52%). The thermogravimetric curve of [Ni(LN)2Cl2]H2O displayed two degradation steps. The first step occurred in the range of 53–125 ℃, which corresponds to the dehydration of one water molecule with a mass loss of 2.5% (calc. 2.54%). The second step took place between 125 and 785 ℃ representing a weight loss of 77.5% (calc. 77.78%), which attributed to the decomposition of the organic moiety 7C2H2 + 4H2S + 4NO + CO + Cl2. The residues that remained after the final step include six carbon atoms and NiO as metal oxide accounted for mass loss of 20% (calc. 20.7%). The thermogravimetric curve of [Cu(LN)2Cl2]H2O complex has three degradation stages. The initial step corresponded to the dehydration of one water molecule between 50 and 80 ℃ with a mass loss of 2.5% (calc. 2.52%). This was followed by a decomposition of C2H2 + H2S + NO in the second step that occurred within the temperature range of 80–310 ℃ accompanied for a mass loss of 12% (calc. 12.94%). The final step accounted for the loss of 3C2H2 + 3H2S + 3NO + Cl2 with a mass loss of 55.5% (calc. 56.33%) at 310–750 ℃. The residue consists of 12 carbon atoms and CuO as metal oxide, the weight loss was 30% (calc. 31.35%). The thermogravimetric curve of [Zn(LN)2Cl2]H2O complex undergo two degradation steps starting with the dehydration of one water molecule in the range of 50–100 ℃ with a mass loss of 2.5% (calc. 2.52%). The second weight loss of 73.5% (calc. 73.5%) occurred between 100 and 790 ℃ accounted for the decomposition of the organic moiety 6C2H2 + 4H2S + 4NO + CO + Cl2, leaving ZnO and eight carbon atoms as final products with a mass loss of 24% (calc. 24.8%).
3.7 Kinetic studies of thermal analysis
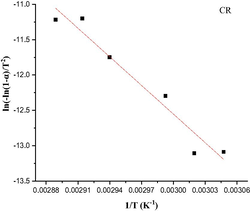
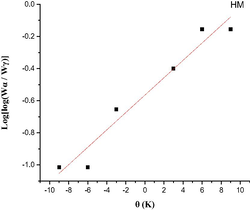
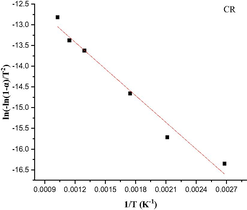
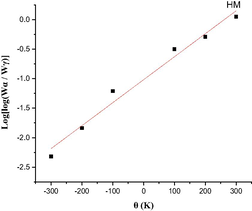
The Coats-Redfern integral (CR) (Coats and Redfern, 1963) and the approximation of the Horowitz-Metzger equation (HM) (Horowitz and Metzger, 1963) were applied to calculate the thermodynamic parameters, including the activation energy of decomposition Ea (kJ mol−1), enthalpy ΔH (kJ mol−1), entropy ΔS (J mol-1K−1), Gibbs free energy ΔG (kJ mol−1) and Arrhenius factor A (S-1), as represented in (Table S2). According to the results, the high Ea values of all complexes implied that they are extremely thermally stable. The complexes were endothermic and endergonic, as shown by the positive values of ΔH (ΔH > 0) and ΔG (ΔG > 0), respectively. For all complexes, ΔS was negative, suggesting a slow rate of spontaneous decomposition. The correlation coefficients obtained from CR and HM plots for the thermal decomposition, which were determined to be within the range of (0.90–0.98), showed a reasonable fitting with the linear function (Alamri et al., 2021). The plots of Coats-Redfern and Horowitz-Metzger are shown in (Table 5) and (Table S3).
Complex
Step
Coats-Redfern (CR)
Horowitz-Metzger (HM)
NiLN
1st
2nd
3.8 Theoretical investigation
3.8.1 Geometry optimization
The optimized geometry for the two D-luciferin isomers namely, cis and trans, were studied using B3LYP/6-311G** for the free ligand. The optimized structures of the ligand are presented in Fig. 6. The trans isomer is more stable than the cis isomer by 6.51 kcal/mol. The small energy difference between the two isomers revealed the possibility of cis–trans isomerization specially during the complex formation. The transition state for the isomerization is slightly higher than the cis isomer by a 2.1 kcal/mol.
Optimized structures of trans and cis isomers of D-luciferin.
The average Natural Bond Orbital (NBO) charges on heteroatoms of the trans isomer are −0.64, −0.45, 0.32 for oxygen, nitrogen and sulfur respectively. On the other hand, the most negative carbon atom on the ligand is located on the CH2 group next to the sulfur atom with NBO charge of −0.50. Even though the negativity charge of oxygen and nitrogen atoms were higher than of sulfur, the collected data from IR, NMR, EPR and TGA of the metal complexes suggested that LN binds to the metal ions as a bidentate ligand via two sulfur atoms (Sudhaharan and Reddy, 2000).
Optimized geometries and numbering systems of ligand and its metal complexes are shown in (Fig. 7) while the other metal complexes structures are shown (Fig.S3). The selected optimized geometrical parameters, such as bond lengths and bond angles are illustrated in (Table 6).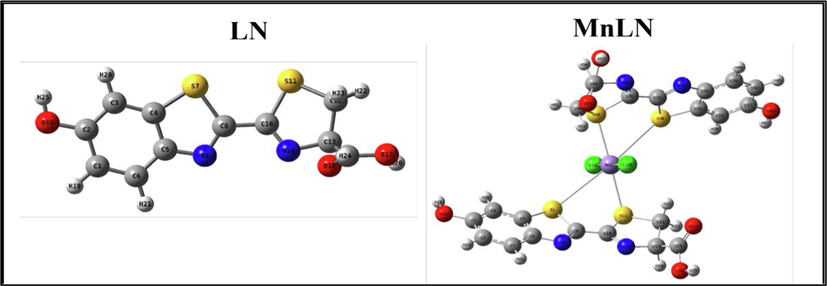
The optimized geometry with numbering system for the free ligand and Mn(II) complex.
Compound
LN
MnLN
CoLN
NiLN
CuLN
ZnLN
Bond length (Å)
C12-S11
1.83
1.89
1.90
1.90
1.89
1.89
C10-S11
1.81
1.91
1.89
1.90
1.88
1.89
C4-S7
1.74
1.80
1.81
1.81
1.81
1.80
C8-S7
1.79
1.86
1.88
1.88
1.88
1.86
C10-C8
1.47
1.46
1.47
1.47
1.46
1.46
M−S7
–
2.43
2.86
2.79
2.79
2.39
M−S11
–
2.57
2.77
2.64
2.56
2.59
M−S17
–
2.52
2.88
2.79
2.53
2.99
M−S24
–
2.52
2.76
2.65
2.29
2.53
Bond angle (°)
C10-S11-C12
88
87.87
86.41
86.63
88.53
88.47
C8-S7-C4
88.27
86.68
86.12
86.32
88.23
86.13
S7-C8-C10
120.28
119.88
116.14
116.71
120.90
119.45
S11-C10-C8
118.73
118.64
116.40
115.24
119.33
118.08
S7-M−S11
–
64.53
84.11
87.79
70.84
76.69
S17-M−S24
–
63.47
85.76
87.93
43.30
75.85
S7-M−S17
–
114.80
94.66
92.42
151.15
96.61
S24-M−S11
–
116.20
94.32
92.83
117.43
119.42
Cl-M−Cl
–
179.30
179.25
179.32
176.04
170.29
The alteration in the free ligand after complexing with the metal ion is a practical sign for the coordination reaction. The bond length in the free ligand has maintained after complexing with metal ions except for the length of C10-S11which showed elongation with 1–4 Å. The M−S bond's lengths were between 2.0 and 2.50 Å which presented a covalent bond character (Sharfalddin et al., 2021b). Among the selected angles around the coordination sites, S11-C10-C8 bond angle showed negligible change in the metal complexes except MnLN compound which was shorter by 5°. The new angles around the respective central metal ion suggested a distorted octahedral geometry for the synthesized complexes.
3.8.2 Global reactivity descriptors
The chemical reactivity of compounds was estimated by calculating quantum chemical parameters with the density functional theory (DFT) approach. These parameters describe the stability, reactivity and suggest the most bioactive compound. Therefore, the lowest unoccupied molecular orbital (LUMO) and the highest occupied molecular orbital (HOMO) were extracted from the chk files and presented in (Fig. 8 and Fig.S4) with the difference between their energies (ΔE). For the ligand, the HOMO and LUMO orbitals are distributed around the whole molecule with energy gap of 4.20 eV. The interaction of the metal ions with the ligand has lowered the energy gap and showed the ability of these compounds to electron transition, good reactivity and stability (Alomari et al., 2022).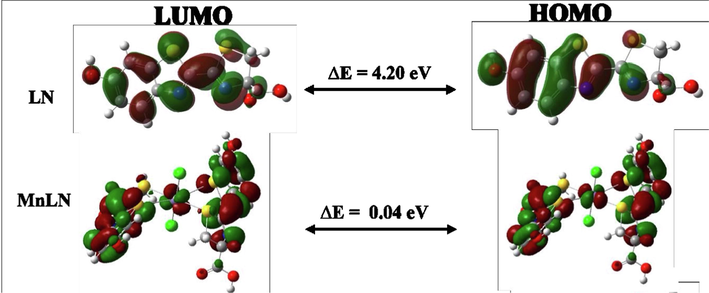
HOMO and LUMO charge density maps and the energy gap of the ligand and Mn(II) complex.
The synthesized complexes were organized based on their reactivities as following LN > CoLN > CuLN > MnLN > NiLN > ZnLN. Small ΔE values indicate low stability and high chemical reactivity of the compound. Therefore, ZnLN has the smallest energy gap which means it is the most bioactive compound and has the highest reactivity compared with other synthesized complexes. The HOMO orbitals are located in one LN molecule in most of the metal complexes while the LUMO orbitals are centered around the metal center in CuLN, CoLN and NiLN complexes. In the case of MnLN and ZnLN, these orbitals were distributed over one of the ligand molecules. This observation allowed the compound to react as electrophile or nucleophile in the biological environment (Alshehri et al., 2022).
The softness of the molecules is an expression of easily reacting of the compound with other molecules while hardness describes the property of being rigid and resistant to react with other molecules. The quantum chemical descriptors were calculated and listed in (Table 7). Among the metal complexes, ZnLN and CuLN complexes have the highest values of absolute hardness (ɳ) and absolute softness (σ), respectively. The positive value of electrophilicity indicator (χ) and the negative value of the electronic chemical potential (Pi) revealed the capability of the new compounds to act as double sword to interact with cations and anions. The maximum charge that an electrophile may accept from the environment is presented as ΔNmax. The high value of ΔNmax for ZnLN complex showed its high ability to accept electrons from the surrounding biological media and attract shared electrons when forming a chemical bond(Basaleh et al., 2022b).
Sample code
HUMO
LUMO
Δ E
χ
ɳ
σ
Pi
S
ω
ΔNmax
LN
−6.28
−2.08
4.20
4.18
2.10
0.48
−4.18
1.05
4.16
1.99
MnLN
−5.17
−5.13
0.04
5.15
0.02
50.00
−5.15
0.01
2.58
257.50
CoLN
−4.99
−4.48
0.51
4.74
0.26
3.92
−4.74
0.13
2.37
18.57
NiLN
−4.34
−4.31
0.03
4.33
0.02
66.67
−4.33
0.01
2.16
288.33
CuLN
−3.70
−3.63
0.07
3.67
0.04
28.57
−3.67
0.02
1.83
104.71
ZnLN
−4.89
−4.87
0.02
4.88
0.01
100.00
−4.88
0.00
2.44
488.00
4 Biological applications
Designing and developing new and more effective drugs is based on the fact that many compounds exhibit their pharmacological effects by interacting with DNA or proteins. Therefore, research into the interactions of these compounds with DNA and HSA has much interest. The binding of CT-DNA and HSA with LN and its synthesized metal complexes were performed via different techniques to examine the binding mode and strength. Due to the poor solubility of the metal complexes, a fixed concentration of 4 µM was prepared in minimum amount of DMSO to maintain the compounds solubility during the experiment in buffer and used in spectroscopic investigations with varying CT-DNA concentrations. Moreover, molecular docking and cytotoxicity assay were studied against human breast cancer and human hepatocellular carcinoma.
4.1 Ct-DNA binding studies
In these studies, calf thymus DNA (CT-DNA) is used due to its affordability, ease of availability, and structural resemblance to human DNA (Wani et al., 2020). Four different techniques were employed to study CT-DNA interaction with the ligand and its metal complexes: ultraviolet–visible spectroscopy (UV–Vis), fluorescence emission spectroscopy, viscosity measurements and molecular docking.
4.1.1 UV–Vis absorption spectroscopy
DNA exhibits a distinctive band at 260 nm corresponds to π-π* intraligand transitions of the chromophoric groups in purine (adenine and guanine) and pyrimidine (cytosine and thymine) moieties (Sirajuddin et al., 2013; Veeralakshmi et al., 2017). The absorbance spectra of ligand and complexes were recorded in the absence and presence of increasing amounts of CT-DNA. As shown in (Fig. 9), all the compounds showed an increase in the absorbance with the continuous rise of CT-DNA concentration. A significant hyperchromic effect with no shift in the maximum absorbance implies the presence of groove binding between LN and its metal complexes with CT-DNA (Arjmand et al., 2013). The binding constants (Kb) were calculated from Wolfe-Shimmer equation and presented in (Table 8). The values of binding constants of the ligand and its metal complexes are lower compared to the famous intercalator ethidium bromide (EB) that equals to 1 × 10⁷ M−1 (Kosiha et al., 2018). According to the results, the complexes’ strong binding affinity toward CT-DNA is shown by the high Kb constants; LN has the highest Kb value compared to the metal complexes.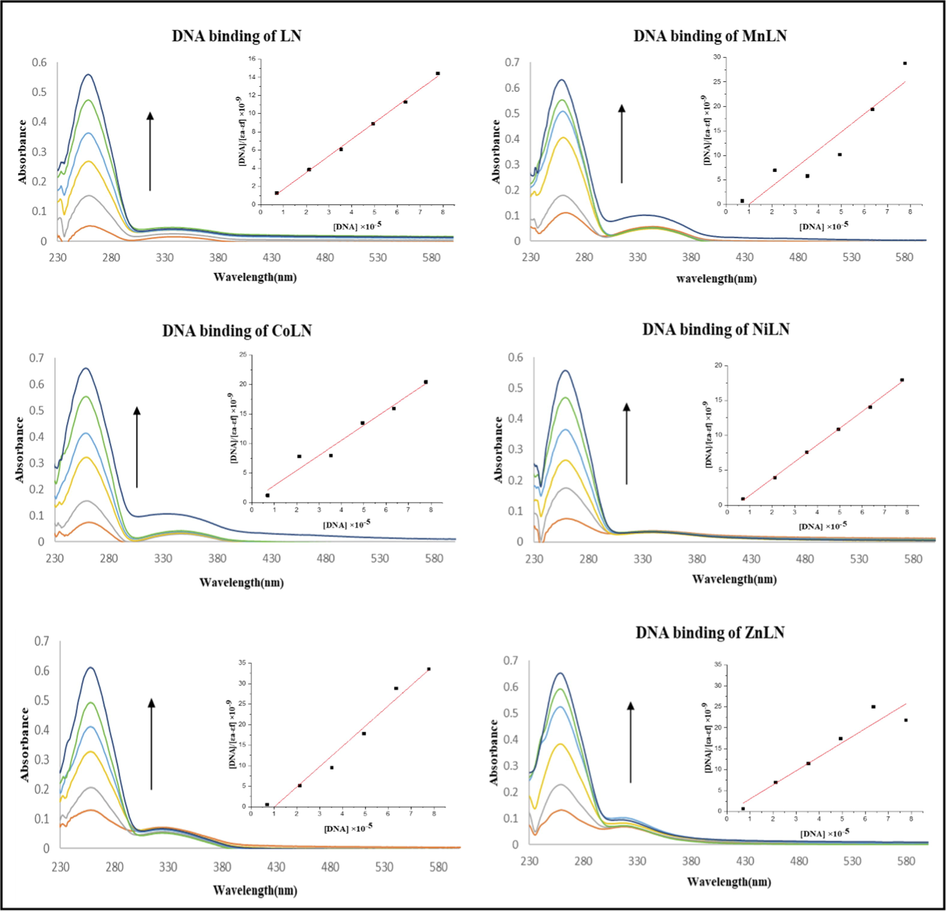
The absorption spectra of LN and its metal complexes in the absence and presence of increasing concentration of CT-DNA.
Sample code
Kb (M−1)
LN
2.00 × 10⁶
MnLN
1.00 × 10⁵
CoLN
1.00 × 10⁶
NiLN
2.00 × 10⁵
CuLN
1.00 × 10⁵
ZnLN
1.00 × 10⁶
4.1.2 Fluorescence emission spectroscopy
Emission experiments were performed to further study the interaction between the complexes and CT-DNA. LN and its synthesized metal complexes exhibited a high blue emission in DMSO, as shown in (Fig. S2)Fig. S4. With an excitation wavelength of 360 nm, the emission spectra of the compounds were recorded in the range 400–700 nm after incubation for 5 min at room temperature. The investigated compounds showed a broad band with a maximum at 530 nm due to the strong charge transfer from benzothiazole ring to thiazoline ring (Hiyama et al., 2012; Vieira et al., 2012). As shown in (Fig. 10), the intensity of the fluorescence emission enhanced after adding amounts of CT-DNA to a fixed amount of complexes, showing a strong interaction between complexes and DNA (Arjmand et al., 2013). The change in the environment surrounding the metal center and the degree of complex insertion into the hydrophobic environment inside the DNA helix are the causes of the rise in emission intensity. The hydrophobic environment inside the DNA helix makes it harder for solvent molecules to reach the binding site, preventing the quenching effect. It is apparent that the DNA helix effectively shielded complexes, which resulted in a decrease in vibrational modes of relaxation and an increase in emission intensity. The rise in emission intensities showed that the complexes bind to DNA into its hydrophobic pocket along the major and minor grooves (Tabassum et al., 2012). The binding constants Kb were calculated from Scatchard equation by plotting the log [(I0-I)/I] against log [DNA] as presented in Fig. 11 and the value are listed in (Table 9).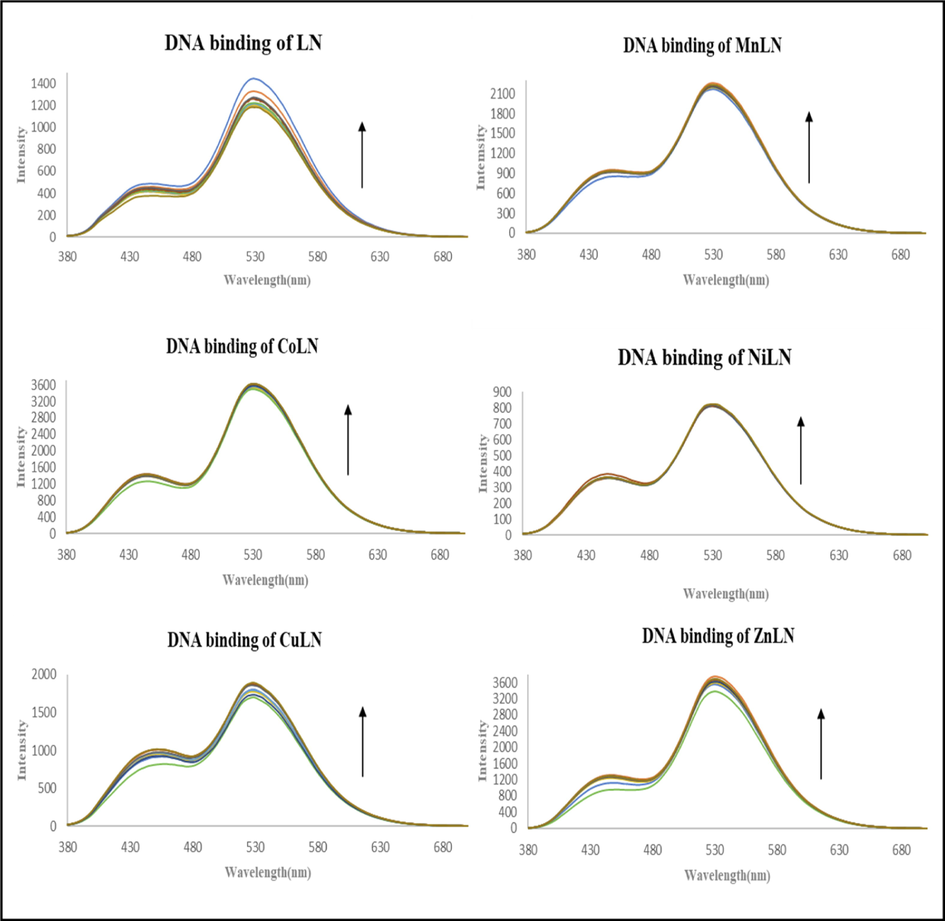
The fluorescence spectra of ligand and metal complexes in the absence and presence of increasing concentrations of CT-DNA.
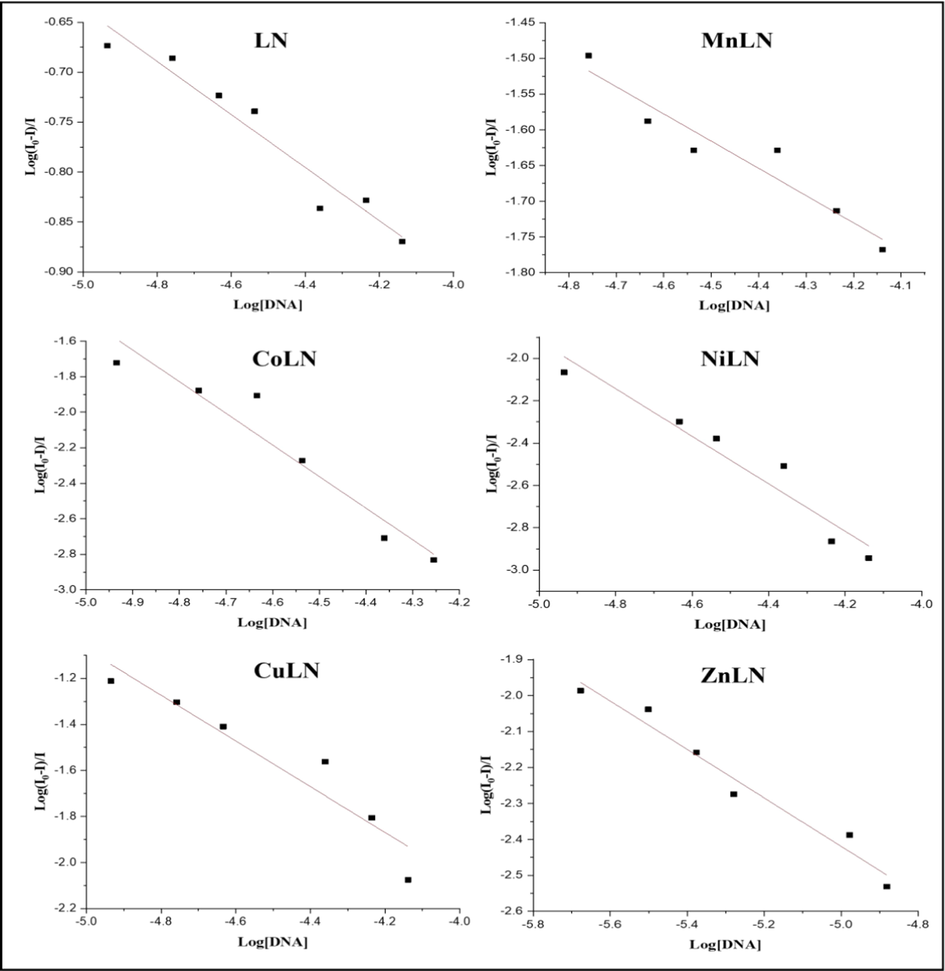
The binding constants Kb of LN and its metal complexes using Scatchard equation.
Sample code
Kb (M−1)
LN
5.06 × 10⁵
MnLN
3.33 × 10⁵
CoLN
4.54 × 10⁵
NiLN
2.53 × 10⁵
CuLN
3.04 × 10⁵
ZnLN
3.88 × 10⁵
4.1.3 Viscosity measurements
Viscosity measurements of DNA solution in combination with other compounds may provide further insight into how these compounds interact with CT-DNA. It is believed that intercalative binding mode considerably increases the viscosity of DNA solution because intercalative interaction requires the space between neighboring base pairs to be large enough to hold small molecules and lengthen the double helix. Additionally, groove binding and electrostatic interaction have a minimal or no effect on the viscosity of DNA (Shi et al., 2015). The viscosity measurements were carried out by keeping CT-DNA concentration constant and increasing the concentration of studied compounds. The (Fig. 11) (Fig 12) depicts the changes in viscosity of CT-DNA in the absence and presence of compounds. The results revealed that the main binding method of compounds with CT-DNA is groove binding since the viscosity of CT-DNA solutions almost did not change with the increasing concentration of compounds (Almarhoon et al., 2019).
4.2 HSA binding studies
Human serum albumin (HSA) was chosen due to its potential utility as a transporter for the delivery of specific anticancer drugs and its high concentration in human serum, accounting for 55% of the protein in blood plasma (Babgi et al., 2021). The binding of HSA with the LN and its synthesized metal complexes was studied by UV–Vis absorption spectroscopy, fluorescence emission spectroscopy and molecular docking.
4.2.1 UV–Vis absorption spectroscopy
The absorption spectrum of HSA shows a distinctive band at 278 nm which is caused by phenyl rings in aromatic amino acids such as tryptophan, phenylalanine and tyrosine (Chen et al., 2020). The absorption titration experiments were performed by keeping a constant concentration of HSA and varying the concentrations of ligand and complexes. As seen from the spectra in (Fig. 12) (Fig.13), the incremental addition of the studied compounds to HSA results in an increase of the absorbance due to the destruction of the tertiary structure of HSA and the extension of additional aromatic acid residues into the aqueous environment (Chen et al., 2020). The intrinsic binding constants (Kb) were calculated using Benesi-Hildebrand equation and listed in (Table 10). The high values of Kb constants (104M−1) revealed a strong binding affinity with HSA (Alanazi et al., 2021).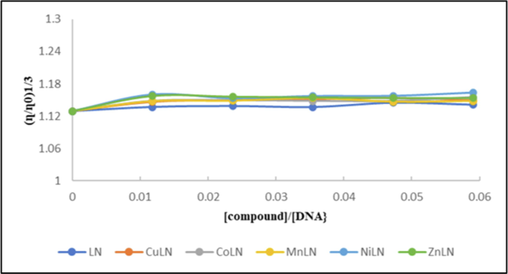
Effect of ligand and its metal complexes on the viscosity of CT-DNA.
Sample code
Kb (M−1)
LN
1.40 × 10⁴
MnLN
1.14 × 10⁴
CoLN
1.26 × 10⁴
NiLN
1.08 × 10⁴
CuLN
1.49 × 10⁴
ZnLN
1.52 × 10⁴
4.2.2 Fluorescence emission spectroscopy
Fluorescence quenching spectroscopy has been shown to be an effective technique for investigating the structural changes of HSA and its interaction with the investigated compounds. By comparing the intrinsic fluorescence intensity of HSA before and after quenching, it was possible to identify the changes in its conformation (Mahaki et al., 2019). By exciting the protein at 280 nm, the emission spectra of LN and its complexes with HSA solutions were observed within the wavelength range of 300–600 nm, as shown in (Figs. 13 and 14). The fluorescence spectra of HSA were recorded in the absence and presence of increasing concentrations of LN and its metal complexes. The spectra revealed that there is a strong emission band at 339 nm, which is due to the presence of tryptophan residues, more specifically Trp-214 in subdomain IIA (Lazou et al., 2020). This band gradually diminishes as the concentration of the investigated compounds increases, indicating that LN and its metal complexes are thought to be inhibitors of the protein’s emission. The maximum emission wavelength of HSA with LN has a slight blue shift during the interaction, suggesting that LN’s binding to HSA changed the microenvironment of the tryptophan residues and caused the HSA residues to be in a more hydrophobic environment (Chen et al., 2015). Additionally, a peak at around 530 nm simultaneously arises with the increase in compounds concentration, which attributed to the fluorescence emission of studied compounds as mentioned earlier in the fluorescence with CT-DNA. The new peak at 560 nm corresponds to change of the solvent medium by adding DMSO to the buffer solution of HAS HSA and resulting an excited-state of anionic species of D-luciferin and its metal complexes (Kuchlyan et al., 2014; Mahaki et al., 2019). The KSV values of the compounds were calculated using Stern-Volmer equation from the plot of I0/I versus [ligand or metal complex]. The fluorescence quenching rate constant Kq was derived using the formula (KSV/τ0) and listed in (Table 11). The value of Kq for all compounds are in the range of 1011M-1s−1, which is greater than the limiting diffusion quenching rate constant Kdiff (2 × 10¹⁰ M−1s−1) of biomolecules indicating that the type of quenching is static (Chen et al., 2015; Lazou et al., 2020).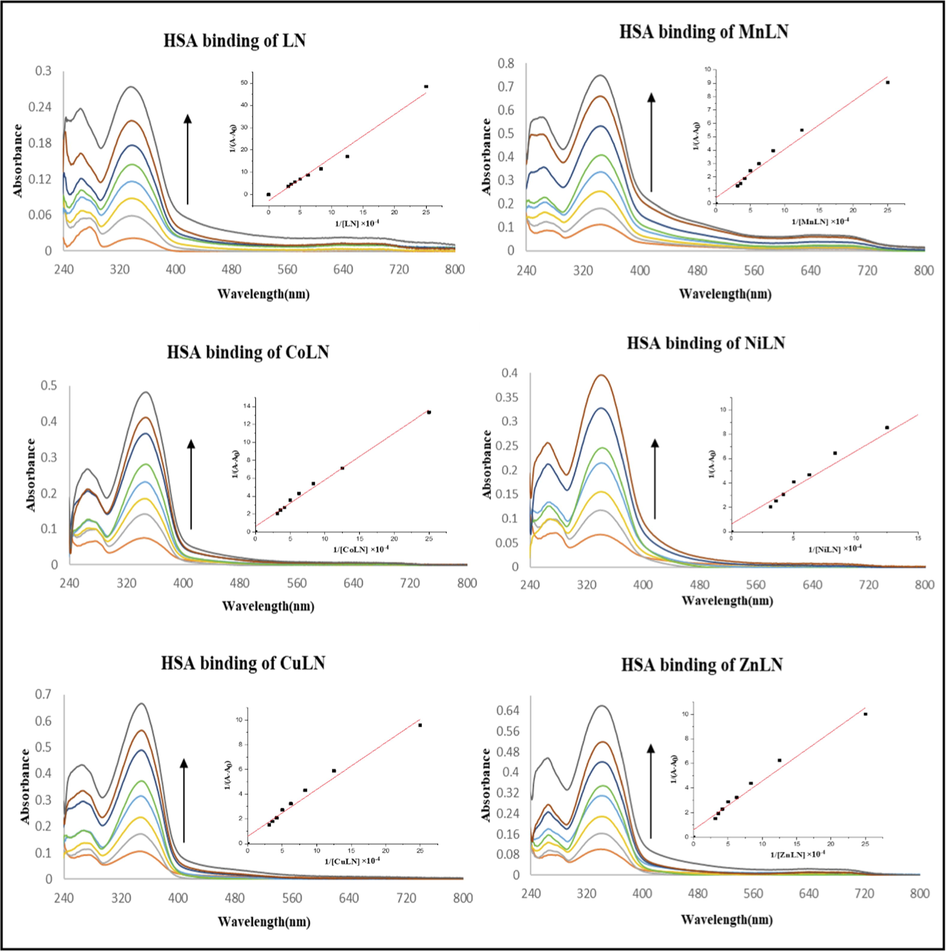
The absorption spectra of HSA in the absence and presence of increasing amounts of LN and its metal complexes.
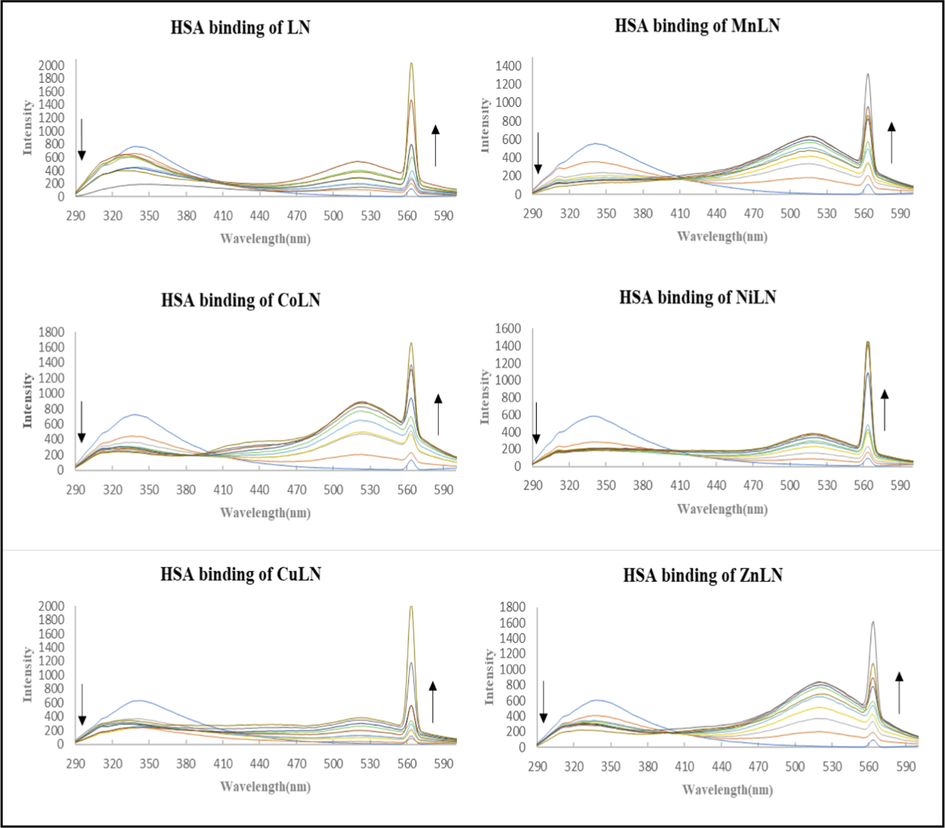
The fluorescence quenching spectra of HSA in the absence and presence of increasing concentration of ligand and metal complexes.
Sample code
KSV (M−1)
Kq (M−1s−1)
LN
1.69 × 10⁴
1.6910×11
MnLN
6.30 × 10⁴
6.3010×11
CoLN
4.01 × 10⁴
4.0110×11
NiLN
1.33 × 10⁴
1.3310×11
CuLN
5.63 × 10⁴
1.0010×11
ZnLN
3.33 × 10⁴
3.3310×11
4.3 Molecular docking
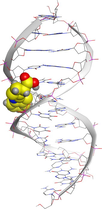
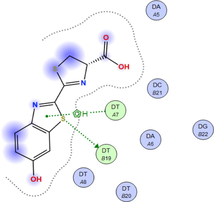
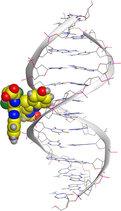
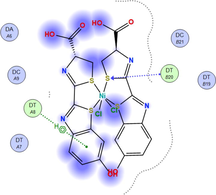
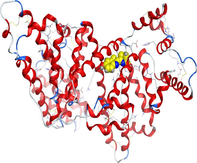
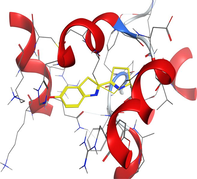
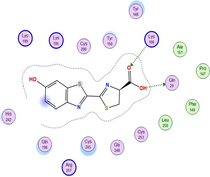
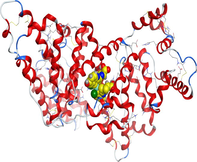
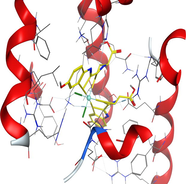
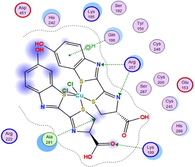
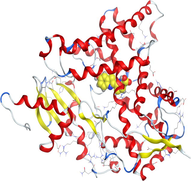
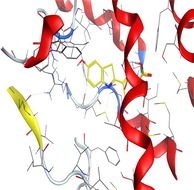
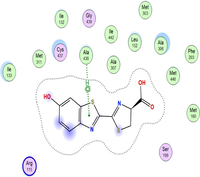
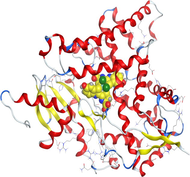
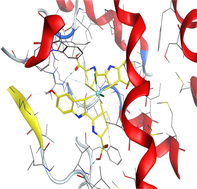
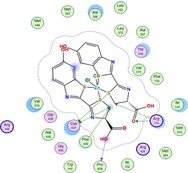
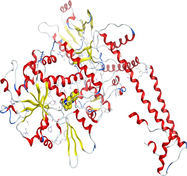
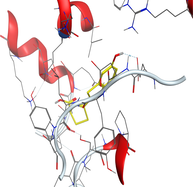
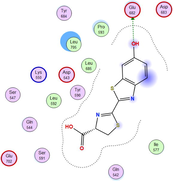
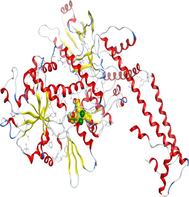
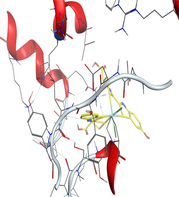
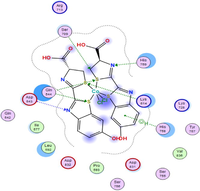
Molecular docking is a valuable technique to mimic the interactions between small molecules and biomacromolecules. The studies on molecular docking have further verified the experimental results. Docking scores with higher negative values were displayed along with the two-dimensional and three-dimensional models. Based on the best-ranked binding free energy, intermolecular energy, and electrostatic energy, the docking results are shown in (Table 12). According to Tables (12–14) and (S4-S15), the following results were obtained:
-
LN and its metal complexes bind in the minor groove of DNA from A = T rich region through hydrogen bonds and van der Waal interactions. LN binds more strongly to DNA than complexes since it has a more negative binding energy (S = -7.94 kcal mol−1). The same result was obtained from the experimental studies of electronic absorption spectroscopy.
-
Docking of LN and its metal complexes with 1h9z, 3eqm and 4 fm9 proteins revealed that complexes have higher negative free binding energy scores than the free ligand. This is because the metal ion overlapped with the ligand orbitals upon chelation and decreased the metal polarity, which increases the complexes' lipophilicity and ability to cross the lipid plasma membrane (Sharfalddin et al., 2021b; El-Boraey et al., 2022).
-
Based on docking scores, ZnLN complex binds to 1h9z, 3eqm and 4 fm9 proteins with −9.81, −10.39 and −8.98 kcal mol−1 through hydrogen bonds, indicating it has the highest binding affinity compared with other complexes. This is consistent with the experimental cytotoxicity results.
| Protein |
Sample code |
S | rmsd_refine | E_conf | E_place | E_score1 | E_refine | E_score2 |
|---|---|---|---|---|---|---|---|---|
| 1bna | LN | −7.94 | 0.81 | 50.37 | −55.17 | −13.74 | −31.25 | −7.94 |
| CoLN | −6.85 | 1.79 | −398.82 | −0.93 | −12.64 | −31.52 | −6.85 | |
| CuLN | −5.27 | 1.07 | −381.97 | −25.78 | −13.33 | −24.44 | −5.27 | |
| MnLN | −5.45 | 4.17 | −455.87 | –32.19 | −11.54 | −21.31 | −5.45 | |
| NiLN | −5.61 | 1.74 | −440.95 | −12.60 | −11.52 | −21.00 | −5.61 | |
| ZnLN | −6.38 | 2.25 | −417.72 | −8.36 | −11.12 | −21.36 | −6.38 | |
| 1h9z | LN | −8.73 | 1.64 | 57.21 | −83.11 | −9.70 | −28.20 | −6.73 |
| CoLN | −7.96 | 3.46 | −384.75 | −90.65 | −11.14 | −27.01 | −7.46 | |
| CuLN | −9.14 | 1.59 | −376.40 | −109.04 | −11.31 | –23.31 | −8.14 | |
| MnLN | −7.44 | 3.20 | −440.06 | −52.38 | −12.01 | −24.24 | −7.54 | |
| NiLN | −7.20 | 1.81 | −335.32 | −99.07 | −12.77 | −13.65 | −7.20 | |
| ZnLN | −9.81 | 4.32 | −405.13 | −61.19 | −10.27 | −24.49 | −7.09 | |
| 3eqm | LN | −6.59 | 1.54 | 48.15 | −88.21 | −10.20 | −28.79 | −6.59 |
| CoLN | −9.44 | 1.58 | −369.75 | −162.89 | −13.92 | −37.76 | −9.44 | |
| CuLN | −8.46 | 1.25 | −354.94 | −113.35 | −11.32 | −36.91 | −8.46 | |
| MnLN | −9.31 | 1.58 | −443.91 | −134.64 | −11.21 | −21.39 | −9.31 | |
| NiLN | −10.10 | 1.91 | −422.64 | −102.76 | −13.20 | –32.99 | −10.10 | |
| ZnLN | −10.39 | 2.02 | −405.39 | −124.69 | −12.99 | −29.23 | −10.39 | |
| 4 fm9 | LN | −5.02 | 1.21 | 55.19 | −72.63 | −10.22 | –32.78 | −5.02 |
| CoLN | −8.02 | 1.57 | −388.69 | −97.28 | −12.34 | 17.96 | −8.02 | |
| CuLN | −6.02 | 1.73 | −375.64 | −96.23 | −13.04 | −25.33 | −6.02 | |
| MnLN | −7.82 | 2.37 | −439.74 | −119.49 | −11.89 | −24.08 | −7.82 | |
| NiLN | −6.85 | 1.54 | −426.51 | −76.67 | −12.04 | −30.55 | −6.85 | |
| ZnLN | −8.98 | 1.78 | −411.24 | −83.25 | −12.99 | –32.23 | −8.98 |
| Sample code | 3D model | 2D model |
|---|---|---|
| LN |
|
|
| NiLN |
|
|
| Protein |
Sample code |
3D model | Site view | 2D model |
|---|---|---|---|---|
| 1h9z | LN |
|
|
|
| CuLN |
|
|
|
|
| 3eqm | LN |
|
|
|
| ZnLN |
|
|
|
|
| 4 fm9 | LN |
|
|
|
| CoLN |
|
|
|
4.4 Cytotoxicity assay
The anticancer activity of the ligand and its synthesized metal complexes has been investigated against the human breast cancer cell line (MCF-7) and the human liver carcinoma cell line (HepG-2). MCF-7 was selected because breast cancer is the most relevant cancer in women globally and because this cell line responds to estrogen by proliferating, while HepG-2 was chosen because liver cancer is the third frequent cause of fatalities worldwide (Sung et al., 2021; Al-rashdi et al., 2022). Cisplatin was used as a standard control for comparison reasons. As listed in (Table 15), the inhibitory effect was assessed by the half maximal concentration IC50. The results revealed that ZnLN complex showed the highest activity against both cell lines compared to cisplatin and other investigated compounds, as shown in (Fig. 14) (Fig. 15) and (Fig. 16). The IC50 values of the investigated compounds against MCF-7 cell line follow the order: ZnLN > cisplatin > NiLN > CoLN > MnLN > CuLN > LN, while Hep-G cell line follow the order: ZnLN > CoLN > MnLN > NiLN > cisplatin > CuLN > LN. The cytotoxicity results are consistent with the docking values. The effect of ZnLN on both cell lines at different concentrations were shown in (Fig. 16) (Fig. 17) and the rest of complexes are shown in (Fig S3). A significant change in cell morphology was observed in both cell lines as well as a reduction in cell density.
Sample code
IC50 (µM)
MCF-7
HepG-2
LN
78.34 ± 2.81
86.65 ± 1.06
MnLN
60.63 ± 1.27
58.85 ± 0.48
CoLN
59.74 ± 1.35
55.73 ± 2.13
NiLN
53.78 ± 0.72
67.95 ± 0.50
CuLN
66.63 ± 2.43
75.86 ± 1.13
ZnLN
20.06 ± 0.49
37.39 ± 1.00
Cisplatin
33.12 ± 1.11
71.33 ± 1.60

Inhibition and IC50 of LN complexes against MCF-7 cell line.

Inhibition and IC50 of LN complexes against HepG-2 cell line.
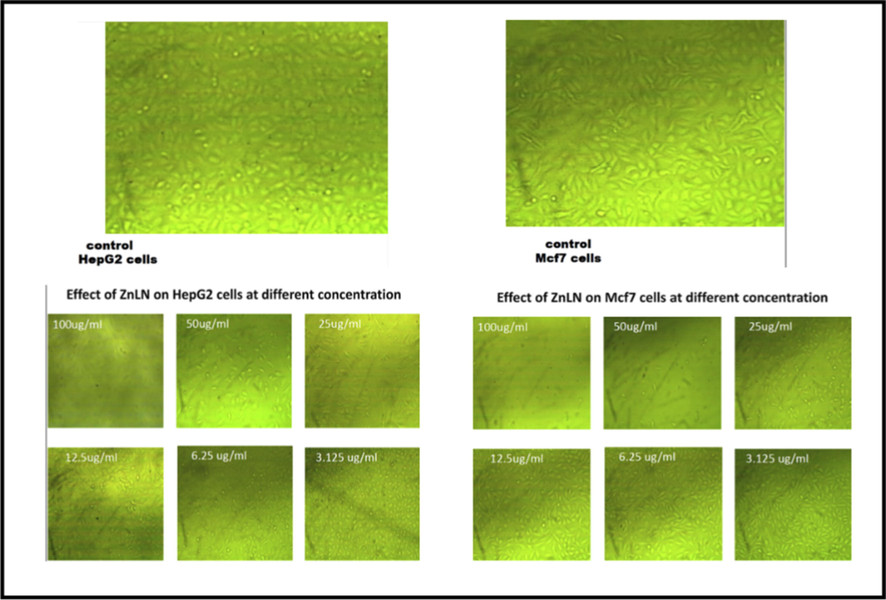
The effect of ZnLN against MCF-7 and HepG2 cell lines at different concentrations.
5 Conclusion
In this paper, five new transition metal complexes of D-luciferin (LN) were synthesized using a 1:2 metal to ligand ratio. Various techniques were utilized to confirm the structure of the synthesized complexes. DFT/B3LYP calculations were also used to confirm the structural characteristics of the ligand and its complexes. The results indicated that luciferin forms an octahedral geometry by being bidentate coupled through two sulfur atoms to each metal in these complexes. Molar conductance experiments showed the non-electrolytic nature of the synthesized complexes. There an agreement between the thermal decomposition assignments and the proposed structure of the complexes. The affinity of the studied compounds for CT-DNA was investigated using different techniques. The results revealed that they bind non-covalently via groove binding. The intrinsic fluorescence of HSA was strongly quenched by LN and its metal complexes through a static quenching mode. Molecular docking studies were employed to assess the binding affinity of the complexes to HSA (1h9z), breast cancer (3eqm) and liver cancer (4 fm9) proteins, ZnLN complex showed the highest negative value compared to other complexes. Finally, two human cancer cell lines (HepG-2 and MCF-7) were utilized to examine the cytotoxic activity of compounds. In both cell lines, the synthesized metal complexes exhibited greater anticancer activity than the free ligand. The molecular docking results were also in accordance with the experimental results. As a conclusion, ZnLN can be utilized as a bioactive compound due to its promising biological properties.
CRediT authorship contribution statement
Nouf E. Alshaikh: Data curation, Formal analysis, and Methodology. Mehvash Zaki: Conceptualization, review and editing. Najlaa S. Al radadi: Methodology, investigation. Abeer A. Sharfalddin: Validation, Visualization, Writing - review & editing. Mostafa A. Hussien: Supervision, Conceptualization, Investigation, Project administration, Writing - original draft, Writing - review & editing. Walid M.I.Hassan: Visualization, software.
Acknowledgement
The authors acknowledge King Fahad Centre for Medical Research for the technical support. The High-Performance Computing Centre (Aziz Supercomputer) of King Abdulaziz University ( http://hpc.kau.edu.sa) was utilized for the computational work.
References
- ‘Tuning the anticancer properties of Pt (II) complexes via structurally flexible N-(2-picolyl)salicylimine ligands. Roy. Soc. Chem.. 2022;12(September):27582-27595.
- [CrossRef] [Google Scholar]
- Characterization, theoretical investigation, and biological applications of Mn(II), Co(II), Ni(II), Cu(II), and Zn(II) complexes of a triazene ligand containing a benzothiazole ring. Appl. Organometallic Chem.. 2021;36(1):1-20.
- [CrossRef] [Google Scholar]
- ‘Synthesis and characterization of new metal complexes containing triazino[5,6–b]indole moiety: in vitro DNA and HSA binding studies. J. Mol. Struct.. 2021;1246:1-19.
- [CrossRef] [Google Scholar]
- Biological aspects of emerging benzothiazoles: a short review. J. Chem.. 2013;2013:1-13.
- [CrossRef] [Google Scholar]
- Empirical formulae to molecular structures of metal complexes by molar conductance. Synthesis and Reactivity in Inorganic, Metal-Organic and Nano-Metal Chemistry. 2013;43(9):1162-1170.
- [CrossRef] [Google Scholar]
- Synthesis, DNA binding, and molecular docking studies of dimethylaminobenzaldehyde-based bioactive schiff bases. J. Chem.. 2019;2019:1-14.
- [CrossRef] [Google Scholar]
- QSAR modeling, molecular docking and cytotoxic evaluation for novel oxidovanadium(IV) complexes as colon anticancer agents. Molecules. 2022;27(3):1-23.
- [CrossRef] [Google Scholar]
- Experiment versus theory of copper (II) complexes based imidazole derivatives as anti-cancer agents. J. Indian Chem. Soc.. 2022;99(10):100692
- [CrossRef] [Google Scholar]
- New series of thiazole derivatives: synthesis, structural elucidation, antimicrobial activity, molecular modeling and MOE docking. Molecules. 2019;24(9):1-23.
- [CrossRef] [Google Scholar]
- Characterization of new Pt(IV)–thiazole complexes: analytical, spectral, molecular modeling and molecular docking studies and applications in two opposing pathways. Appl. Organometallic Chem.. 2019;33(9):1-18.
- [CrossRef] [Google Scholar]
- Synthesis, characterization and in vitro DNA binding and cleavage studies of Cu(II)/Zn(II) dipeptide complexes. J. Photochem. Photobiol. B: Biol.. 2013;121:75-85.
- [CrossRef] [Google Scholar]
- Synthesis, photochemical and electrochemical studies on triphenyltin(IV) derivative of (Z)-4-(4-cyanophenylamino)-4-oxobut-2-enoic acid for its binding with DNA: biological interpretation. Arabian J. Chem.. 2016;9(3):451-462.
- [CrossRef] [Google Scholar]
- Synthesis, characterization, computational study, DNA binding and molecular docking studies of chromium (III) drug-based complexes. J. Mol. Struct.. 2020;1215:1-14.
- [CrossRef] [Google Scholar]
- Alteration of anticancer and protein-binding properties of gold(I) alkynyl by phenolic schiff bases moieties. Pharmaceutics. 2021;13(4):1-13.
- [CrossRef] [Google Scholar]
- Substitution effect on new Schiff base ligand in complexation with some divalent metal ion; synthesis, characterization, DFT and cytotoxicity studies. Results Chem.. 2022;4(July):100445
- [CrossRef] [Google Scholar]
- Theoretical investigation by DFT and molecular docking of Synthesized oxidovanadium(IV)-based imidazole drug complexes as promising anticancer agents. Molecules. 2022;27(9):1-21.
- [CrossRef] [Google Scholar]
- Becke, A. 1993. Density-functional thermochemistry. III. The role of exact exchange (1993) J. Chem. Phys, 98, 5648.
- The preparation and properties of crystalline firefly luciferin. Arch. Biochem. Biophys.. 1957;72(2):358-368.
- [CrossRef] [Google Scholar]
- Spectral and magnetic studies on manganese(II), cobalt(II) and nickel(II) complexes with Schiff bases. Spectrochimica Acta - Part A: Mol. Biomol. Spectrosc.. 2005;61(1–2):219-224.
- [CrossRef] [Google Scholar]
- Affinity of a mononuclear monofunctional anticancer Pt(II) complex to human serum albumin: a spectroscopic approach. BioMetals. 2015;28(6):1031-1041.
- [CrossRef] [Google Scholar]
- Biological properties of a benzothiazole-based mononuclear platinum(II) complex as a potential anticancer agent. J. Coordination Chem.. 2020;73(12):1-10.
- [CrossRef] [Google Scholar]
- Thermogravimetric analysis. Principles and Applications of Thermal Analysis. 1963;88:906-924.
- [CrossRef] [Google Scholar]
- Advanced inorganic chemistry. John Wiley and Sons Inc.; 1999.
- Synthesis, antioxidant properties and radioprotective effects of new benzothiazoles and thiadiazoles. Bioorganic Medicinal Chem.. 2009;17(14):5275-5284.
- [CrossRef] [Google Scholar]
- Semichem Inc. Vol GaussView 6.0. USA: Shawnee Mission, KS; 2016. p. :16.
- Structure elucidation, DNA interaction, potential anticancer, molecular docking activities, and γ-ray irradiation studies on novel mono- and binuclear Fe (II), Ni (II), Co (II), and Hg (II) Schiff base complexes. Appl. Organometallic Chem. 2022:1-22.
- [CrossRef] [Google Scholar]
- Ferlay J, Laversanne M, Ervik M, Lam F, Colombet M, Mery L, Piñeros M, Znaor A, Soerjomataram I, B.F., 2021. Cancer tomorrow, World Health Organization (WHO). Available at: https://gco.iarc.fr/tomorrow (Accessed: 1 September 2022).
- Inorganic infrared spectroscopy. J. Chem. Education. 1961;38(4):201-208.
- [CrossRef] [Google Scholar]
- Cisplatin as an anti-tumor drug: cellular mechanisms of activity, drug resistance and induced side effects. Cancers. 2011;3(1):1351-1371.
- [CrossRef] [Google Scholar]
- Gaussian 09, Revision D. 01, Gaussian Inc, Wallingford, CT, 2009. (b) Becke. AD. Phys. Rev. A. 1988;38:3098-3100.
- [Google Scholar]
- Gaussian 09, revision a (02 [CP].). Wallingford, CT: Gaussian. Inc.; 2009.
- NMR chemical shifts of common laboratory solvents as trace impurities. J. Organic Chem.. 1997;62(21):7512-7515.
- [CrossRef] [Google Scholar]
- Ab initio effective core potentials for molecular calculations. Potentials for K to Au including the outermost core orbitals. J. Chem. Phys.. 1985;82:299-310.
- [Google Scholar]
- Theoretical study of absorption and fluorescence spectra of firefly luciferin in aqueous solutions. Photochemistry and Photobiology. 2012;88(4):889-898.
- [CrossRef] [Google Scholar]
- A new analysis of thermogravimetric traces. Anal. Chem.. 1963;35(10):1464-1468.
- [CrossRef] [Google Scholar]
- Spectrophotometric study of stability constants of semicarbazone-Cu(II) complex at different temperatures. Der Pharma Chemicaa. 2016;8(9):44-47.
- [Google Scholar]
- Synthesis, characterization and medical efficacy (hepatoprotective and antioxidative) of albendazole-based copper(II) complexes - An experimental and theoretical approach. J. Coordination Chem.. 2015;68(24):4296-4313.
- [CrossRef] [Google Scholar]
- 1001 lights: luciferins, luciferases, their mechanisms of action and applications in chemical analysis, biology and medicine. Chem. Soc. Rev.. 2016;45(21):6048-6077.
- [CrossRef] [Google Scholar]
- The resurgence of platinum-based cancer chemotherapy. Nat. Rev. Cancer. 2007;7(8):573-584.
- [CrossRef] [Google Scholar]
- Metal complexes of naphthoquinone based ligand: synthesis, characterization, protein binding, DNA binding/cleavage and cytotoxicity studies. J. Biomol. Struct. Dyn.. 2018;36(16):4170-4181.
- [CrossRef] [Google Scholar]
- Excited-state proton transfer dynamics of firefly’s chromophore D-luciferin in DMSO–water binary mixture. J. Phys. Chem. B. 2014;118(48):13946-13953.
- [Google Scholar]
- Synthesis and cytotoxic evaluation of thiourea and N-bis-benzothiazole derivatives: a novel class of cytotoxic agents. Bioorganic Medicinal Chem. Lett.. 2012;22(1):453-455.
- [CrossRef] [Google Scholar]
- Transition metal complexes with a novel guanine-based (E)-2-(2-(pyridin-2-ylmethylene)hydrazinyl)quinazolin-4(3H)-one: synthesis, characterization, interaction with DNA and albumins and antioxidant activity. J. Inorganic Biochem.. 2020;206:1-14.
- [CrossRef] [Google Scholar]
- Synthesis and biological evaluation of novel benzothiazole derivatives as potential anticonvulsant agents. Molecules. 2016;21(3):1-13.
- [CrossRef] [Google Scholar]
- Cytotoxicity and antioxidant activity of Kamolonol acetate from Ferula pseudalliacea, and studying its interactions with calf thymus DNA (ct-DNA) and human serum albumin (HSA) by spectroscopic and molecular docking techniques. Process Biochem.. 2019;79(November):203-213.
- [CrossRef] [Google Scholar]
- Synthesis and antidiabetic evaluation of novel pyrazolone derivatives. J. Korean Chem. Soc.. 2012;56(2):251-256.
- [CrossRef] [Google Scholar]
- Firefly bioluminescence: a mechanistic approach of luciferase catalyzed reactions. IUBMB Life. 2009;61(1):6-17.
- [CrossRef] [Google Scholar]
- Extension of Gaussian-1 (G1) theory to bromine-containing molecules. The Journal of Chemical Physics. 1991;94:511-516.
- [Google Scholar]
- Noble metals in medicine: Latest advances. Coordination Chem. Rev.. 2015;284:329-350.
- [CrossRef] [Google Scholar]
- Platinum anticancer drugs. From serendipity to rational design. Annales Pharmaceutiques Francaises. 2011;69(6):286-295.
- [CrossRef] [Google Scholar]
- 1H NMR spectrum and computational study of firefly luciferin in dimethyl sulfoxide. J. Mol. Struct.: THEOCHEM. 2009;901(1–3):60-65.
- [CrossRef] [Google Scholar]
- Transition metal complexes as potential therapeutic agents. Biotechnol. Mol. Biol. Rev.. 2010;5(2):38-45.
- [Google Scholar]
- N-{[(6-substituted-1,3-benzothiazole-2-yl)amino]carbonothioyl}-2/4-substituted benzamides: synthesis and pharmacological evaluation. Eur. J. Medicinal Chem.. 2008;43(5):1114-1122.
- [CrossRef] [Google Scholar]
- B.Rosenberg, L.V., 1969. Platinum compounds: a new class of potent antiumor agents, Nature Publishing Group, 222, pp. 385–386. http://adsabs.harvard.edu/abs/1969Natur.224.177K.
- Synthesis, characterization and biological evaluation of some thiourea derivatives bearing benzothiazole moiety as potential antimicrobial and anticancer agents. Eur. J. Medicinal Chem.. 2010;45(4):1323-1331.
- [CrossRef] [Google Scholar]
- Molecular modeling and spectroscopic studies of benzothiazole. J. Chem.. 2013;2013:1-14.
- [CrossRef] [Google Scholar]
- ‘Biological evaluation of a series of benzothiazole derivatives as mosquitocidal agents. Open Chem.. 2019;17(1):288-294.
- [CrossRef] [Google Scholar]
- Practical and computational studies of bivalence metal complexes of sulfaclozine and biological studies. Front. Chem.. 2021;9:1-16.
- [CrossRef] [Google Scholar]
- Synthesis and theoretical calculations of metal-antibiotic chelation with thiamphenicol:in vitro DNA and HSA binding, molecular docking, and cytotoxicity studies. New J. Chem.. 2021;45(21):9598-9613.
- [CrossRef] [Google Scholar]
- Biological efficacy of novel metal complexes of Nitazoxanide: Synthesis, characterization, anti-COVID-19, antioxidant, antibacterial and anticancer activity studies. J. Mol. Liquids. 2022;368:120808
- [Google Scholar]
- Characterization of interaction of calf thymus DNA with gefitinib: spectroscopic methods and molecular docking. J. Photochem. Photobiol. B: Biol.. 2015;147:47-55.
- [CrossRef] [Google Scholar]
- Siegel, R.L., Miller, K.D., Fuchs, H.E. Jemal, A., 2022. ‘Cancer statistics, 2022’, CA: A Cancer Journal for Clinicians, 72(1), pp. 7–33. https://doi.org/10.3322/caac.21708.
- Drug-DNA interactions and their study by UV-Visible, fluorescence spectroscopies and cyclic voltametry. J. Photochem. Photobiol. B: Biol.. 2013;124:1-19.
- [CrossRef] [Google Scholar]
- Standards, N. I. O. & technogy, 2018. Precomputed Vibrational Scaling Factors.
- Purification of firefly luciferin. 1949;34(3):457-466.
- [CrossRef]
- Sudahaharan, T., Reddy , A. R., 2000. Metal ion mediated inhibition of firefly bioluminescence: a possibility via a quaternary complex.
- Global cancer statistics 2020: GLOBOCAN estimates of incidence and mortality worldwide for 36 cancers in 185 countries. CA: A Cancer J. Clin.. 2021;71(3):209-249.
- [CrossRef] [Google Scholar]
- Synthesis of heterobimetallic complexes: In vitro DNA binding, cleavage and antimicrobial studies. J. Photochem. Photobiol. B: Biol.. 2012;114:108-118.
- [CrossRef] [Google Scholar]
- Spectrophotometric study of stability constants of cimetidine-Ni(II) complex at different temperatures. Arabian J. Chem.. 2012;5(3):309-314.
- [CrossRef] [Google Scholar]
- Synthesis, characterization of 1,2,4-triazole Schiff base derived 3d-metal complexes: Induces cytotoxicity in HepG2, MCF-7 cell line, BSA binding fluorescence and DFT study. Spectrochimica Acta - Part A: Mol. Biomol. Spectrosc.. 2017;171:246-257.
- [CrossRef] [Google Scholar]
- Surfactant–cobalt(III) complexes: The impact of hydrophobicity on interaction with HSA and DNA – insights from experimental and theoretical approach. Colloids Surf. B: Biointerfaces. 2017;153:85-94.
- [CrossRef] [Google Scholar]
- Synthesis, characterisation and anti-inflammatory activity of some 2-amino benzothiazole derivatives. Int. J. ChemTech Res.. 2009;1(4):1354-1358.
- [Google Scholar]
- Advances in the knowledge of light emission by firefly luciferin and oxyluciferin. J. Photochem. Photobiol. B: Biol.. 2012;117:33-39.
- [CrossRef] [Google Scholar]
- Interaction of an abiraterone with calf thymus DNA: Investigation with spectroscopic technique and modelling studies. Bioorganic Chem.. 2020;100:1-7.
- [CrossRef] [Google Scholar]
- The structure and synthesis of firefly luciferin. J. Am. Chem. Soc.. 1963;85(3):337-343.
- [CrossRef] [Google Scholar]
- Benzothiazole: different methods of synthesis and diverse biological activities. Int. J. Pharm. Sci. Drug Res.. 2011;3(1):1-7.
- [CrossRef] [Google Scholar]
Appendix A
Supplementary data
Supplementary data to this article can be found online at https://doi.org/10.1016/j.arabjc.2023.104845.
Appendix A
Supplementary data
The following are the Supplementary data to this article:Supplementary data 1
Supplementary data 1


