

Translate this page into:
Systematic development and validation of RP-HPLC method for simultaneous estimation of tamoxifen and sulphoraphane with specific application for nanolipidic formulations
⁎Corresponding authors at: Department of Pharmaceutics, School of Pharmaceutical Education and Research, Jamia Hamdard, New Delhi 110062, India. sarwar.beg@gmail.com (Sarwar Beg), prof.kanchankohli@gmail.com (Kanchan Kohli)
-
Received: ,
Accepted: ,
This article was originally published by Elsevier and was migrated to Scientific Scholar after the change of Publisher.
Peer review under responsibility of King Saud University.
Abstract
Tamoxifen (TAM) and Sulphoraphane (SFN) are well-known anti-estrogen drugs used for the treatment of breast cancer. Due to their synergistic therapeutic potential, their combination is preferred as it helps to minimize the drug-related toxicities and enhances therapeutic efficacy. A simple, robust and fast simultaneous reversed-phase high-performance liquid chromatography (RP-HPLC) method was developed as well validated for the analysis of both the drugs based on their particular wavelength. The separation was performed on C18 analytical column with dimensions of 4.6 × 250 mm, 5 μm using mobile phase methanol: water (pH 3.5) in the ratio 70:30 and flow rate of 0.8 min/mL. Box-Behnken experimental design was used to optimized these independent variables and analyze their effect on the response variables like retention time (RT), no. of theoretical plates and tailing factor of both analytes. Method validation was carried out for establishing the specificity, linearity range, accuracy, sensitivity, robustness, precision and ruggedness. The method applicability was evaluated on different nanoformulations, i.e., solid lipid nanoparticles (SLNs), liposomes (LIPO), nanostructured lipid carriers (NLCs). The peaks of the analyte were found to be well resolved and two distinct RT were recorded for TAM and SFN. Calibration curves were found to be linear for TAM and SFN over concentration range of 6–24 μg/mL. All method validation criteria were within the range of acceptance. Relative standard deviation (%RSD) was observed to be <2% for inter- and intra-day precision. The application of developed method for estimation of drugs from the nanoformulations was suitabile for in vitro as well as in vivo studies.
Keywords
Tamoxifen
Sulphoraphane
Method validation
Nanostructured lipid carriers
Solid lipid nanoparticles
Liposomes

1 Introduction
Tamoxifen (TAM) is a well-known chemotherapeutics agent pharmacologically categorized as a selective estrogen receptor modulator approved for the treatment and management of estrogen receptor-positive breast cancer. Chronically, it is administered in the post and pre-menopausal women. TAM exerts the anti-cancer effects by inhibiting the G1 and G0 phase of the cell cycle in breast cancer cells (Sutanto et al., 2010) as well as reduces the circulating insulin-like growth factor levels. Although TAM is a promising molecule used for breast cancer treatment, yet it encounters various biopharmaceutical challnges such as low solubility and poor bioavailability (>10%) (Shete and Patravale, 2013). Moreover, TAM undergoes precipitation inside the stomach, which further results in the first-pass metabolism causing generation of free radicals as well as formation of toxic metabolites. Furthermore, because of the accumulation of dose, patients are prone to develop endometrial cancer as well as hepatotoxicity mediated by oxidative stress (Jordan, 2007). According to previous studies, at higher dose, TAM induces nephrotoxicity (Lasso De La Vega et al., 2002; White, 1999) with steatosis and cholestatic syndrome (Shete et al., 2014). Henceforth, a novel means to circumvent the problems mentioned above is a combinatorial approach of a synthetic drug with a herbal moiety that would reduce the underlying issues related to toxic effects and potentiate anti-cancer efficacy.
Sulphoraphane (SFN), an herbal chemotherapeutic drug and one of the major phytochemicals, found in cruciferous vegetables acts on estrogen receptor positive breast cancer receptors and exerts similar activity as TAM. Isothiocyanate, the main phytochemical present in SFN is responsible for inducing apoptosis in breast cancer cells and initiating cell cycle arrest at Go/M phase. It suppresses phase I enzymes that activate the carcinogens which stimulates the enzymes of phase II cycle (Pledgie-Tracy et al., 2007). Moreover, it helps in preventing oxidative stress-mediated liver injury by the activation of NRF-2 reaction. Despite being a potent herbal chemotherapeutic agent, the clinical use of SFN is limited because of its low aqueous solubility and first-pass metabolism. Thus, a combinatorial nanoformulation approach is favoured, as it would improve the oral bioavailability of the drug and can reduce TAM-related toxicity as well as enhance the therapeutic effect by synergistic anti-cancer effect. The authors has previously published a hypotheses article in Elsevier's medical hypotheses to justify the rationale behind using this combinatorial approach for the treatment of breast cancer (Mangla et al., 2019).
Quantification of TAM and SFN individually in various pharmaceutical formulations and biological fluids via several analytical techniques such as high-performance liquid chromatography (HPLC) (Sandhu et al., 2016), micellar liquid chromatography (Peris-Vicente et al., 2014), vierordt's method (El-Leithy and Abdel-Rashid, 2016), thin-layer chromatography (TLC)-densitometric (Saleh et al., 2018), gas chromatography (Chiang et al., 1998), mass spectroscopy (Kokotou et al., 2017) and liquid chromatography-mass spectroscopy (LC/MS) methods have been reported (Ares et al., 2015). Further, our research team has also developed the UPLC/MS method for the simultaneous estimation of TAM and SFN (Mangla et al., 2020). However, as per the literature study until now, there is no simultaneous HPLC method available for the identification and quantification of TAM and SFN in pharmaceutical samples.
Design of Experiment (DOE) is frequently applied to optimize the analytic methods for reducing the number of tests required to perform (Beg et al., 2017a, 2017b; Singh et al., 2013, 2016; Singh and Beg, 2015; Bhutani et al., 2014). DOE allows development of a statistical model that enables estimation of statistical significance of the various factor effects and interactions between the responses. The literature study has identified that many analytical methods have also been documented utilizing the Box-Behnken design (BBD) to optimize chromatographic conditions used in HPLC methods (Bandopadhyay et al., 2020; Beg et al., 2012, 2015, 2016a, 2016b; Fatima et al., 2019; Panda et al., 2019).
Therefore, the present study aims to develop a simple, sensitive and reliable simultaneous analytical method based on reversed phase-HPLC (RP-HPLC) for quantification of TAM and SFN in bulk drugs and pharmaceutical formulations. The preliminary method development work was performed and systematic optimization was carried out using Box-Behnken design. Methanol concentration, pH of the selected mobile phase and flow rate were optimized by this design and considered as the independent variables. The study was carried out without an internal standard since no complicated extraction or separation steps were involved. Besides, the developed simultaneous method was used for the quantification of TAM and SFN in different lipid-based nanoformulations such as solid lipid nanoparticles (SLNs), liposomes (LIPO) and nanostructured lipid carriers (NLCs). Moreover, simultaneous estimation of TAM and SFN in these nanoformulations may have significant clinical relevance and could even aid in pharmacokinetic research.
2 Material and methods
2.1 Materials
TAM (analyte 1) was supplied by Cadila Pharmaceuticals Limited (Ahmedabad, India) as a gift sample and SFN (analyte 2) was purchased from Global Lab Solutions (New Delhi, India), respectively. Precirol® ATO 5, Transcutol HP and Compritol® 888 ATO were obtained from Gattefosse (Mumbai, India) as a gift sample. Tween 80 and poloxamer 188 were received from SD FINE CHEM (Mumbai, India) and BASF (Mumbai, India). Phospholipon 90G was provided by Lipoid GmBH (Germany)as a gift sample. Cholesterol was procured from Sigma Aldrich (St.Louis, MO, USA). HPLC grade chemicals were used in the entire experiment.
2.2 Methods
2.2.1 HPLC instrumentation and chromatographic conditions
The HPLC system consisted of a model Shimadzu-10ATVP binary pump connected by photodiode array detector (SPD-M20A) with EMPOWER software. Both analyte was separated on reverse phase (RP) C18 column (250 mm × 4.6 mm × 5 μm) at their respective wavelength i.e. 210 nm for SFN and 275 nm for TAM (Mangla et al., 2020b). Absorption maxima of both drugs are shown in Fig. S1. For this study, Methanol: water (pH 3.5) with ratio 70:30% v/v was used as mobile phase that degassed daily and filtered by 0.22-µm nylon membrane filter with before use. The column temperature was maintained at 30 °C. Total run time analysis was less than 25 min, with flow rate of 0.8 mL/min.
2.2.2 Preparation of standard and working solutions
The standard solution of both analytes has been separately prepared with methanol in 10 mL volumetric flask to obtained 1000 µg/mL concentration and considered as standard solution A1 for TAM and A2 for SFN. From this solution, took 1 mL and diluted with methanol to obtained 100 µg/mL of concentration (stock B1 and B2). Stock B1 and B2 was further appropriately diluted with methanol to get mixed working stock solution with concentrations 6, 9, 12, 15, 18, 21, and 24 μg/mL, respectively (Nakagawa et al., 2006). Further, the quality control (QC) samples of both analyte were similarly prepared to obtain 10 μg/mL i.e. lower quality control (LQC), 15 μg/mL i.e., middle quality control (MQC) and 20 μg/mL i.e. higher quality control (HQC). All solutions were filtered through a 0.22-µm filter (Millifilter, Milford, MA, USA) before analysis.
2.2.3 Optimization of RP-HPLC method
The proposed method was optimized by Box Behnken design (BBD) using three independent variables and six dependent variables. BBD produces higher-order responses of independent variables with less possible runs than a standard factorial approach. In this design, % methanol concentration (A), pH of aqueous mobile phase (B), flow rate (C) were considered as independent variables and retention time (RT) of TAM (Y1); SFN (Y4), tailing factor of TAM (Y2); SFN (Y5), No. of theoretical plates of TAM (Y3); SFN (Y6) were taken as dependent variables. With the help of design Expert® (STATEASE Inc., USA) software, 17 test runs were conducted (Table S1) and analyzed the response of dependent variables (Y) via polynomial equations.
2.3 Method validation
The method has been validated with regards to specificity, system suitability test, linearity, precision (intra-day and inter-day), robustness, ruggedness, the limit of detection (LOD), and limit of quantification (LOQ). Stability studies on different storage conditions were also conducted.
2.3.1 System suitability test
This test is an integral part of the liquid chromatographic techniques that check the method’s reproducibility and sure that the whole testing system is suitable for the intended application. The system suitability test was assessed at MQC level (15 µg/mL) by injecting six replicate and outcomes have been studied by RT, peak area, theoretical plates of the column and tailing factor of both analytes. US-FDA guidelines considered the approval criterion for this test that the relative standard deviation (%RSD) for RT and peak area should be less than 2%. For tailing factor, the range should not exceed by two and for theoretical plates of the column, it should more than 2000 (N > 2000).
2.3.2 Specificity
Specificity is the essential characteristic of HPLC and refers to the capability of the analytical system to separate the analyte from the complex mixture. Specificity has been evaluated by comparing the chromatogram of individual solutions, their mixture and blank solution independently at MQC level. The blank solution was prepared as the sample solution, but without adding both the drugs (TAM and SFN).
2.3.3 Linearity
The linearity was determined by preparing seven different concentrations of a mixed standard solution in the range of 6–24 µg/ml of TAM and SFN, which cover 40%, 60%, 80%, 100%, 120%, 140% and 160% of the target concentration, respectively. The individual calibration curves of TAM and SFN were plotted between peak area on the Y-axis versus their respective concentration X-axis and regression equations were calculated. Also, calculate the response ratio (response factor) by dividing the peak area with concentration.
2.3.4 Robustness
This experiment has been conducted to assess the suitability of the method by changing the small variations in the experimental parameters such as a change in detection wavelength of TAM (273 to 277 nm); SFN (207 to 211 nm), column oven temperature (25 to 35 °C) and injection volume (15 to 25 μL). Further, the effect caused due to these variations in method conditions was investigated and analyze the results. At each variation, 100% of target concentration (MQC, 15 µg/mL) was taken and three replicate (n = 3) of each sample injected into the chromatographic system. The method robustness was evaluated from the %RSD of the mean peak area and mean % recovery of TAM and SFN. Their limit should not be exceed 2% (Ganorkar et al., 2017). Further measure the tailing factor, theoretical plates and RT of both analyte.
2.3.5 Accuracy
The accuracy of an analytical method means the nearness between the expected value and the value found. The accuracy of the proposed method was determined by % recovery of both analytes at three QC levels (50%, 100% and 150%) and from each concentration, three sample replicate (n = 3) were injected. The mean % recovery of TAM and SFN with their %RSD and standard error (SE) were analyzed using the following formula. The mean % recovery should be within 90–110% and %RSD as well SE should NMT 2%, to be accepted for the accuracy.
2.3.6 Precision
The precision is the extent to which the technique is repeatedly used to analyze several replicates in different instances. The precision of the method for intra-day and inter-day analysis was determined by studying with the QC samples for both analytes. For intra-day, three replicates of samples for each drug (n = 3) at each QC level were analyzed on the same day, whereas for inter day, samples were assessed every day during three consecutive days. Peak area and % recovery of both analytes were noted. Then calculate %RSD with the acceptance criteria of not more than 2%. Moreover, calculate the RT, theoretical plates and tailing factors of both analytes.
2.3.7 Ruggedness
The ruggedness is defined as the ability to reproduce the testing result under various conditions, like different instruments and different analysts (n = 3). Ruggedness was determined by analyzing three different samples (LQC, MQC and HQC) by two analysts in the same and different laboratory having identical HPLC equipment with the same general specification and analytical column. The % recovery of both analytes was calculated, and the results obtained from two different HPLC and different analysts were compared with each other to examine the ruggedness of the method (Dejaegher and Heyden, 2007).
2.3.8 Sensitivity
The sensitivity of the analytical technique was estimated in terms of LOD and LOQ. LOD is the concentration which provides a signal-to-noise ratio of approx.3:1, while LOQ is the concentration which provides a signal-to-noise ratio of approx. 10:1 having %RSD (n = 3) of less than 10%. LOD and LOQ of both analytes were determined using the following formula.
A = kσ/S where A is LOD or LOQ value, σ is the standard deviation (SD) of the response (peak area), and S represents the slope obtained from the calibration curve. k for LOD = 3.3; for LOQ = 10.
2.3.9 Stability studies
Stability studies were conducted to assess the stability of mixture solution at all QC levels under different stability conditions i.e., freeze and thaw, short term and long-term stability. Three aliquots were processed for freeze and thaw stability for the 24 h at −20 °C and thawed at room temperature unassisted. QC samples were placed at room temperature for short-term stability and analyzed for 4 and 12 h. Long term stability studies were carried out for 2 weeks at −20 °C. Furthermore, the stability of standard solutions of both analyte was determined for 6 h at room temperature and 2 weeks at −20 °C. Experiments were done in triplicate and then analyzed by % recovery ± SD. This should be within the acceptable range.
2.4 Application of the simultaneous analytical method in nano-formulations
The developed and validated simultaneous analytical method was utilized for the quantification of TAM and SFN in various pharmaceutical nanoformulations such as SLNs, LIPO and NLCs. The amount of both drugs entrapped in the nanoformulation was analyzed by the developed method for estimation.
2.4.1 Preparation of TAM-SFN-SLNs
TAM-SFN-SLNs was developed by the method of melt emulsification ultrasonication where Compritol® ATO 888 was used as a solid lipid. For the preparation of TAM-SFN-SLNs, precisely weighed solid lipid was melted at a temperature 5–10 °C beyond its melting point. After that, accurately weighed quantity of TAM and SFN were added in the melted lipid. Subsequently, surfactant solution was prepared by adding the surfactants Poloxamer188, Tween 80 and Tween 20 in the ratio of 2:1:1 in milli-Q water and heated at the same temperature. Under constant stirring at 12,000 rpm for 30 min, the melted lipid was added to the heated aqueous surfactant solution to acquire a primary emulsion.
Further, the primary emulsion thus obtained was nano sized through probe sonicator using ultrasonication technique with an amplitude of 70%. The acquired dispersion was immediately cooled down at room temperature to obtain SLNs. After that, the resultant TAM-SFN-SLNs were subjected to ultracentrifugation for 20 min at 6000 g at 4 °C to remove unentrapped drug from the SLNs. The supernatant was discarded, whereas the pellet obtained after centrifugation was washed using milli-Q water and then evaluated for the percentage entrapment efficiency (Harivardhan Reddy et al., 2006).
2.4.2 Preparation of TAM-SFN-LIPO
Phospholipon 90G and cholesterol (70:30 M ratio) were used for the preparation of TAM-SFN-LIPO by a thin-film hydration method. Appropriately weighed the amount of lipid, cholesterol, TAM and SFN were dissolved in 5 mL of chloroform: methanol (2:1). Thereafter, the solvent was evaporated using a rotary evaporator (Buchi, Switzerland) in a round bottom flask (RBF) under decreased pressure to form a thin lipid film. Further, the vacuum was released and the RBF was kept in a vacuum desiccator for 12 h to remove the residual traces of organic solvent. Using 5 mL of milli-Q water the thin film of lipid was hydrated by rotating the RBF at 100 rpm for 45 min in water maintained above the transition temperature (Tm) of the lipid. The flask was rotated until the thin film was utterly hydrated and the liposome dispersion was obtained. The resulting liposome dispersion was ultrasonicated with a probe sonicator for 5–10 min and stored at 4 °C until further use. Then the liposomes were centrifuged at 20000g for 15 min 4 °C; the supernatant was separated and the pellet obtained was washed thrice using milli-Q water and evaluated it for drug encapsulation efficiency (Zhang, 2017).
2.4.3 Preparation of TAM-SFN-NLCs
TAM-SFN-NLCs were formulated by melt emulsification ultrasonication technique utilizing Precirol® ATO 5 and Transcutol HP as solid and liquid lipids respectively. Accurately, weighed solid lipid was heated 5–10 °C beyond its melting point and thereafter, liquid lipid was added to it to form an oily phase, to which the prerequisite amount of TAM and SFN was added. At the same time, an aqueous surfactant phase was developed by dispersing Tween 80 and Poloxamer 188 (1:1) in milli-Q water and heated at the same temperature. After that, this hot aqueous surfactant solution was poured dropwise to the above prepared oily phase with constant stirring for 30 min at 12,000 rpm using a magnetic stirrer. The primary emulsion thus obtained was ultrasonicated with a probe sonicator for 60 sec to obtain the dispersion, which was kept to cool down wherein the lipid recrystallizes to develop NLCs. TAM-SFN-NLCs thus obtained were ultracentrifuged at 6000 g for 20 min at 4 °C to remove the unentrapped drug. The supernatant was disposed of, whereas the pellet was rinsed using milli-Q water and evaluated the for percentage entrapment efficiency (Singh et al., 2019; Soni et al., 2020).
3 Result and discussion
3.1 Optimization and development
BBD was successfully applied for the optimization of experimental conditions and obtained the 3D graphs which show the effect of independent factors on dependent variables. All responses revealed significant differences in their values. The predicted and actual r2 value of all dependent variables is shown in Supplementary Table S3. The predicted value of r2 was a reasonable agreement with the adjusted r2 value. Moreover, the high value of adjusted r2 showed a good correlation between the experimental data and fitted model. The polynomial equation has been used for predicting the actual connection between the variables and responses. A positive value represents the influence that favors optimization, whereas a negative value suggests an inverse relationship amongst the factors. From equation (2), the two interaction terms were found to be negative i.e., AB and BC, whereas AC interaction showed a positive effect for response Y1. From equation (5), two interactions were found to be negative i.e., BC and AC, whereas one interaction was positive i.e., AB for response Y4. From the polynomial equation (3) and (6), response (Y2 and Y5) showed all three of interaction terms to be hostile with each other i.e., AB and BC and AC. For response Y3 and Y6, the two of interaction terms were found to be positive i.e., AB and AC, whereas the combined effect of BC showed the negative effect in equations (4) and (7).
In the 3D plots, the effect of the two factors was considered, whereas the third factor was kept constant. Figs. 1 & 2(A) showed the effect of independent variables on RT of both analytes (Y1 & Y4). Methanol composition showed a prominent effect and the pH of aqueous mobile phase showed a mixed effect on RT of both analyte whereas flow rate showed an irrelevant effect on RT. Figs. 1 & 2(C) showed the effect of independent variables on theoretical plates (Y3 & Y6). This result revealed that methanol composition and flow rate have an inappropriate effect on theoretical plates. Theoretical plates were slightly increased with an increase in methanol concentration and a decrease in flow rate. The theoretical plates increased with an increase in the pH of aqueous mobile phase and vice versa. It confirmed that pH showed a marked effect on TAM and SFN theoretical plates.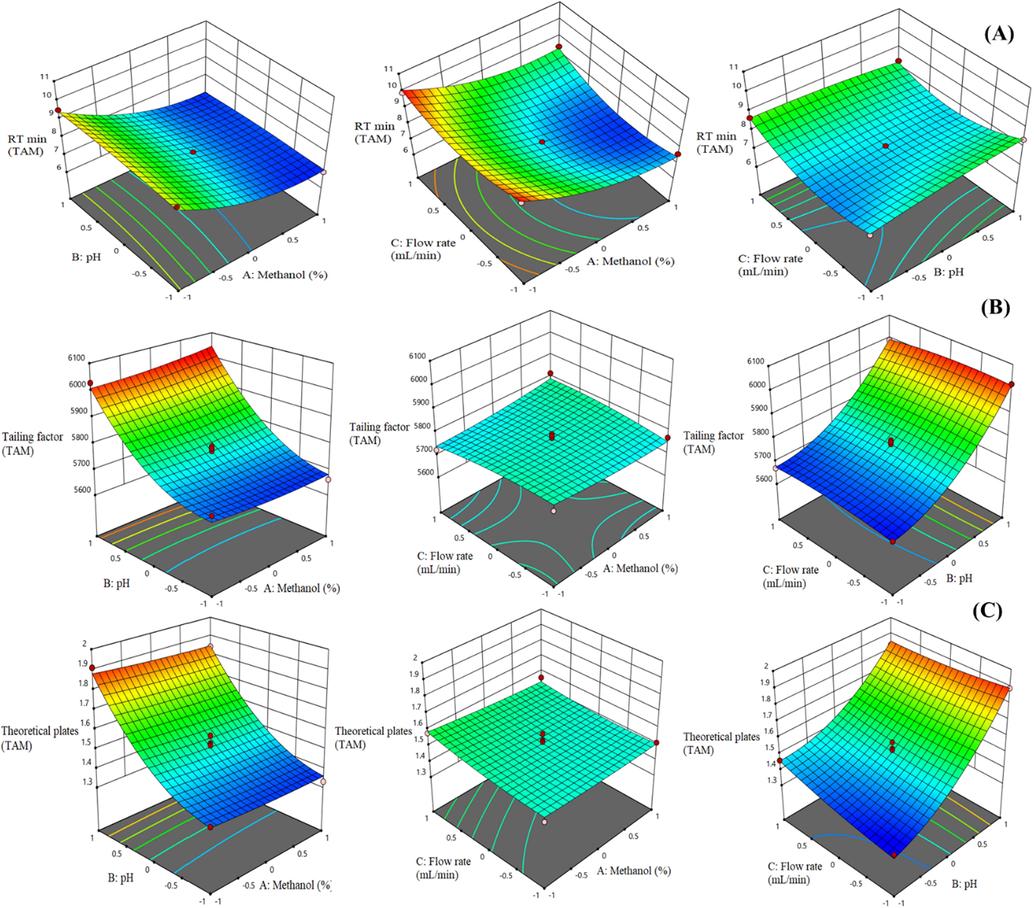
3D response surface plots displaying the influence of different process variables on (A) RT (B) Tailing factor and (C) Theoretical plates of TAM.
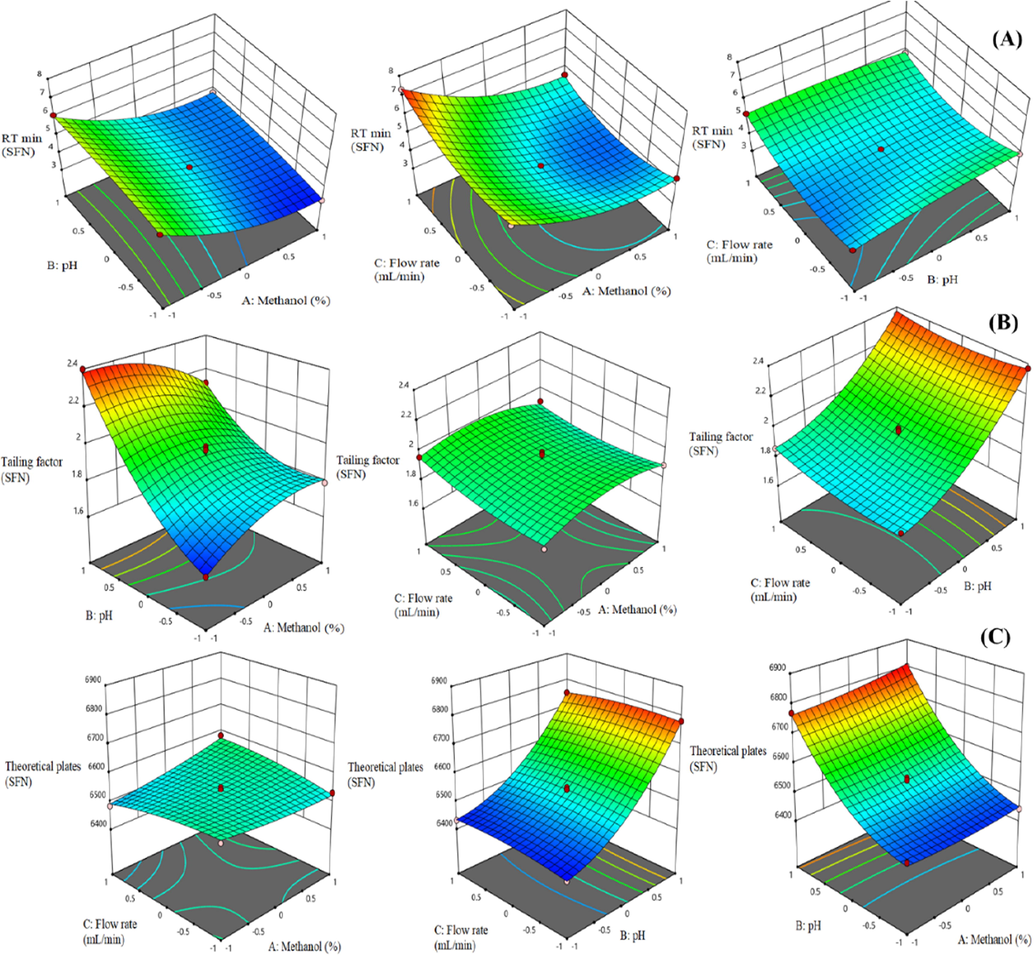
3D response surface plots displaying the influence of different process variables on (A) RT (B) Tailing factor and (C) Theoretical plates of SFN.
Figs. 1 & 2(B), 3D graphs showed the relationship between the independent variables on tailing factor (Y2 & Y5). These graphs showed that the tailing factor of both analytes increased with an increase in the pH of aqueous mobile phase and flow rate. In contrast, methanol concentration showed an insignificant effect on tailing factor. There is no interaction been found between methanol concentration and tailing factor.
Finally, design expert software suggested the optimized value of independent factors i.e., methanol concentration (70%), pH of aqueous mobile phase (3.5) and flow rate (0.8 mL/min) and all responses at these concentrations were found to be favorable.
3.2 Method validation
3.2.1 System suitability test
The %RSD of peak area, as well as RT of analytes, was calculated and found to be within 2%, indicating the suitability of the system as shown in Table 1A and 1B. The %RSD of tailing factor and number of theoretical plates of the column for the six replicate injections were found to be 1.52 ± 0.50% and 5716.50 ± 1.32% for TAM; 1.77 ± 0.43% and 6551.17 ± 1.08% for SFN, respectively. The number of theoretical plates was greater than 2000 and considered to be acceptable for the system suitability test. The %RSD of tailing factor was within the specified limits as per the guidelines. These results ensure that the proposed HPLC method was capable of providing data of acceptable quality.
System suitability parameters
RT
Peak area
Theoretical plates
Tailing factor
Rep-1
4.12
838,637
6490
1.77
Rep-2
4.13
841,456
6543
1.78
Rep-3
4.11
840,745
6645
1.78
Rep-5
4.14
835,647
6572
1.77
Rep-5
4.16
841,156
6455
1.77
Rep-6
4.10
850,791
6602
1.76
Mean
4.13
841405.33
6551.17
1.77
S.D.
0.02
5087.51
70.54
0.01
R.S.D.
0.52
0.60
1.08
0.43
System suitability parameters
RT
Peak area
Theoretical plates
Tailing factor
Rep-1
7.59
619,123
5697
1.52
Rep-2
7.60
623,242
5680
1.53
Rep-3
7.58
620,131
5782
1.53
Rep-5
7.61
618,133
5759
1.52
Rep-5
7.63
629,642
5592
1.52
Rep-6
7.57
619,277
5789
1.51
Mean
7.60
621591.33
5716.50
1.52
S.D.
0.02
4314.61
75.59
0.01
R.S.D.
0.28
0.69
1.32
0.50
3.2.2 Specificity
Specificity was determined by comparing the chromatograms of the same target concentration of a blank solution, a standard solution of TAM and SFN and their mixture solution. For this purpose, 20 µL of the samples were separately injected in HPLC system and RT of TAM and SFN was recorded at 4.13 ± 0.034 min and 7.6 ± 0.073 min, respectively as shown in Figs. 3 and 4. The findings revealed that RT of analytes in the mixture solution did not change to their individual solution. Moreover, no co-eluting peaks of interference were found. This indicates the specificity of the HPLC method developed.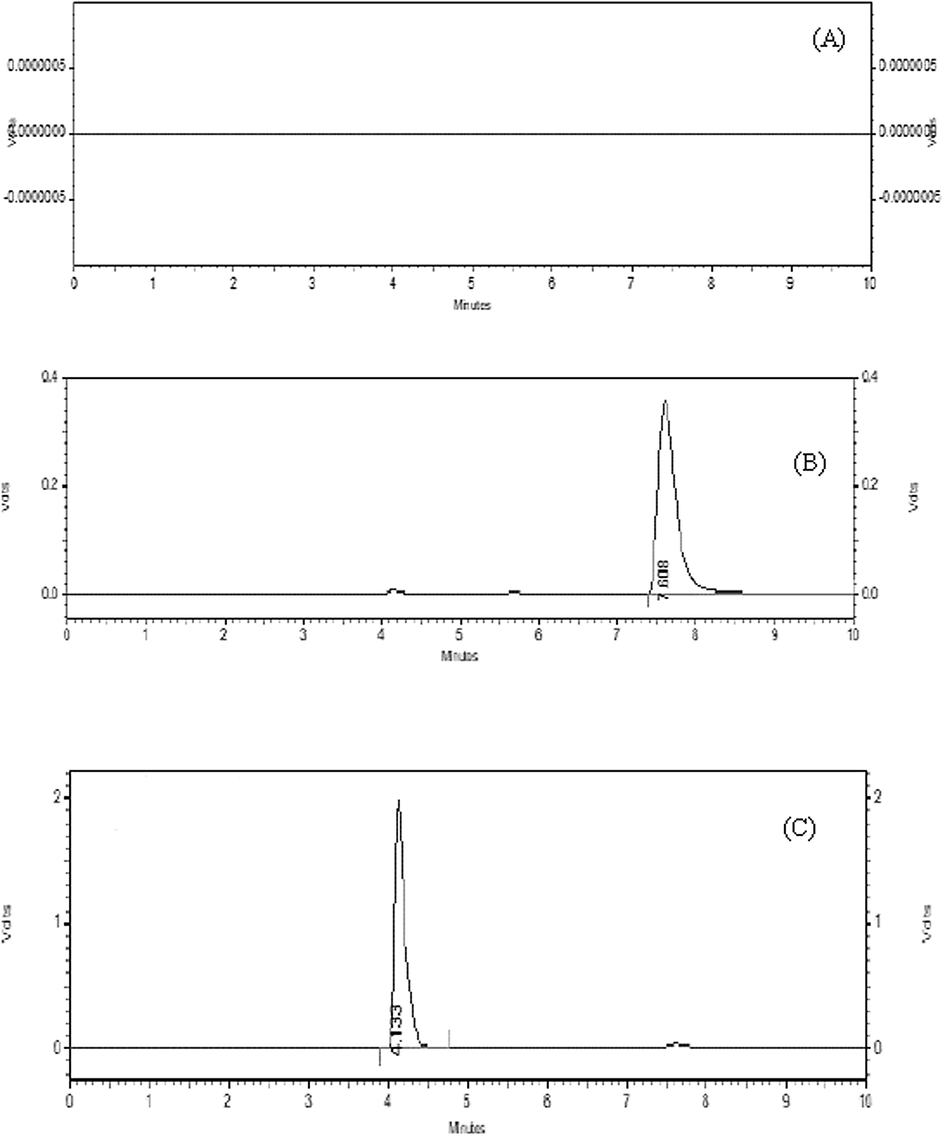
Chromatogram of blank solution (A), TAM (B) and SFN (C).
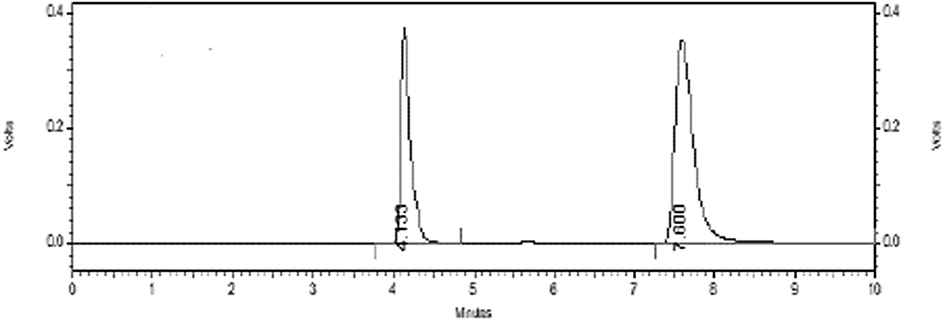
Chromatogram of TAM and SFN at their respective wavelength.
3.2.3 Linearity
Linearity was described in terms of calibration curve. This curve was obtained by plotting the mean peak area of TAM and SFN against their corresponding concentrations. The results (Fig. S2) provide a linear relationship over the concentration range of 6–24 µg/mL for both analytes. From the regression data, a linear equation and r2 of TAM and SFN were found to be y = 44275x −32825; 0.9972 and y = 58306x−37166; 0.998. These results indicated a linear relationship between the mean peak area and concentration of the analyte. The response factor of the analytes are shown in Fig. S3.
3.2.4 Robustness
The robustness of the analytical process was evaluated by assessing the effect of small variations in HPLC conditions i.e., change in column oven temperature, detection wavelength of both analysts, and injection volume (15–25 µL). The results are summarized in Table S4 (A) & (B) and found that a minor change in method condition did not significantly affect the tailing factor, theoretical plates and RT of analyte. Thus the proposed method is reliable and robust.
3.2.5 Accuracy
The accuracy expresses in terms of % recovery means the proximity to the actual value. The % recovery at all three QC levels ranged from 97.07–103.0% and 99.65–101.0% for TAM and SFN, respectively, as summarized in Table 2. These results were found to be within the accepted limits, which demonstrated the applicability of the developed method for routine drug analysis. The excellent recovery values for accuracy study ascertain that method is accurate.
Spiked concen-tration (μg/mL)
Recovered concentration (μg/ml)
% Concentration found
Mean % Recovery
SD
%RSD
Standard error
Rep-1
Rep-2
Rep-3
Rep-1
Rep-2
Rep-3
SFN
10
10.23
10.12
9.95
102.30
101.20
99.50
101.00
1.41
1.40
0.81
15
15.14
15.26
14.99
100.93
101.73
99.93
100.87
0.90
0.89
0.52
20
19.86
19.98
19.95
99.30
99.90
99.75
99.65
0.31
0.31
0.18
TAM
10
10.34
10.06
10.28
103.40
100.60
102.80
102.27
1.47
1.44
0.85
15
15.51
15.25
15.59
103.40
101.67
103.93
103.00
1.19
1.15
0.68
20
19.67
19.23
19.34
98.35
96.15
96.70
97.07
1.14
1.18
0.66
3.2.6 Precision
The %RSD of peak area for inter-day precision and intra-day precision at all QC levels was found to be in the range of 0.33–1.05 and 0.19–0.65 for TAM, whereas 0.22–0.34 and 0.03–0.72 for SFN, respectively. The %RSD of % recovery for inter-day precision and intra-day precision at all QC levels was found to be in the range of 0.65–1.33 and 1.28–1.80 for TAM, whereas 0.64–1.72 and 0.45–1.33 for SFN respectively. The developed method indicates good precision as well as reproducible with %RSD found to be less than 2% as listed in Table S5 (A, B, C & D). This signifies the repeatability and reliability of the method.
3.2.7 Ruggedness
Ruggedness studies carried out in two different HPLC instruments with two different analysts and exhibited a negligible change in the mean % recovery values for the LQC, MQC and HQC of both analytes. The results are shown in Table S6 (A and B), indicating a high degree of the ruggedness of proposed method.
3.2.8 Sensitivity
The signal-to-noise ratio of 3:1 and 10:1 was obtained for the LOD and LOQ, respectively. The LOD and LOQ were found to be 0.5 μg/mL and 0.9 μg/mL for TAM and 0.44 μg/mL and 1.1 μg/mL for SFN respectively. The results have shown that the method is highly sensitive to the methods previously reported.
3.2.9 Stability studies
Stability study of the analyte was evaluated under different storage conditions at QC levels (10 μg/mL, 15 μg/mL and 20 μg/mL). The accuracy of the predicted concentration obtained after three freeze–thaw cycles, short-term storage at room temperature and long-term storage at −20 °C for 2 weeks was in the range 90–101.4% for TAM and 87.4–100.2% for SFN, as shown in Table 3. These results indicate that both drugs did not degrade during the different storage conditions except the SFN that was less stable at 12 h at room temperature as compared to TAM. This implies that QC samples were only stable up to 4 h. Also, TAM and SFN standard solutions were observed to be stable for at least 6 h at room temperature and 2 weeks at −20 °C.
Level
Freeze thaw cycle
Short term
Long term (-20℃ for 2 weeks)
Standard solution stability
4 h
12 h
Room temperature (6 h)
−20℃ for 2 weeks
TAM
100.1 ± 2.8
100.3 ± 3.6
LQC
98.4 ± 2.8
99.5 ± 3.3
90.4 ± 2.8
99.5 ± 3.7
MQC
99.7 ± 3.2
99.2 ± 4.5
93.5 ± 4.1
101.4 ± 2.2
HQC
98.3 ± 4.3
100.3 ± 1.3
94.7 ± 3.3
99.5 ± 3.3
SFN
94.5 ± 2.1
99.6 ± 3.2
LQC
98.6 ± 3.3
98.4 ± 2.1
89.4 ± 4.2
100.21 ± 3.7
MQC
95.43 ± 2.4
99.8 ± 2.6
88.6 ± 5.4
99.54 ± 2.6
HQC
97.5 ± 21.4
98.4 ± 3.3
87.4 ± 2.4
97.68 ± 5.5
3.3 Application of the analytical method in pharmaceutical formulations
The SLNs, NLCs, LIPO comprising TAM and SFN were prepared successfully and the proposed analytical method was implemented to determine the entrapment efficiency (%) of both analyte in SLNs, NLCs, LIPO. The entrapment efficiency of TAM and SFN was found to be 75.7% and 74.9% in NLCs, 72.3% and 70.6% in SLNs, 68.2% and 66.4% in LIPO. These results revealed that both drugs were entrapped in all prepared nanoformulations. NLCs have high entrapment efficiency as compared to other formulations i.e., SLNs and LIPO. NLCs have an imperfect crystal structure, thus protect the drug from expulsion by avoiding lipid crystallization during storage and manufacturing. From prepared nanoformulations, LIPO has low entrapment efficiency in comparison with NLCs and SLNs. Because of its complex manufacturing processes, Non-PEGylated formation of LIPO and the use of organic solvents instead of lipids. Drug entrapment in SLNs was lower as compared to the NLCs and its entrapment efficiency was found to be high as compared to LIPO. SLNs contain only solid lipid and expulsion of a drug may take place due to perfect crystalline lattice formation. Moreover, the Nanoformulations results did not reveal any significant change in the drug's RT and no extra peaks of the excipients were observed. This absence of unwanted peaks and no change in RT assured its high specificity and selectivity for the intent.
4 Conclusions
The present work proposes a novel method in bulk drug and nanoformulations for the simultaneous estimation of two anticancer drugs i.e., TAM and SFN. The use of the mixture experimental design facilitated significant improvements in the robustness and performance of the method by developing the ideal mobile phase composition for efficient separation of two analytes. Here we successfully developed a stable and cost-effective simultaneous method on their particular wavelength in the HPLC-PDA instrument. The results obtained indicated that the use of a mixture design approach is an inexpensive and versatile method that can reduce the number of experiments and can be used to produce as much information as possible in less time. The simultaneous method developed was found to be quick, easy, highly sensitive, reliable and effective as validated per ICH guidelines. Moreover, the developed method showed a high degree of practical use in pharmaceutical nano-formulations i.e. NLCs, SLNs and LIPO for simultaneous measurement of TAM and SFN. Finally, it concluded that the proposed simultaneous RP‐HPLC approach could be applied for the pharmacokinetic and bioequivalent study of TAM and SFN. This new combination will prove to be the best combination on the market for the treatment of breast cancer.
Acknowledgement
The authors would like to acknowledge Department of Science and Technology, New Delhi, India for providing her financial assistance in the form of senior research fellowship with Project No: (DST/INSPIRE/03/2016/001153) to Bharti Mangla.
Declaration of Competing Interest
The authors declare that they have no known competing financial interests or personal relationships that could have appeared to influence the work reported in this paper.
References
- Development and validation of a LC–MS/MS method to determine sulforaphane in honey. Food Chem.. 2015;181:263-269.
- [CrossRef] [Google Scholar]
- Integrated Analytical Quality by Design (AQbD) Approach for the Development and Validation of Bioanalytical Liquid Chromatography Method for Estimation of Valsartan. J. Chromatogr. Sci.. 2020;58(7):606-621.
- [Google Scholar]
- Development and Validation of RP-HPLC method for quantitation of amoxicillin trihydrate in bulk and pharmaceutical formulations using Box-Behnken experimental design. J. Liq. Chromatogr. Relat. Technol.. 2012;35:393-406.
- [CrossRef] [Google Scholar]
- QbD-oriented development and validation of a bioanalytical method for nevirapine with enhanced liquid-liquid extraction and chromatographic separation. Biomed. Chromatogr.. 2016;30:818-828.
- [Google Scholar]
- QbD-driven development and validation of an efficient bioanalytical UPLC method for estimation of olmesartan medoxomil. J. Liq. Chromatogr. Relat. Technol.. 2016;39:587-597.
- [CrossRef] [Google Scholar]
- Applications of Monte-Carlo simulation and chemometric techniques for development of bioanalytical liquid chromatography method for estimation of rosuvastatin calcium. J. Liq. Chromatogr. Relat. Technol.. 2017;40:907-920.
- [Google Scholar]
- Development and validation of a stability indicating liquid chromatographic method for estimating olmesartan medoxomil using Quality by Design. J. Chromatograph. Sci.. 2015;53:1048-1059.
- [CrossRef] [Google Scholar]
- Pharmaceutical QbD: Omnipresence in the product development lifecycle. Eur. Pharm. Rev.. 2017;22:58-64.
- [Google Scholar]
- Quality by Design (QbD) in analytical sciences: an overview. The Pharma Times.. 2014;46:71-75.
- [Google Scholar]
- Gas chromatography/mass spectrometry method for the determination of sulforaphane and sulforaphane nitrile in broccoli. J. Agric. Food Chem.. 1998;46:1018-1021.
- [Google Scholar]
- Validation and application of Vierordt's spectrophotometric method for simultaneous estimation of tamoxifen/coenzyme Q10 in their binary mixture and pharmaceutical dosage forms. Asian J. Pharm. Sci.. 2016;11:318-325.
- [CrossRef] [Google Scholar]
- Application of chemometric approach for development and validation of high performance liquid chromatography method for estimation of ropinirole hydrochloride. J. Sep. Sci.. 2019;42:3293-3301.
- [CrossRef] [Google Scholar]
- Development and validation of simple RP-HPLC-PDA analytical protocol for zileuton assisted with Design of Experiments for robustness determination. Arabian J. Chem.. 2017;10:273-282.
- [CrossRef] [Google Scholar]
- Tamoxifen Citrate Loaded Solid Lipid Nanoparticles (SLNTM): preparation, characterization, in vitro drug release, and pharmacokinetic evaluation. Pharm. Dev. Technol.. 2006;11:167-177.
- [CrossRef] [Google Scholar]
- New insights into the metabolism of tamoxifen and its role in the treatment and prevention of breast cancer. Steroids. 2007;72:829-842.
- [CrossRef] [Google Scholar]
- High resolution mass spectrometry studies of sulforaphane and indole-3-carbinol in broccoli. Food Chem.. 2017;237:566-573.
- [CrossRef] [Google Scholar]
- Toxic hepatitis associated with tamoxifen use. A case report and literature review. Gastroenterol. Hepatol.. 2002;25:247-250.
- [CrossRef] [Google Scholar]
- Development and validation of a high throughput bioanalytical UPLC-MS/MS method for simultaneous determination of tamoxifen and sulphoraphane in rat plasma: Application to an oral pharmacokinetic study. J. Chromatogr. B. 2020;1152:122260.
- [CrossRef] [Google Scholar]
- Tamoxifen and Sulphoraphane for the breast cancer management: A synergistic nanomedicine approach. Med. Hypotheses. 2019;132:109379.
- [CrossRef] [Google Scholar]
- Validation of forced degradation and stability indicating studies of Tamoxifen in nanoformulation using spectroscopic technique. Mater. Today Proc.. 2020;26:3265-3270.
- [CrossRef] [Google Scholar]
- Evaporative light-scattering analysis of sulforaphane in broccoli samples: Quality of broccoli products regarding sulforaphane contents. J. Agric. Food Chem.. 2006;54:2479-2483.
- [CrossRef] [Google Scholar]
- Analytical lifecycle management approach: Application to development of a reliable LC method for estimation of lacidipine. Sep Sci plus. 2019;2:18-25.
- [Google Scholar]
- Quantification of tamoxifen in pharmaceutical formulations using micellar liquid chromatography. Anal. Sci.. 2014;30:925-930.
- [CrossRef] [Google Scholar]
- Sulforaphane induces cell type-specific apoptosis in human breast cancer cell lines. Mol. Cancer Ther.. 2007;6:1013-1021.
- [Google Scholar]
- Simultaneous TLC-densitometric determination of tamoxifen citrate and medroxyprogesterone acetate and UV-degradation kinetic study of medroxyprogesterone acetate. Biomed. Chromatogr.. 2018;32:e4366.
- [CrossRef] [Google Scholar]
- QbD-driven development and validation of a HPLC method for estimation of tamoxifen citrate with improved performance. J. Chromatogr. Sci.. 2016;54:1373-1384.
- [Google Scholar]
- Long chain lipid based tamoxifen NLC. Part I: Preformulation studies, formulation development and physicochemical characterization. Int. J. Pharm.. 2013;454:573-583.
- [CrossRef] [Google Scholar]
- Tamoxifen nanostructured lipid carriers : Enhanced in vivo antitumor ef fi cacy with reduced adverse drug effects. Elsevier B.V.. 2014;468:1-14.
- [CrossRef] [Google Scholar]
- Nanostructured Lipid Carriers for oral bioavailability enhancement of Exemestane: Formulation design, in vitro, ex vivo and in vivo studies. J. Pharm. Sci.. 2019;108:3382-3395.
- [CrossRef] [Google Scholar]
- Attaining product development excellence and federal compliance employing Quality by Design (QbD) paradigms. Pharma Rev.. 2015;13:35-44.
- [Google Scholar]
- Quality by Design (QbD) paradigms for robust analytical method development. Pharma Rev.. 2016;14:61-66.
- [Google Scholar]
- Developing “Optimized” drug products employing “Designed” experiments. Chem. Ind. Digest.. 2013;23:70-76.
- [Google Scholar]
- Nanostructured Lipid Carriers potentiated oral delivery of Raloxifene for breast cancer treatment. Nanotechnology 2020
- [CrossRef] [Google Scholar]
- The Silencing Mediator of Retinoid and Thyroid Hormone Receptors (SMRT) regulates adipose tissue accumulation and adipocyte insulin sensitivity in vivo. J. Biol. Chem.. 2010;285:18485-18495.
- [CrossRef] [Google Scholar]
- Thin-film hydration followed by extrusion method for liposome preparation. Methods Mol. Biol.. 2017;1522:17-22.
- [CrossRef] [Google Scholar]
Appendix A
Supplementary material
Supplementary data to this article can be found online at https://doi.org/10.1016/j.arabjc.2020.09.022.
Appendix A
Supplementary material
The following are the Supplementary data to this article:Supplementary data 1
Supplementary data 1


