

Translate this page into:
Systematic screening and characterization of cardamonin metabolites using UHPLC-Q-Exactive Orbitrap MS after oral administration to rats
⁎Corresponding authors. myweixia@126.com (Xia Wei), zhangjiayu0615@163.com (Jiayu Zhang)
-
Received: ,
Accepted: ,
This article was originally published by Elsevier and was migrated to Scientific Scholar after the change of Publisher.
Peer review under responsibility of King Saud University.
Abstract
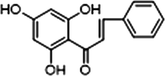
Cardamonin is a chalcone that presents at high content in the seeds of Alpinia katsumadai Hayata. In recent decades, researchers have found that it is not only an edible spice, but also a remarkable herb with a wide range of pharmacological properties. However, its specific metabolic routes in vivo remain unclear while these metabolites may accumulate to exert pharmacological effects. Our study aimed to clarify the metabolic pathways of cardamonin after oral administration to rats. Here, an advanced UHPLC-Q-Exactive Orbitrap MS analytical technique was applied for efficient detection of metabolites in vivo, which especially showed benefits in obtainment of the fragment ions with relatively lower contents. We also established a novel strategy to identify metabolites based on typical fragmentation routes. The results indicated that a total of 40 metabolites could be categorized into 3 types with consideration of the particular structures and characteristic fragment ions. Then, diagnostic product ions (DPIs) of each type were summarized for further screening and identification of metabolites derived from cardamonin. Finally, methylation, demethylation, hydrogenation, hydroxylation, dehydroxylation, glucuronidation and sulfation were confirmed to be the major metabolic pathways in vivo. Our observation extended the metabolic mechanism of cardamonin and could be of great benefits to interpreting the action mechanism of cardamonin in vivo.
Keywords
Cardamonin
Chalcone
Alpinia katsumadai Hayata
Metabolism
In vivo
UHPLC-Q-Exactive Orbitrap MS

1 Introduction
The seeds of Alpinia katsumadai Hayata, also known as Semen Alpiniae Katsumadai, has long been regarded as a famous medical and edible spice for removing bad smell and increasing appetite in Asian and Arabian countries. Due to the aromatic and spicy-hot flavor, people usually add the unique ingredient when roasting meats, making soup or cooking other dishes, either alone or in combination with other spices. It was originally recorded in Supplementary Records of Famous Physicians, a great work of history of pharmacy in China since the late Han dynasty. From the viewpoint of traditional Chinese medicine, it is not only a spice to braise meats, but also a remarkable medicine for improving physical functions, such as protecting gastric mucosa, resisting gastric ulcers and reducing vomiting. Since the 20th century, hundreds of chemical components have been isolated and identified from Semen Alpiniae Katsumadai, including flavonoids, diphenylheptanes, volatile oil and trace elements, and considerable clinical evidences have proved its marvelous effects mentioned above, which make it much more clinically relevant (Hatziieremia et al., 2006; Masanori et al., 1983).
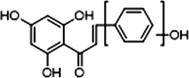
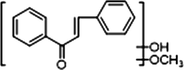
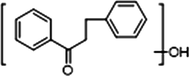
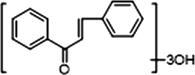
Cardamonin, an important member of chalcone family existing in nature, has been found in Semen Alpiniae Katsumadai at high content. The particular bioactive compound is well-known for possessing miscellaneous pharmacological activities, including anti-inflammation (Lee et al., 2012; Chow et al., 2012), anti-tumor (Qin et al., 2012; Yadav et al., 2012), anti-oxidation (Li et al., 2008), hypoglycemic activities (Yamamoto et al., 2011) and vasorelaxant effects (Huang et al., 2000). The researchers even found it to be a potential whitening agent (Cho et al., 2009). However, most of the previous researches have focused on the bioactivities of cardamonin in vitro without considering the metabolic process and interactions with gut microbiota in vivo (see Fig. 1).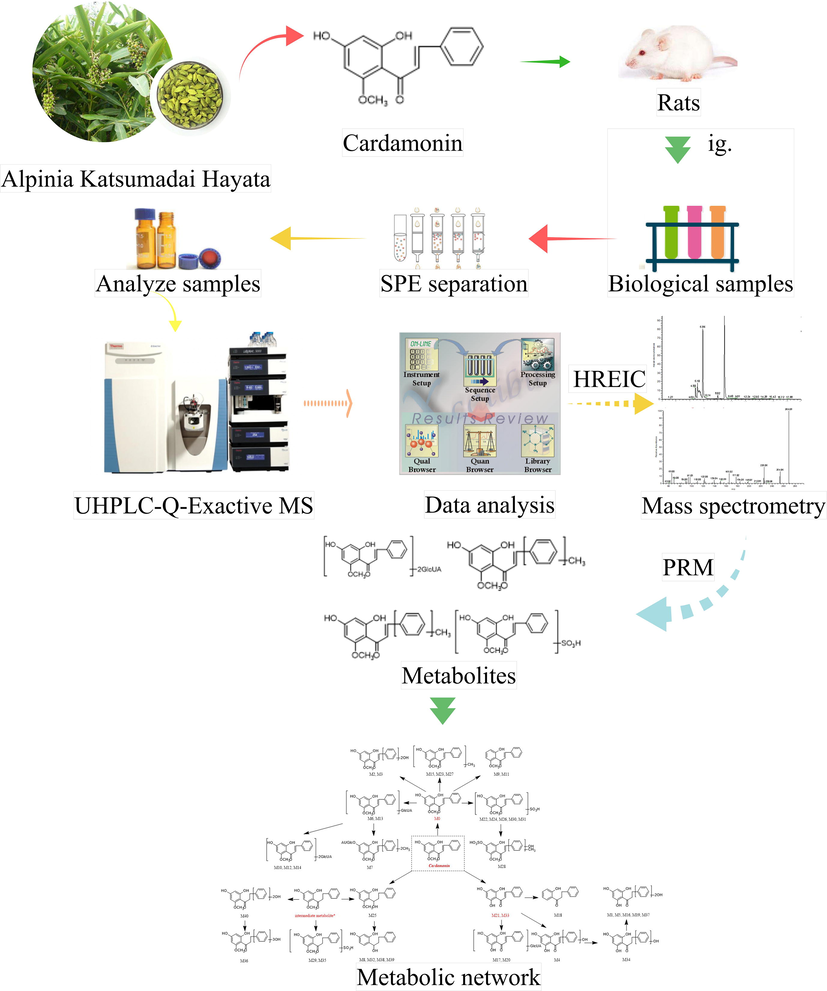
Summary diagram of the developed strategy and methodology.
Metabolism is so important that it may alter the stability of drug and render it pharmacological active, inactive or toxic. After oral administration, drugs interact reciprocally with gut microbiota or relevant enzymes (Wang et al., 2012), which strikes out the fact that prototypes may not be the major circulating compounds to show the effects. For example, numerous studies have revealed that flavonoids, including chalcones, dominantly underwent phase II reactions (glucuronidation and sulfation, particularly) after oral dosing (Das, 1971). However, few studies have systematically investigated the metabolic mechanism of cardamonin in vivo until now (see Table 1).
Peak
tR/min
Ion mode
Formula [M−H]-/[M + H]
Theoretical Mass m/z
Experimental Mass m/z
Error (ppm)
MS2 fragment ions
Identification/Reactions
M0
8.99
N
C16H13O4
269.08193
269.08185
3.771
MS2[269]:269(100), 226(22), 254(16), 149(14), 165(14), 253(10), 177(9), 103(8), 119(8), 225(7), 122(7), 131(6), 139(5), 121(4), 227(4), 150(4), 113(3)
cardamonin
8.98
P
C16H15O4
271.09649
271.09601
−1.754
MS2[271]:167(100), 271(10), 152(7), 124(4)
M1
2.80
N
C15H13O6
289.07168
289.07285
4.560
MS2[289]:147(100),175(88),131(77),159(40),103(34),119(25),115(6),105(3)
demethylation, hydrogenation, dihydroxylation
M2
4.27
N
C16H13O6
301.07173
301.07184
3.904
MS2[301]:301(100),283(31),141(21), 221(10),239(8),265(7),107(6),209(6)
dihydroxylation
M3
4.43
N
C16H13O6
301.07173
301.07141
2.476
MS2[301]:301(100),283(33), 221(12), 239(7),265(6),209(5),123(3), 141(1)
dihydroxylation
M4
4.62
p
C15H13O5
273.07569
273.07550
−0.915
MS2[2 7 3]:273(1 0 0),209(19),153(5),135(3),131(2),103(1)
demethylation, hydroxylation
M5
4.68
N
C15H13O6
289.07168
289.07217
4.208
MS2[2 8 9]:147(1 0 0),131(93),175(83),159(38),103(26),119(25),115(6)
demethylation, hydrogenation, dihydroxylation
M6
4.80
N
C22H21O10
445.11403
445.11398
2.374
MS2[4 4 5]:269(1 0 0),113(49),165(19),227(13),175(12),254(12),150(9),121(5)
glicuronidation
4.83
P
C22H23O10
447.12895
447.12778
−1.774
MS2[4 4 7]:167(1 0 0),271(36),131(7),103(4),152(2),229(1),124(1)
M7
4.85
N
C24H25O10
473.14642
473.14517
2.001
MS2[4 7 3]:113(1 0 0),297(67),473(64),107(52),175(32),121(28),119(23),253(23)
dimethylation, glucuronidation
M8
4.86
N
C15H15O3
243.10273
243.10243
3.534
MS2[2 4 3]:183(1 0 0),243(74),147(70),181(46),142(27),225(16)119(6),199(5)
dihydrogenation, demethylation, dehydroxylation
M9
4.91
P
C16H15O3
255.10159
255.10115
−1.650
MS2[2 5 5]:255(1 0 0),115(98),105(44),117(34),177(31),223(20),129(16),239(10)
dehydroxylation
M10
4.95
N
C28H29O16
621.14613
621.14624
1.978
MS2[6 2 1]:269(1 0 0),445(41),113(37),226(11),139(8),254(8),241(6),103(5),165(5),253(5)
diglucuronidation
M11
5.02
P
C16H15O3
255.10159
255.10117
−1.571
MS2[2 5 5]:255(1 0 0),199(29),137(21),227(11),237(5),129(4),119(4),145(3),115(2),133(2)
dehydroxylation
M12
5.03
N
C28H29O16
621.14613
621.14636
2.172
MS2[6 2 1]:269(1 0 0),445(41),113(40),226(10),254(9),139(8),241(7),103(5),117(5),165(5)
diglucuronidation
M13
5.08
P
C22H23O10
447.12859
447.12796
1.372
MS2[4 4 7]:167(1 0 0),271(22),131(7),103(5),152(2),124(1)
glucuronidation
5.10
N
C22H21O10
445.11403
445.11398
2.374
MS2[4 4 5]:269(1 0 0),113(25),226(10),139(9),253(7),241(7),254(7)
M14
5.13
N
C28H29O16
621.14613
621.14612
1.785
MS2[6 2 1]:269(1 0 0),445(39),113(38),226(10),139(8),254(7),241(6),253(5),165(4)
diglucuronidation
M15
5.13
P
C17H17O4
285.11269
285.11209
−0.160
MS2[2 8 5]:285(1 0 0),270(39),242(25),229(9),167(7),119(4),213(3)
methylation
M16
5.24
N
C15H13O6
289.07168
289.07245
4.176
MS2[2 8 9]:147(1 0 0),175(63),131(59),119(28),103(22),115(6),161(6)
demethylation, hydrogenation, dihydroxylation
M17
5.40
P
C21H21O10
433.11287
433.11273
−0.446
MS2[4 3 3]:153(1 0 0),257(83),131(50),103(19),151(3),123(1)
demethylation, glucuronidation
5.41
N
C21H19O10
431.09832
431.09839
2.591
MS2[4 3 1]:255(1 0 0),113(32),431(25),213(10),175(9),151(9),107(7)
M18
5.46
N
C15H13O2
225.09218
225.09175
3.304
MS2[2 2 5]:225(1 0 0),207(61),181(45),163(25),224(12),135(3),197(2)
demethylation, hydrogenation, didehydroxylation
M19
5.48
N
C15H13O6
289.07168
289.07208
4.896
MS2[2 8 9]:147(1 0 0),175(96),131(85),159(43),103(27),119(21),115(9)
demethylation, hydrogenation, dihydroxylation
M20
5.53
N
C21H19O10
431.09832
431.09836
2.521
MS2[4 3 1]:255(1 0 0),113(27),151(9),214(8),107(6),103(3),
demethylation, glucuronidation
M21
5.90
P
C15H13O4
257.08079
257.08023
−2.355
MS2[2 5 7]:131(1 0 0),189(57),159(45),257(32),175(16),187(16),229(10),103(10),115(6)
demethylation
M22
5.96
N
C16H13O7S
349.03873
349.03870
3.009
MS2[3 4 9]:269(1 0 0),165(15),349(14),254(9),227(9),150(5),121(3),226(2)
sulfation
M23
6.00
P
C17H17O4
285.11269
285.11105
−3.807
MS2[2 8 5]:107(1 0 0),224(76),121(68),105(58),119(45),131(37),159(36)147(31),225(26)
methylation
M24
6.10
N
C16H13O7S
349.03873
349.03857
2.636
MS2[3 4 9]:269(1 0 0),349(16),165(13),254(9),227(7),150(4),121(3),226(3)
sulfation
M25
6.10
P
C16H19O4
275.12724
275.12692
−3.146
MS2[2 7 5]:189(1 0 0),257(69),159(63),187(32),229(22),215(12),161(6),133(5)
dihydrogenation
M26
6.19
N
C16H13O7S
349.03873
349.03867
2.923
MS2[3 4 9]:269(1 0 0),165(13),227(11),254(9),150(6),121(4),226(3),253(3)
sulfation
M27
6.26
P
C17H17O4
285.11269
285.11148
−2.299
MS2[2 8 5]:224(1 0 0),107(57),105(48),181(38),121(31),159(27),225(27),131(27),119(25)
methylation
M28
6.29
N
C17H15O8S
379.04925
379.04916
2.494
MS2[3 7 9]:379(1 0 0),163(17),243(8),299(4),103(3),119(2),165(1)
hydroxylation, methylation, sulfation
M29
6.59
N
C16H15O7S
351.05445
351.05463
3.789
MS2[3 5 1]:271(1 0 0),106(59),115(41),217(30),315(13),149(5),119(4)
hydrogenation, sulfation
M30
6.59
N
C16H13O7S
349.03873
349.03922
4.498
MS2[3 4 9]:113(1 0 0),269(69),331(66),235(33),149(13),227(11)
sulfation
M31
6.74
N
C16H13O7S
349.03873
349.03879
3.266
MS2[3 4 9]:113(1 0 0),331(64),269(24),189(23),235(20),121(9)
sulfation
M32
7.04
N
C15H15O3
243.10273
243.10307
4.167
MS2[2 4 3]:243(1 0 0),225(66),181(57),147(9),175(6),119(3)
dihydrogenation, demethylation, dehydroxylation
M33
7.46
N
C15H11O4
255.06623
255.06651
3,782
MS2[2 5 5]:255(1 0 0),151(15),212(12),107(12),145(9),211(4)
demethylation
7.46
P
C15H13O4
257.08079
257.08032
−2.005
MS2[2 5 7]:153(1 0 0),131(44),257(35),103(31),151(3)
M34
8.56
N
C15H13O5
273.07688
273.07846
4.924
MS2[2 7 3]:131(1 0 0),159(69),103(30),115(12),245(3),217(3),143(2)
demethylation, hydrogenation, hydroxylatio
M35
9.16
N
C16H15O7S
351.05445
351.05429
2.200
MS2[3 5 1]:145(1 0 0),155(97),351(45),271(39),315(10),121(10),243(10)
hydrogenation, sulfation
M36
12.49
N
C16H15O7
319.08225
319.07932
−4.984
MS2[3 1 9]:165(1 0 0),319(52),149(11),301(7),275(3),147(1),151(1),141(1),291(1),121(1)
trihydroxylation, hydrogenation
M37
13.19
N
C15H13O6
289.07168
289.07034
−1.123
MS2[2 8 9]:147(1 0 0),175(96),131(90),103(32),119(26),115(8)
demethylation, hydrogenation, dihydroxylation
M38
13.64
N
C15H15O3
243.10273
243.10271
4.686
MS2[2 4 3]:147(1 0 0),175(69),119(37),197(3),113(2)
dihydrogenation, demethylation, dehydroxylation
M39
15.22
N
C15H15O3
243.10273
243.10207
2.053
MS2[2 4 3]:147(1 0 0),175(81),119(37),147(5),243(3),262(3),149(3)
dihydrogenation, demethylation, dehydroxylation
M40
16.64
P
C16H17O6
305.10189
305.10327
4.278
MS2[3 0 5]:305(1 0 0),305(59),107(55),121(55),135(16),131(15)
dihydroxylation, hydrogenation
The deep profile of drug metabolites in vivo requires the application of ultrahigh performance liquid chromatography coupled with high-resolution mass spectrometry (UHPLC-HRMS), which offers high resolving power, mass accuracy and sensitivity resulting in reliable structural identification. Besides, full-scan MS approaches offer the possibility of performing a sensitive and simultaneous analysis of a theoretically unlimited number of analytes. Recently, UHPLC-Q-Exactive Orbitrap MS have been used for improving the efficiency of metabolite identifications, which will be a powerful tool for characterization and identification of metabolites in vivo, even those at low concentrations. The present study was designed to clarify the metabolic fate of cardamonin after oral administration to rats. Based on UHPLC-HRMS, we established parallel reaction monitoring (PRM) strategy coupled with diagnostic product ions (DPIs) and neutral loss fragments (NLFs) for characterization of cardamonin metabolites in rat plasma, urine and faeces. Our results will be helpful to understand the metabolic properties of cardamonin in vivo and potential activities for human health and diseases (see Table 2)). +: Detected −: Undetected.
Compound
Ring A
Ring B
Ring A and B
Identification/Reactions
P
U
F
M0
2 × OH
1 × OCH3
−
+
+
M1
3 × OH
2 × OH
−
−
+
M2
2 × OH
1 × OCH3
2 × OH

−
−
+
M3
2 × OH
1 × OCH3
2 × OH
−
−
+
M4
3 × OH
1 × OH
+
−
−
M5
3 × OH
2 × OH

+
−
−
M6
1 × OH
1 × OCH3
1 × OGlcUA
+
+
−
M7
1 × OH
1 × OCH3
1 × OGlcUA2 × CH3
+
−
−
M8
2 × OH

−
+
−
M9
1 × OH
1 × OCH3

−
+
−
M10
2 × OH
1 × OCH3
2 × OGlcUA
−
+
−
M11
1 × OH
1 × OCH3
−
+
−
M12
2 × OH
1 × OCH3
2 × OGlcUA
−
+
−
M13
1 × OH
1 × OCH3
1 × OGlcUA

+
+
−
M14
2 × OH
1 × OCH3
2 × OGlcUA
−
+
−
M15
2 × OH
1 × OCH3
1 × CH3
−
+
−
M16
3 × OH
2 × OH

+
−
−
M17
2 × OH
1 × OGlcUA

+
+
−
M18
1 × OH
−
−
+
M19
3 × OH
2 × OH

+
−
−
M20
2 × OH
1 × OGlcUA
−
+
−
M21
3 × OH
+
−
−
M22
1 × OH
1 × OCH3
1 × OSO3H

+
−
−
M23
1 × OH
2 × OCH3
−
−
+
M24
1 × OH
1 × OCH3
1 × OSO3H

−
+
−
M25
2 × OH
1 × OCH3
+
−
−
M26
1 × OH
1 × OCH3
1 × OSO3H

+
−
−
M27
1 × OH
2 × OCH3

−
−
+
M28
1 × OH
1 × OCH3
1 × OSO3H1 × OH
1 × CH3
−
+
−
M29
1 × OH
1 × OCH3
1 × OSO3H
+
−
−
M30
2 × OH
1 × OCH3
1 × OSO3H
+
−
−
M31
2 × OH
1 × OCH3
1 × OSO3H

+
−
−
M32
2 × OH

−
+
−
M33
3 × OH
−
+
−
M34
3 × OH
1 × OH
−
+
−
M35
1 × OH
1 × OCH3
1 × OSO3H

+
−
−
M36
2 × OH
1 × OCH3
3 × OH
+
−
−
M37
3 × OH
2 × OH

−
+
−
M38
2 × OH
−
−
+
M39
2 × OH
−
−
+
M40
2 × OH
1 × OCH3
2 × OH
+
−
−
2 Experiment
2.1 Chemicals and materials
Reference standard named cardamonin was purchased from Chengdu Must Biotechnology Co. Ltd (Sichuan, China). The purity was determined to be higher than 98% according to HPLC-DAD analysis. All the acetonitrile, methanol and formic acid of HPLC grade were purchased from Thermo Fisher Scientific (Fair Lawn, NJ, USA). All the other chemicals of analytical grade were available at the work station, Beijing Chemical Works (Beijing, China). Deionized water used throughout the experiment was purified by a Milli-Q Gradient Å 10 System (Millipore, Billerica, MA, USA). Grace Pure™ SPE C18-Low solid-phase extraction cartridges (200 mg/3 mL, 59 µm, 70 Å) were obtained from Grace Davison Discovery Science (Deerfield, IL, USA).
2.2 Animals
Eight male Sprague-Dawley rats weighing 200 ± 20 g were obtained from Beijing Weitong Lihua Experimental Animals Company (Beijing, China). All the rats were kept under a 12-h light/12-h dark cycle at an ambient temperature of 24 °C ± 2 °C and a relative humidity of 70% ± 5% and fasted with free access to water for 12 h before the experiment. After a week of acclimation, they were randomly divided into two groups: Drug Group (n = 4) for test plasma, urine and faeces; Control Group (n = 4) for blank plasma, urine and faeces. The animal protocols were approved by the institutional Animal Care and Use Committee at Beijing University of Chinese Medicine. The animal facilities and protocols were complied with Guide for the Care and Use of Laboratory Animals.
2.3 Drug administration and biological samples preparation
Cardamonin was dissolved in 0.5% carboxymethylcellulose sodium (CMC-Na) solution before oral administration. The administration dose was equivalent to 300 mg/kg body weight. The equivalent volume of 0.5% CMC-Na (2 mL) solution was administrated to the control group. Then, 0.5 mL blood samples were respectively withdrawn from the suborbital venous plexus of rats at 0.5, 1, 2 and 4 h. Plasma was separated by centrifuging the blood sample at 3500 rpm for 10 min. Urine and faeces samples were collected in metabolism cages within 24 h after the administration. All the homogeneous biological samples from the same group were finally merged into a collective sample.
Furthermore, plasma and urine samples (1 mL) were respectively added into SPE cartridge pretreated with methanol (5 mL) and deionized water (5 mL). And then, the SPE cartridges were successively washed with deionized water (5 mL) and methanol (3 mL). The methanol eluate was collected and evaporated under nitrogen gas at room temperature. The residue was redissolved in 100 μL of acetonitrile/water (5:95, v/v) and then centrifuged for 15 min (4 °C, 14,000 rpm). Meanwhile, faeces sample (1.0 g) was extracted ultrasonically with deionized water (5.0 mL) for 15 min and then filtered. The supernatants (1 mL) were added into the pretreated SPE cartridge, and then the same process described above was conducted. All the supernatants were used for further instrumental analysis.
2.4 Instrument and conditions
UHPLC analysis was carried out with Q-Exactive Focus Orbitrap MS (Thermo Electron, Bremen, Germany) connected to the Thermo Scientific Dionex Ultimate 3000 RS (Thermo Fisher Scientifific, California, USA) via an ESI source. The chromatographic separation was carried out using HYPERSIL GOLD C18 column (100 × 2.1 mm, 1.9 μm, Waters Corporation, Milford, MA, USA) was used for chromatographic separation at 40 °C. The following linear gradient program was applied to the analysis with mobile phase consisting of 0.1% formic acid aqueous solution (solvent A) and acetonitrile (solvent B): 0–2 min: 5% B; 2–10 min 5–40% B; 10–14 min: 40–70% B; 14–19 min: 70–95% B; 19–24 min: 95% B. The injection volume was 2 μL. The flow rate was set to be 0.3 mL/min.
HRMS and MS/MS spectra were obtained using Q-Exactive Orbitrap MS with optimized operating parameters set as follows. Positive ion mode: sheath gas (nitrogen) flow rate of 30 arb, auxiliary gas (nitrogen) flow rate of 10 arb, capillary temperature of 320 °C, spray voltage of 4.5 kV, capillary voltage of 30 V. Negative ion mode: sheath gas (nitrogen) flow rate of 35 arb, auxiliary gas (nitrogen) flow rate of 10 arb, capillary temperature of 325 °C, spray voltage of 3.8 kV, capillary voltage of −35 V. High resolution mass spectrum was acquired at full scan in a mass range of m/z 100–1000 at a resolution of 70,000 detected by Orbitrap analyzer. The ESI-MS2 data at a resolution of 35,000 was obtained by parallel reaction monitoring mode triggered by inclusion ions list, which was built by the molecule predicted. The collision energy was set as normalized collision energy of 30%. In addition, the PRM mode was employed as a complementary tool to obtain the ESI-MS/MS dataset.
2.5 Data processing
Thermo Xcalibur 2.1 workstation was used for data acquisition and processing. In order to obtain as many ESI-MS/MS fragment ions of cardamonin metabolites as possible, the peaks with intensity over 10,000 were selected for the subsequent identification. UHPLC-Q-Exactive Orbitrap MS in both positive and negative ion modes was conducted for chemical profiling of cardamonin and its metabolites. Based on the accurate mass, potential element compositions, and occurrence of possible reactions, the predicted atoms for chemical formula of all the deprotonated and protonated molecular ions were set as follows: C [0–30], H [0–60], O [0–30], S [0–2] and ring double bond (RDB) equivalent value [0–15]. The maximum mass errors between the measured and calculated values were fixed within 5 ppm.
3 Results and discussion
3.1 Establishment of the analytical strategy
In this study, we systematically screened and identified cardamonin metabolites using UHPLC-Q-Exactive Orbitrap MS in both positive and negative ion modes. Our analytic strategy consisted of three steps: (1) After the last administration of cardamonin, plasma, urine and faeces samples were respectively collected and then added into the pretreated SPE cartridge to obtain analysis samples for following analysis. (2) Data-acquisition was performed in full scan mode at a resolution of 70,000. The PRM method was employed to obtain ESI-MS2 data. In PRM mode, target precursor ions were isolated and further produced relevant fragment ions (Zhang et al., 2013; Xiang et al., 2017; Peterson et al., 2012). (3) NLF and DPI data-mining techniques were adopted for the selective clarification of cardamonin metabolites that possessed similar mass fragmentation behaviors to those of reference standard. Meanwhile, high-resolution extracted ion chromatography (HREIC) was developed to extract the metabolite candidates from the high-quality raw mass data in both positive and negative ion modes. Finally, the metabolite structures were elucidated according to the accurate mass measurement, fragmentation patterns, diagnostic product ions and literature reports.
3.2 Establishment of the data acquisition methods
Large amounts of invalid data were generated with the application of full scan method. And, thus, to reduce the potential disturbances caused by irrelevant substances and avoid missing information of drug metabolites, especially trace metabolites, high resolution extracted ion chromatography (HREIC) was applied to data mining (Shang et al., 2017; Wang et al., 2019). The application of HREIC could intelligently filter the background and matrix-related ions from drug-related ions according to the accurate mass measurement of their [M−H]− or [M + H]+ ions. The molecular weights and elemental compositions of compounds derived from the accurate mass measurements could also be readily predicted. As a result, the lower level of target compounds could be captured. However, the parent ions of trace constituents were difficult to be acquired, especially when they co-eluted with those constituents with higher content, resulting in difficulties in the trigger of subsequent fragmentation. Therefore, the PRM method served as a supplementary method to obtain the ESI-MS/MS fragment ions of metabolites with relatively lower contents.
3.3 Fragmentation pattern analysis and DPI determination
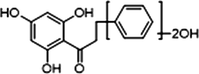
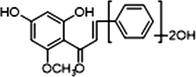
UHPLC-Q-Exactive Orbitrap MS technique was developed to facilitate the structural identification of cardamonin and its metabolits. It has been well documented that components with the same backbone structure usually presented similar fragmentation pathways, leading to the certain DPIs and NLFs. Consequently, the combination of DPIs and NLFs were proposed to efficiently screen and ascertain cadramonin and its relevant metabolites (Wang et al., 2014). Based on different chalcone backcones of 40 metabolites, we explored a series of DPIs which were closely related to RDA cleavages. Compared with the ions resulted from simple neutral loss, DPIs could provide more important information to structure elucidation and help us confirm the hypothesis.
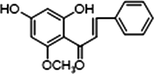
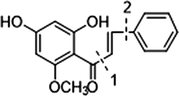
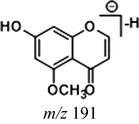
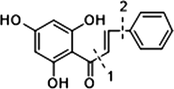
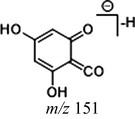
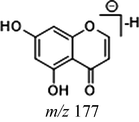
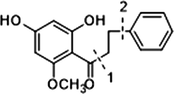
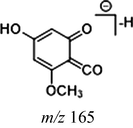
In the ESI-MS spectrum, cardamonin displayed [M−H]− ion at m/z 269.08193. The ESI-MS2 fragment ions at m/z 254, m/z 253, m/z 227 and m/z 226 were yielded by losing CH3, O, CO + CH2 and Ac orderly. In addition, the characteristic fragment ion at m/z 165 was produced owing to the cleavage between C8 and C9, which represented ring A of cardamonin. Serial neutral losses from the fragment ion at m/z 165 yielded another six product ions at m/z 150, m/z 149, m/z 139, m/z 122, m/z 121 and m/z 119, respectively. The fragment ions at m/z 177, m/z 175, m/z 149, m/z 131, m/z 113 could also be observed, which were derived from the cleavages between C1 and C7. In addition, the fragment ion that could represent ring B of cardamonin was displayed at m/z 103. These proposed fragmentation patterns in negative ion mode of cardamonin were depicted in Fig. 2. The fragment ions generated in positive ion mode were in consistent with those generated in negative ion mode.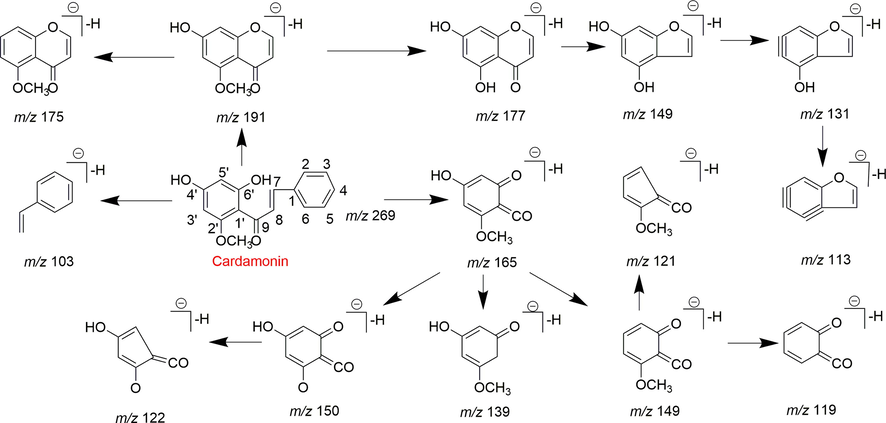
The proposed fragmentation behaviors of cardamonin in negative ion mode.
3.4 Metabolite identification
The chemical identification was carried out based on the strategy described above. In order to obtain a global view of rat metabolite profiles, we detected metabolites in three kinds of biological samples. As a result, a total of 40 metabolites (cardamonin included) were detected and identified, while these metabolites could be categorized into three types according to their backbone structures and 17, 18 and 8 compounds were detected in plasma, urine and faeces, respectively. In addition, M6, M13 and M17 could be detected in both plasma and urine samples.
3.4.1 Simple metabolites
When cardamonin underwent glucurondiation or sulfation, these metabolites didn’t show significant differences in backbone structures. Thus, these metabolites were a homologous series of chalcones with different substituents. The DPIs mentioned above could also be directly utilized for determining their possible structures (He et al., 2009).
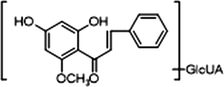
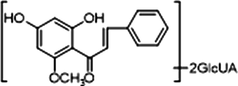
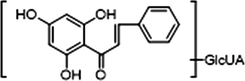
Glucuronidation is the common metabolic pathway for polyhydroxy flavonoid (Oliveira and Watson, 2000). M6 eluted at 4.8 min presented [M−H]− ion at m/z 445.11398 (C22H21O10; mass error 2.374 ppm). The product ion at m/z 269 was produced by the neutral loss of glucuronide. The DPIs including m/z 254, m/z 227, m/z 175, m/z 165, m/z 150, m/z 121 and m/z 113, were also observed. M6 also presented [M + H]+ ion at 447.12778 (C22H23O10, mass error −1.774 ppm). The product ion at m/z 271 [M + H-glucuronide]+ and characteristic product ions at m/z 229, m/z 167, m/z 152 and m/z 124 could also be observed. Similarly, M13 displayed [M−H]− ions at m/z 445.11398 (C22H21O10, mass error 2.374 ppm), detected in urine, which further yielded the product ion at m/z 269 [M−H-glucuronide]− and DPIs at m/z 254, m/z 253, m/z 241, m/z 226, m/z 139 and m/z 113. M13 also possessed [M + H]+ ion at m/z 447.12796 (C22H23O10, mass errors 1.372 ppm), which produced fragment ions at m/z 271, m/z 167, m/z 152 and m/z 124. The fragmentation pathways of M13 resembled those of M6. Hence, M6 and M13 could be tentatively identified as isomeric monoglucuronidation metabolites of cardamonin (see Fig. 3).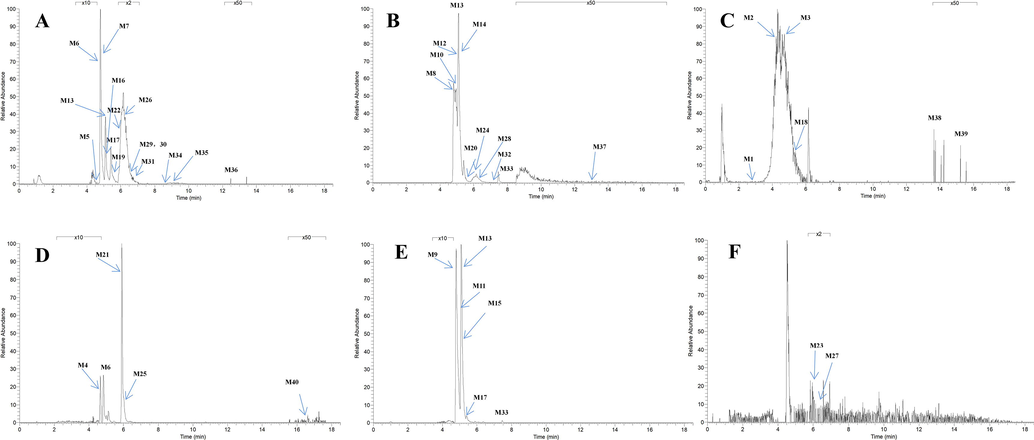
High resolution extracted ion chromatograms for 40 cardamonin metabolites in rat plasma and urine and faeces (A-C for negative ion mode and D-F for positive ion mode). Plasma: (A) m/z 289.07217, 445.11398, 473.14517, 621.14612, 289.07245, 431.09839, 289.07208, 349.03870, 349.03867, 351.05463, 349.03922, 349.03879, 243.10207, 273.07846, 351.05429, 319.07932; Urine: (B) m/z 243.10243, 621.14624, 621.14636, 445.11404, 621.14612, 431.09836, 349.03857, 379.04916, 243.10307, 255.06651, 289.07034; Faeces: (C) m/z 289.07285, 307.07184, 307.07141, 225.09175, 243.10271, 243.10207; Plasma: (D) m/z 273.07550, 447.12778, 257.08023, 275.12692, 305.10327; Urine: (E) m/z 447.12784, 255.10115, 255.10117, 447.12796, 285.11209, 433.11273, 257.08032; Faeces: (F) m/z 285.11105, 285.11148.
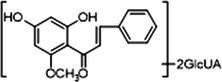
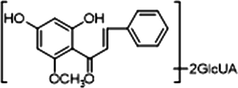
M10, M12 and M14, which possessed [M−H]− ions at m/z 621.14624, m/z 621.14636 and m/z 621.14612 (C28H29O16, mass errors 1.978 ppm, 2.172 ppm and 1.785 ppm, orderly), were all detected in urine sample. The product ions at m/z 445 [M−H-glucuronide]− and m/z 269 [M−H-2glucuronide]− were generated by the successive loss of glucuronide (176 Da). The characteristic fragment ions including m/z 254, m/z 253, m/z 241, m/z 226, m/z 165, m/z 139, m/z 113 and m/z 103, were all generated in their ESI-MS/MS spectra. The product ion at m/z 117 could also be generated by loss of H2O and OCH2 from the ion at m/z 165. Thus, M10, M12 and M14 were all speculated to be isomeric diglucuronidation metabolites of cardamonin (see Fig. 4).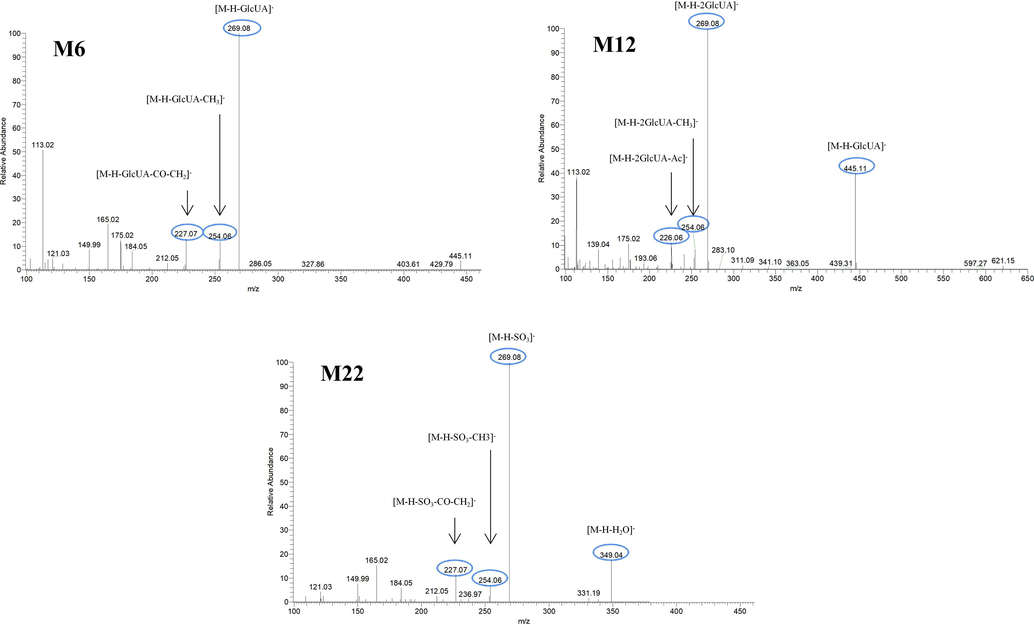
The ESI-MS/MS spectra of M6, M12 and M22 in negative ion mode.
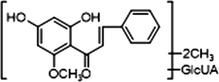
M7 displayed [M−H]− ion at m/z 473.14517 (C24H25O10, 2.001 ppm) in negative ion mode. It yielded the product ion at m/z 297 [M−H-glucuronide]− when the DPIs at m/z 253, m/z 175, m/z 121, m/z 119 and m/z 113 could also be observed. Thus, we could speculate that M7 was dimethylation and glucuronidation product of cardamonin. However, the exact substitution site could not be confirmed by ESI-MS/MS data only (see Fig. 5).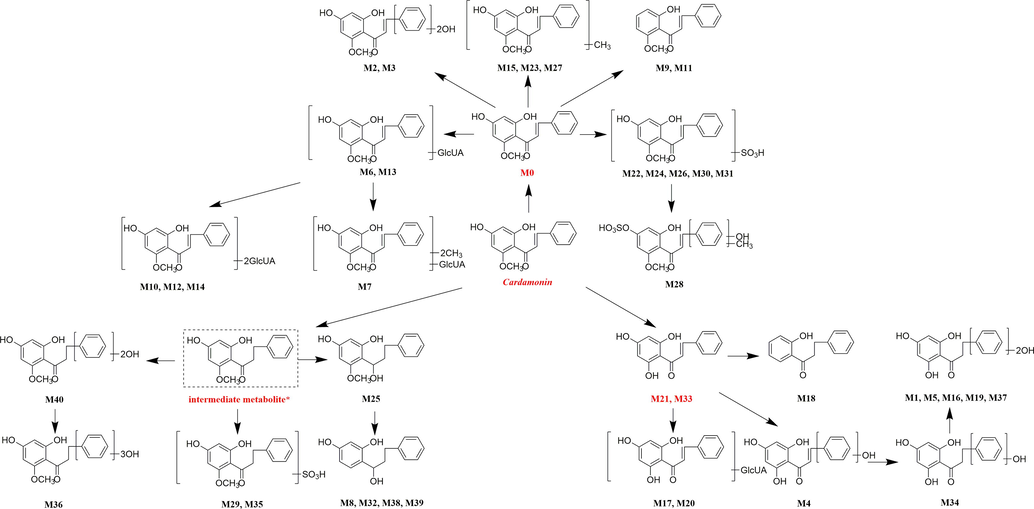
The proposed metabolic pathways of cardamonin in rat.
M22, M24, M26, M30 and M31 afforded the same theoretical [M−H]− ions at m/z 349.03873 (C16H13O7S, mass errors within 5 ppm) in negative ion mode. Compared with [M−H]− ion at m/z 349, the product ion at m/z 269 [M−H-SO3]− was generated, which was decreased by 80 Da. A series of characteristic fragment ions at m/z 254, m/z 253, m/z 227, m/z 226, m/z 165, m/z 150, m/z 149, m/z 121 and m/z 113 were also generated. In the ESI-MS/MS spectrum of M31, the product ion at m/z 331 was generated by loss of H2O (18 Da). Therefore, M22, M24, M26, M30 and M31 were all determined to be isomeric sulfation metabolites of cardamonin.
M28 displayed [M−H]− ion at m/z 379.04935 (C17H15O8S, mass error 2.494 ppm), which further generated fragment ion at m/z 299 [M−H-SO3]−. The DPI at m/z 165 was the same as that of cardamonin, suggesting that its ring A was not substituted by hydroxyl or methyl. The characteristic ions at m/z 119 and m/z 103 were also observed. Based on the abovementioned data, M28 was tentatively identified as hydroxylation, methylation and sulfation metabolite of cardamonin.
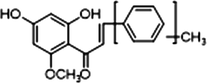
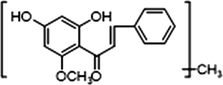
M23 and M27 generated their [M + H]+ ions at m/z 285.11105 and m/z 285.11148 (C17H17O4, mass errors −3.807 ppm and −2.299 ppm), respectively. Serial neutral losses from the ion at m/z 285 produced another two fragment ions at m/z 225 [M + H-CH2-CO-H2O]+ and m/z 224 [M + H-Ac-H2O]+. In the ESI-MS/MS spectrum of M27, the DPI at m/z 181 was produced by the cleavage between C8 and C9, which was 14 Da more than that of cardamonin in positive ion mode. The data confirmed that the occurrence of methylation was on ring A and further produced fragment ion at m/z 121 and m/z 107 [167-2CH2-CO-H2O]+. The ion at m/z 105 also confirmed that ring B was not the substituted site. M15 produced [M + H]+ ion at m/z 285.11209 (C17H17O4, mass errors −0.160 ppm), which yielded ESI-MS/MS product ions at m/z 270 [M + H-CH3]+, m/z 242 [M + H-Ac]+ and m/z 229 [M + H-2CO]+. The DPI at m/z 167 was also observed, indicating that ring A was not substituted by methyl and further generated product ion at m/z 119. Hence, M15, M23 and M27 were characterized as isomeric methylation metabolites of cardamonin.
M9 and M11 displayed [M + H]+ ions at m/z 255.10117 and m/z 255.10115 (C16H15O3, mass errors −1.650 ppm and −1.571 ppm) in positive ion mode, orderly. Both of them were one oxygen less than that of cardamonin, which implied that dehydroxylation occurred. The DPI at m/z 177 was produced by the cleavage between C1 and C7, which was 16 Da less than that of cardamonin and further yielded fragment ions at m/z 145, m/z 129 and m/z 117. The characteristic ions at m/z 115 and m/z 105 were also observed. On account of the neutral losses of H2O (18 Da) and CO (28 Da), product ions at m/z 237, m/z 227 and m/z 199 were respectively generated in the ESI-MS/MS spectrum of M11. The DPI at m/z 151 could be generated by the cleavage between C8 and C9 and further produced fragment ions at m/z 137, m/z 133, m/z 119 and m/z 115. From the abovementioned analysis, M9 and M11 could be deduced as isomeric dehydroxylation metabolites of cardamonin.
M2 and M3 presented their [M−H]− ions at m/z 307.07184 and m/z 307.07141 (mass errors 3.904 and 2.476 ppm), respectively. Their molecular formulas were established as C16H13O6, with two oxygens more than that of cardamonin in negative ion mode. This indicated that dihydroxylation might occur. Due to the presence of hydroxyls in molecule, the [M−H]− ions at m/z 307.07184 and m/z 307.07141 were fragmented into product ions at m/z 283 by neutral loss of H2O (18 Da). In addition, m/z 123 and m/z 107 were generated by RDA cracking ions. Thus, they were tentatively identified as isomeric dihydroxylation metabolites of cardamonin.
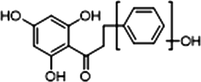
3.4.2 Multiple metabolites based on demethylation reactions
Demethylation is also one of the important metabolic pathways of cardamonin. A total of 12 metabolites were involved in demethylation, which induced some changes in the mass-to-charge ratio of characteristic ions. Due to the loss of methyl, the DPI at m/z 151 (14 Da less than that of cardamonin) could be produced by the cleavage between C8 and C9 in negative ion mode. The DPI at m/z 177 was also generated by the cleavage between C1 and C7. Both of them would further generate other product ions by neutral losses of CH2, CH3, O, H2O, CO, CO2 and their combinations. Because of the structural similarity, these compounds shared certain fragmentation pathways in ESI-MS/MS spectrum and produced many common fragment ions. Thus, the abovementioned DPIs could be regarded as indicators for demethylation metabolites. The fragmentation behaviors in positive ion mode were in consistent with those in negative ion mode.
Both M21 and M33 afforded [M + H]+ ions at m/z 257.08023 and m/z 257.08032 (C15H13O4, mass errors −2.355 ppm and −2.005 ppm) and the product ion at m/z 229 [M + H-CO]+, m/z 189 [M + H-2H2O-2O]+, m/z 187 [M + H-CO-COCH2]+, m/z 175 [M + H-CO-3H2O]+ and m/z 159 [M + H-2CO-COCH2]+ were generated. The characteristic ion at m/z 153 was observed and serious neutral losses from the ion at m/z 179 triggered another three fragment ions at m/z 131, m/z 115 and m/z 103. In addition, M33 presented [M−H]− ions at m/z 255.06651 (C15H11O4, mass error 3.782 ppm), which generated the product ions at m/z 213 [M−H-CO-CH2]− and m/z 211 [M−H-CO2]−. The DPI at m/z 151 was also produced in negative ion mode. Consequently, M21 and M33 were both assigned as isomeric demethylation metabolites of cardamonin.
M17 and M20 possessed [M−H]− ions at m/z 431.09839 and m/z 431.09836 (C21H19O10, mass errors 2.591 and 2.521 ppm), and the product ions at m/z 255 [M−H-glucuronide]− and m/z 113 were generated. Due to the loss of methyl on ring A, the DPI at m/z 151 was observed, which further produced fragment ion at m/z 107 [151-CO2]−. M17 also displayed [M + H]+ ion at m/z 433.11273 (mass error −0.446 ppm) and the product ion at m/z 257 was derived from the precursor ion at m/z 433. In the ESI-MS/MS spectra, the characteristic product ion at m/z 153 that represented ring A was observed. We also speculated that product ion at m/z 151 could be generated from m/z 179 by loss of CO. According to the above analysis, we could speculate that M17 and M20 were demethylation and monoglucuronidation metabolites of cardamonin.
M4 presented [M + H]+ ion at m/z 273.07550 (C15H13O5, mass error −0.915 ppm), which indicated that cardamonin underwent both demethylation and hydroxylation reactions. In the ESI-MS/MS spectrum, it yielded product ion at m/z 209 [M + H-CO-2H2O]+. The DPI at m/z 153 showed that ring A was not substituted by hydroxyl and product ion at m/z 135 [153-H2O]+ was generated by RDA cracking ions. On the basis of these data, M4 was tentatively deduced as demethylation and hydroxylation metabolite of cardamonin.
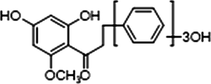
3.4.3 Multiple metabolites based on hydrogenation reactions
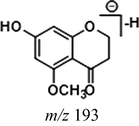
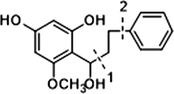
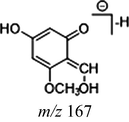
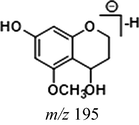
Due to the existence of C⚌C and C⚌O bonds in the molecular structure, cardamonin was able to be hydrogenated and a large part of metabolites underwent monohydrogenation or even dihydrogenation. In addition, C⚌C bonds hydrogenated more easily than C⚌O bonds. On the condition that the cleavage sites were the same with those in cardamonin, the DPI at m/z 165 could be produced by the cleavage between C8 and C9, when the fragment ion at m/z 193 was generated by the cleavage between C1 and C7. As for the dihydrogenation metabolites, the product ions at m/z 167 and m/z 195 would be generated in the same ways. Similarly, these characteristic fragment ions would further generate the other smaller ions by neutral losses of CH2, CH3, O, H2O, CO and their combinations. Then, the corresponding fragment ions were used to identify hydrogenation metabolites.
M34 afforded [M−H]− ion at m/z 273.07846 (C15H13O5, mass error 4.924 ppm), Furthermore, the ESI-MS/MS spectrum of M34 showed successive losses of CO to yield the product ions at m/z 245 [M−H-CO]− and m/z 217 [M−H-2CO]−. Under the premise that ring A was not substituted by hydroxyl, we speculated that the characteristic product ions at m/z 143 and m/z 115 were formed as follows: the fragment ion at m/z 179 could be produced by the cleavage between C1 and C7 when m/z 151 was generated by the cleavage between C8 and C9. Even though both of them did not appear in the ESI-MS/MS spectrum, they could yield the characteristic product ions at m/z 143 and m/z 115 by neutral losses of 2H2O (36 Da). And the product ion at m/z 131 was generated from the ion at m/z 179 by loss of 3O. Therefore, it could be deduced that M34 was demethylation, hydrogenation and monohydroxylation metabolite of cardamonin.
M1, M5, M16, M19 and M37 possessed the same theoretical [M−H]− ions at m/z 289.07168 (C15H13O6, with mass errors within 5 ppm) in negative ion mode, which were one hydroxyl more than that of M34. Similarly, if ring A was not substituted by hydroxyl, they could generate product ions at m/z 179 and m/z 151, both of which were not observed. However, fragment ions at m/z 147 [179-2O]−, m/z 131 [179-3O]−, m/z 119 [179-2O-CO]− were detected, and m/z 115, m/z 105, m/z 103 were produced from the product ion at m/z 151 by losses of 2H2O, H2O + CO and 3O. The fragment ion at m/z 175 [M−H-C6H6-2H2O]− could also be detected. Thus, M1, M5, M16, M19 and M37 were determined to be isomeric demethylation, hydrogenation and dihydroxylation metabolites of cardamonin.
With respect to the identification of M18, the ESI-MS/MS spectrum of [M−H]− ion at m/z 225.09175 (C15H13O2, mass error 3.304 ppm) showed three characteristic fragment ions of cardamonin at m/z 207 [M−H-H2O]−, m/z 197 [M−H-CO]−and m/z 181 [M−H-CO2]−. And thus, we speculated that M18 was demethylation, hydrogenation and didehydroxylation metabolite of cardamonin.
M29 and M35 afforded their respective [M−H]− ions at m/z 351.05463 and m/z 351.05429 (C16H15O7S, mass errors 3.789 ppm and 2.200 ppm). The typical fragment ion at m/z 271 was produced by loss of SO3. The fragment ion at m/z 315 [M−H-2H2O]− was generated from the precursor ion at m/z 351 due to the presence of hydroxyls in the structure. In addition, the characteristic fragment ions at m/z 149 [193-CO2]−, m/z 145 [193-3O]−, m/z 119 [165-CH2-2O]− and m/z 106 [193-CO2-Ac]− were also observed. On the basis of these summarized fragmentation patterns, M29 and M35 were tentatively identified as isomeric hydrogenation and sulfation metabolites of cardamonin.
M40 presented [M + H]+ at m/z 305.10327 and the possible molecular formula was C16H17O6 (mass error 4.278 ppm) with two oxygens and two hydrogens more than that of cardamonin in positive ion mode. In the ESI-MS/MS spectrum, a series of fragment ions at m/z 135 [167-2O]+, m/z 131 [167-2H2O]+, m/z 121 [167-CH2-2O]+ and m/z 107 [167-CO2-2O]+ were generated from the RDA cracking ion at m/z 167. Thus, we speculated that M40 was hydrogenation and dihydroxylation metabolite of cardamonin.
The [M−H]− ion at m/z 319.07932 (C16H15O7, mass error −4.984 ppm) of M36 yielded three representative fragment ions at m/z 301 [M−H-H2O]−, m/z 291 [M−H-CO]− and m/z 275 [M−H-CO2]−. The DPI at m/z 165 was detected and further indicated that hydroxyls were substituted on ring B. Finally, we finally identified M36 as hydrogenation and trihydroxylation metabolite of cardamonin.
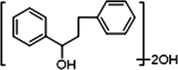
M25 presented [M + H]+ ion at m/z 275.12692, whose possible elemental compositions was C16H19O4. (mass error −3.146 ppm). It showed five major product ions at m/z 257 [M + H-H2O]+, m/z 229 [M + H-H2O-CO]+, m/z 215 [M + H-CO2-O]+, m/z 189 [M + H-2Ac]+ and m/z 159 [195-2H2O]+ in the ESI-MS/MS spectrum. Hence, M25 could be identified as dihydrogenation metabolite of cardamonin.
M8, M32, M38 and M39 possessed the same theoretical [M−H]− ions at m/z 243.10273 (C15H15O3, mass errors within 5 ppm) in negative ion mode, which could gave five significant product ions at m/z 225 [M−H-H2O]−, m/z 199 [M−H-CO2]−, m/z 197 [M−H-CO-H2O]−, m/z 183 [M−H-CO2-O]− and m/z 181 [M−H-CO2-H2O]−. Due to the loss of methoxyl in ring A, the characteristic ion at m/z 165 could be generated by the cleavage between C1 and C7, which was not observed in fact. However, the product ions at m/z 149 [165-O]−, m/z 147 [165-H2O]−, m/z 131 [165-H2O-O]−, m/z 113 [165-2H2O-O]− were detected. Based on the abovementioned data, M8, M32, M38 and M39 were tentatively identified as isomeric dehydrogenation, demethylation and dihydroxylation metabolites of cardamonin.
4 The proposed metabolic pathways and summarized DPIs of cardamonin metabolites
Liver and small intestine are usually considered to be the most responsible for the metabolism of flavonoids (Křížková et al., 2009). After oral dosing, cardamonin could be rapidly metabolized by multiple metabolism enzymes existing in those organs, suggesting that its metabolites would be easier to be detected. Considering the traditional oral intake of herbal medicines, we investigated the oral disposition of cadramonin. Finally, a total of 40 metabolites were preliminarily identified and most of them were detected in plasma and urine. Our results also indicated that cardamonin mainly underwent methylation, demethylation, hydrogenation, hydroxylation, dehydroxylation, glucuronidation, sulfation and their combinations in vivo. We even detected diglucuronidation metabolites in urine.
Given that compounds owning similar structures had comparable metabolic pathways, we summarized three metabolic centers and their particular fragmentation patterns. In their ESI-MS/MS spectra, the DPIs could be yielded by losing CH2, CH3, O, H2O, CO and their combinations, which were essential for structural identification of metabolites sharing similar backbone structures. Based on the specific structure of chalcone, the cleavages between C8 and C9, or C1 and C7, usually happened in the fragmentation process of cardamonin and its metabolites. Thus, the product ions related to these cleavages would be much more dependable, rather than just the fragment ions resulting from common neutral loss from prototypes. Three metabolic centers and corresponding DPIs derived from the cleavages in negative ion mode were summarized in Table 3. Not all of the fragment ions proposed above were detectable, which could be influenced by multiple factors. Due to the structural stability, some of them might further fragment into many smaller product ions. However, the other product ions derived from them could be used for indirect clarification. These DPIs are not only be of great importance to the clarification of 40 metabolites mentioned in this study, but also provide a reference for the structural identification of chalcones and their metabolites.
Reaction
Structures
Cleavage sites
1
2
Prototype
Demethylation
Hydrogenation
5 Conclusions
In recent decades, cardamonin showed great potential in the development of new drugs and the latest report even demonstrated its remarkable effects on fighting cancer via multiple cancer signaling pathways (Javaria et al., 2020). However, cardamonin inherited the low bioavailability, indicating that relevant metabolites may contribute much more to the pharmacological effects after oral administration. Herein, an efficient strategy using UHPLC-Q-Exactive Orbitrap MS was established for determining the cardamonin metabolites in rat plasma, urine and faeces. Among these 40 metabolites, a large part of them underwent both phase I and phase II reactions. It was also interesting to note that the parent compound was not detectable in rat plasma, while glucuronidation and sulfation metabolites seemed to be the dominant circulating compounds. Therefore, we speculated that rapid glucuronidation and sulfation were the main reasons for the low exposure and cardamonin would only be detected in minor amount shortly after oral administration. However, there have been a few studies reporting on the bioactivities of chalcone conjugates in vivo, which might own a comparable or more potent effects. In conclusion, our study provided a global view of the metabolic fate of cardamonin and may contribute to the elucidation of effective forms of cardamonin and their mechanisms of action in the future studies.
Acknowledgements
This work has been financially supported by Young and Creative Team for Talent Introduction of Shandong Province (10073004), Binzhou Medical University Scientific Research Fund for High-level Talents (2019KYQD05, 2019KYQD06) and Locality-University Cooperation Project of Yantai City (2019XDRHXMPT18).
Declaration of Competing Interest
The authors declare that they have no known competing financial interests or personal relationships that could have appeared to influence the work reported in this paper.
References
- Cardamonin suppresses melanogenesis by inhibition of Wnt/beta-catenin signaling. Bio. Bioph. Res. Co.. 2009;390:500-505.
- [Google Scholar]
- Cardamonin from Alpinia rafflesiana inhibits inflammatory responses in IF-γ/LPS-stimulated BV2 microglia via NF-κB signalling pathway. Int. Immunopharmacol.. 2012;12:657-665.
- [Google Scholar]
- Studies on flavonoid metabolism. Absorption and metabolism of (+)-catechin in man. Biochem. Pharmacol.. 1971;20:3435-3445.
- [Google Scholar]
- The effects of cardamonin on lipopolysaccharide-induced inflammatory protein production and MAP kinase and NFkappaB signalling pathways in monocytes/macrophages. Br. J. Pharmacol.. 2006;149:188-198.
- [Google Scholar]
- Characterization of cardamonin metabolism by P450 in different species via HPLC-ESI-ion trap and UPLC-ESI-quadrupole mass spectrometry. Acta Pharmacol. Sin.. 2009;30:1462-1470.
- [Google Scholar]
- Role of endothelium/nitric oxide in vascular response to flavonoids and epicatechin. Acta Pharmacol. Sin.. 2000;21:1119-1124.
- [Google Scholar]
- Cardamonin: A new player to fight cancer via multiple cancer signaling pathways. Life. Sci.. 2020;250
- [Google Scholar]
- The effects of selected flavonoids on cytochromes P450 in rat liver and small intestine. Interdiscipl. Toxicol.. 2009;2(3):201-204.
- [Google Scholar]
- Alpinia katsumadai H(AYATA) seed extract inhibit LPS-induced inflammation by induction of heme oxygenase-1 in RAW264.7 cells. Inflammation.. 2012;35:746-757.
- [Google Scholar]
- Comparative evaluation of cytotoxicity and antioxidative activity of 20 flavonoids. J. Agr. Food. Chem.. 2008;56:3876-3883.
- [Google Scholar]
- Studies on the constituents of the seeds of Alpinia katsumadai HAYATA. Chem. Pharm. Bull.. 1983;31:1544-1550.
- [Google Scholar]
- In vitro glucuronidation of kaempferol and quercetin by human UGT-1A9 microsomes. FEBS Let.. 2000;471(1):1-6.
- [Google Scholar]
- Peterson, A.C., Russel,l, J.D., Bailey, D.J., Westphall, M.S., Coon, J.J., 2012. Parallel reaction monitoring for high resolution and high mass accuracy quantitative, targeted proteomics. Mol. Cell. Proteomics. 11, 1475–1488.
- Cardamonin exerts potent activity against multiple myeloma through blockade of NF-κB pathway in vitro. Leukemia. Res.. 2012;36(4):514-520.
- [Google Scholar]
- An integrated strategy for rapid discovery and identification of the sequential piperine metabolites in rats using ultra high-performance liquid chromatography/high resolution mass spectrometery. J. Pharm Biomed. Anal.. 2017;146:387-401.
- [Google Scholar]
- Fragment ion diagnostic strategies for the comprehensive identification of chemical profile of Gui-Zhi-Tang by integrating high-resolution MS, multiple-stage MS and UV information. J. Pharm. Biomed. Anal.. 2014;98:22-35.
- [Google Scholar]
- Wang, X.W., A, J.Y., Cao, B., Liu, L.S., Zhao, C.Y., Chen, X.H., Wang, G.Q., 2012. The influence of gut Microbiota on some diseases and drug effect or toxicity. Prog. Pharm. Sci. 16, 199–207.
- Chemical constituent profiling of Paecilomyces cicadae liquid fermentation for Astragli Radix. Molecules. 2019;24:2948.
- [Google Scholar]
- Comprehensive analysis of acylcarnitine species in db/db mouse using a novel method of high-resolution parallel reaction monitoring reveals widespread metabolic dysfunction induced by diabetes. Anal. C hem.. 2017;89:10368-10375.
- [Google Scholar]
- Cardamonin sensitizes tumour cells to TRAIL through ROS- and CHOP-mediated up-regulation of death receptors and down-regulation of survival proteins. Br. J. Pharmacol.. 2012;165:741-753.
- [Google Scholar]
- Cardamonin stimulates glucose uptake through translocation of glucose transporter-4 in L6 myotubes. Phytother. Res.. 2011;25:1218-1224.
- [Google Scholar]
- Diagnostic fragment-ion-based and extension strategy coupled to DFIs intensity analysis for identification of chlorogenic acids isomers in Flos Lonicerae Japonicae by HPLC-ESI-MS. Talanta.. 2013;104:1-9.
- [Google Scholar]


