

Translate this page into:
Temperature distribution and dissipation in a porous media (coal)–CO2 system
⁎Corresponding author. 47221090@stu.lntu.edu.cn (Lin Li) 201908522466ll@ncist.edu.cn (Lin Li)
-
Received: ,
Accepted: ,
This article was originally published by Elsevier and was migrated to Scientific Scholar after the change of Publisher.
Peer review under responsibility of King Saud University.
Abstract
In order to master the temperature and dissipation law of the porous media-CO2 system, the distribution of temperature and adsorption field in porous media during intermittent CO2 injection was studied by using self-developed adsorption device and experimental platform of diffusion seepage. The results show that the distribution of high temperature in porous media is isotropic. The effect of CO2 on the temperature field mainly occurs in the self-heating stage of coal, and the high temperature area moves towards gas injection port. The gas migration rate is the highest in the first gas injection. The cooling rate decreases with the increase of gas injection times. Combined with the logistic function relationship between adsorption capacity and temperature, the porous medium CO2 adsorption field was constructed, and it was found that the adsorption field is stable under low temperature oxidation. Therefore, temperature variation mechanism of confined space porous media-CO2 system was established, and quadrilateral of coal spontaneous combustion prevention was proposed. By analyzing the heat transfer process of coal-CO2 system, the thermodynamic entransy dissipation was introduced.
Keywords
Coal spontaneous combustion
Porous media
Intermittent gas injection
Dissipation
CO2 adsorption

1 Introduction
Coal, one of the basic fossil fuels, is a non-renewable fossil energy resource existing underground. Unfortunately, coal spontaneous combustion (CSC) occurs frequently during coal mining, storage and transportation, causing hazards such as fires, gas and dust explosions, deterioration of coal quality and loss of coal reserves. CSC disasters in China, the United States, Germany and India have been serious for a long time (Zheng et al., 2021; Song et al., 2014). The prevention and control of CSC is faced with great challenges due to the strong concealment and location migration of ignition source.
The CSC site has a scale, and the results obtained by small scale similar simulation method fail to extrapolate the real environment of coal mine or coalfield in most cases. Many countries, such as the United States, New Zealand, Australia and China, have developed large platform with a loading capacity of about 0.5–18 tons of coal to study the mechanism of CSC (Wen et al., 2020; Lu et al., 2022). Large amounts of coal are used in large-scale experiments, and heat is constantly generated under the coal-oxygen mechanism (Wang et al., 2003). The thermal conductivity of coal is poor, and the heat is difficult to be completely lost to the surrounding environment through heat transfer, so it is easy to form high temperature heat storage area. When the coal reaches the critical temperature, fire may be caused if no fire extinguishing measures are taken.
At present, the prevention and control of CSC is mainly developed from two aspects: oxygen isolation and coal temperature reduction (Zheng et al., 2018; Deng et al., 2015), and injecting inert gases (CO2 and N2) into coal is one of the main means (Li et al., 2018). The adsorption capacity of CO2 is greater than that of N2 (Li et al., 2018), which is prominent in the inhibition and inerting of CSC (Liu et al., 2022). It is a good choice to use CO2 to prevent CSC under the background of “double carbon”. Globally, coal seams have a CO2 storage capacity of up to 89.1–269.0 trillion cubic meters, and goaf and coal seams with low utilization value can be used as CO2 reservoirs (Li et al., 2020; Shi et al., 2022). It can be seen that CO2 utilization not only provide a path for carbon emission (Ali et al., 2022), but also solve the problem of CSC in confined space (Zhang et al., 2021). Therefore, the research focuses on the mechanism of oxygen adsorption at low temperature (Fu et al., 2023; Qu et al., 2016), the comparison of inert gas adsorption capacity (Fang et al., 2022; Ding et al., 2023), and the variation of oxygen and temperature field caused by inert gas injection in goaf (Liu et al., 2016). In terms of goaf temperature field distribution, CFD simulation is the main research method. For example, Shi et al. studied the influence of liquid nitrogen injection position and injection volume on goaf temperature through simulation (Shi et al., 2019). Undoubtedly, coal is a natural porous medium, and low temperature CO2 injection will cause changes in the fluid pressure and coal temperature. Their changes lead to coal deformation, which can be reflected in the variation of porosity and permeability. In turn, these changes will affect gas seepage and heat transfer in the porous media. However, there is a lack of large-scale experiments to study the effect of CO2 injection on the temperature distribution of loose coal, and the mechanism of heat and mass dissipation caused by CO2 in porous media is not clear.
In the “Classification of Coal in China” (GB/T 5751–2009), lignite has low metamorphism, poor thermal stability and high risk of spontaneous combustion (Yang et al., 2018), bringing many dangers to coal mining, transportation and storage. Therefore, taking lignite as an example, large-scale experimental platform is used to heat loose coal to enhance air permeability (Cui et al., 2014), form porous medium penetration channel, and then inject CO2 into it. The temperature distribution and dissipation characteristics of porous media-CO2 system were studied in combination with small-scale experiments to provide theoretical basis for CO2 prevention and control technology of CSC.
2 Material and Methods
2.1 Samples preparation
Coal samples are collected at a coal mine in Inner Mongolia based on the “Methods for Taking Coal Samples in Coal Seams” (GB/T 482–2008). The grade of spontaneous combustion tendency is class Ⅰ, which belongs to easy spontaneous combustion coal seam, and the coal grade is lignite. Coal may have different particle sizes under the condition of actual mining and storage in confined space. Therefore, the lump coal is broken into coal samples with mixed particle size of 0–30 mm using jaw crusher (TJEP-3). Coal samples with particle size of 0.1–0.15 mm are screened for proximate analysis. The preparation process of coal samples is shown in Fig. 1. The proximate analysis results are shown in Table 1.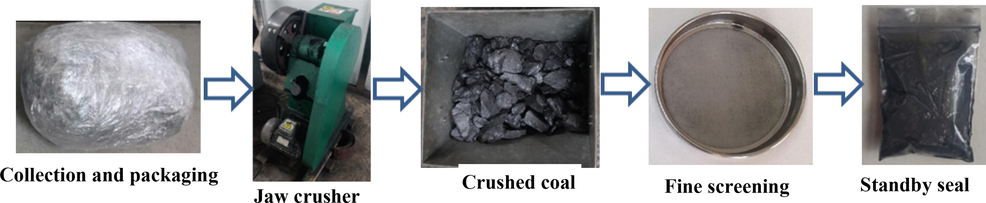
Preparation process of coal samples.
Mad/%
Aad/%
Vad/%
FCad/%
3.442
6.917
31.796
57.845
2.2 Experimental section
Fig. 2 shows the CO2 adsorption device, in which the diameter of the coal sample tank is 155 mm and the loading height is 250 mm. The thermocouple and pressure sensor are respectively installed on the top of the coal sample tank and the reference tank. The thermocouple is used to monitor the temperature at the center point of the coal sample, and the pressure sensor is used to measure the pressure before and after adsorption equilibrium. The coal sample is placed in the coal sample tank for vacuum treatment. The test is carried out under the conditions of pressure 0.01 MPa and temperature from 30 ℃ to 150 ℃. The temperature test interval is 20 ℃.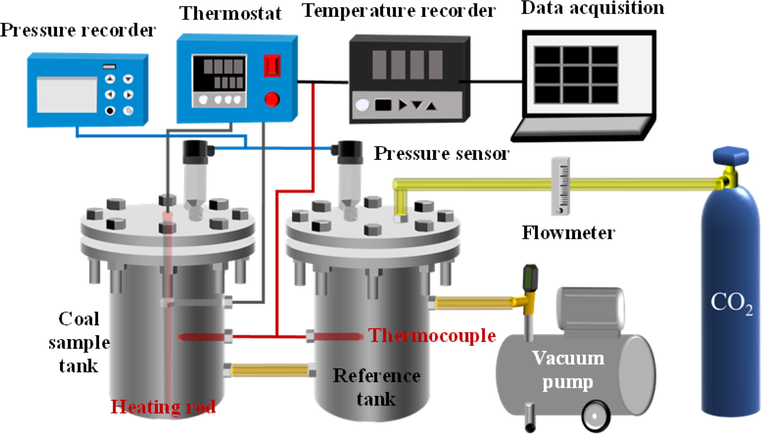
CO2 adsorption device.
The experimental platform of CO2 diffusion seepage in CSC is shown in Fig. 3. The similarity ratio is about 1:100, and loose coal is naturally filled inside. The coal sample conditions for the CO2 diffusion seepage platform are shown in Table 2, where the coal weight of 613.8 kg is the weight of coal loaded for a single experiment in a setup. The loading height of 25 cm is consistent with the CO2 adsorption device. The heating rod is evenly arranged in the center of coal to control coal temperature. Fifteen thermocouples are placed on the same plane, marked as 1#-15#. The layout of measuring points is shown in Fig. 3.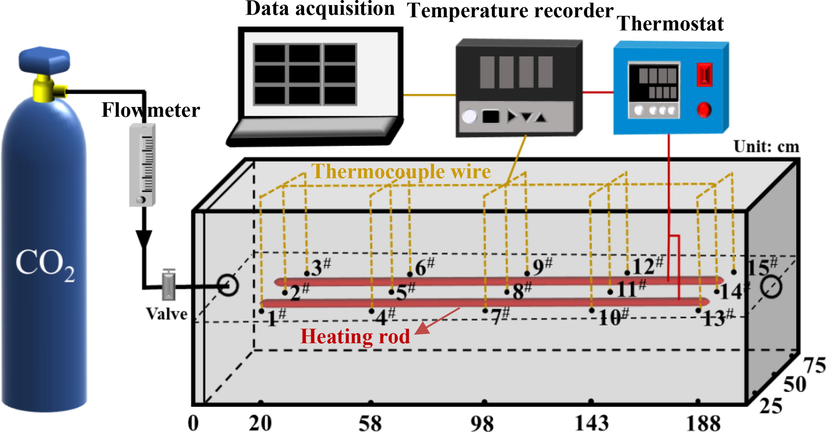
Experimental platform of CO2 diffusion seepage.
Particle size/mm
Loading length/cm
Loading height/cm
Coal weight/kg
Volume weight /(g·cm−3)
0–30
188.00
25.00
613.80
1.43
An active heat source is provided for the coal to simulate the programmed temperature rise experiment. When the temperature reaches about 170 ℃, turning off the temperature controller means stopping heating the coal. The whole preheating process takes 6 days. During this period, the temperature value of 8# is used as the basis for judgment. When the temperature reaches 70 ℃, 90 ℃, 130 ℃ and 170 ℃ respectively, gas at 1#-15# is collected by syringe, filled into the gas collection bag and marked. The samples are sent to the laboratory for gas chromatography analysis. Since the experiment simulates the real coal storage environment, the experimental platform allows natural air leakage field. The air inlet and outlet are easy to be affected by air leakage, which is not conducive to gas collection. Thus, the measuring points 4#-12# are selected to analyze the gas composition of coal samples. The statistics of gas content at 130 ℃ and 170 ℃ are shown in Table 3. C2H4 appears at 170 ℃, indicating that the coal enters the stage of accelerated oxidation. Oxygen concentrations at the surrounding points also confirm this. The heat source is turned off to determine the experimental conditions for cooling.
Number
130 ℃
170 ℃
O2
CO2
C2H4
C2H6
C2H2
CH4
O2
CO2
C2H4
C2H6
C2H2
CH4
4#
11.1
3.4
0.0
0.0
0.0
0.5
9.4
5.1
6.3
0.0
0.0
1.8
5#
13.5
2.5
0.0
0.0
0.0
0.6
15.2
2.2
0.0
0.0
0.0
0.8
6#
15.6
1.2
0.0
0.0
0.0
0.3
18.3
1.0
0.0
0.0
0.0
0.2
7#
10.1
3.5
0.0
0.0
0.0
0.8
16.6
1.7
0.0
0.0
1.9
0.5
8#
18.5
0.5
0.7
0.0
0.0
0.2
19.4
0.0
0.2
5.0
0.0
0.0
9#
17.0
1.1
1.3
0.0
0.0
0.4
9.8
5.5
0.0
4.1
0.0
1.5
10#
9.8
3.3
0.0
0.0
0.0
1.7
10.7
4.2
0.0
0.0
0.0
1.0
11#
7.7
3.8
0.0
0.0
0.0
2.3
6.5
5.9
4.2
0.0
0.0
1.6
12#
9.4
3.4
0.9
0.0
0.0
2.0
9.5
4.7
4.7
0.0
0.0
1.2
The gas injection rate is 15 L/min, and the gas injection pressure is 0.1 MPa. With the temperature of 8# as the reference point, the gas injection system is started when the temperature reaches about 170 ℃, and take this temperature as the initial temperature. The conditions of the cooling experiment are shown in Table 4, and the experiment ended when the coal temperature is close to 50 ℃. The data collection interval is 30 s.
Groups
Gas injection
Waiting time/h
Starting T/℃
End T/℃
Duration/h
1
172
152
6.05
2.15
2
141
121
4.35
3.45
3
109
90
7.25
5.1
4
81
64
7.55
3.3
5
58
50
8.25
8.1
3 Results and discussion
3.1 Temperature variation of porous medium–CO2 system
3.1.1 Temperature field distribution of intermittent CO2 injection
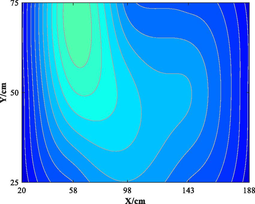
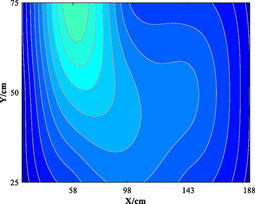
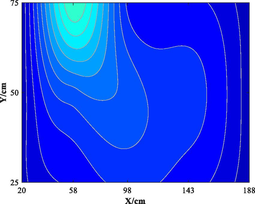
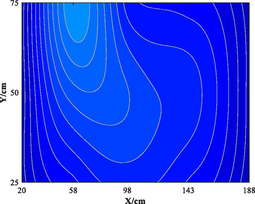
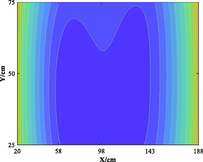
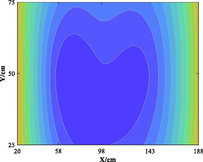
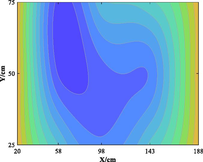
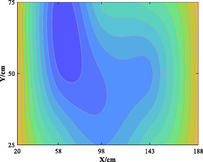
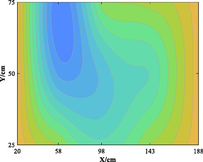
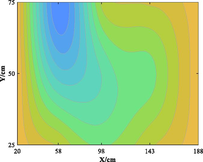
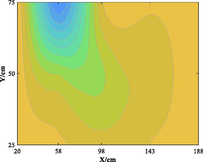
Table 5 lists five groups of gas injection time and 4 h after gas injection of coal internal temperature distribution cloud map. In the early stage of the first gas injection, the high temperature area spread throughout the whole horizontal plane, and the temperature is the highest at the distance of 60–120 cm from the gas inlet, which decreases to the gas inlet and outlet in a waveform shape. When CO2 is injected for 4 h, the temperature drops and the high temperature area shrinks, but the change of temperature field as a whole is not significant. In the early stage of the second gas injection, the temperature is the highest at 60–100 cm away from the gas inlet, and the high temperature area is isotropic. After 4 h of gas injection, the temperature field changes, and the temperature in the high temperature area decreases. The relatively low temperature area begins to decrease towards the gas outlet in a “U” shape. During the 3rd to 5th gas injection, the high temperature area is concentrated near the measuring point 6#. With the passage of time and the increase of gas injection, the temperature decreases significantly, and the high temperature area shrinks. The temperature field distribution is similar to that of 4 h after the second gas injection. The temperature field is stable from the fourth gas injection, and the temperature at the measuring point still shows a downward trend. Therefore, the distribution of high temperature in porous media is isotropic. In the relatively low temperature area, the temperature decreases towards the gas outlet in the “U” shape. Compared with the initial temperature, CO2 injection makes the high temperature area move towards gas injection port. When the temperature is higher than 160 ℃ or lower than 90 ℃, it is difficult for CO2 injection to change the temperature field distribution in porous medium.
Groups
Gas injection time
4 h after gas injection
legend
1


2


3


4
5
3.1.2 Temperature variation of CO2 intermittent injection with time
Fig. 4 shows the longitudinal variation curve of temperature with time at measuring points on the same plane. Areas A to E are filled with pink, respectively representing the temperature of the five gas injection stages, and the white area is the corresponding stop injection stage. As shown in Fig. 4, in the intermittent gas injection process, the temperature fluctuation of measuring points 1#-3# near the gas injection port and 13#-15# near the gas outlet is relatively large, and the temperature of measuring points in the central region of the porous medium shows a downward trend.
Longitudinal variation of temperature with time at measuring points on the same plane.
As shown in Fig. 4(a), since the second gas injection, the temperature at the measuring point decreases first and then rises. In the stop phase, the temperature continues to decrease due to inertia. Due to the disappearance of pressure difference and the higher initial temperature of coal, the cooling intensity of CO2 is lower than the initial coal temperature. At the same time, some heat is released from the locally accumulated CO2 absorbed by coal, so the temperature rises.
As shown in Fig. 4(b)-(c), the temperature at the measuring points shows a decreasing trend with the increase of time. The temperature of 8#-11# is higher than that of the same vertical measuring point on the same plane. This is because the heat accumulates in the middle is not easy to lose, and the cooling rate is slow. Therefore, the temperature of the measuring point in the same plane and vertical middle is higher. Therefore, in the same plane, the same vertical center temperature is high.
As shown in Fig. 4(d), at the first gas injection stage, the coal is storing heat, and CO2 has not migrated to the gas outlet through the fractured channel, so the temperature shows a rising trend. At the second stop injection stage, due to viscous resistance, CO2 constantly consumes its own energy in the process of migration, and the cooling intensity reaches a relative balance with coal temperature after migration for a certain distance. With the 3rd gas injection, continuous CO2 injection makes the fissure of coal further expand, and the internal temperature of coal continues to drop. When the temperature reaches 30 ℃, the accumulative cooling effect of CO2 around 13#-15# competes with the temperature accumulation level of coal. With the increase of time, CO2 migrates from the gas inlet port to the outlet, and superimposes with the original accumulation, making the temperature drop.
Therefore, in the gas injection stage, CO2 migrates from the high pressure zone to the low pressure. The density and viscosity of CO2 are low, and the flow resistance is small, so the migration speed is high. With the injection of gas, the strong impact force makes the seepage channel in the coal expand, and the temperature decreases significantly under the action of thermal convection. In the phase of stop injection, the driving force of pressure flow disappears, and the heat conduction and heat convection make the temperature of coal gradually decrease.
3.1.3 Cooling rate
Cooling rate refers to the ratio between the initial and final temperature difference and the time consumed, and its expression is Eq. (1) (Quan et al., 2021).
Where, v is the cooling rate, ℃/h; T is the change value of temperature, △T = T1–T0, ℃; t is the time, h.
Fig. 5 shows the cooling rate variation of measuring points. In Fig. 5 (a), the cooling rates of 3# and 13#-15# are approximately equal. The cooling rates of 1#, 2# and 7# decrease with the increase of gas injection times, while the cooling rates of 4#, 5# and 8#-12# first increase and then decrease with the increase of gas injection times. The cooling rate of 7# in the 1st and 2nd injection stages is higher than that of other measuring points. Under the action of jet flow, although the measuring point 7# is far away from the gas injection port, the temperature decreases first. However, at the stage from the 3rd to the 5th injection, the cooling rate is relatively low due to the low specific heat of CO2 and its limited cooling ability. Therefore, with the increase of gas injection times, the cooling rate at the measuring point decreases. As shown in Fig. 5 (b), the cooling rate of single gas injection is significant in X = 58–98 m, Y = 25–50 m region.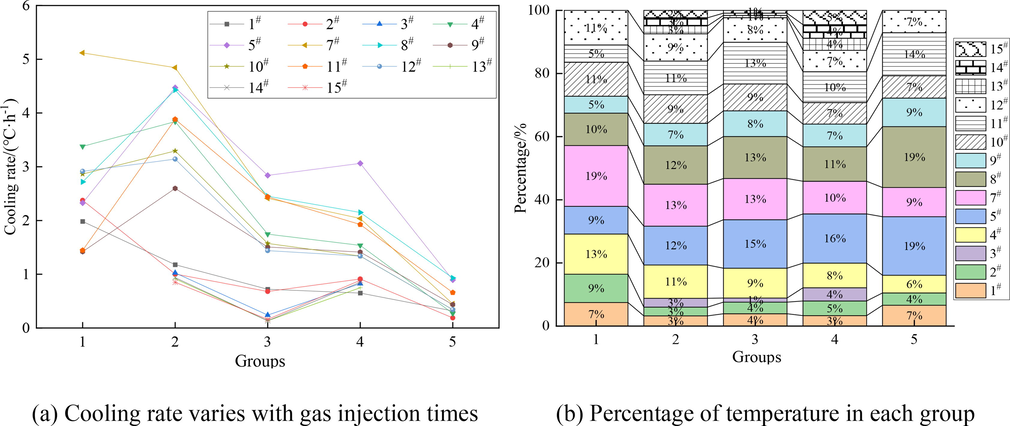
Cooling rate variation of measuring points.
Based on the temperature of 8#, the cooling rates of the five groups of intermittent gas injection under the condition that the temperature difference in the gas injection stage is 20 ℃ and the temperature difference in the waiting stage is 10 ℃ are calculated respectively, as shown in Table 6. As the gas injection times increases, the time required to reduce the same temperature difference increases. In the gas injection stage, the cooling rate of the 2nd injection is the highest, and the cooling rate of the 5th injection is the lowest. In the waiting phase, the cooling rate of the 1st stop is the highest. The cooling rate decreases with the increase of the number of waiting stages.
Groups
Gas injection stage
Waiting stage
t/h
v/(℃·h−1)
t/h
v/(℃·h−1)
1
6.05
3.339
2.15
5.116
2
4.35
4.598
3.45
3.478
3
7.25
2.621
5.1
1.765
4
7.55
2.252
3.3
1.818
5
8.25
0.97
8.1
1.111
3.1.4 Gas transport rate
The migration law of gas in porous media is demonstrated by gas transport rate. Relative to the last time of temperature reduction, the difference between the time when the temperature decreases by 5 ℃ and the time of gas injection is
t. By the definition of velocity, we put forward the calculation formula of gas migration rate, as shown in Eq. (2).
Where, η is transport rate, m/min; L is the distance between the measuring point and the gas injection port, m.
Table 7 shows the statistics of gas migration rates. In the 1st gas injection stage, the migration rate of 8# is the highest at 0.73 m/min, while that of 5# is the lowest at 0.34 m/min. During the 2nd to 4th gas injection stages, the migration rates of 11# are the highest, which are 1.68 m/min, 1.1 m/min and 0.95 m/min, respectively, while the migration rates of 2# are the lowest, which are 0.07 m/min, 0.04 m/min and 0.11 m/min, respectively. The temperature reduction of 14# for the first three times of gas injection is outside the set standard range. In the 4th gas injection stage, the gas migrated to 14#, that is, near the gas outlet port.
Groups
Gas transport rate/(m·min−1)
2#
5#
8#
11#
14#
1
0.40
0.34
0.73
0.56
—
2
0.07
0.83
1.40
1.68
—
3
0.04
0.55
0.78
1.10
—
—
0.32
0.41
0.60
—
—
0.20
0.29
0.39
—
—
0.14
—
—
—
4
0.11
0.58
0.61
0.95
0.55
—
0.29
0.40
0.48
—
—
0.18
0.24
0.32
—
—
0.08
—
—
—
5
—
0.13
0.36
0.29
—
3.2 CO2 adsorption field distribution in porous media
In the coal-CO2 system, the influencing factors include coal itself and external factors, as shown in Fig. 6. The former includes coal structure, moisture content and coal rank, while the latter includes temperature, pressure and contact time (Abunowara et al., 2021; Chen et al., 2021; Wang et al., 2022; Wu et al., 2019). The same experimental coal sample is selected to ensure that the factors of coal itself are consistent, and the experimental conditions ensure that the pressure and contact time are consistent.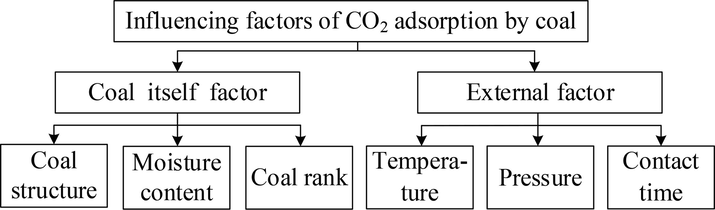
Influencing factors of CO2 adsorption by coal.
The adsorption capacity expression is shown in Eq. (3).
Where, P1 is the pressure before adsorption equilibrium, MPa; P2 is the pressure after adsorption equilibrium, MPa; V1 is the gas volume before equilibrium, cm3; V2 is the gas volume after equilibrium, cm3; n is the amount of substance, mol; R is the molar gas constant, J/(mol·K); T1 is the temperature before equilibrium, K; T2 is the temperature after equilibrium, K; Vad is adsorption capacity, cm3/g; M is the coal sample mass, g.
In the isothermal adsorption experiment, coal is heated to the designed ambient temperature, and then the temperature is kept constant. We call this temperature the operating temperature. The operating temperature is taken as the abscissa and the adsorption capacity as the ordinate to draw the scatter plot, and the nonlinear curve fitting is carried out. Levenberg-Marquardt optimization algorithm is selected as the iterative algorithm to obtain the relationship model between adsorption capacity and temperature, as shown in Fig. 7. The relationship is established as
, where T is the operating temperature (℃), and the fitting results are good (R2 = 0.99803). Therefore, the relationship between adsorption capacity of experimental coal sample and temperature meets the logistic function under atmospheric pressure.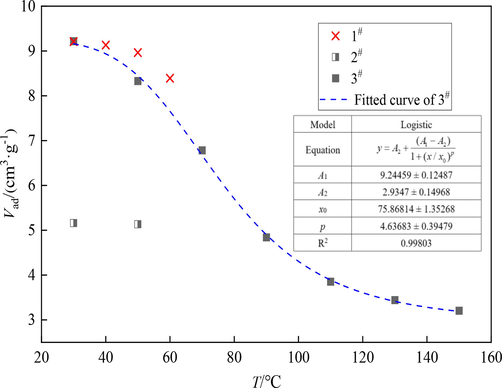
Relationship between adsorption capacity and temperature.
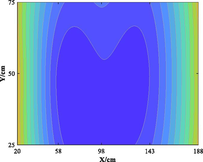
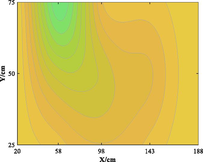
The relationship between adsorption capacity and temperature is used to build the adsorption distribution cloud map, as shown in Table 8. The CO2 adsorption field in porous media is affected by gas injection frequency and cumulative gas injection volume. The stability of adsorption field increases with the increase of gas injection times. Therefore, the adsorption field is stable under low temperature oxidation condition. The increase of gas injection times also means that the cumulative gas injection increases, but the adsorption field tends to be stable, indicating that the adsorption of CO2 by porous media gradually tends to be saturated.
Groups
Gas injection time
4 h after gas injection
legend
1

2

3
4
5
3.3 Mechanism of CO2 control on CSC in confined space
According to the above analysis, the temperature of the porous media-CO2 system decreases as a whole due to CO2 injection in confined space, and eventually tends to be stable. Based on this phenomenon and the experimental process, the factors affecting the temperature field distribution are firstly considered from the three perspectives of confined space, porous medium and air leakage. Fig. 8 shows the temperature change mechanism of porous media-CO2 in confined space.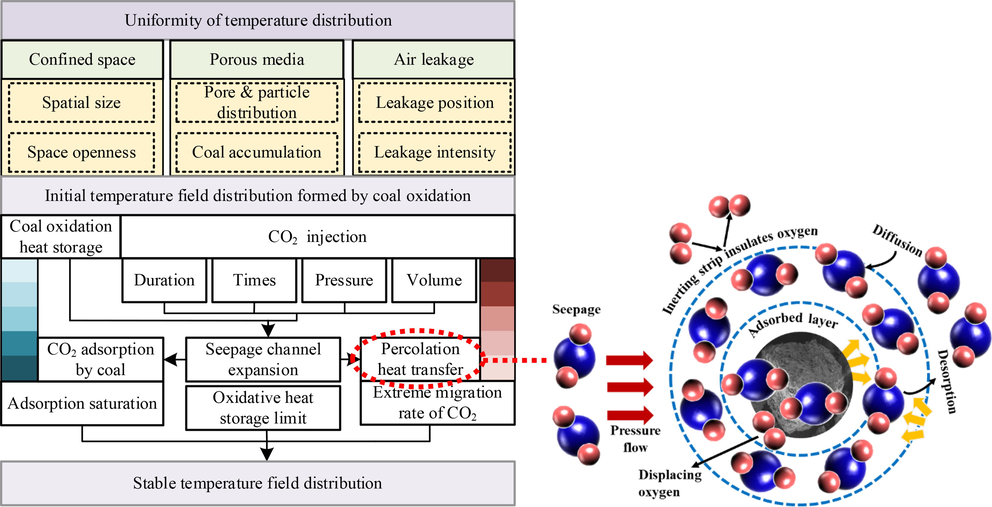
Temperature change mechanism of porous media-CO2 in confined space.
The heterogeneous properties of porous media cause flow channels in closed paths. The uneven distribution of pore particles and distribution leads to the uneven distribution of temperature is an important feature of large-scale experiments (Zhao et al., 2023). When the porosity is large, the gas flow resistance is small. At this time, a large number of air leakage through the large pores, the oxidation and heat release intensity of coal is strong. After the initial temperature field is formed, the coal continued to oxidize and store heat while CO2 is injected. The pore fracture morphology changes in coal under high temperature thermal damage, which leads to the increase of pore connectivity and porosity. Therefore, the seepage flow channel expands under the action of CO2 jet and coal oxidation heat storage, in which the factors affecting the temperature field of CO2 injection include gas injection duration, times, pressure and volume.
The expansion of seepage channels has two advantages. On the one hand, the contact area between gas and coal increases, and the adsorption capacity of coal is affected. On the other hand, the seepage heat transfer opportunity increases. With continuous CO2 injection, the oxidation and heat storage capacity of coal reaches its limit, and adsorption capacity of coal to CO2 reaches the saturation state. The porous medium channel may be completely filled with CO2, resulting in an increase in flow resistance and an extreme migration rate. Finally, the temperature field distribution is stable in the three limit states. Therefore, the three state parameters of adsorption saturation, oxidative heat storage limit and CO2 migration rate extreme value can be established to establish the relationship with heat, and finally quantify the degree of porous media-CO2 temperature change in confined space.
The conditions for CSC include large amount of loose coal, sufficient oxygen and heat accumulation. Therefore, the prevention and control of CSC mainly from these three elements, damage reaction conditions. According to the occurrence conditions of CSC, combined with the analysis of experimental results, the quadrangle of CSC prevention and control is proposed, as shown in Fig. 9.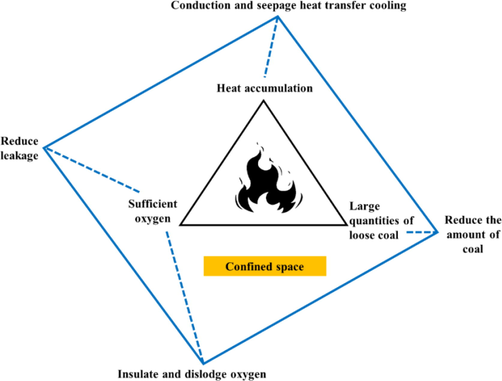
Quadrangle of coal spontaneous combustion prevention and control.
Reducing air leakage is to reduce oxygen content in confined space and avoid adequate oxygen supply (Cheng et al., 2022). Oxygen isolation and displacement include two situations. On the one hand, CO2 injected into the restricted space surrounds between coal and coal, forming a CO2 inerting zone, which cuts off the contact between oxygen and coal and plays an inerting role. The other is CO2 is adsorbed on the surface of coal, displacing and occupying the adsorption site of oxygen, which plays an inhibitory role. On the other hand, CO2 is adsorbed on the surface of coal, displacing and occupying the adsorption site of oxygen, which plays an inhibitory role. CO2 itself is lower than the temperature in coal dust, and it is cooled by conduction and convective heat transfer driven by pressure flow during perfusion. Eq. (4) is Arrhenius equation (Wang et al., 2018). The lower the temperature is, the smaller the reaction rate constant is, so the spontaneous combustion of coal in confined space is inhibited.
Where, T is the absolute reaction temperature, K; k is the reaction velocity constant at temperature T; A is the front factor; is the apparent activation energy, J·mol−1.
4 Mechanism of heat and mass dissipation of CO2 in porous media
4.1 Heat and mass transfer process of coal-CO2 system
Fig. 10 shows the heat and mass transfer process of coal-CO2 system. When CO2 is not injected into the porous medium, the coal interacts with oxygen and water to exchange heat and mass (Li et al., 2023; Zhang et al., 2021), forming the initial coal temperature. When the coal temperature exceeds the threshold of spontaneous ignition, CO2 is adopted to prevent and control CSC. When CO2 is injected into a porous medium, it provides the pressure driving force for the cold fluid. Heat conduction and heat convection occur between CO2 and hot fluid in porous medium during the flow process. The low thermal conductivity of coal is the main reason that heat is well stored in porous media. Because of the narrow gaps between the coal particles, this further reduces the thermal conductivity of the coal. When coal absorbs solar energy, it has thermal radiation on the surface, but it is negligible in the deeper layers. Convection is the main mode of gas flow at the microscopic scale, which occurs in the channels between particles. The efficiency of heat convection mainly depends on the advection velocity of gas in the narrow channel between coal particles. Diffusion occurs in the inner pores of coal particles and deep coal reservoir. Both natural and forced convection are pressure-driven flows, while diffuse motion is caused by a gas concentration gradient because oxygen consumption, CO2 displacement of O2, and gas product production do not occur at the same rate everywhere. The influencing factors of CO2 seepage in porous media include pore size, pore wall friction and flow path length. Pore size and flow path length affect the adsorption capacity of CO2 on coal surface and the CO2 diffusion behavior. Due to pore wall friction, CO2 flow resistance causes thermodynamic dissipation.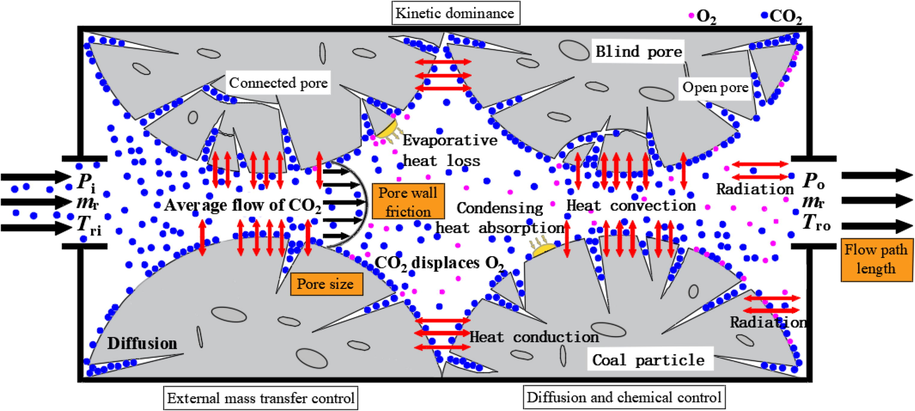
Heat and mass transfer process of coal-CO2 system.
Pores or cracks are channels of fluid flow, heat and mass transfer (Li et al., 2023). The pore structure of coal is complex, including blind pore, open pore and connected pore (Si et al., 2022). Zhang et al. (2016) on the mass transfer mechanism of CSC introduces the relationship between oxygen consumption rate, oxygen diffusion coefficient and pore structure of coal. However, in the porous media-CO2 system, the mass transfer process is mainly the relationship between CO2 displacement O2 rate, CO2 diffusion coefficient and pore structure. CO2 displacement of O2 prevents the oxidation reaction rate, which can be considered to be essentially similar to the mass transfer mechanism of CSC. Therefore, the mass transfer process of this system can be divided into three states: kinetic dominance, diffusion and chemical control, and external mass transfer control. The dominant kinetics occurs in porous coal particles, which contain a large number of connected pores and open pores. CO2 molecules diffuse into the pores and discharge O2 in the pores to the channel. At the same time, CO2 is absorbed by the coal surface, and the CO2 concentration in the coal pores and surface is approximately equal to the overall CO2 concentration. The characteristics of diffusion and chemical control are that coal particles contain open pores and CO2 molecules have high effective diffusion coefficient. The oxidation reaction is slower than the diffusion, so the adsorption and displacement rate is smaller than the diffusion of CO2, allowing the gaseous CO2 to diffuse into the coal particles before the oxidation reaction. Most of the CO2 diffuses into the coal particles before the reaction, and some CO2 is absorbed on the coal surface to partially displace O2. In this case, the overall reaction rate is controlled by a combination of chemical reactions and CO2 diffusion, and is influenced by coal size. External mass transfer control is prominent in non-porous coal particles, and adsorption or displacement mainly occurs on the surface of coal without diffusion resistance. Therefore, CO2 occupies the reaction site on the coal surface.
4.2 Thermodynamic dissipation of porous media-CO2 system
Guo et al. (2006, 2008) put forward the concept of entransy by comparing the phenomena of heat transfer and charge transfer, and its expression is shown in Eq. (5). In the heat transfer process, the transfer of entransy is not conserved. Entransy dissipation represents the irreversibility of the heat transfer process. The smaller the dissipation, the smaller the degree of irreversibility, and vice versa (Hu et al., 2011).
Where, E is the entransy, J; Qvh is the heat capacity, J.
Let the flow of fluid in a porous medium be caused by a finite pressure difference between the inlet and outlet, and the fluid flow be steady-state adiabatic. The effect of enthalpy change on entropy production is negligible (Xu et al., 2009), i.e. . Where, ρ is the density of fluid; p is the pressure; s is the specific entropy. can be obtained from the connection between thermodynamic entransy and entropy. The thermodynamic entransy dissipation due to flow resistance is (Shi et al., 2015). Where, is the mass flow rate. If the logarithmic mean temperature is used instead of the temperature in the formula and the fluid is incompressible, can be obtained, where △p = pi − po. The inlet and outlet parameters are set as shown in Fig. 10, then the thermodynamic entransy dissipation caused by the flow resistance of CO2 is .
5 Conclusions
The temperature distribution and the CO2 adsorption field distribution for porous media-CO2 system were studied by using the self-developed CO2 adsorption device and the experimental platform of CO2 diffusion seepage in CSC. The temperature change mechanism of porous media-CO2 in confined space and the quadrilateral of CSC prevention and control were proposed to provide a theoretical basis for the CO2 prevention and control technology of CSC.
The distribution of high temperature in porous media is isotropic. The injection of CO2 makes the high temperature area move towards the gas injection port. When the temperature is higher than 160 ℃ or lower than 90 ℃, the distribution of temperature field in porous media is not significant. The cooling in the stage of multiple gas injection is mainly driven by pressure flow and convection, and the temperature in the middle of the porous medium shows a downward trend. With the increase of gas injection times, the cooling rate at the measuring point decreases. The maximum gas migration rate occurs during the first gas injection.
The relationship between adsorption capacity and temperature of experimental coal sample meets logistic function. Then, we established the porous medium CO2 adsorption field and found that with the increase of gas injection times, the adsorption field tends to be stable, indicating that the adsorption field is stable under the condition of low temperature oxidation.
In coal-CO2 system, the mass transfer process can be divided into three states: kinetic dominance, diffusion and chemical control, and external mass transfer control. CO2 injection provides the driving force of pressure, and heat convection is the main mode of heat transfer. Based on this, the concept of entransy is introduced into the heat transfer theory of porous media-CO2 system, and the thermodynamic dissipation equation caused by the resistance of CO2 flow is given.
Acknowledgments
This work was supported by the National Natural Science Foundation of China [grant numbers 52074122, 51804120], and the Natural Science Foundation of Hebei Province in China [grant number E2021508010].
Declaration of Competing Interest
The authors declare that they have no known competing financial interests or personal relationships that could have appeared to influence the work reported in this paper.
References
- Experimental and theoretical investigations on kinetic mechanisms of low-pressure CO2 adsorption onto Malaysian coals. J. Nat. Gas Sci. Eng.. 2021;88:103828
- [CrossRef] [Google Scholar]
- Recent advances in carbon dioxide geological storage, experimental procedures, influencing parameters, and future outlook. Earth-Sci. Rev.. 2022;225:103895
- [CrossRef] [Google Scholar]
- Deformation and swelling of coal induced from competitive adsorption of CH4/CO2/N2. Fuel. 2021;286:119356
- [CrossRef] [Google Scholar]
- Using inverting CO critical value to predict coal spontaneous combustion severity in mine gobs with considering air leakages—A case study. Process Saf. Environ.. 2022;167:45-55.
- [CrossRef] [Google Scholar]
- Numerical simulation on UCG process based on non-steady flow in porous media transport. J. China Coal Soc.. 2014;39:231-238.
- [CrossRef] [Google Scholar]
- Experimental studies of spontaneous combustion and anaerobic cooling of coal. Fuel. 2015;157:261-269.
- [CrossRef] [Google Scholar]
- Effects of inert gas CO2/N2 injection on coal low-temperature oxidation characteristic: Experiments and simulations. Arab. J. Chem.. 2023;16:104510
- [CrossRef] [Google Scholar]
- Experimental comparison study of CO2 and N2 inerted loose coal based on atmospheric pressure gas replacement. Fuel. 2022;328:125347
- [CrossRef] [Google Scholar]
- Molecular model construction of Chifeng lignite and analysis of adsorption mechanism of O2 at low temperature. J. Mol. Struct.. 2023;1276:134613
- [CrossRef] [Google Scholar]
- New physical quantities in heat, Journal of Engineering Thermophysics. J. Eng. Thermophys-RUS.. 2008;29:112-114.
- [Google Scholar]
- Entransy—A physical quantity describing heat transfer ability. Int. J. Heat Mass Tran.. 2006;50:2545-2556.
- [CrossRef] [Google Scholar]
- The efficiency of heat transfer process. J. Eng. Thermophys-RUS.. 2011;32:1005-1008.
- [Google Scholar]
- Molecular simulation of adsorption thermodynamics of multicomponent gas in coal. J. China Coal Soc.. 2018;43:2476-2483.
- [CrossRef] [Google Scholar]
- Numerical investigation of seepage characteristics of propped fracture in coalbed methane reservoirs. Gas Sci. Eng.. 2023;110:204863
- [CrossRef] [Google Scholar]
- Study on numerical simulation of CO2 injection fire prevention and extinguishing technique in goaf of Jiudaoling Mine. Coal Sci. Technol.. 2018;46:153-157.
- [CrossRef] [Google Scholar]
- Simulation of adsorption-desorption behavior in coal seam gas reservoirs at the molecular level: A comprehensive review. Energy Fuel. 2020;34:2619-2642.
- [CrossRef] [Google Scholar]
- Thermodynamic variation law and influence mechanism of low-temperature oxidation of lignite samples with different moisture contents. Energy. 2023;262:125605
- [CrossRef] [Google Scholar]
- Migration behavior of two-component gases among CO2, N2 and O2 in coal particles during adsorption. Fuel. 2022;313:123003
- [CrossRef] [Google Scholar]
- 3-D simulation of gases transport under condition of inert gas injection into goaf. Heat Mass Transf.. 2016;52:2723-2734.
- [CrossRef] [Google Scholar]
- Recent progress and perspective on thermal-kinetic, heat and mass transportation of coal spontaneous combustion hazard. Fuel. 2022;308:121234.1-121234.29.
- [CrossRef] [Google Scholar]
- Establishment of various char-RPM under O2/CO2 atmosphere. CIESC J.. 2016;67:4468-4476.
- [CrossRef] [Google Scholar]
- Study on influence factors of spontaneous combustion heat transfer of coal pile by heat pipe. Saf. Coal Mines. 2021;52:52-57.
- [CrossRef] [Google Scholar]
- Experiment study on CO2 adsorption performance of thermal treated coal: Inspiration for CO2 storage after underground coal thermal treatment. Energy. 2022;254:124392
- [CrossRef] [Google Scholar]
- Modeling temperature distribution upon liquid-nitrogen injection into a self heating coal mine goaf. Process Saf. Environ. Prot.. 2019;126:278-286.
- [CrossRef] [Google Scholar]
- Entransy dissipation analyses of transcritical CO2 gas cooler. J. Refri.. 2015;36:90-97.
- [CrossRef] [Google Scholar]
- Research on the characterization algorithm of equivalent pore network topological structure of porous media in goaf. J. North China Inst. Sci. Technol.. 2022;19:1-6.
- [CrossRef] [Google Scholar]
- Coal fires in China over the last decade: a comprehensive review. Int. J. Coal Geol.. 2014;133:72-99.
- [CrossRef] [Google Scholar]
- Pathways for production of CO2 and CO in low-temperature oxidation of coal, Energy. Fuel. 2003;17:12-1-12-8.
- [CrossRef] [Google Scholar]
- Free radicals, apparent activation energy, and functional groups during low-temperature oxidation of Jurassic coal in Northern Shaanxi. Int. J. Min. Sci. Techno.. 2018;28 469+474-475+470-473
- [CrossRef] [Google Scholar]
- Effects of CO2 adsorption on molecular structure characteristics of coal: Implications for CO2 geological sequestration. Fuel. 2022;321:124155
- [CrossRef] [Google Scholar]
- Comparative study of experimental testing methods for characterization parameters of coal spontaneous combustion. Fuel. 2020;275:117880
- [CrossRef] [Google Scholar]
- Molecular simulation of coal-fired plant flue gas competitive adsorption and diffusion on coal. Fuel. 2019;239:87-96.
- [CrossRef] [Google Scholar]
- An application of entransy dissipation theory to heat exchanger design. J. Eng. Thermophys-RUS.. 2009;30:2090-2092.
- [Google Scholar]
- Oxidation characteristics of coal by STA-FTIR experiment. J. China Coal Soc.. 2018;43:1031-1040.
- [CrossRef] [Google Scholar]
- A review on numerical solutions to self-heating of coal stockpile: Mechanism, theoretical basis, and variable study. Fuel. 2016;182:80-109.
- [CrossRef] [Google Scholar]
- Experiment and modeling study on CO2 adsorption-desorption-diffusion of anthracite. J. Exp. Mech.. 2021;36:753-761.
- [CrossRef] [Google Scholar]
- Microwetting dynamic behavior and mechanism for coal dust based on low field NMR method—A case study. Fuel. 2021;297:120702
- [CrossRef] [Google Scholar]
- Dynamic characteristics for evolution process of semi-closed coal fire. J. Southwest Jiaotong Univ.. 2023;58:117-124.
- [CrossRef] [Google Scholar]
- Study on the coupling evolution of air and temperature field in coal mine goafs based on the similarity simulation experiments. Fuel. 2021;283:118905
- [CrossRef] [Google Scholar]
- Design and performance of a novel foaming device for plugging air leakage in underground coal mines. Powder Technol.. 2018;344:842-848.
- [CrossRef] [Google Scholar]


