

Translate this page into:
Ten years of Arabian Journal of Chemistry: A bibliometric analysis
⁎Corresponding author. waseem_anw@yahoo.com (Waseem Hassan)
-
Received: ,
Accepted: ,
This article was originally published by Elsevier and was migrated to Scientific Scholar after the change of Publisher.
Peer review under responsibility of King Saud University.
Abstract
Since 2009, Scopus database is regularly covering the Arabian Journal of Chemistry (AJC). Ten years of continuous and successful journey motivated us to celebrate its contribution through the 1st comprehensive bibliometric study. For simplicity we will divide the abstract in four (4) parts. In part 1, the publications and citations details are provided. From 2009 to 2019, the total number of publications (TP) were found to be 2134, majorly comprising of research articles (n = 2009/94.14%) and reviews (n = 119/5.57%). The relative per year growth rate (%) from 2009, one way analysis of variance (ANOVA) and the doubling time was calculated. The details of impact per publication (IPP), SNIP, % self cit, citation per document, external cites per document, self-citations and total cites are also provided. In part 2, the lists of top ten (10) authors, institutions and countries are described with total number of publications (TP), h-index, total citations (TC), h-index without selfcitations (WSC) and total WSC. We also discussed and provided the list of top ten (10) most cited documents with TC, WSC and other Scopus metrics like Crossref citation indexes, Mendeley reader and field-weighted citation impact. In 3rd part, various other parameters were presented as visualization map, using VOSviewer. Precisely, the co-authorship, citations and co-citations patterns were described in detail. While, based on the co-words analysis of titles, abstract and authors keywords, we proposed the overall trend of publications in AJC. In part 4, we will specifically mention that in 2019, SCImago journal rank has declared AJC in Q1 (1st Quartile) state while Scopus has ranked it at 22nd (in 281 general chemical engineering journals) and 45th position (in 398 chemistry journals). From Web of Science (after 2009), we also retrieved the data about the journal AJC impact factor, 5 year impact factor, immediacy index and average journal impact factor percentile. The data confirms that AJC showed a continuous growth in the number of publications, citations, impact factor and ranking.
Keywords
Arabian Journal of Chemistry
Scopus and Bibliometry

1 Introduction
Bibliometric analysis is the quantitative analysis of research articles, min-reviews and reviews, etc. The term Bibliometrics was introduced by Pritchard in 1969 (Pritchard, 1969). It helps in measuring the output of authors, journals, institutions and/or countries. This also helps in indentifying the national and international networks and decoding the development or pattern of publications in a particular field (Osareh, 2009). The primary focus of bibliometry is to study the pattern of scientific publications (Zeleznik et al., 2017). While, it also help in decoding the trends, correlation and relationship in the titles, abstracts and author keywords. One of the salient features of bibliometrics is to explore the growth of particular research area. For the purpose, citations and geographical distribution, etc. are critically analyzed (Kamdem et al., 2016, 2017).
Although bibliometric analysis has long been considered as a subfield of information and library sciences, it has considerably gained the attention of the scientific community since the past decade. This can be explained at least, in part by the fact that such studies provide a retrospective of the research trends covered by a particular journal. The authors also celebrated their decades of contributions. For example, the golden jubilee of the transportation research journal (Modaka et al., 2019), the forty years anniversary of computers & chemical engineering (Modak et al., 2020), the publication growth of safety science journal (Merigóa et al., 2019), the golden jubilee of quality & quantity journal (Mastur et al., 2019), the 30 years anniversary of the computer integrated manufacturing journal (Laengle et al., 2018a,b) and the 25 years of new emerging trends in group decision and negotiation journal (Laengle et al., 2018a,b). Interestingly in all of the stated reports the authors employed the Web of Science (WOS) for data retrieval. Majorly the authors tried to identify and cover various trends by using bibliometric parameters like number of publications, co-authorship, citation, co-citation, co-words analysis and bibliometric coupling. While, recently we performed the forty years bibliometric analysis of food chemistry (Kamdem et al., 2019) and celebrated the golden jubilee of chemico-biological interactions (Hassan et al., 2020). In all of the stated reports, the authors used VOSviewer software for analysis. Indeed, from these analyses, particularly those of top cited papers, it was possible to indicate some critical sub-areas of the journals that should be further developed.
The Arabian Journal of Chemistry (AJC) mostly publishes papers about organic, inorganic, physical, analytical and biochemistry. It has successfully completed its first decade. To the best of our knowledge no study has reported its bibliometric analysis. The purpose of the present report is to celebrate the 1st decade of AJC since 2009 and get some insights about the journal research trends. We will also explore the main contributors both in terms of individuals and institutions in a dynamic way. Furthermore, based on the most cited papers and authors, we also expect to give some qualitative indications to the journal further development, namely by identifying the main and the underdeveloped sub-areas of chemistry covered by the Arabian Journal of Chemistry
Through bibliometrics, we will cover the five (5) major aspects.
The performance analysis.
The major objective of performance analysis is to find out the top ranked scientific actors (researchers, institutions and countries, etc.) in AJC. The analysis is purely based on the number of publications and citations. In this part, we will also determine the growth rate, doubling time and perform the one way ANOVA.
The science mapping analysis (SMA):
On the other hand, SMA helps in defining the social structure of a particular research field by temporal representation. The graphical overview of the bibliographic data of AJC will be provided by using visualization of similarities (VOSviewer) software.
The next question is what has been covered in a particular area, or in our case a particular journal (AJC)? For the purpose, the co-words analysis or co-occurrence technique can be applied.
We will extend the idea, and will provide details about the top ten most cited documents.
In the last section, we will provide details about the different indicators, which are used to describe the impact of a journal. For example, one of the key indicator is SNIP (source normalized impact per paper), developed by Henk Moed in 2009. Other indicators in the series are impact per publication (IPP) and percentage of self citations of a source (% self cit). These indicators have been calculated based on the Scopus data. Scopus also helps in defining the journal ranking based on the citescore. SJR (SCImago Journal Rank) provides information about the quartile (Q) data of the journals. Infact it also helps in ranking of a particular journal in the relevant category. The data about these parameters will be taken from Scopus. Infact, we will also provide the per year total cites, journal impact factor, impact factor without journal self cites, 5 year impact factor, immediacy index, citable items and % articles in citable items. The data will be retrieved from the journal citation report (JCR) or WOS. We believe that the ranking details will help to describe the overall quality and progress of the AJC.
2 Materials and methods
2.1 Source of information
Numerous databases such as Google Scholar, Web of Science, and Scopus have been used for bibliometric analysis and some authors have compared their effectiveness (Martín-Martín et al., 2018; Moral-Muñoz et al., 2020). Infact in March 2020, Michael Gusenbauer and Michael Gusenbaue published an interesting article. The authors systematically evaluated and compared the qualities of 28 search systems including WOS and Scopus. In analysis they applied 27 different evaluating criteria’s. The authors concluded that it is very hard to identify and point out (collectively) the ranking of these international search engines or databases. Infact they provided the details about the limitations of all search systems and concluded that certain search systems perform better or worse than others. They also suggested that each researcher or reviewer must have considerable knowledge of the search engines or databases they intend to use (Gusenbauer and Haddaway, 2020).
In the current study, we used Scopus database (Elsevier BV Company, USA). The data was retrieved in June 2020 using the name “Arabian Journal of Chemistry” and ISSN of the journal. However, the publications from 2009 to 2019 were analyzed in detail. The authors collected and downloaded the data in csv format. Later it was quantitatively and qualitatively analyzed in Microsoft Excel 2013 for access type, year, author name, document type, key words, affiliations and country. While some ranking details was retrieved from the journal citation report (JCR) or WOS.
2.2 Visualization maps
Several authors have analyzed different software tools to show the spatial representation of the relationship among authors, institutions, countries, keywords, etc. (Bankar and Lihitkar, 2019; Moral-Muñoz et al., 2019, 2020). The list of software tools for conducting science mapping includes but not limited to Bibexcel, Bibliometrix, BiblioMaps, CiteSpace, CitNetExplorer, SciMAT, Sci2Tool and VOSviewer. A recent study by Moral-Muñoz et al. (2020) revealed that these software tools have a variability of features and that almost all of them can import data downloaded from Scopus and Web of Science. Therefore, it is up to the user to use the software tool that could provide suitable indicators (e.g., total publications, number of citations, most cited papers) for the desired analysis.
Here, we decided to use VOSviewer version 1.6.9 for viewing and creating the desired bibliometric maps. Compared to others such as SciMAT, CiteSpace and Bibliometrix, Vosviewer has a great visualization with the capability of loading and exporting data from many sources such as Scopus, Web of Science, PubMed, Dimensions, and RIS format. In addition, it is possible to construct and visualize the co-occurrence networks of important terms extracted from the scientific literature (Cobo et al., 2011; Moral-Muñoz et al., 2020). The software was developed by Van Eck and Waltman for constructing and visualizing bibliometric networks. For more information, please see http://www.vosviewer.com/. By default, at most 1,000 lines are displayed and represent the 1,000 strongest links between items. The distance between two items in the visualization approximately indicates the relatedness of the items. The results are presented as network visualization maps.
2.3 Relative growth rate and doubling time
The relative growth rate was calculated as follow.
The doubling time for publications can be calculated by using the following equation: where
RGR(1-2) is mean Relative Growth Rate over the specified period
Loge 2w = log of initial number of publications
Loge 1w = log of final number of publications
2T−1T = The unit difference between the Initial time and Final time
And; Where
GR = Growth rate.
2.4 Statistical analysis
The statistical analyses were performed using Eviews 8.0. ANOVA F test was applied to check the significance. Differences were considered significant if p < 0.05. Results are presented as means ± standard error of the mean.
3 Results and discussions
The results and discussion section is divided in the following sections.
The Performance Analysis
3.1 Section One (1): The Publication and Citation Structure of AJC
3.2 Section Two (2): The Top 10 Authors, Institutes and Countries
The Science Mapping
3.3 Section Three (3): The VOSviewer analysis
3.1.1 The construction of the Co-Authorship networks
-
Co-Authorships by Authors
-
The Institutional Co-Authorship Analysis
-
The Country Co-Authorship Analysis
3.3.2 The Citations Analysis of Authors, Institutes and Countries
3.3.3 The Co-Citation Analysis
The Co-Words Analysis
3.3.4 The Co-Occurrence in Titles, Abstracts and Keywords
The Top Ten Most Cited Documents
3.4 Section Four (4): The Brief Description of the Top Ten (10) Most Cited Documents
The Ranking Details
3.5 Section Five (5): The Ranking Details of AJC
3.1 Section One (1): The Publication and Citation Structure of AJC
From 2009 to 2019, AJC has successfully published 2134 research documents. Four (4) types of documents are published by AJC, comprising of research articles (n = 2009/94.14%), reviews (n = 119/5.57%), errata (n = 4/0.8%) and editorial (n = 1/0.046). One document was undefined.
The list of per year publications is presented in Fig. 1. The highest number of documents were published in 2017 (n = 615), followed by 2019 (n = 519) and 2016 (n = 370). We will specifically mention that the number of publications regularly increased from 2009 (n = 17) till 2017 (n = 615). However a significant decline is noticed in 2018, where only 118 documents were published. Its hard to explain such a huge decline in a single year (2018), because it significantly depends on various factors i.e. authors, universities, research interests, submissions, subscriptions, editorial handling, tough decisions, rejections policies or acceptance criteria, reviewers quality and work ethics, etc.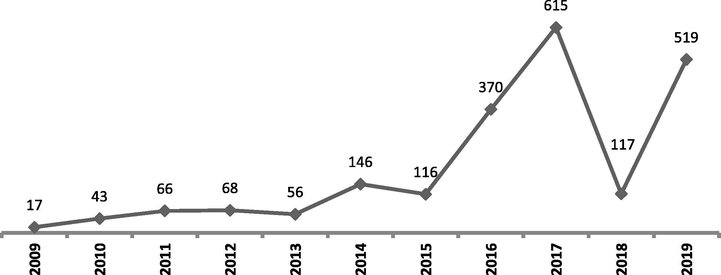
List of per year publications.
Although the annual number of publications increased, but considerable fluctuations in growth rate can be observed as described in Table 1. Precisely the highest growth rate was observed for the year 2018–2019 (3.44%), followed by 2015–2016 (2.19%) and 2013–2014 (1.61%). By a close observation of the data in Table 1, it is apparent to see that the growth has consistently decreased from 2010 (n = 1.53) to 2013 (n = -0.18). The simple hypothesis is that a decrease in growth rate can increase the doubling time, or vice versa. Its important to note that doubling time is the time required to double the number of publications. This is exactly what we can observe in the data (Table 2). For example, a decreasing trend in the growth rate for the years 2010–2013 was observed i.e. 1.53, 0.53, 0.03 and −0.18, respectively. Consequently, a higher doubling time for the years 2010 to 2013 was found for the stated years i.e. 0.5, 0.9, 1.6 and 2.67. In the same vein, in 2014 a higher growth rate can be noticed i.e. 1.61, which lead to decrease doubling time (n = 1.5). The shortest doubling time was noticed for the years 2016 (n = 1.3) and 2017 (n = 1.3). The number of publications significantly decreased in 2018 (n = 118), which caused a significant decrease in growth rate (−0.81) with longest doubling time (n = 9.2). In conclusion, the average per year growth rate was found to be 0.879 and the average doubling time was 2.3 as shown in Table 2.
Year
Number of Publications (#)
%age
RGR
% Growth
(Pi-AP)
(Pi-AP)2
2009
17
1.92
–
–
−176.909
31296.83
2010
43
4.85
1.53
152.94
−150.909
22773.55
2011
66
7.44
0.53
53.49
−127.909
16360.74
2012
68
7.67
0.03
3.03
−125.909
15853.1
2013
56
6.31
−0.18
−17.65
−137.909
19018.92
2014
146
16.46
1.61
160.71
−47.9091
2295.281
2015
116
13.08
−0.21
−20.55
−77.9091
6069.826
2016
370
41.71
2.19
218.97
176.0909
31008.01
2017
615
69.33
0.66
66.22
421.0909
177317.6
2018
118
13.19
−0.81
−80.98
−76.9091
5915.008
2019
519
58.51
3.44
343.59
325.0909
105684.1
Years
Numbers
Cumulative
W1
W2
R(a)
W2-W1Mean R(a)
(1–2)Doubling Time Dt(a)
Mean Dt(a)
(1–2)
2009
17
17
0.0
2.8
0.0
0.4
0.0
2.3
2010
43
60
2.8
4.1
1.3
0.5
2011
66
126
4.1
4.8
0.7
0.9
2012
68
194
4.8
5.3
0.4
1.6
2013
56
250
5.3
5.5
0.3
2.7
2014
146
396
5.5
6.0
0.5
1.5
2015
116
512
6.0
6.2
0.3
2.7
2016
370
882
6.2
6.8
0.5
1.3
2017
615
1497
6.8
7.3
0.5
1.3
2018
117
1614
7.3
7.4
0.1
9.2
2019
519
2133
7.4
7.7
0.3
2.5
We also tried to explore the variation in per year publications. For the purpose, we calculated the difference between individual year papers and average papers in Excel, 2007. The details are depicted in Table 1. The mean and the standard deviation were found to be 194 and 198.53, respectively. Furthermore, we applied ANOVA F test by Eviews 8.0. The “p” value was found to be (0.0000), which confirms the significance and model fitting. We also replicated the mean and standard deviation in Eviews calculus. The results are shown in Table 3.
Test for Equality of Means of Papers
Categorized by values of Papers
Included observations: 11
Method
df
Value
Probability
Anova F-test
(3, 8)
43.44751
0
Analysis of Variance
Source of Variation
df
Sum of Sq.
Mean Sq.
Between
3
408519.3
136173.1
Within
8
25073.58
3134.198
Total
11
433592.9
39417.54
Category Statistics
Papers
Count
Mean
Std. Dev.
Std. Err. of Mean
[0, 200)
9
91.43434
55.98391
18.6613
[200, 400)
1
370
NA
NA
[400, 600)
1
519
NA
NA
[600, 800)
1
615
NA
NA
All
12
193.9091
198.5385
57.31313
Its worthy to note that citations play a fundamental role in elucidating or describing the quality of a journal. We provided the citation pattern of the AJC. The collected data is organized in a yearwise pattern and is presented in Table 4. The total citations for AJC yearly increased. Infact in the last three year, 2017, 2018 and 2019, it reached the pinnacle i.e. 1707, 3636 and 4959, respectively. The details about citation per document (based on the three years record), external citations per documents, self citations and total citations are also provided in Table 4. As apparent from the data the citations and external citations consistently increased yearwise. Similarly, when a reference is referred to an article from same previous journal is term as self-citation. Appropriate self-citation provides information about the originality of data but on the other side it carries some limitations like it has negative effect on the journal impact factor. One of significant disadvantage of self-citation is that it can bias the citation rate as multiple authors own single research document and their self-citation manipulate the citation rate. Moreover, it also cast negative shadows on author impact factor. In Table 4 we provided complete details of the self-citation data of AJC. In all years the % self-citations remained below 4%. In addition, our finding indicates that in 2010–2011 and 2016–2017, the % self-citations was zero percent (0.00%), which shows an impressive tendency.
S#
Year
Citation per Document (3-years)
External Cites Per Document
Self Cites
Total Cites
P
IPP
SNIP
% Self Cit
1.
2010
0.412
0.412
0
7
17
0.24
0.33
0.00%
2.
2011
1.15
1.117
2
69
60
0.87
0.59
0.00%
3.
2012
1.81
1.754
7
228
126
1.51
1
3.70%
4.
2013
2.057
2.017
7
362
176
1.84
0.98
2.20%
5.
2014
2.455
2.38
14
459
186
2.24
1.6
3.40%
6.
2015
2.782
2.767
4
740
266
2.61
1.59
0.60%
7.
2016
3.13
3.102
9
986
315
2.89
2.24
0.00%
8.
2017
2.705
2.629
48
1707
632
2.45
1.8
0.00%
9.
2018
3.305
3.286
21
3636
1101
3.06
1.61
0.60%
10.
2019
4.508
4.444
71
4959
1101
4.26
2.35
1.60%
In the same vein, we will also mention that the Centre for Science and Technology Studies (CWTS), Leiden University has developed CWTS Journal Indicators, which provides detail information about the quality or rankings of the journals. Based on the Scopus data, they provide and use four (4) indicators,
-
P (number of publications in the last three years).
-
IPP (impact per publication), It was previously known as RIP (raw impact per publication).
-
SNIP (source normalized impact per publication),
-
% self cit. (percentage of self citations of a source).
Herein, we provided the yearwise details of (P, IPP, SNIP and %self cit) as shown in Table 4. The P and IPP trends increased. While, the SNIP followed a regular trend in growth, except 2016 and 2017 where it decreased as compared with earlier years. In all years the % selfcitations remained below 4%. Infact, in 2010–2011 and 2016–2017, the % self-citations was zero percent (0.00%). The data confirms a significant growth in the stated parameters.
3.2 Section two (2): the top 10 authors, institutes and countries
This part of the manuscript is dedicated to the researchers, institutes and countries who have significantly contributed to AJC. The data obtained from Scopus will be presented on the basis of several bibliometric indicators or parameters. For example,
-
Total number of publications (TP),
-
Total number of citations (TC),
-
H-index,
-
Citation per paper or document (CPD) and
-
H-index with and without self-citations.
-
Self-citations
TP and TC are the two basic indicators used for evaluating the overall volume and quality of scientific publications. The indicator TP is used to depict the most productive authors, institutions, and countries. However the quality of publications is directly measured by the number of citations. Therefore TC indicator helps in measuring the quality of scientific papers. Infact it is used to acknowledge and trace the source/journal and the concept and methodology of a researcher. The C/P or average citations per paper are useful in comparative studies. Its worthy to note that H-index or H factor (high citations) was proposed by an American scientist, Hirsch in 2005. H-factor represents both the productivity and citation impact of a particular researcher or a group of researchers (such as departmental or institutional). H-index has been widely considered as a reliable and authentic parameter to quantify an individual’s scientific achievements (Bornmann et al., 2007). The h-index is calculated by counting the number of publications for which an author has been cited at the same number of times. For instance, an h-index of 10 means that a scientist has published 10 articles and each has been cited at least 10 times. If the researcher’s 11th publication was cited only 5 times, the h-index would remain at 10. Or in other words, if the scientist's 11th publication was cited 11 or more times, the h-index would rise to 11 (Bornmann et al., 2012). Both H-index and C/P offer further, more granular information on the journal publication’s impact. Self-citation is a reference to an article from the same journal. It is an important indicator normally applied to decode the original quality of a document or a source.
We provided details of top 10 authors, institutes and countries. Its worthy to note above stated parameters i.e. number of publications, h-index, total citations (TC), h-index without self citations and total citations without selfcitations were added in the respective tables.
The list of top ten authors is provided in Table 5. Based on the number of publications Narasimhan, B. is top ranked author with (14) publications, followed by Isloor, A.M., Asiri, A.M, Salih, N and Salimon, J. with 12, 11, 11, 11 and 11 publications respectively.
S#
Author Name
TP
h-index
TC
h- index (WSC)
WSC
Citation Per Document
1.
Narasimhan, B.
14
6
96
6
87
7
2.
Isloor, A.M.
12
9
283
8
271
24
3.
Asiri, A.M.
11
5
59
5
52
5
4.
Salih, N.
11
8
253
7
226
23
5.
Salimon, J.
11
8
253
7
226
23
6.
Pal, M.
10
3
20
3
19
2
7.
Fun, H.K.
9
7
211
6
197
23
8.
Siddiqui, M.R.H.
9
8
122
7
94
14
9.
Yousif, E
9
7
237
6
212
26
10.
Asiri, A.M
8
5
62
5
54
8
The list of top 10 institutes is provided in Table 6. Based on the number of publications, King Saud University is the top ranked institute with 125 publications followed by King Saud King Abdulaziz University (n = 56), Islamic Azad University (n = 37), Cairo University (36), and Payame Noor University (n = 36). The yearwise publications details (from 2009 to 2019) about the top ten institutes are given in the Table 7. We will only mention the top three institutes here. KSU published the highest number of publications in the year 2017 (n = 27), followed by 2019 (n = 19) and 2016 (n = 17). KAU published the highest number of publications in 2012 (n = 16) however after that low increase in publications can be observed. Infact after 2013 five or less than five documents per years have been published. CU followed exactly the same trend. The highest documents were published in 2012 (n = 16), after that four or less than four documents were published each year. Infact in the last three years (2017–2019), only three publications are recorded.
S#
Name of Institute
TP
h- Index
TC
h- index (WSC)
WSC
Citation Per Document
1.
King Saud University, Saudi Arabia (KSU)
125
25
2566
22
2350
21
2.
King Abdulaziz University, Saudi Arabia (KAU)
56
17
1791
17
1740
32
3.
Islamic Azad University, Iran (IZU)
37
11
434
11
406
12
4.
Cairo University, Egypt (CU)
36
11
467
9
409
13
5.
Payam Noor University, Iran (PNU),
36
11
255
10
246
7
6.
Aligarh Muslim University, India (AMU)
35
13
444
11
391
13
7.
National Research Center Cairo, Egypt (NRCC),
33
15
906
14
815
27
8.
Ain Shams University, Egypt (ASU)
31
13
717
13
655
23
9.
Centre National de la Recherche Scientifique, France (CNRS)
25
10
210
10
181
8
10.
Shahid Bahonar University of Kerman, Iran (SBU
25
10
266
10
249
11
Institute
2009
2010
2011
2012
2013
2014
2015
2016
2017
2018
2019
(KSU)
TP
125
4
9
5
5
11
13
9
17
27
6
19
TC
2566
0
6
16
35
56
128
224
321
448
563
769
(KAU)
TP
56
3
1
4
4
1
5
5
4
16
2
11
TC
1791
0
1
10
25
49
80
125
236
293
472
500
(IZU)
TP
37
0
0
0
2
0
3
1
5
18
1
7
TC
434
0
0
0
7
4
13
20
49
94
115
132
(CU)
TP
36
3
1
1
1
2
1
4
1
16
2
4
TC
467
0
2
5
17
7
13
37
48
78
120
140
(PNU)
TP
36
0
1
0
2
1
1
2
8
15
1
5
TC
255
0
1
7
6
15
18
23
26
37
51
71
(AMU)
TP
35
0
0
1
1
2
2
1
8
11
1
8
TC
444
0
0
1
4
5
21
32
51
72
103
155
(NRCC)
TP
33
0
2
2
3
1
4
3
6
7
3
2
TC
906
0
1
14
35
39
52
86
128
164
181
206
(ASU)
TP
31
0
1
5
3
3
3
1
8
4
1
2
TC
717
0
0
8
23
28
59
76
113
109
147
154
(CNRS)
TP
25
0
1
0
0
1
2
0
2
6
1
12
TC
210
0
0
3
1
1
6
19
28
36
49
67
(SBU)
TP
25
1
0
1
8
1
1
0
6
4
1
2
TC
266
0
1
2
7
13
22
32
42
40
63
44
We also analyzed the top three universities by Vosviewer. Three fundamental factors i.e. total number of co-authors, institutes and collaborations with international countries were elucidated. In KSU publications (n = 147), total 496 authors, 339 institutes and collaboration with 29 countries were observed. Which is significantly higher than KAU, where 232 authors, 166 institutes and 22 countries were found. In CU publications, total 127 authors, 86 institutes and only 8 collaborating countries were noted. Another important factor is funding. Collectively 21 funding sponsors were acknowledged. Precisely, Deanship of Scientific Research, King Saud University was acknowledged in 48 publications, followed by King Saud University, College of Dentistry, King Saud University, which were acknowledged in 25 and 5 publications, respectively. In KAU publications, the University itself (King Abdulaziz University) was acknowledged in 21 publications, followed by Deanship of Scientific Research, King Faisal University and University Grants Committee, which was acknowledged. Both were acknowledged in only two publications, respectively. Sixteen (16) other sponsors were acknowledged in only one publication. In CU publications, only four sponsors were acknowledged. The highest was noted for Science and Technology Development Fund (in 2 publications), followed by Alexander von Humboldt-Stiftung, Cairo University and Deanship of Scientific Research, King Saud University, these three sponsored were acknowledged in three publications. We also provided the citations details of the top ten institutes. As shown in Table 7, the per year citations for all institutes increased.
In all publications (n = 2134), eighty eight (88) countries from different geographies have significantly contributed. The data is depicted in Table 8. Based on the number of publications, Asia can be declared as the top continent. 16 different countries have contributed in all (n = 1019/47.75%) publications. The top three countries in this region are India (n = 678), China (n = 126) and Malaysia (n = 104). Middle East is the 2nd dominant region, which has contributed in 817 publications (38.28%). The top three countries are Saudi Arabia (302), Egypt (282) and Iran (228). Twenty Nine (29) countries from Europe have contributed in 323 publications (or 15.14%). France (79), Turkey (43) and Italy (32) are the top three countries with maximum number of publications. Interestingly Africa has contributed with the same number of publication as Europe (323/15.14%). Precisely, 13 countries have contributed in all publications. Algeria (71), Tunisia (61) and Morocco (48) are the top three countries. South America, North America and Ociana have collectively contributed with only 125 publications. Although, 15 countries from these three regions were directly involved in publications.
Continents
No of Countries
No of Pub
% age
H-Index
Total Citations
Asia
16
1019
47.75
51
16,048
Middle East
15
817
38.28
49
15,220
Europe
29
323
15.14
30
4106
Africa
13
323
15.14
35
4325
South America
10
60
2.81
10
364
North America
3
57
2.67
13
782
Ociana
2
8
0.37
5
131
Irrespective of the region, the list of top 10 countries is described in Table 9. Based on the number of publications, India is the country with the highest production with 678 (31.77%) documents, followed by Saudi Arabia (302/14.15%), Egypt (282/13.21%), Iran (228/10.68%) and China (126/5.90%), respectively. While, based on total citations, India (n = 7893) is the top country followed by Saudi Arabia (n = 5883), Egypt (n = 5410), Iran (n = 2170) and Malaysia (n = 1565). However based on the H-index, the top five countries are India (n = 42), Saudi Arabia (n = 36) Egypt (n = 32), Iran (n = 25), Malaysia (n = 22) and China (n = 20). Similarly, we can also depict the publications and citations data as citation per document. In this way, the top five countries are Saudi Arabia (CPD = 19), Egypt (CPD = 19), followed by Pakistan (CPD = 15), Malaysia (CPD = 5) and India (CPD = 2).
#
Country
TP
h-index
TC
h- index (WSC)
WSC
Citation Per Document
1.
India
678
42
7893
40
7018
12
2.
Saudi Arabia
302
36
5883
34
5442
19
3.
Egypt
282
32
5410
31
4956
19
4.
Iran
228
25
2170
24
1948
10
5.
China
126
20
1283
19
1190
10
6.
Malaysia
104
22
1565
22
1384
15
7.
Pakistan
80
19
1204
18
1100
15
8.
France
79
17
755
15
624
10
9.
Algeria
71
17
689
14
599
10
10.
Tunisia
61
18
623
18
554
10
We extended the idea and provide the per year publications details of the top ten countries. The details are provided in Table 10. India has published the highest number of publications (n = 211) in 2017, followed by 2016 (n = 151) and 2019 (n = 151). The 2nd country Saudi Arabia published the highest number of documents in the year 2017 (n = 75), followed by 2019 (n = 57) and 2016 (n = 36). Apart from 2018, an overall increasing number of publication trend is observed for India and Saudi Arabia. Egypt has published the highest number of documents in 2019 (n = 56), followed by 2018 (n = 41) and 2017 (n = 29). Interestingly the gradual and consistent increase in publications has been observed. We also provided the per year citations details for the ten countries. Overall (per year) an increasing trend in citations can be observed for all countries.
Country
2009
2010
2011
2012
2013
2014
2015
2016
2017
2018
2019
India
TP
678
1
3
17
17
21
52
31
151
211
23
151
TC
7893
0
2
14
78
180
390
598
858
1275
1919
2579
KSA
TP
302
9
13
22
11
17
27
22
36
75
13
57
TC
5883
0
7
35
95
150
288
468
717
950
1389
1784
Egypt
TP
282
6
10
17
17
11
22
22
56
80
12
29
TC
5410
0
3
45
115
149
251
463
700
902
1266
1516
Iran
TP
228
1
3
3
14
3
11
17
43
88
4
41
TC
2170
0
2
9
31
63
107
162
267
363
556
610
China
TP
126
0
1
2
0
1
1
3
12
33
27
46
TC
1283
0
0
1
4
3
31
48
93
180
338
585
Malaysia
TP
104
0
2
0
3
3
11
7
16
27
11
24
TC
1565
0
0
8
15
25
54
122
187
263
407
484
Pak
TP
80
1
1
1
1
0
7
3
8
26
10
22
TC
1204
0
1
1
7
12
33
67
135
205
265
478
France
TP
79
1
2
2
2
4
6
1
11
21
3
26
TC
755
0
0
9
13
20
29
60
96
126
169
233
Algeria
TP
71
0
1
5
3
2
9
5
15
19
0
12
TC
689
0
0
3
15
30
45
57
91
110
145
193
Tunisia
TP
61
1
0
1
0
0
4
3
3
24
3
22
TC
623
0
0
3
3
6
17
38
63
107
154
232
3.3 Section three (3): the VOSviewer analysis
Considerable literature is available which confirms the importance of analysis of co-authorship, citations, and co-citation networks, etc. It has a long history, with early work dating back to the 1960 s (Kessler, 1963). In the present study we analyzed the following parameters by Vosviewer. Precisely, we presented the results as “science mapping”. The details of the analysis are given below.
3.3.1 Constructing the co-authorship networks
Co-authors, also called co-corresponding authors/senior authors/lead authors, are responsible to format and organize the information in written form. Co-authorship is an important aspect of scientific collaborations. It promotes team work among different scientific researchers to enhance productivity and achieve new scientific knowledge. Collaboration between co-authors may be intramural (i.e. between one department, institutes or any research group) or extramural (international collaboration) (Wolfgang and András, 2012). Infact, co-author analysis is considered as a powerful method used for the identification of leading authors, organizations and countries in particular research field. The scholarly publications of co-authors can be examined through different softwares to exhibit researcher’s collaboration through graphical visualization (Nianxin et al., 2016). Its important to note that co-authorship defines the “link” between researchers. Infact, the co-authorship networks can be constructed for researchers/authors, research institutions, and countries.
-
Co-Authorships by Authors
Co-authorship is a form of collaboration in which two or more authors contribute to a particular publication. In all publications (2134), the total numbers of authors were 6832. To draw the co-authorship network in VosViewer, we defined the minimum number of published articles to be five (5) with zero citations. Ninety Nine (99) authors were found to meet the threshold. Inorder to construct the map, Vosviewer, has calculated the total link strength between the authors. In map, each node represents an author and the node size indicates the number of published articles. The link connecting two nodes stands for the cooperative relationship between two authors, and the thickness of the link stands for the intensity of cooperation. In Vosviewer map (Fig. 2A-D), several clusters were generated representing 99 items or authors.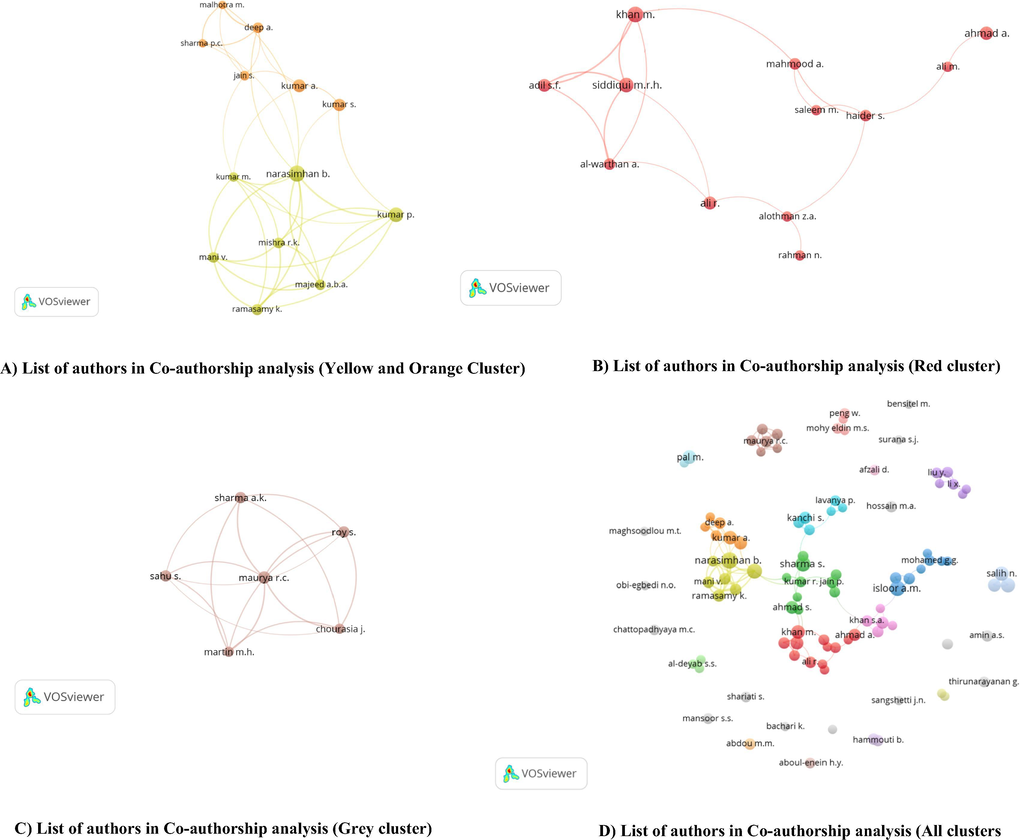
List of authors in Co-authorship analysis (A-D).
1st of all, we will shortly introduce a few clusters. For example,
-
In yellow cluster, there are seven (7) items or authors, which are further connected with six authors in orange cluster.
-
In red cluster, there are 12 items and
-
In grey cluster there are 6 items
Before elaborating the above clusters, its important to note that each author in all clusters has (individually) atleast five (5) publications.
In the yellow cluster, if we consider “Narasimhan B.” as the main author, he/she is connected with total 6 authors in yellow cluster named Kumar P., Majeed A.B.A., Ramasamy K., Mani V., Mishra R.K and Kumar, M. While, in the orange cluster Prof. Narasimhan B is connected with Kumar S., Deep A., Sharma PC., and Malhotra A M.
To understand it further, we explored the publication profile of “Narasimhan B.” Based on the Scopus data, he/she has published 14 documents in AJC with twenty six (26) co-authors. From yellow cluster, Kumar P has co-authored 8 publications, Ramasamy K., Majeed A.B.A., Mani V and Mishra R.K. have co-authored 7, while, Kumar M has co-authored 4 publications with “Narasimhan B”. From orange cluster, he/she has co-authored two publications with Deep A., and Malhotra, M. while, with Kumar, S. and Sharma, P.C., one publication has been co-authored. The total link strengths as derived by Vosviewer can also help in proper explanation. The highest link strength was recorded for Narasimhan B (n = 47), followed by Ramasamy K., (n = 37) Kumar P., (n = 37) Majeed A.B.A., (n = 37) Mani V (n = 37) and Mishra R.K. (n = 37). Since, low number of publications are jointly co-authored in orange cluster, therefore we found weak link strength as noted for Deep A (n = 12), Malhotra, M (n = 11), Sharma P., (n = 8) and Kumar S., (n = 5). The cluster is shown in Fig. 2A.
Its worthy to note that in research publication Prof. Narasimhan B, focused on the synthesis, antimicrobial, anticancer, antiviral evaluation and QSAR studies of various complexes or compounds like N-substituted benzene sulfonamides, p-coumaric acid, diazenyl schiff bases, gallic acid benzohydrazides, propionic acid and monochloroacetic acid derivatives.
The next cluster is red, where total 12 items are merged together. If we consider Siddiqui M.R.H. as the focal point, it can be seen that he is connected with five authors named Ali, R., Al-Warthan, Adil S.F, Khan M and Kamal A. To understand it further, from Scopus we retrieved the publication details of Siddiqui M.R.H. Total publications was found to be nine (9), co-authored by thirty eight (38) authors. Al-Warthan, A. has co-authored six (6), Adil, S.F has co-authored five (5), Khan M has three (3), Ali, R and Kamal A has co-authored one (1) publication with Siddiqui M.R.H. The cluster is shown in Fig. 2B.
While, in most of the publications Prof. Siddiqui Focused on studies synthesis, characterization, density functional theory (DFT) calculations, thermal studies and catalytic oxidations of Pd graphene nanocomposite, gold & silver nanoparticles, copper-manganese mixed oxide nanoparticles, substituted pyrroles and rhenium oxocomplex.
In grey cluster, Maurya R C., has been considered as the principal author. From Scopus we retrieved the publication details. In total he/she has seven (7) publications with sixteen co-authors. With Chourasia, J., Martin, M.H., and Sharma, A.K. five (5), with Roy, S., (4) and with Sahu S three (3) documents are mutually published. The highest link strength was recorded for Maurya R,C (22). For others the strength was found to be fifteen (n = 15). The cluster is shown in Fig. 2C. While, all clusters are described in Fig. 2D.
In his research Prof Maurya R C., principally focused on the synthesis, characterization, and 3D-molecular modeling and analysis of oxovanadium(IV) complexes, octa-coordinate mono- and binuclear-dioxouranium(VI) complexes, schiff bases derived from 4-butyryl-3-methyl-1-phenyl-2-pyrazolin-5-one, penta-coordinated manganese(II) chelates, cis-dioxomolybdenum(VI) complexes and oxoperoxomolybdenum(VI) chelates.
The Institutional Co-Authorship Analysis
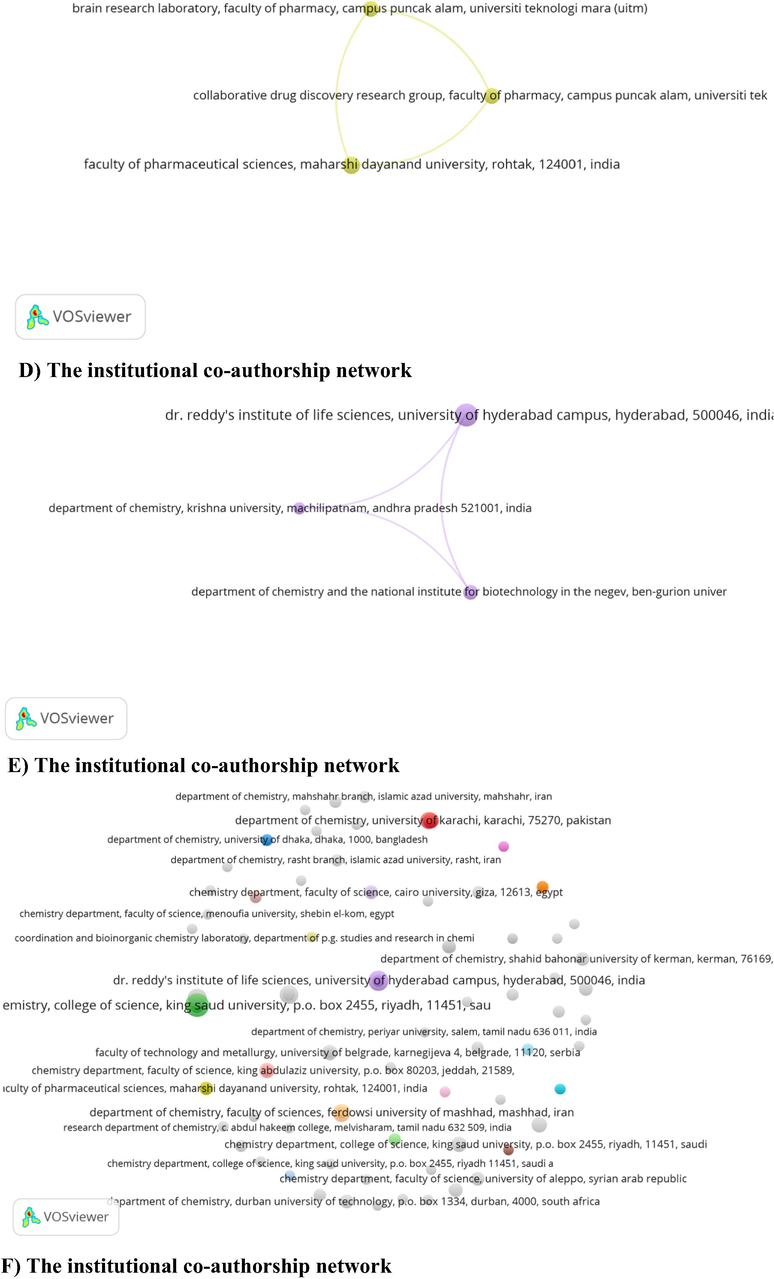
In all published documents, 4265 different institutions or departments were found. One hundred and seven (107), of them were directly involved in atleast three (3) publications. with zero (0) citations. The institutional co-authorship network is shown in Fig. 3.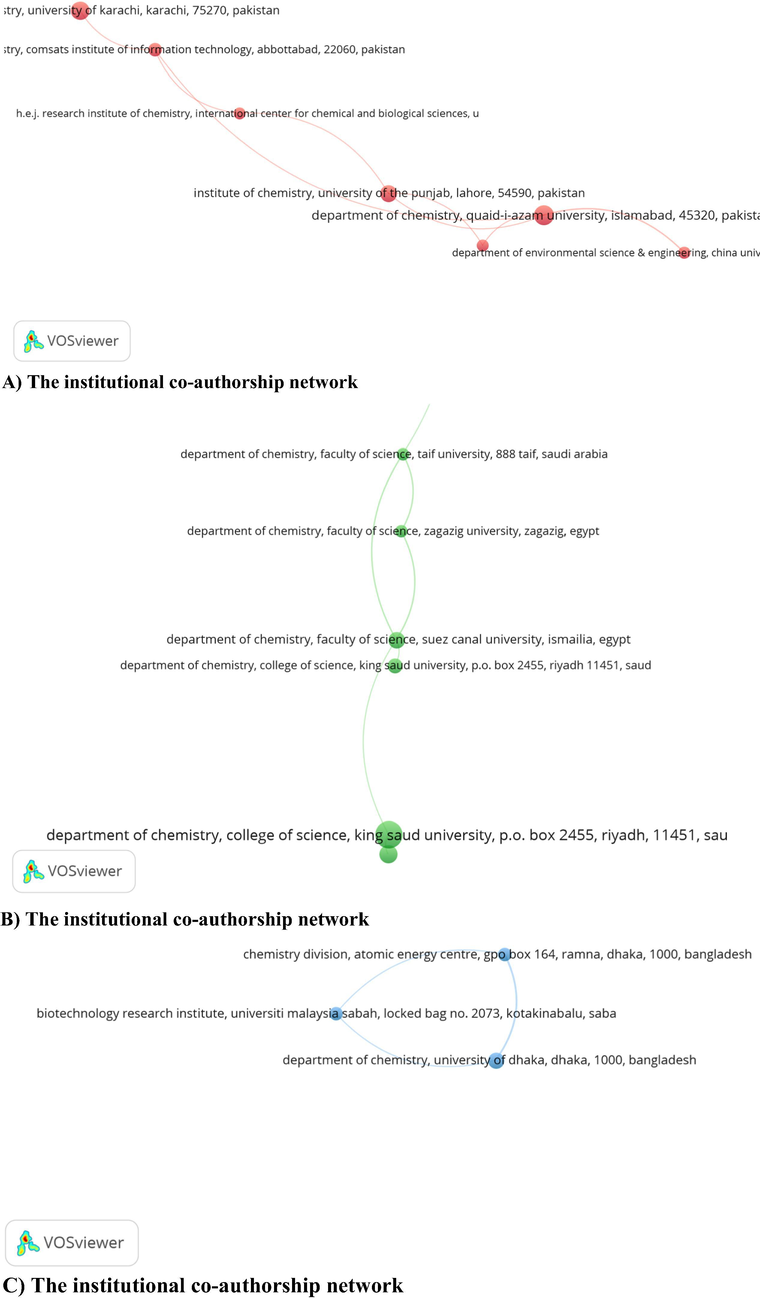
The institutional co-authorship network (A-F).
The institutional co-authorship network (A-F).
There are total sixty eight (68) clusters in Fig. 3A-F. We will briefly describe only three (3) clusters.
In red cluster there are total seven (7) items or institutes (Fig. 3). If we consider, Department Of Chemistry, Quaid-I-Azam University, Islamabad, 45320, Pakistan as the principal institute in the cluster, it is apparent that it is further connected with
Department Of Environmental Science & Engineering, China University Of Geosciences, Wuhan, China
Institute Of Biochemistry, University Of Sindh, Jamshoro 76080, Pakistan
Institute Of Chemistry, University Of The Punjab, Lahore, 54590, Pakistan
Some other individual clusters with names of the departments of universities are described in Fig. 3B-F.
The Country Co-Authorship Analysis
Country co-authorship analysis is an important form of co-authorship analysis (13–15). It can reflect the degree of communication and the most influential countries in a particular field. In total, 93 countries were directly involved in all publications in AJC. 54 countries were found from the data, with atleast five (5) publications and zero (0) citations. The size of circles represents the number of publications of the country and the thickness of lines depicts the size of collaboration. The data is presented in Fig. 4.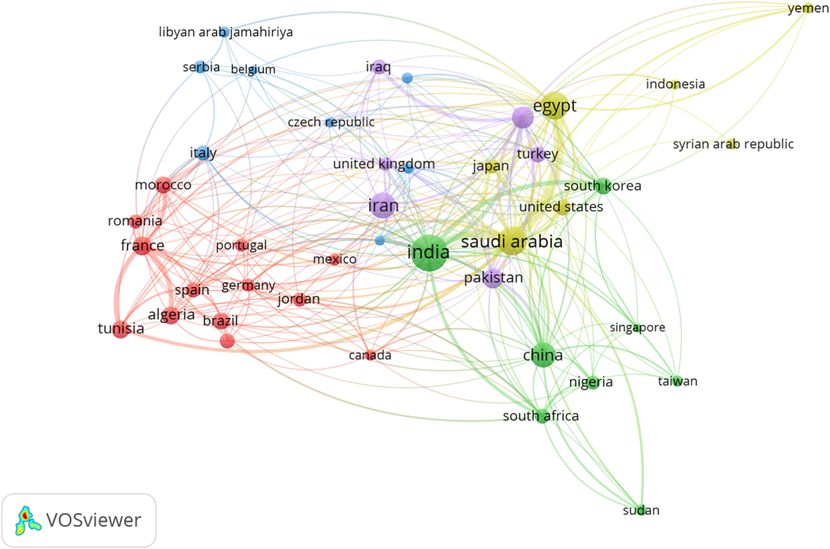
The Country Co-Authorship Analysis.
Since India the top leading country with maximum publications (n = 678), therefore we analyzed it on Vosviewer. The total authors in all publications were found to be 1948. However, forty three authors have atleast five publications. The top five authors are Narasimhan B (n = 14), followed by Isloor A.M. (n = 12), Kumar P (n = 12), Sharma S (n = 12) and Kumar A (n = 10).
We also noted more than 160 departmental or universities affiliations in India’s publications. The highest was recorded for Aligarh Muslim University (n = 35), followed by King Saud University (n = 25) and Jamia Hamdard Faculty of Pharmacy (n = 21). By a closer inspection of the image, it can be observed that India has a diverse co-authorship network with 44 countries. The top five in this series are Saudi Arbia (n = 47), followed by Malaysia (n = 17), South Korea (n = 17), South Africa (n = 12) and China (n = 6).
We also selected Saudi Arabia, another dense region found in the map. In total publications (n = 302), the highest collaboration was found with Egypt (n = 112), followed by India (47), Pakistan (n = 9), Tunisia (n = 6), South Korea (n = 13), Malaysia (10), China (n = 6), Japan (n = 6), Jordan (n = 6) and USA (n = 7).
Based on the number of publications, Egypt was the third highest country (n = 282). Which collaborated with Saudi Arabia (n = 112), Japan (n = 9), USA (n = 5) and South Korea (5). Yemen, Libya, Sudan, Germany, India and Kuwait were affiliated in 5 or less than 5 publications.
The scientific collaboration between authors may also help in developing social network between institutes and countries. Infact a single author’s contribution may help in institutional and international networking. For the purpose we focused on a single author and university to know their networking details.
Prof. Narasimhan, B. has the highest number of publications (n = 14), with 13 research articles and one review. Total twenty six (n = 26) co-authors have been found. Institutionally, Maharshi Dayanand University’s affiliation was found in all 14 publications, along with Universiti Teknologi Mara, I.S.F. College of Pharmacy, Akal College of Pharmacy, Guru Jambheshwar University of Science and Technology, KU Leuven, Kurukshetra University, Quaid-i-Azam University, Rega Institute for Medical Research. Briefly, these institutes were from India, Malaysia, Belgium and Pakistan.
Similarly, the King Saud University was found to be the top university with maximum i.e. one hundred and twenty five (125) publications. These mainly comprised of research articles (108), reviews (14) and three (3) errata. Precisely, 394 authors have been found in all publications (n = 125). Some of the top authors from this University is Khan, M (10), Siddiqui, M.R.H., (n = 9) and Isloor A.M (8) publications. Based on Vosviewer analysis more than 250 organizations were affiliated in all publications. Twelve (n = 12) of them were involved in atleast three (3) publications. More than one hundred and twenty (n = 120) different universities were affiliated in all publications. Some of the examples are, National Institute of Technology Karnataka, Jeonbuk National University, Alexandria University, Princess Nourah bint Abdulrahman University, Aligarh Muslim University, , Al-Azhar University, University of Tanta, Umm Al Qura University and Minia University etc.. All authors and/or institutes from 26 different countries like Egypt, India, South Korea, Pakistan, USA, China, Japan, Malaysia, Yemen, Australia, Germany, Jordan, Qatar, Sudan, Turkey, Belgium, Brazil, Ethiopia, France, Netherlands, Oman, Palestine, Portugal, Romania, Spain and Tunisia.
3.3.2 Citations analysis of authors, institutes and countries
When any scientific document like book, report, conference paper, and essay are referred or cited to another paper known as source paper is termed as citation. Citation determines the importance of any paper by its influence in citation network. Thus giving acknowledgment to the work of author which is cited in the reference list. It is worthy to note that the document which an author select for citation must be relevant to the work in which it is cited. The nature of citation is an attractive aspect to study for researchers because of its easy availability and unobtrusive nature. The scientific impact of an individual publication is of pivotal importance which can be measure by “citation impact indicators”, thus providing information not only about individual’s paper but also indicate information of Journal impact factor and the h index (Ludo, 2016). Citation analysis can be carried out using four different units in bibliometric analysis such as, authors, countries, and institution of affiliation and the most influential documents.
In AJC, total 6832 authors were involved in all publications. 74 authors were found with atleast five (5) publications and 50 citations. Al-warthan A. was found with highest citations (825) followed by Aboul-Enein H.Y. (619), and Kamoun E.A. (520). However, irrespective of the number of publications, the highest citations were recorded for Barakat M.A. (1439) followed by Al-Warthan A (825), Ammar R.A.A. (768), Aboul-Enein H.Y. (619) and Abou El-Nour K.M.M. (584). Its worthy to note that four (4), six (6), two (2) six (6) and two (2) published documents were observed for above stated authors with exact writing format of their names.
Institutionally, the highest citations were recorded for Chemistry Department, Faculty Of Science, Cairo University, Giza, Egypt (268) followed by Department Of Chemistry, College Of Science, Al-Nahrain University, Baghdad, Iraq (237), Department Of Chemistry, College Of Science, King Saud University, Saudi Arabia (212), Chemistry Department, Faculty Of Science, Benha University, Benha, Egypt (177) and Chemistry Department, Faculty Of Science, Zagazig University, Zagazig, Egypt (166).
While, irrespective of the number of publications, the highest citations were recorded for Department of Environmental sciences, Faculty Of Meteorology And Environment, King Abdulaziz University (Kau), Jeddah, Saudi Arabia (1273), followed by Chemistry Department, College Of Science, King Saud University, Riyadh, Saudi Arabia (588), Chemistry Department, College Of Science, King Faisal University, Al-Ahsa, Saudi arabia (584), Ataturk University, Faculty Of Arts And Sciences, Department Of Chemistry, Erzurum, Turkey (549), and Gaziosmanpaşa University, Faculty Of Science And Arts, Department Of Chemistry, Tokat, Turkey (549),
3.3.3 Co-citation analysis
In 1973 Henry Small introduced the concept of co-citation analysis. The major application is to understand a subject similarity between two documents. The two documents are said to be co-cited when they (both) appear in the reference list of a third document (Small, 1973). When two items (such as documents, journals and authors) are cited in a citing item’s reference list, they have a co-citation relationship. In other words, the co-citation analyses can generate various paradigms or clusters to exhibit the research trends and links within institutions, sources and authors. (McCain, 1986).
Co-Citations By Number of Cited References
Reference co-citation analysis is an important mean to detect the structure and evolutionary path of a specific domain. The reference co-citation analysis was conducted to see the trend within the cited references. Total, 77,867 cited references were noted in all publications. Out of that, 9 references were cited at least 10 times as shown in Table 11.
S#
Cited reference
Citations
1.
Ho, Y.S., Mckay, G., Pseudo-Second Order Model For Sorption Processes (1999) Process Biochem., 34, pp. 451–465
18
2.
Langmuir, I., The Adsorption Of Gases On Plane Surfaces Of Glass, Mica And Platinum (1918) J. Am. Chem. Soc., 40, pp. 1361–1403
18
3.
Geary, W.J., (1971) Coord. Chem. Rev., 7, p. 81
16
4.
Rahman, N.A., Halim, H., Gotoh, H., Harada, E., Validation Of Microscopic Dynamics Of Grouping Pedestrians Behavior: From Observation To Modeling And Simulation (2017) Eng. Heritage J., 1 (2), pp. 15–18
13
5.
Halim, H., Abdullah, R., Nor, M.J.M., Aziz, H.A., Rahman, N.A., Comparison Between Measured Traffic Noise In Klang Valley, Malaysia And Existing prediction Models (2017) Eng. Heritage J., 1 (2), pp. 10–14
12
6.
Furusjo, E., Svenson, A., Rahmberg, M., Andersson, M., The Importance Of Outlier Detection And Training Set Selection For Reliable Environmental Qsar Predictions (2006) Chemosphere, 63, pp. 99–108
10
7.
Hassan, S.R., Zaman, N.Q., Dahlan, I., Influence Of Seed Loads On Start Up Of Modified Anaerobic Hybrid Baffled (Mahb) Reactor Treating Recycled Paper Wastewater (2017) Eng. Heritage J., 1 (2), pp. 05–09
10
8.
Mosmann, T., Rapid Colorimetric Assay For Cellular Growth And Survival: Application To Proliferation And Cytotoxicity Assays (1983) J. Immunol. Methods, 65, pp. 55–63
10
9.
Sukor, N.S.A., Jarani, N., Fisal, S.F.M., Analysis Of Passengers’ Access And Egress Characteristics To The Train Station (2017) Eng. Heritage J., 1 (2), pp. 01–04
10
10.
Halim, N.I.A., Phang, I.C., Salicylic Acid Mitigates Pb Stress In Nicotiana Tabacum (2017) Sci. Heritage J., 1 (1), pp. 16–19
9
The Journal Co-Citation Analysis
Journal co-citation is of strong interest to the collection manager concerned with developing core journal lists, selecting journals and evaluating collections that serve particular research-oriented constituencies. The journal co-citation analysis is not only an efficacious way to study the structure and characteristics of a subject, but also reveals the overall structure of the subject and the characteristics of a journal (Hu et al., 2011). VOSviewer was used to plot the journal co-citation network.
Total cited sources were found to be 13278. Precisely, 38 sources were selected with 300 citations. The list of top ten co-cited sources is described in Table 12. Some of the top sources are J. Hazard. Mater, J. Am. Chem. Soc, Eur. J. Med. Chem, Corros. Sci. and Tetrahedron lett.
S#
Source
Citations
1.
J. Hazard. Mater.
1346
2.
Eur. J. Med. Chem.
1111
3.
J. Am. Chem. Soc.
1107
4.
Tetrahedron lett.
881
5.
J. Med. Chem.
806
6.
Corros. Sci.
803
7.
Bioorg. Med. Chem. Lett.
691
8.
Talanta
654
9.
Bioorg. Med. Chem.
641
10.
Tetrahedron
598
3.3.4 Co-Occurrence in titles, abstracts and keywords
Co-words can effectively reflect the latest tend and hotspots in a particular discipline or field. Infact, it provides auxiliary support for scientific research. Infact, the keywords analysis is a vital method that can effectively describe the strength of association between keywords in textual data. In this part, we focused on co-occurrence of words in titles, abstracts and keywords of the publications.
The co-word cluster mapping by VOS viewer revealed that in all titles (n = 2134) (Fig. 5), there are total 6481 terms. 102 terms were repeated at least 10 times. While, in abstract total 33,269 words were found. 136 of them repeated at least 50 times as shown in Fig. 6.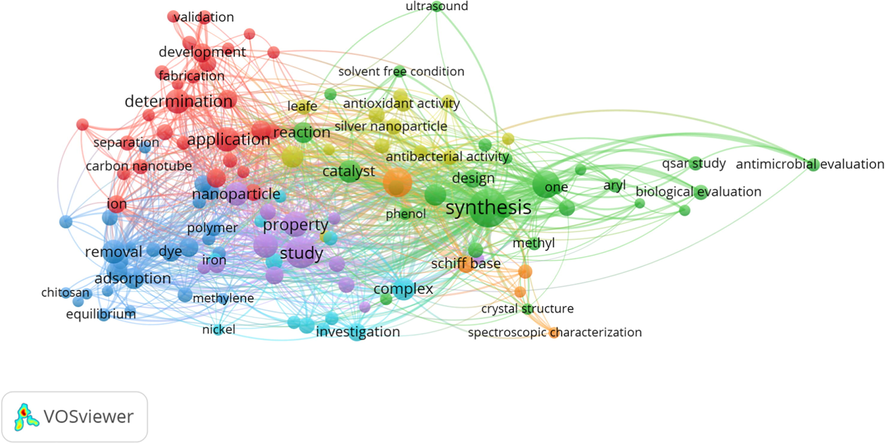
Co-words analysis of titles.
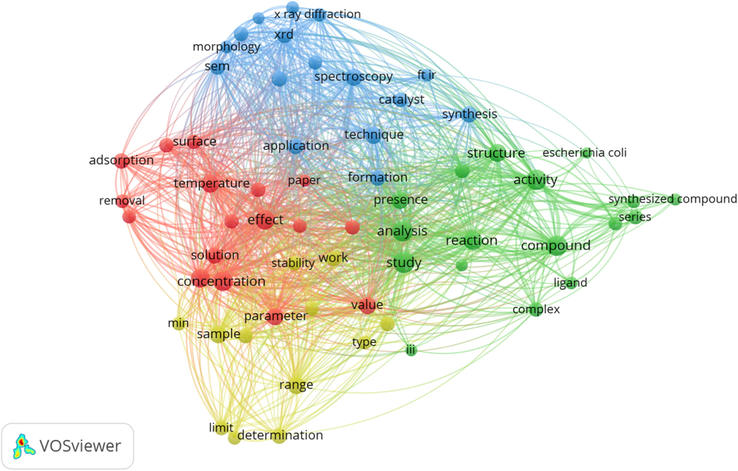
Co-words analysis of abstracts.
In all the 2134 publications, total 6617 authors key words were compiled. Among them, 84 keywords appeared atleast 10 times as shown in Fig. 7.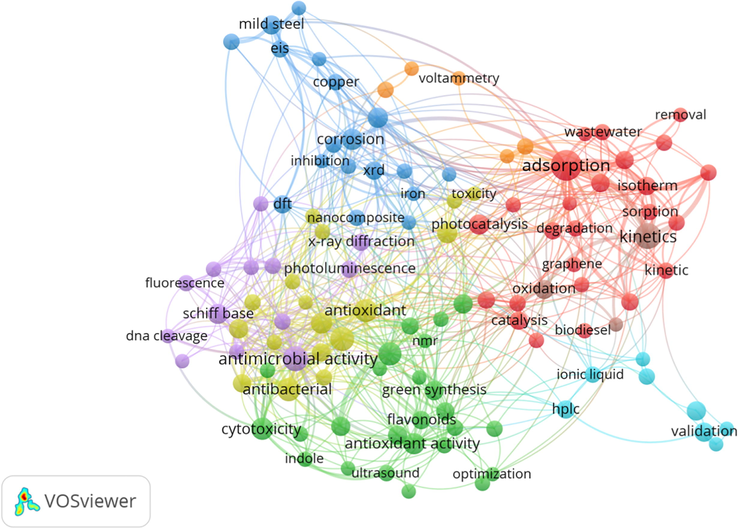
Co-words analysis of keywords.
Furthermore, we categorized the co-words of titles (Table 13), abstract (Table 14) and author keywords (Table 15) to depict the overall trend of publications. While the summary for the co-words of titles, abstracts and keywords are provided in Figs. 8–10.
Compounds/ Chemicals
#
Analytical Technique
#
Kinetics
#
Activated carbon
11
Analysis
81
Adsorption
66
Aryl
22
Characterization
218
Kinetic
22
Carbon
29
Crystal structure
12
Kinetic study
11
Chloro
11
Spectrophotometric determination
24
Equilibrium
17
Complex
98
Spectroscopic characterization
12
Oxidation
49
Copper
38
Ultrasound
12
Total
165
Dihydro
10
Microwave
28
Dye
51
Optimization
19
Other Applications
#
Heavy metal
13
Qsar study
22
Application
105
Iron
19
Quantification
15
Catalyst
78
Ion
50
Total
443
Corrosion
30
Lead
15
Corrosion inhibition
19
Metal complex
21
Nanomaterials
#
Degradation
32
Methyl
19
Gold nanoparticle
15
Photocatalytic degradation
13
Mild steel
17
Nanoparticle
74
Wastewater
26
Nickel
11
Silver nanoparticle
29
Water sample
14
Oxo
11
Total
118
Total
317
Phenol
12
Phenyl
29
General Words
#
Biological Screening
#
Schiff base
36
Design
43
Antibacterial activity
28
Silica
16
Part
16
Antimicrobial activity
31
Zinc
12
Development
46
Antimicrobial evaluation
18
Aqueous medium
19
iii
40
Antioxidant activity
28
Aqueous solution
70
Influence
23
Biological activity
17
Chemical composition
19
Novel
34
Biological evaluation
26
Ionic liquid
19
One
21
Cytotoxicity
12
Derivative
174
Leafe
23
Flavonoid
11
Efficient synthesis
10
Interaction
27
Essential oil
25
Preconcentration
14
Fabrication
13
Extraction
43
Poly
36
Validation
20
Pharmaceutical formulation
15
Pot synthesis
20
Presence
19
Pharmacological evaluation
11
Synthesis
565
Total
325
Vitro
14
Green synthesis
21
Effect
117
Stability
36
Study
#
Removal
93
Structure
31
Comparative study
12
Property
130
Water
43
Evaluation
77
Separation
21
Solvent free condition
13
Investigation
40
Total
640
Preparation
59
Determination
131
Reaction
61
Theoretical study
11
Total
1761
Study
259
Review
30
Simultaneous determination
18
Total
578
Compounds/ chemicals
#
Analytical technique
#
Biological Screening
#
Acid
446
13c nmr
76
Antibacterial activity
91
Aqueous solution
150
1 h nmr
146
Antimicrobial activity
110
Complex
210
Analysis
548
Antioxidant activity
66
Compound
589
Condensation
85
Agent
209
Concentration
514
Electron microscopy
130
Escherichia coli
99
Concentration range
81
Elemental analysis
168
Extraction
105
Copper
62
Characterization
85
Model
256
Dye
93
Fourier
90
Plant
95
Ethanol
61
Ft ir
123
Staphylococcus aureus
78
Metal ion
69
Ftir
124
Pseudomonas aeruginosa
53
Methanol
79
G ml
78
Vitro
66
Methyl
91
Electrochemical impedance spectroscopy
51
Treatment
136
Mixture
134
X ray diffraction
151
Activity
517
Ion
199
Xrd
187
Efficiency
196
Molecule
143
Spectroscopy
268
Effect
479
Ligand
130
Mobile phase
63
Influence
79
Phenyl
73
Technique
348
Removal
162
Poly
65
Tem
97
Recovery
110
Synthesis
291
Sem
188
Property
366
Synthesized compound
107
Tga
73
Total
3273
Composition
137
Transmission electron microscopy
77
Derivative
282
Quantification
59
General Words
#
Drug
153
Flow rate
71
Accuracy
81
Catalyst
196
Precision
82
Basis
81
Product
205
Sample
284
Series
218
Degradation
91
Total
3652
Addition
175
Solution
276
Advantage
74
Solvent
142
Kinetics
#
Change
118
Stability
155
Adsorption
217
Development
78
Preparation
118
Adsorption process
62
Case
71
Structure
401
Condition
381
Iii
100
Water
187
Contact time
70
Increase
163
Nanoparticle
170
Kinetic
124
Type
154
Range
291
Langmuir
80
Use
143
Amount
149
Mechanism
197
Value
340
Nature
122
Min
141
Work
198
Total
6662
Oxidation
119
First time
62
Application
189
Rate
178
Formation
202
Corrosion
63
Reaction
449
Interaction
155
Total
252
Order
200
Level
134
Room temperature
74
Limit
120
Study
#
Temperature
315
Number
86
Comparison
75
Parameter
313
One
72
Detection
139
Thermodynamic parameter
55
Term
62
Determination
239
Time
338
Presence
320
Experimental data
63
Process
265
Size
159
Morphology
103
Surface
193
Respect
56
Paper
106
Total
3771
Total
3422
Study
653
Present study
105
Detection limit
67
Data
308
Total
1858
Compounds/ Chemicals
#
Biological Screening
#
Analytical Technique
#
Activated carbon
18
Anti-inflammatory
16
Potentiometry
10
Catalyst
11
Antibacterial
39
Characterization
22
Chitosan
12
Antibacterial activity
43
Crystal structure
10
Copper
14
Anticancer
18
Cyclic voltammetry
12
Coumarin
11
Anticancer activity
12
Density functional theory
13
Heavy metals
19
Antifungal
23
Dft
14
Indole
12
Antifungal activity
25
Dna cleavage
11
Ionic liquid
15
Antimicrobial
30
Eis
18
Lead
14
Antimicrobial activity
56
Ftir
12
Metal complexes
10
Antioxidant
39
Gc–ms
13
Methylene blue
11
Antioxidant activity
30
Hplc
17
Mild steel
19
Biological activity
13
Hptlc
11
Preconcentration
15
Biosorption
11
X-ray diffraction
17
Pyrazole
12
Cytotoxicity
33
Xrd
21
Schiff base
27
Essential oil
20
Microwave
15
Schiff bases
16
Extraction
16
Microwave irradiation
18
Green chemistry
13
Flavonoids
19
Ultrasound
15
Green synthesis
22
Inhibition
11
Spectrophotometry
25
Synthesis
44
Total
454
Spectroscopy
12
Solvent effect
10
Qsar
22
Total
325
Study
#
Sem
26
Response surface methodology
10
Total
334
Other Applications
#
Thermal analysis
13
Corrosion
32
Total
23
General words
#
Corrosion inhibition
13
Validation
24
Catalysis
20
Kinetics
#
Oxidative stress
11
Heterogeneous catalyst
11
Adsorption
103
Fluorescence
11
Photocatalysis
19
Isotherm
20
Total
46
Wastewater
15
Kinetic
15
Wastewater treatment
11
Kinetics
60
Nanomaterials
#
Water treatment
11
Thermal properties
10
Gold nanoparticles
12
Total
132
Thermodynamics
14
Nanocomposite
11
Oxidation
27
Nanoparticles
23
Sorption
15
Silver nanoparticles
17
Total
264
Total
63
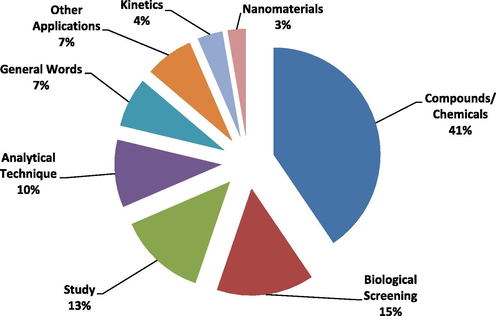
Co-words categories in titles.
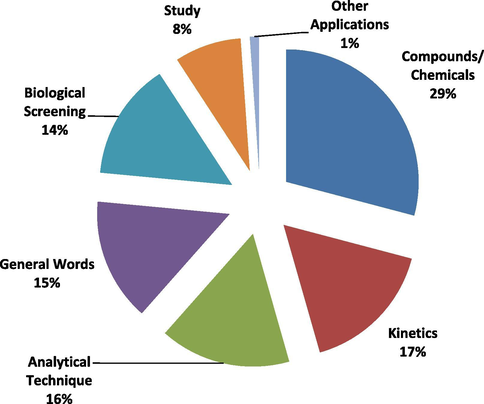
Co-words categories in abstract.
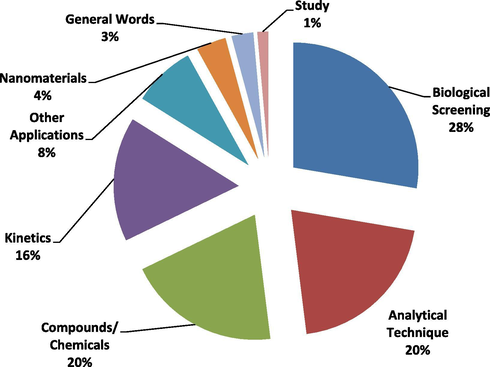
Co-words categories in keywords.
It can be concluded that although the number and percentage of different common words varies in each category (titles, abstract and keywords). But majorly the publications focused on the following major areas or themes.
-
Compounds/Chemicals
To investigate broader review of AJC publications in terms of chemicals/compounds, we compiled the words such as benzimidazole, biodiesel, graphene oxide, indole, heavy metals, metal complexes, pyrazole, schiff base, schiff bases, methylene blue, tio2, metal complexes. Moreover, to explore the progress in elemental analysis we added the words like graphene, iron, lead, cadmium, copper, coumarin etc. We also added the words like green synthesis, green chemistry, and synthesis to this class.
Nanoparticles
Nanoparticles are the nano size particles of matter that are the subject of study in different domains such as chemistry. There exist multiple applications of nanoparticles in different industrial sectors such as agriculture, medical, environment to name a few. Nanoparticle like silver are extensively implemented for antimicrobial coating, wound dressing, and in bio medicinal devices. Under this title, we collected different words like nanocomposite, nanocomposites, nanoparticle, and nanoparticles.
Instrumental Analysis or Characterizations
For analysis of the surface morphology, density, size of particles, splitting of mixture into various components, crystal structure, identification and quantification of various components, different instrumental tools are used. In this category we added cyclic voltammetry, conductivity, density functional theory, eis, electrochemical impedance spectroscopy, fluorescence, FTIR, GC–MS, Hplc, HPTLC. XRD, X-ray diffraction, voltammetry, potentiometry, photoluminescence, RP-HPLC, SEM, NMR, spectrophotometry, QSAR, spectroscopy, TEM, thermal analysis, PCA, solid phase extraction, ultrasound, microwave, microwave irradiation, and optimization, etc.
Kinetics and Thermodynamic
Different parameters such as time, temperature, pressure etc are used to elaborate the rate of reaction. It also helps in understanding the mechanism of reaction. To further explore and understand the research trend in this field, we collected relevant words like kinetic, isotherm, kinetics, sorption, thermodynamics, thermal properties, activated carbon, adsorption, optical properties, polarization, and oxidation in this category.
Biological Screening
Biological screening tool is used as promising strategy for the identification of innovative antimicrobial and anti-inflammatory agents. This tool is used for over half a century and is modified constantly in order to develop novel natural and synthetic therapeutic agents. Under this title, we compiled those words that indicate the focus of researchers in this domain. The words like anti-inflammatory, anti-inflammatory activity, antibacterial, antibacterial activity, anticancer, anticancer activity, antifungal, antifungal activity, antimicrobial, antimicrobial activity, antioxidant, antioxidant activity, biological activity, apoptosis, dna cleavage are compiled in this class.
General Words
Under this class, we collected those keywords that are frequently used in all group of research. Oxidative stress, removal, response surface methodology, and validation
We can conclude that the overall publications focused on synthesis or using standard compounds, drugs or nanoparticles, their characterizations, kinetics & thermodynamics and their biological efficacies.
3.4 Section four (4)
The Brief Description of The Top Ten (10) Most Cited Documents
We also identified the most influential papers in total publications (2634), on the basis of citations. 105 publications were found with atleast 50 citations, or 32 documents showed atleast 100 citations. The details of the top 10 documents are described in Table 16.
S#
Authors
Title
Year
TC
WSC
CrossRef Citation Indexes
Mendeley Reader
Field-Weighted Citation Impact
1.
Barakat M.A., et al.,
New Trends In Removing Heavy Metals From Industrial Wastewater
2011
1224
1221
816
3126
4.67
2.
Abou El-Nour K.M.M., et al.,
Synthesis And Applications Of Silver Nanoparticles
2010
564
563
413
1568
1.48
3.
Gain I., et al.,
Radical Scavenging And Antioxidant Activity Of Tannic Acid
2010
356
350
236
437
6.73
4.
Khan I., et al.,
Nanoparticles: Properties, Applications And Toxicities
2019
298
298
195
3222
35.47
5.
Aljeboree A.M., et al.,
Kinetics And Equilibrium Study For The Adsorption Of Textile Dyes On Coconut Shell Activated Carbon
2017
292
264
93
683
28.2
6.
Pathania D., et al.,
Removal Of Methylene Blue By Adsorption Onto Activated Carbon Developed From Ficus Carica Bast
2017
271
270
64
605
26.14
7.
Haider A., et al.,
A Comprehensive Review Summarizing The Effect Of Electrospinning Parameters And Potential Applications Of Nanofibers In Biomedical And Biotechnology
2018
245
244
139
1238
11.98
8.
Khalil M.M.H., et al.,
Green Synthesis Of Silver Nanoparticles Using Olive Leaf Extract And Its Antibacterial Activity
2014
237
234
148
554
9.63
9.
Kamoun E.A., et al.,
Crosslinked Poly(Vinyl Alcohol) Hydrogels For Wound Dressing Applications: A Review Of Remarkably Blended Polymers
2015
235
229
124
658
3.36
10.
Mohamed A.M.A., et al.,
Corrosion Behavior Of Superhydrophobic Surfaces: A Review
2015
220
218
186
505
3.07
In the top most cited review (1261 citations), the author focused on removal of heavy metal from industrial wastewater by discussing innovative techniques such as absorption on new absorbents, electrodialysis, membrane filtration and photocatalysis. They cited 94 references and concluded that membrane filtration and new adsorbent are the two most efficient methods used for treatment of metals contaminated wastewater. Lime precipitation method is used for removal of inorganic effluents. Based on simplicity, cost effectiveness, photocatalysis will be promising method in near future (Barakat, 2011).
In 2nd most cited review (584 citations) the authors discussed the synthesis and applications of nanoparticles (NP) with size less than 100 nm. NP exhibits significant chemical, physical and biological properties which attract the attention for wide range of applications in various domains. They exhibit different properties as compared to bulk materials like high surface, particles size and quantum confinement. The authors concluded that silver NPs are influenced shape, size and are varied by synthetic methods, reducing agents and stabilizers (Abou El-Nour et al., 2010).
In 3rd most cited (366 citations) document the author principally discussed the antioxidant efficacy of tannic acid, a natural polyphenol of plant origin. Different in vivo analytical methods such as DDPH, ABTS, total antioxidant activity, total reducing ability and hydrogen peroxide scavenging, superoxide anion radical scavenging, Fe3+ reducing power and metal chelating on ferrous ions activities were performed against reference antioxidant scavenging compounds. Tannic acid showed promising results in all applied techniques. The study showed that tannic acid being effective antioxidant can be used as food preservative agents or nutraceuticals (Gulcin et al., 2010).
In the 4th most cited document (362 citations) the authors focused on metals nanoparticles (NPs) properties and its application in various areas. The size of NPs can range from 1 to 100 nm. On the bases of shape, properties or size nanoparticles are classified into different classes like flullerenes, metal NPs, polymeric NPs, and ceramic NPs. Due to their high surface and nanoscale size they possess unique physical, optical and chemical properties. They are suitable for commercial applications due to certain characteristic like reactivity and toughness. However, stability of heavy metals like Pb, Hg, and tinnaoparticles lack its degradation thus causes environmental toxicities (Khan et al., 2019).
In this report (5th highly cited document with 310 citations) the authors studied the ability of activated carbon prepared from coconut husk with H2SO4 activation (CSAC). It was characterized by FTIR and SEM. They also studied various physiochemical parameters including contact time, adsorbent dosage, particles size, pH of dye solution. Chemisorption, intra-particles diffuse, pseudo-first and second order was also calculated. Thermodynamics parameters like Gibbs free energy, entropy and enthalphy were also calculated. Data was evaluated by different Langmuir, Freundlich, Temkin isotherms (Aljeboree et al., 2017).
In this study (6th most cited document with 293 citations) the authors synthesized or prepared the activated carbon from Ficuscaricabast (FCBAC) and they explored methylene blue (MB) uptake by FCBAC. Various parameters like initial dye concentration, contact time, adsorbent doasage, temperature, and pH os solution were calculated. Langmuir, Freundlich and Temkin isotherm models were used to show adsorption equilibrium. The authors concluded that the adsorption of MB on FCBAC follow second order kinetics and the process was endothermically spontaneous in nature (Pathania et al., 2017).
In the 7th highly cited documents (286 citations) the authors briefly discussed the economic benefits of nanotechnology around the globe. Researchers are interested in the study of nanomaterial manufacturing due to its various applications in several fields. Electrospinning technique, widely used in 20th and 21th centuries is applied for manufacturing of nanomaterial due to its fabricated nanostructures potential. However, the authors focused on many operational parameter like polymer concentration, applied electric field, solution conductivity that affect nanofibers fabrication and its application in several fields like biosensors, desalination, filteration, wound dressing and tissue engineering (Haider et al., 2018).
In this report which is the 8th most cited (246 citations), the authors prepared silver nanoparticles in olive leaf extract and evaluated its antibacterial activity against resistant bacterial isolates. Synthesized silver nanoparticles were characterized by UV–Vis spectroscopy, XRD, SEM, TGA. Furthermore, effects of extract concentration, pH, temperature, contact time and shape of Ag nanoparticles were also calculated. The AgNps inhibit bacterial growth at concentration of 0.03–0.07 mg/ml which indicated its promising antibacterial potential at lower concentration and can be a good nutraceutical for future (Khalil et al., 2014).
The author studied (9th most cited document with 243 citations) polyvinyl alcohol polymers (PVA/polymers) blends hydrogel using crosslinking types for polymeric dressing material. The purpose of the study was to investigate the biocompatible synthetic polymers like starch, alginate, chitosan and their derivatives. The authors highlighted that these blended polymers have several medical applications like wound dressing, artificial material, drug delivery and are used for other medicinal purposes (Kamoun et al., 2015).
This is the 10th most cited document (229 citations) where, the authors focused on superhydrophobic surfaces and its efficacy both in academic and industry. Corrosion of metals had become a serious threat to various appliances and systems like automobiles, aircrafts, pipelines and naval vessels. Superhydrophobic surfaces has an inherent range of useful properties which are beneficial to industrial applications. Researchers are keen and working to introduce procedures for the fabrication of such useful surfaces by employing simple methods and investigating effects of surface properties, such as morphology, roughness, and surface chemistry on surface wetting and stability (Mohamed et al., 2015).
3.5 Section five ranking details of AJC
3.5.1 Journal Citation Report (JCR)
-
Total Cites
Its worthy to note that the total sum of citation received by a journal from all those journals indexed in JCR (Journal Citation Report), in that year is termed as total cites. Table 17 gives detailed information about total cites of AJC. From our data we analyzed that total cites consistently increased from 2011 to 2019.
-
b)
Three (3) years Impact Factor
| S# | Year | Total Cites | Journal Impact Factor | Impact Factor Without Journal Self Cites | 5 Year Impact Factor | Immediacy Index | Citable Items | % Articles in Citable Items |
|---|---|---|---|---|---|---|---|---|
| 1. | 2019 | 8485 | 4.762 | 4.691 | 4.57 | 1.797 | 502 | 93.63 |
| 2. | 2018 | 6620 | 3.298 | 3.278 | 4.039 | 2.314 | 121 | 97.52 |
| 3. | 2017 | 4266 | 2.969 | 2.897 | 4.008 | 0.909 | 614 | 95.44 |
| 4. | 2016 | 2784 | 4.553 | 4.508 | 5.388 | 0.308 | 237 | 91.98 |
| 5. | 2015 | 1712 | 3.613 | 3.598 | 4.136 | 0.741 | 116 | 90.52 |
| 6. | 2014 | 945 | 3.725 | 3.417 | 3.39 | 0.418 | 146 | 95.21 |
| 7. | 2013 | 561 | 2.684 | 2.684 | n/a | 0.604 | 53 | 92.45 |
| 8. | 2012 | 299 | 2.266 | 2.202 | n/a | 0.343 | 67 | 91.04 |
| 9. | 2011 | 103 | 1.367 | 1.317 | n/a | 0.242 | 66 | 95.45 |
Impact factor or journal impact factor is a parameter used to measure the average citation received to an article in the preceding two years duration. The Impact factor is calculated for any journal after a minimum period of three years of publication. IF and IF with self cites, is calculated for AJC. From 2011 to 2016, it shows a regular increasing trend but in 2017 and 2018 it decreases as shown in Table 17.
-
c)
Five (5) Year Journal Impact Factor
Another parameter used to indicate the annual productivity of a journal is 5- Years Impact Factor. This indicator was introduced in 2009 by JCR. It reflects the total number of times the published article, cited by other JCR listed journals in the last five years. It gives a broader vision of total citation data. It is considered as long term citation trend in journal. We cannot implement 5-year impact factor to an individual author’s document, organizations, research group, and countries. Infact, it could be considered as five-year window. Since the AJC was launched from 2009, therefore the 5 years impact cannot be applied on 2011–13. The highest 5-years impact was recorded for the year 2016 i.e. 5.388. In other words it remained higher than 4 in 5 years. The data is presented in Table 17.
-
d)
Immediacy Index
The immediacy index indicates that how rapidly an article from a journal is cited by other in the same current year it is published and become a part of literature. High immediacy index of a journal increase the citation chances of a research document in the same year of publication. Similarly, it is also helpful for the publishers to assess a journal. To evaluate the immediacy Index of AJC, we divided it into three phases as shown in Table 17. For the years 2011–13 it was increased. While in 2014–16 it followed a zig-zag pattern. In 2017–18 it increase from 0.308 to 2.314.
-
e)
Citable Items
Citable items included all those research documents or items such as review, articles, and editor letters, proceedings papers that are identified by Web of Science (WOS) and are most cited by other articles are term as citable items. Table 17 shows detail information about citable Items. It followed an increasing trend except in the year 2015 (116) and 2018 (121) respectively.
-
f)
% Articles in Citable Items
The percentage of total number of articles that are counted in total countable items is termed as % article in citable items. It indicates the original research of any journal. We analyzed the % articles in citable items of AJC. Above 90% per year results were obtained for % articles in citable items (as shown in Table 17).
3.5.2 SCImago quartile data and Scopus journal ranking of AJC
-
CiteScore
This measure the annual average citation received by research article issued in a journal series. This parameter was introduced in 2016 by Elsevier. It gives comprehensive review about journal impacts. It can be calculated as;
CiteScore = citation count in N documents / documents (N-3) – (N −1)
Where, N = Number of published documents,
(N-3) – (N −1) = Number of published documents in three consecutive years.
-
b)
Scimago Journal Rank (SJR)
This parameter is based on the Scopus data. It works on the centrality concept that was first introduced in social network analysis. It has multiple applications that included the recognition of the most influential person’s in social network, identification of major infrastructure of nodes in internet, etc. SJR also gives detail information about quartiles. Base on quartiles the journal is classified into four categories.
-
Q1, covered top 25 of journal list,
-
Q2 occupied 25–50% of groups on journal’s list,
-
Q3 represented 50 to 75% of groups in list.
-
Q4 covered 75 to 100% groups in the journal list.
From 2010 to 2019, the Quartile of AJC is shown in Table 15. In 2019 it entered Q1 state. However, the exact ranking, number of total journals and percentile of AJC is obtained from Scopus database, which is displayed in Table 18. It’s apparent from the data that AJC consistently improved the ranking in two broad categories i.e. general chemical engineering and chemistry (miscellaneous). This confirms the growth, quality and ranking of AJC.
SNIP (Source-Normalized Impact Per Paper)
2.349
SCImago Quartile Data
Years
2010
2011
2012
2013
2014
2015
2016
2017
2018
2019
General Chemical Engineering
Q3
Q2
Q2
Q2
Q2
Q2
Q2
Q2
Q2
Q1
Chemistry (Miscellaneous)
Q4
Q3
Q2
Q2
Q2
Q2
Q2
Q2
Q2
Q1
Scopus Journal Ranking (Citescore rank and trend)
Years
General Chemical Engineering
–
151/257
86/286
54/270
55/273
45/278
59/277
48/278
30/273
22/281
Chemistry (Miscellaneous)
–
230/251
143/359
93/366
91/373
78/376
96/370
81/369
59/375
45/398
SJR (SCImago Journal Rank)
0.133
0.262
0.353
0.360
0.549
0.555
0.554
0.591
0.605
0.779
Limitations
There are some limitations in our study. We used Scopus database, which has a wide range of data and is convenient for bibliometric analysis. However, other databases such as Web of Science were not included in the study. Furthermore, we did not verify the Scopus data, for example, comparing the number of citations identified in Scopus with Web of Science. Another limitation of the work is that it was very “difficult” to deal with duplicates or several forms of writing for each type of unit. (i.e., USA and United States of America, etc.). Similarly the co-words analysis was based on the title, abstract or keywords, only. The full text publications were not thoroughly analyzed for co-occurrence of words, etc. More over in the future, it will be interesting to compare the AJC with other relevant journals in different relevant categories.
4 Conclusion
From 2009 to 2019, AJC has published 2134 documents. We calculated the relative growth rate, doubling time and also performed ANOVA analysis of publications. The bibliometric analysis was performed with principal focus on several indicators like total number of publications (tp), total number of citations (tc), h-index, citation per paper or document (cpd) and h-index with and without self-citations. Based on these parameters, the details of the top 10 most prolific authors and universities are provided. We also noted that AJC has a wide range of authors from all over the world. For example, eighty eight (88) countries from different geographies have significantly contributed in all publications. Based on the number of publications the top five countries are India, Saudi Arabia, Egypt, Iran and China. We also briefly discussed the top ten (10) most cited documents. By VOSviewer, we analyzed and discussed the co-authorship, citations and co-citations patterns in all publications. The common trend in publications were decoded and described on the basis of co-words analysis. We also retrieved data from SCImago journal rankings, which confirmed the Q1 state of AJC in 2019. While, details about the AJC impact factor, its 5 year impact factor, immediacy index and average journal impact factor percentile confirm that AJC is following a right direction. From the analysis of the most cited publication and authors, it was possible to see that AJC paper have a good permeation in important sub-areas of chemistry such as nanoparticles, instrumental analysis or characterizations, kinetics and thermodynamic, and biological screening. The importance of the AJC to the international scenario has been confirmed by its very good recent released CiteScore (8.2) and Impact Factor (4.762).
Declaration of Competing Interest
The authors declare that they have no known competing financial interests or personal relationships that could have appeared to influence the work reported in this paper.
References
- Synthesis and applications of silver nanoparticles. Arab. J. Chem.. 2010;3(3):135-140.
- [Google Scholar]
- Kinetics and equilibrium study for the adsorption of textile dyes on coconut shell activated carbon. Arab. J. Chem.. 2017;10:S3381-S3393.
- [Google Scholar]
- Science mapping and visualization tools used for bibliometric and scientometric studies: a comparative study. J. Adv. Lib. Sci.. 2019;6(Special Issue 1):382s-394s.
- [Google Scholar]
- New trends in removing heavy metals from industrial wastewater. Arab. J. Chem.. 2011;4(4):361-377.
- [Google Scholar]
- What do we know about the h index? J. Am. Soc. Inf. Sci. Technol.. 2007;58:1381-1385.
- [Google Scholar]
- What factors determine citation counts of publications in chemistry besides their quality? J. Informetr.. 2012;6(1):11-18.
- [Google Scholar]
- Science mapping software tools: Review, analysis, and cooperative study among tools. J. Am. Soc. Informat. Sci. Technol.. 2011;62(7):1382-1402.
- [Google Scholar]
- Radical scavenging and antioxidant activity of tannic acid. Arab. J. Chem.. 2010;3(1):43-53.
- [Google Scholar]
- Which academic search systems are suitable for systematic reviews or meta-analyses? Evaluating retrieval qualities of Google Scholar, PubMed, and 26 other resources. Res. Syn. Meth. 2020:1-37.
- [Google Scholar]
- A comprehensive review summarizing the effect of electrospinning parameters and potential applications of nanofibers in biomedical and biotechnology. Arab. J. Chem.. 2018;11(8):1165-1188.
- [Google Scholar]
- Hassan, Waseem, Kamdem, Jean Paul, da Rocha, Joao BatistaTeixeira, 2020. Research trends in chemico-biological interactions: The golden jubilee (1969–2019). Chem.-Biol. Interact. 327, 109177.
- A journal co-citation analysis of library and information science in China. Scientometrics.. 2011;86:657-670.
- [Google Scholar]
- Jean Paul Kamdem, Antonia Eliene Duarte, Kátia Regina Rodrigues Lima, João Batista Teixeira Rocha, Waseem Hassan, Luiz Marivando Barros, Thomas Roeder and Apollinaire Tsopmo. Research trends in food chemistry: A bibliometric review of its 40 years anniversary (1976–2016). Food Chemistry. 294 (2019) 448–457.
- Scientific Performance of Brazilian Researchers in Pharmacology with grants from CNPq: A comparative study within the Brazilian categories. Ann. Brazil. Acad. Sci.. 2016;28:1735-1742.
- [Google Scholar]
- A Comparative research performance of top Universities from the Northeastern Brazil on three pharmacological disciplines as seen in Scopus Database. J. Taibah Univ. Med. Sci.. 2017;12:483-491.
- [Google Scholar]
- Crosslinked poly(vinyl alcohol) hydrogels for wound dressing applications: A review of remarkably blended polymers. Arab. J. Chem.. 2015;8(1):1-14.
- [Google Scholar]
- Green synthesis of silver nanoparticles using olive leaf extract and its antibacterial activity. Arab. J. Chem.. 2014;7(6):1131-1139.
- [Google Scholar]
- Nanoparticles: Properties, applications and toxicities. Arab. J. Chem.. 2019;12(7):908-931.
- [Google Scholar]
- Laengle, Sigifredo, Modak, Nikunja Mohan, Merigó, José M., Sotta, Catalina DeLa, 2018. Thirty years of International Journal of Computer Integrated Manufacturing: a bibliometric analysis, Int. J. Comput. Integ. Manuf.
- Laengle, Sigifredo, Modak, Nikunja Mohan, Merigo, Jose M., Zurita, Gustavo, 2018. Twenty-five years of group decision and negotiation: a bibliometric overview. Group Decis. Negot. 27(4), 505–542.
- A review of the literature on citation impact indicators. J. Informetr.. 2016;10:365-391.
- [Google Scholar]
- Martín-Martín, Alberto, Orduna-Malea Enrique, Thelwall, Mike, López-Cózar, Emilio Delgado, 2018. Google scholar, web of science, and Scopus: a systematic comparison of citations in 252 subject categories. J. Informetr. 12, 1160–1177.
- Mastur, Alicia, Modak, Nikunja Mohan, Merigó, José M., Geraci, Norat Roig Tierno Massimiliano, Capecchi, Vittorio, 2019. Half a century of Quality & Quantity: a bibliometric review. Qual. Quant. 53, 981–1020.
- Co-cited author mapping as a valid representation of intellectual structure. J. Am. Soc. Inform. Sci.. 1986;37(3):111-122.
- [Google Scholar]
- Merigóa, José M., Mirandaa, Jaime, Modakb, Nikunja Mohan, 20019. Georgios Boustrasc, Catalina de la Sotta. Forty years of Safety Science: A bibliometric overview. Saf. Sci. 115, 66–88.
- Modak, Nikunja Mohan, Lobos, Valeria, Meriǵ o, Jośe M., Gabrys, Bogdan, Lee, Jay H., 2020. Forty Years of Computers & Chemical Engineering: A bibliometric analysis. Comput. Chem. Eng.
- Modaka, Nikunja M., Merigob, Jose M., Weberc, Richard, Manzorb, Felipe, de Dios Ortuzard, Juan, Modaka, Nikunja M., Merigób, José M., Weberc, Richard, Manzorb, Felipe, de Dios Ortúzard, Juan, 2019. Fifty years of Transportation Research journals: A bibliometric overview. Transp. Res. Part A 120(2019), 188–223.
- Corrosion behavior of superhydrophobic surfaces: A review. Arab. J. Chem.. 2015;8(6):749-765.
- [Google Scholar]
- Moral-Muñoz, José A., López-Herrera, Antonio G., Herrera-Viedma, Enrique, Cobo, Manuel J., 2019. Science mapping analysis software tools: a review. Springer handbook of science and technology indicators, pp. 159–185.
- Software tools for conducting bibliometric analysis in science: An up-to-date review. El profesional de la información. 2020;29(1):e290103
- [Google Scholar]
- Bibliometrics, citation analysis and co-citation analysis: A review of literature I. Libri.. 2009;49:149-158.
- [Google Scholar]
- Removal of methylene blue by adsorption onto activated carbon developed from Ficuscaricabast. Arab. J. Chem.. 2017;10:S1445-S1451.
- [Google Scholar]
- Co-citation in the scientific literature: A new measure of the relationship between two documents. J. Am. Soc. Inform. Sci.. 1973;24:265-269.
- [Google Scholar]
- Cloud computing research in the IS discipline: A citation/co-citation analysis. Decis. Supp. Syst.. 2016;86:35-44.
- [Google Scholar]
- Wolfgang, Glänzel, Schubert, András, 2012. Analysing scientific networks through co-authorship. Handbook of Quantitative Science and Technology Research, pp 257–276.
- A bibliometric analysis of the Journal of Advanced Nursing, 1976–2015. J. Adv. Nurs.. 2017;73:2407-2419.
- [Google Scholar]


