

Translate this page into:
The analysis of scaling mechanism for water-injection pipe columns in the Daqing Oilfield
⁎Corresponding author. Address: College of Chemistry and Chemical Engineering, Northeast Petroleum University, No. 199 Development Road of Daqing, PR China. Tel./fax: +86 459 650 3502. jingguolin@yahoo.cn (Guolin Jing)
-
Received: ,
Accepted: ,
This article was originally published by Elsevier and was migrated to Scientific Scholar after the change of Publisher.
Peer review under responsibility of King Saud University.

Abstract
Although water-injection in mature reservoirs is a promising low-cost method of enhanced oil recovery (EOR), in the process of development in the oilfield, scale has been produced in water-injection pipe columns. The ability to prevent and control the deposition of scale is critical to the efficient recovery of crude oil from hard environments, as part of the broader discipline of “flow assurance” in the petroleum industry. To this end laboratory-scale deposition tests have been useful to understand scale deposition mechanism. The process, mechanism and the main type of the scale in water-injection pipe columns of the fifth plant of the Daqing Oilfield were analyzed. The effect of temperature on the possibility of carbonate calcium formation on oil recovery was investigated experimentally. One of the scale samples was characterized by electron spectroscopy and the results of the element analysis were investigated. Moreover, the precautionary and control measures of scaling in oilfield pipe column systems are proposed.
Keywords
Oilfield
Water-injection pipe column
Scaling
Mechanism

1 Introduction
After the economic limit for oil production by primary depletion has been reached, significant quantities of hydrocarbons can be left in the reservoir (Grattoni and Dawe, 2003). As it is well known, no more than 10–20% of the original oil in place (OOIP) is produced by the primary oil recovery mechanism, whereas an additional 20–30% OOIP may be recovered through waterflooding, or similar methods (Jeong et al., 2011). Water-injection recovery has been commonly adopted in the latter period of exploitation of the Daqing Oilfield to maintain reservoir pressure and enhance oil recovery.
Waterflooding may cause corrosion and scaling. Scale is deposition of inorganic minerals. Scale deposition occurs in reservoir and in production facilities (Sorbie and Macky, 2000). Scale deposition has been a major problem and has been investigated by many researchers (Jordan et al., 2001; Graham et al., 2003; Collins and Jordan, 2003). Scale causes corrosion, equipment damage, and flow restriction and therefore lowering the production rate. The mechanism of mineral scale formation and inhibition has been studied by Jordan et al. (2001), Tomson et al. (2003) and Mackay et al. (2003).
Scaling is usually associated with precipitation. It is recognized that precipitation does not necessarily lead to scaling, but scaling is often thought to result from precipitation followed by adhering of the precipitates to surrounding surfaces. Scaling which occurs at ambient pressures and static conditions may not necessarily occur at elevated pressure and dynamic flows, and vice versa. After displacing and commingling with the formation water in the immediate area of the injection well bore, the flood front moves radially away from the injection well, pushing the oil and formation water before it (Sorbie and Macky, 2000). Most injection systems do not perform ideally and the injection flood front starts to break up and finger toward the producing well. Eventually, these fingers break through and the injected-water is co-produced with the formation water and oil. Formation water and injection water are also able to mix intimately in the vicinity of the production well and the production system. Any water incompatibility will manifest itself in this area (Salman et al., 2007).
The change of pressure and temperature, unstable thermo dynamics and chemical incompatibility of the water (Moghadasi et al., 2004) cause contamination in well casing, well bottom, ground equipment and pipe columns. The above factors seriously affect oil production and increase the need for maintenance of pipe columns and equipment, the holistic benefits (Salman et al., 2007). As to analyze the scaling mechanism for water-injection pipelines and the effect factors are not negligible questions for discussion in petroleum production and oil–gas–water treatment (Liu et al., 2009).
2 Experimental
2.1 Materials
2.1.1 The sample of injection water
There are four types of injection water in the fifth plant of Daqing Oilfield.
-
(1).
Underground water
-
(2).
The oilfield produced water (ordinary sewage).
-
(3).
The sewage with polymer.
-
(4).
The mixture of clear water and sewage.
2.1.2 The sample of scale
The test scales were obtained from the internal surface of the steel pipe, which was used as the water-injection pipe column in the fifth plant of Daqing Oilfield. The condition of the test scale was shown (Table 1).
Number
Sampling location
Injection water
Scaling degree
1
Xing10-3-XW340
Ordinary sewage
Serious
2
Xing13-25-29
The sewage with polymer
Serious
3
13-33-37
The sewage with polymer
Serious
4
Xing13-11–239
Ordinary sewage
Serious
5
X12-2-B421
The mixture of clear water and sewage
Serious
6
10-2-W25
Ordinary sewage
Serious
7
G-29-22
Ordinary sewage
Serious
8
Xing-11-1-356
Ordinary sewage
Serious
2.2 Methods
2.2.1 The analysis of the injection water
The content of ions such as , , Ca2+, Mg2+, Fe2+, Fe3+, Na+, K+, Cl−, of the sample was investigated respectively. The methods are country standards (GB) and petroleum industry standards (SH). These methods were recounted detailedly in the SY5528-92, SY5329-88 and SY/T5329-94 etc.
2.2.2 The analysis of the composition of the scale
To gain a better knowledge of the reason for scaling in the fifth plant of the Daqing Oilfield, the qualitative and the quantitative analyses were conducted to the deposition.
The scaling states and the phenomena with their dissolving in hydrochloric acid solution were observed in detail. The magnetism of the deposition was investigated.
To determine the composition of the deposition, the sale samples in block wells were quantificationally analyzed with chemical analysis, spectrophotometry and the atomic absorption spectroscopic method (AAS). The contents of the volatile components and organics were investigated with the combustion method.
To analyze the ultimate composition of the deposition the number 2 scale sample was investigated by electron spectroscopy.
2.2.3 Verify the tendency to form calcium carbonate
To verify the tendency to form calcium carbonate deposition, the concentration of calcium ion in the water sample under different temperatures and the variation were investigated.
Temperature is the main factor to affect scaling and corrosion of injection water. During the process of injection, there is a large temperature alter. Under the laboratory conditions, the temperature range of the injection well was simulated. The variation of scaling tendency with the wellbore temperature was investigated by means of the variation of the scaling ions.
3 Results and discussion
3.1 The analysis results of the injection water
Through the analysis of water quality (Table 2) it is found that:
The content of Ca2+ and Mg2+ in sample 6 is high, whereas the content of is low. It has a higher content of and a lower mineralization.
Relative to the clear water in water sample 6 the sewage water has a lower content of Ca2+ and Mg2+, a higher content of and three times around mineralization.
The content of Cl− is high and leaning alkalinity.
The whole water sample content of iron is low and the concentration of the total iron is less than 0.3 mg/L.
| (mg/L) | 1 | 2 | 3 | 4 | 5 | 6 | 7 |
|---|---|---|---|---|---|---|---|
| 58.37 | 116.73 | 175.09 | 175.09 | 233.46 | 0 | 116.73 | |
| 2596.5 | 2462.9 | 2240.3 | 2284.9 | 2255.2 | 697.3 | 2195.8 | |
| Cl− | 898.85 | 965.7 | 1126.19 | 832.01 | 864.7 | 326.86 | 817.16 |
| 15.1 | 14.58 | 86.9 | 55.86 | 90.7 | 137.05 | 67.24 | |
| Ca2+ | 28.48 | 22.41 | 19.85 | 17.26 | 12.52 | 78.56 | 21.15 |
| Mg2+ | 6.23 | 0.85 | 1.57 | 2.88 | 1.83 | 33.26 | 2.1 |
| Fe2+ | 0.029 | 0 | 0 | 0 | 0.064 | 0.023 | 0.029 |
| Fe3+ | 0.081 | 0.26 | 0.052 | 0.052 | 0.023 | 0 | 0.54 |
| Na+, K+ | 1568.5 | 1623.0 | 1724.3 | 1536.0 | 1614.8 | 387.2 | 1449.9 |
| Mineralization | 5172.1 | 5206.5 | 5374.3 | 4904.0 | 5073.3 | 1660.3 | 4670.7 |
| pH | 8 | 8 | 8 | 8 | 8.5 | 7.5 | 8 |
The takes a large advantage in the medium pH. Therefore a higher pH tends to form more precipitation of calcium carbonate. One of the reasons to form calcium carbonate deposition is the pH of injection water which is at a range between 7.5 and 9 in the fifth plant.
3.2 The components of the deposition
It is indicated in Table 3 that the content of mud is lower (less than 3%). It is demonstrated that the suspended solid is not the main reason to scaling. The low content of calcium carbonate indicated that calcium carbonate is not the main scale formation. The deposition shows a high content of iron and sulfur. (See Table 4).
Sample
Water and light components (%)
Organics (%)
Mud (%)
CaCO3 (%)
Mg(OH)2 (%)
Fe7S8 (%)
Fe2O3 (%)
FeCO3 (%)
1
2.4
27.3
1.4
3.8
1.2
14.7
29.3
19.4
2
1.9
4.0
2.2
2.0
0.4
39.5
37.2
21.7
3
2.46
15.45
2.1
5.8
2.1
35.2
25.6
10.6
4
2.15
22.38
0.92
7.4
0.3
18.9
36.8
10.3
5
3.04
17.65
2.73
28.1
1.5
21.1
18.2
7.68
6
2.97
2.90
9.63
7.2
0.9
30.7
46.2
18.7
7
9.07
5.84
0.62
4.7
1.1
15.4
40.9
22.37
8
4.16
13.12
3.43
5.3
1.8
23.5
32.9
15.79
Weight (%)
Atomic (%)
Mg
0.0532
0.1095
Al
0.5234
0.9698
Si
1.4127
2.5148
S
12.8536
20.0431
Ca
0.3071
0.3831
Mn
1.0266
0.9343
Fe
83.8235
75.0454
3.3 Effects of temperature on the concentration of calcium ion
From Fig. 1–7 we could conclude that:
The variation of the concentration of Ca2+, Mg2+ in water sample 6 with the temperature was particularly obvious. When it is raised to 25 °C–45 °C, the concentration of Ca2+ was reduced from 78.55 mg/L to 53.95 mg/L. When it is raised to 45 °C–50 °C, the concentration of Ca2+ was reduced to 25.03 mg/L. It is indicated that the calcium carbonate deposition was serious if the clear water was adopted as injection water, especially under higher temperature (45 °C–50 °C).
The variation of the concentration of Ca2+ in water sample 7 whose injection water is the sewage which contains polymer with the temperature (below 45 °C) was not obvious. Compared with other injection water, when raised to 50 °C, it shows a more sharp reduction to the concentration of the Ca2+, from 17.9 mg/L to 10.3 mg/L. It is indicated that it is more likely to form scale under high temperature if the sewage which contains polymer was used as injection water.
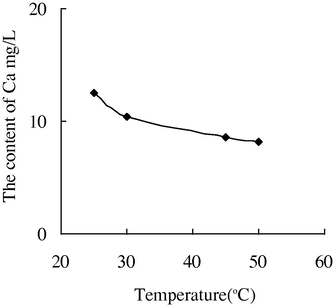
Among the others water samples the variation of the concentration of Ca2+ with the temperature was not particularly obvious. It is declared that the main type of deposition is not calcium carbonate.(Fig. 8)
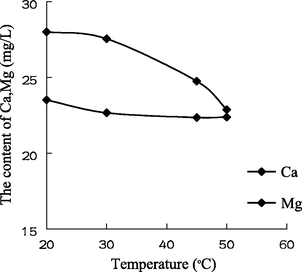
- The variation of the concentration of Ca2+ and Mg2+ with the temperature in water sample 1.
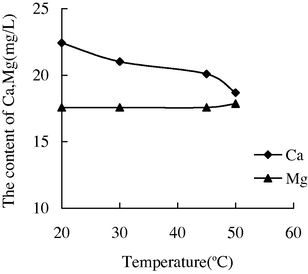
- The variation of the concentration of Ca2+ and Mg2+ with the temperature in water sample 2.
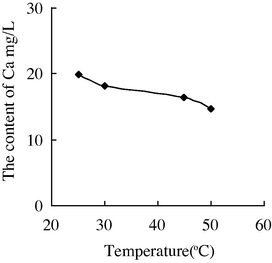
- The variation of the concentration of Ca2+ with the temperature in water sample 3.
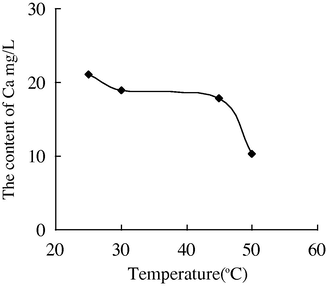
- The variation of the concentration of Ca2+ with the temperature in water sample 4.
- The variation of the concentration of Ca2+ with the temperature in water sample 5.
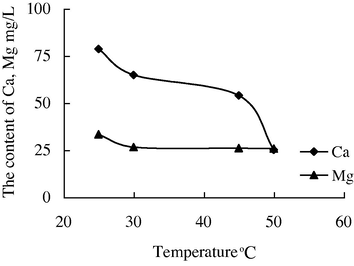
- The variation of the concentration of Ca2+ and Mg2+ with the temperature in water sample 6.
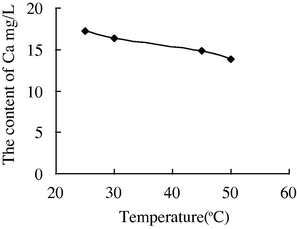
- The variation of the concentration of Ca2+ with the temperature in water sample 7.
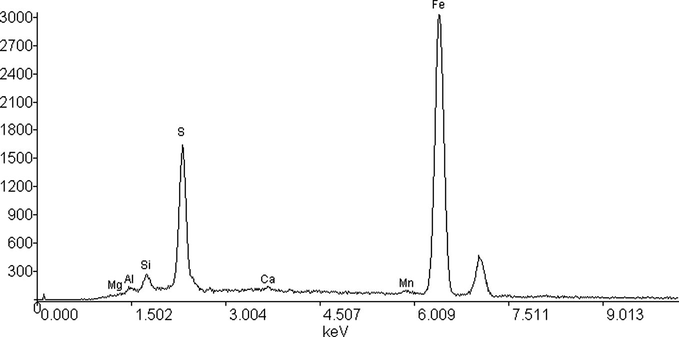
- The electron spectroscopy diagram of scale sample 2.
4 Conclusions
The main components of the scale sample are iron com-pounds, little calcium, little magnesium compounds and some organic compounds. It shows that the water-injection pipe columns have a heavy corrosion. Pipe columns
When the injection water is common sewage or a mixture of clear water and sewage, the deposition shows rusty sheets or drossy, the main components of the scale are the oxides of iron and bits of iron sulfides.
It can be concluded that the injection water has a very low content of the iron ion. As a result of the high content of iron, it shows a small probability to form the deposition directly by these ions in the water.
It was proved that the scaling in injection well mainly caused by the corrosion of the dissolved O2, H2S, CO2 and many kinds of bacteria and dissolved salts has a very low content of the iron ion
Acknowledgments
The research is financially supported by the Scientific Research Fund of Heilongjiang Provincial Education Department (No.12521047) and The Natural Science foundation of the HeiLongJiang province (No. E201228).
References
- Occurrence, prediction and prevention of zinc sulfide scale within Gulf Coast and North Sea high-temperature and high salinity fields. SPE Prod. Facil.. 2003;18:200-209.
- [Google Scholar]
- The influence of formation calcium and magnesium on the effectiveness of generically different barium sulphate oilfield scale inhibitors. Prod. Facil.. 2003;2:601-617.
- [Google Scholar]
- Gas and oil production from waterflood residual oil: effects of wettability and oil spreading characteristics. Pet. Sci. Eng.. 2003;39:297-308.
- [Google Scholar]
- On the feasibility of inducing oil mobilization in existing reservoirs via wellbore harmonic fluid action. Pet. Sci. Eng.. 2011;76:116-123.
- [Google Scholar]
- Deployment of a scale squeeze enhancer and oil-soluble scale inhibitor to avoid oil production loses in low water-cut well. SPE Prod. Facil.. 2001;16:267-276.
- [Google Scholar]
- The analysis and prediction of scale accumulation for water-injection pipelines in the Daqing Oilfield. J. Pet. Sci. Eng.. 2009;66:161-164.
- [Google Scholar]
- Predicting brine mixing deep within the reservoir and its impact on scale control in marginal and deepwater developments. SPE Prod. Facil. 2003
- [Google Scholar]
- Model study on the kinetics of oil field formation damage due to salt precipitation from injection. J. Pet. Sci. Eng.. 2004;43:201-217.
- [Google Scholar]
- Water scaling case studies in a Kuwaiti oil field. J. Pet. Sci. Eng.. 2007;55:48-55.
- [Google Scholar]
- Mixing of injected, connate and aquifer brines in waterflooding and its relevance to oilfield scaling. J. Pet. Sci. Eng. 2000:27.
- [Google Scholar]


