

The application of FTIR in situ spectroscopy combined with methanol adsorption to the study of mesoporous sieve SBA-15 with cerium-zirconium oxides modified with gold and copper species
-
Received: ,
Accepted: ,
This article was originally published by Elsevier and was migrated to Scientific Scholar after the change of Publisher.
Peer review under responsibility of King Saud University.
Abstract
Abstract
The molecular sieves SBA-15 with ceria, zirconia and mixed cerium-zirconium oxides were synthesized and used as supports for gold and copper species. The materials were characterised using a FTIR in situ spectroscopy combined with the adsorption of methanol and oxygen as probe molecules, which allowed the monitoring of the changes on the surface, in particular the creation of the intermediates species on the active sites of materials. The presence of interactions between gold and copper in bimetallic catalysts was considered during the reaction of methanol oxidation. The goal of this work was studied the changes of intermediates adsorbed on the surface of catalysts during the oxidation of methanol after treatment at selected temperature. The monometallic gold and the bimetallic copper–gold catalysts were tested in the reaction of methanol oxidation in the gas phase in situ.
Keywords
Bimetallic catalysts
Gold
Copper
Cerium
Zirconium
Methanol oxidation
FTIR in situ
Catalyst characterisation

1 Introduction
The catalytic oxidation of methanol is the subject of academic research and industrial applications in the production of fine chemicals (Fig. 1) (Trejda et al., 2010). The mechanism of methanol oxidation has been classified as a typical rake mechanism (Tatibouet, 1997) which can give many products. An according to the literature data (Badlani and Wachs, 2001; Briand et al., 2000; Busca et al., 1987; Florek-Milewska et al., 2011; Golinska-Mazwa et al., 2011; Kähler et al., 2013; Tatibouet, 1997; Trejda et al., 2006 and 2010), the first step of methanol oxidation usually involves the formation of methoxy species from methanol on acidic centres with the participation of nucleophilic oxygen which plays the role of basic centre. Methoxy species can be also formed on the basic centres. The presence of strong acid centres on the catalyst surface favours the dehydration of methanol to dimethyl ether. If the acid centres are characterised by the medium or weak strength, the reaction can proceed by the dehydrogenation of intermediates at which nucleophilic oxygen abstracts proton from C–H bond in methoxy species. Formaldehyde is chemisorbed on the surface during the dehydrogenation. The adsorbing centre must be weak enough to permit the easy desorption of formaldehyde desorption. If the active centres are stronger, formaldehyde molecule does not desorb from the surface and interacts with another methanol molecule towards other products: methyl formate and dimethoxymethane. Total oxidation of methanol to CO2 depends on active and labile oxygen, i.e., high basicity of the catalyst. Above described processes run on the different redox active centres. This is a reason, why methanol oxidation is a useful test reaction for acidic-basic and oxidation properties of catalysts (Badlani and Wachs, 2001; Briand et al., 2000; Busca et al., 1987; Florek-Milewska et al., 2011; Kähler et al., 2013; Trejda et al., 2006, 2010). The way of this reaction depends on the structure properties of catalysts and the arrangement of the surface atoms (Tatibouet, 1997). The catalytic properties of metals active in methanol oxidation can be modified by different inorganic additives (Pestryakov et al., 2013).
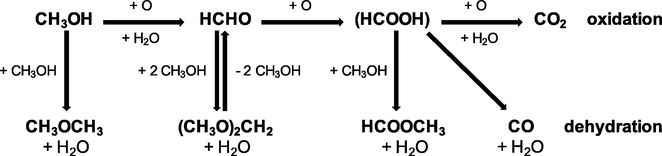
- The proposition of the mechanism for the reaction of methanol oxidation and dehydration based on Trejda et al. (2010).
Therefore, the idea of this work was to construct the catalysts containing Au and CeO2 supported on SBA-15 mesoporous molecular sieves and loaded by additives such as Cu species and ZrO2 and investigate their surface properties and catalytic performance.
Bimetallic catalysts in which one of metals is gold in the form of highly dispersed metallic particles were studied in many important oxidation processes (Bond and Thomson, 1999) and this group of catalysts often exhibited better catalytic performances than their monometallic analogues (Albonetti et al., 2012; Chang et al., 2009; Llorca et al., 2008). They are applied in catalytic partial oxidation (CPO) towards synthesis of fine chemicals, in production of hydrogen in autothermal reforming (ATR) and in synthesis of methanol or liquid fuels in aqueous phase reforming (APR) (Dal Santo et al., 2012). Different supports for bimetallic copper–gold catalysts have been proposed. For example, titania was used as the support of catalyst which was applied in propene epoxidation with N2O (Llorca et al., 2008) or mixed titanium-iron oxide in the production of hydrogen by partial oxidation of methanol (Chang et al., 2009). The catalytic performances of bimetallic nanoparticles are often influenced by a spectrum of factors, such as nanostructure, surface composition, particle size and shape (Liu et al., 2011; Miller et al., 2006).
SBA-15 material was applied used as a primary support in this study. It is an ordered mesoporous silica synthesized the first time in 1998 (Zhao et al., 1998). It is characterised by a large surface area (720–940 m2 g−1) (Benamor et al., 2012) and a pore diameter in the range between 5 and 30 nm, thick pore walls and a high hydrothermal stability (Beck et al., 1992). The introduction of different metal species to the structure of SBA-15 can generate specific acidic-basic and redox properties. These changes of properties were applied to design the catalysts which were active in selected processes, for examples silica modified with copper and cerium oxides was used as catalyst in ethyl acetate oxidation (Tsoncheva et al., 2013), acetone oxidation (Wang and Bai, 2011), CO oxidation (Águila et al., 2013), Water Gas Shift (WGS) process (Djinović et al., 2008), NOx reduction with NH3 (Tong et al., 2011), simultaneous reduction of SO2/NO by CO (Pantazis et al., 2007) or preferential oxidation (PROX) of CO (Reyes-Carmona et al., 2011).
In this work SBA-15 mesoporous molecular sieves with ceria and/or zirconia species and modified gold and/or copper species were applied. The description of preparation of these materials and the results of full characterization were presented in earlier work (Kaminski et al., 2015; Kaminski and Ziolek, 2014). The aim of the study was a detailed FTIR in situ spectroscopy analysis of the interaction of methanol molecules with the catalysts surface, the identification of created intermediates and the estimation of the application the bimetallic copper–gold and monometallic gold catalysts based on SBA-15 with ceria and zirconia in the methanol oxidation at low temperature as well as the characterization of the activity and stability of the catalysts. The FTIR in situ spectroscopy was applied in this work to the monitoring of changes on the surface of materials during the increase of temperature of oxidation process. This allowed to estimate the surface properties of materials and which chemical elements play a crucial role in the partial oxidation of methanol.
2 Experimental part
2.1 Preparation of materials
2.1.1 Modification of SBA-15 materials with cerium and/or zirconium oxide and copper and gold
Four different supports for gold and copper were prepared. They were CeO2, ZrO2 and mixed CeZrOx (of different CeO2:ZrO2 atomic ratios: 1:2 and 2:1) loaded on SBA-15 molecular sieve. SBA-15 was modified with 10 wt% of a single Ce or Zr metal oxide or with a mixture of Ce and Zr metal oxides. The supports were labelled as follows: CeS, ZrS, CeZrS(1:2) and CeZrS(2:1) for mono-metallic and bimetallic oxide mixtures of different ratios of their content (indicated in brackets), respectively. These supports were subjected at first to functionalization with 3-aminopropyl-trimethoxysilane (APMS), then to gold loading and finally to impregnation with copper species. The details of the syntheses and modifications were described in the earlier papers (Kaminski et al., 2015; Kaminski and Ziolek, 2014). The final monometallic catalysts – Au/CeS, Au/CeZrS(2:1), Au/CeZrS(1:2), Au/ZrS and their bimetallic analogues – CuAu/CeS, CuAu/CeZrS(2:1), CuAu/CeZrS(1:2) and CuAu/CeZrS were obtained and characterised.
2.2 Characterisation of catalysts
2.2.1 The texture and structure properties
The texture and structure properties of these materials using selected methods (ICP-OES, XRD, adsorption and desorption of nitrogen, XPS, UV–vis, FTIR in situ combined with adsorption and desorption of NO, CO or pyridine, TEM) were studied in the earlier study (Kaminski et al., 2015; Kaminski and Ziolek, 2014). In this paper, the most valuable information about the FTIR in situ study will be presented. In this work the results of the FTIR in situ measurements combined with the adsorption of methanol vapours on the surface of catalysts and its oxidation in the selected temperature range are shown. TEM images, XRD patterns, XP spectra recorded for catalysts before and after their using in methanol adsorption and its oxidation are presented in order to show the changes in the structure of materials during methanol oxidation.
2.2.2 The FTIR in situ study combined with the adsorption and oxidation of methanol
For methanol and oxygen adsorption, the Fourier Transform Infrared (FTIR) spectra were recorded at room temperature (RT) using a Nicolet Nexus Fourier Transform Infrared 6700 spectrometer (Thermo Scientific) equipped with DTGS KBr detector and an extended KBr beam splitter at a spectral resolution of 4 cm−1 accumulating 64 scans. The sample powders were pressed into thin self-supporting pellets of ca. 7.5 mg cm−2 (2 cm2 area) and placed in a vacuum quartz cell equipped with KBr windows, where they underwent all activation and adsorption treatments. All spectra during methanol oxidation in the selected temperature range (293–573 K) were recorded at room temperature (RT). The spectrum without any sample (“background spectrum”) was scanned and was subtracted from all recorded spectra. Before the measurements, the samples were activated at 623 K (for 2 h, using a ramp of heating – 3 K min−1) under high vacuum. The first spectrum of the sample was recorded for a fresh sample, before the activation.
Pure methanol (99.9%) in the probe tube was purified by cooling in the liquid nitrogen (for 15 min) before the admission into a cell. Then it was adsorbed at RT. About 1 mbar of methanol was added in three doses (each around 0.33 mbar) and then samples was evacuated in the high vacuum at RT, 323, 373 and 423 K for 5 and 10 min (a heating ramp – 2 K min−1) and at 573 K for 1 h (the heating ramp – 2 K min−1). The details of the procedure of adsorption and desorption were collected in the Supporting Information.
The FTIR spectrum after the out gassing in high vacuum at 573 K for 1 h was used to the subtraction in the case of the FITR spectra recorded after the adsorption of methanol and oxygen, the heating of gas mixture in the temperature range 323–573 K (the heating ramp – 2 K min−1) and the out gassing at 573 K for 5 and 10 min (the heating ramp – 2 K min−1). All presented spectra were normalised to the density of 7.5 mg cm−2.
2.2.3 Transmission electron microscopy (TEM)
For transmission electron microscopy (TEM) measurements the catalysts before and after their using in methanol oxidation were deposited on a grid covered with a holey carbon film and transferred to JEOL 2000 electron microscope operating at 80 kV.
2.2.4 X- ray diffraction (XRD)
XRD measurements were carried out on a Bruker AXS D8 Advance diffractometer with Cu Kα radiation (
2.2.5 X-ray photoelectron spectroscopy (XPS)
X-ray photoelectron spectra were recorded on an Ultra High Vacuum (UHV) System. The study was conducted using X-ray Al Kα = 1486.6 eV with the following lamp parameters: 14.5 kV, 20 mA. Measurements were carried out in the chamber of the analyser under vacuum of approximately 2.0 · 10−8 mbar. The spectra were recorded for the energy range from 1100 eV to 0 eV in increments of 0.5 eV, the energy transition CAE = 100 eV. Different regions were recorded in increments of 0.1 eV, the energy transition CAE = 30 eV and time counts 50 ms. The number of scans in the measured range was fitted to the observed signal to noise ratio. The powder sample was put on the conductive tape of carbon (graphite), which was adhered to the carrier surface and placed perpendicular to the axis of the analyser. The X-ray source was set at the angle of 60° to the plane of the surface. The area of the samples analysed corresponded to the size of the aperture of the analyser used (large area), ca. 50 mm2. Deconvolution of XP spectra was carried out using the OMNIC 8.0™ software. Bands intensities were estimated by calculating the integral of each band after smoothing and baseline correction. Then the deconvolution parameters for the experimental curve, that is the Voigt function, small signal sensitivity and constant base line, were chosen in the OMNIC 8.0™ software. Atomic ratios were computed from the intensity ratios normalized by the atomic sensitivity factors. An estimated error of ±0.1 eV can be assumed for all measurements.
3 Results and discussion
3.1 FTIR in situ spectroscopy – study of methanol adsorption
For the interpretation of results of methanol and oxygen adsorption using the FTIR in situ spectroscopy, the three ranges were analyzed – 3050–2750 cm−1, 2400–2050 cm−1 and 1520–1320 cm−1. They are attributed to the regions of the stretching vibrations of bonds (νC—H) in metoxy groups, (νC⚌O) in CO or CO2 molecules and (νC—O) and (νO—H) of formate, methoxide species or water molecules, respectively. The FTIR spectra in situ after the adsorption of methanol dose (∼1 mbar) and then its out gassing from the surface of SBA-15 materials are shown in Figs. 2–4, 1S and 2S. It is worth to note, that in the case of all studied samples, after methanol adsorption of the first dose of methanol (∼0.33 mbar), new bands were appeared, which can be assigned to the vibrations of bonds in methanol molecules adsorbed on the surface of SBA-15 materials (Figs. 2–4, 1S and 2S).

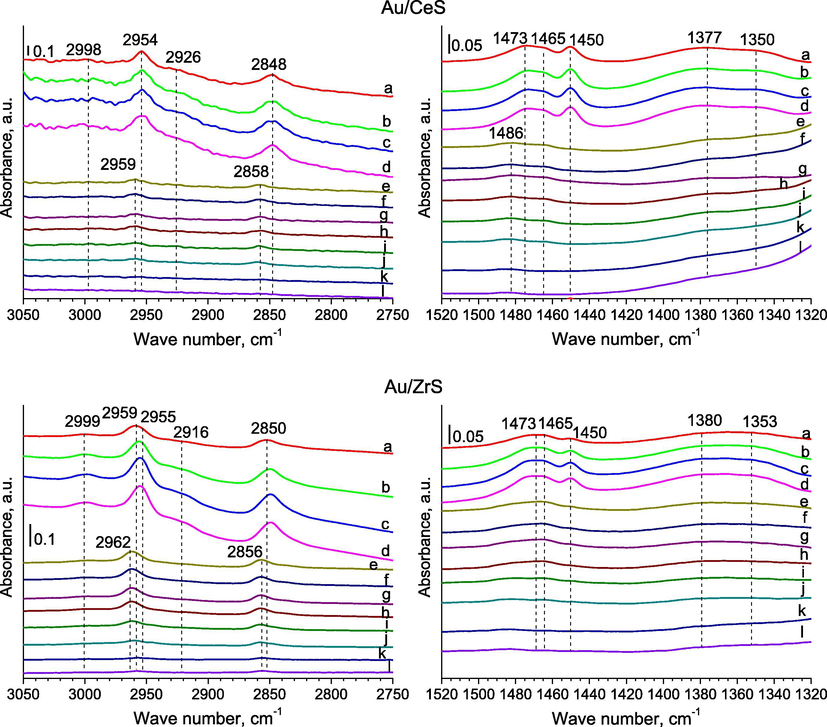
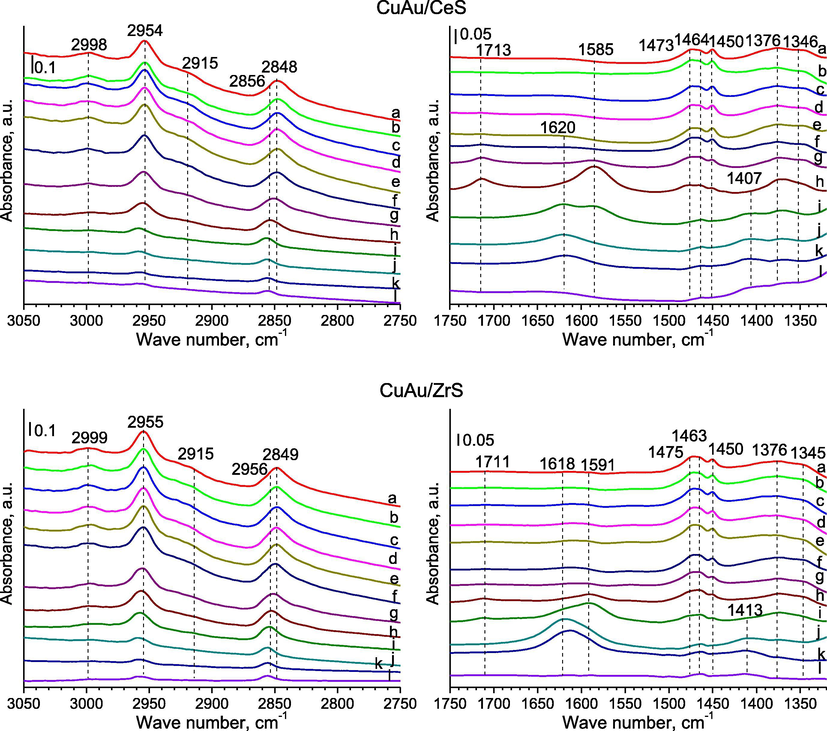
- FTIR spectra recorded for SBA-15 with ceria or zirconia modified with gold and copper for regions of 3050–2750 cm−1 (left side) and 1520–1320 cm−1 (right side) after: a-c) the adsorption of methanol at RT: (a) the 1st dose of ∼0.33 mbar; (b) the 2nd dose of ∼0.33 mbar, 5 min after the 1st dose; (c) the 3rd dose of ∼0.33 mbar, 5 min after the 2nd dose; (d) 5 min after the adsorption of last dose of methanol (total ∼ 1 mbar) at RT; (e-l) after out gassing at: (e) room temperature for 10 min; (f) room temperature for 20 min; (g) after out gassing for 30 min; (h) 323 K for 10 min; (i) 373 K for 10 min; (j) 423 K for 10 min; (k) 623 K for 1 h; (l) 623 K for 2 h.
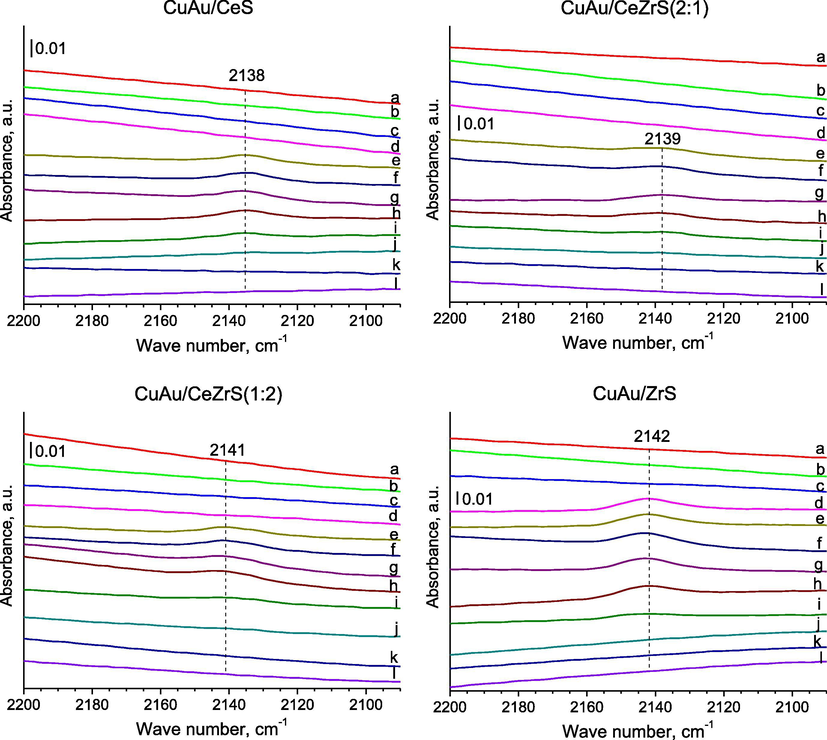
- FTIR spectra were recorded for SBA-15 with ceria and/or zirconia modified with gold and copper for the region of 2200–2090 cm−1, after: (a–c) adsorption of methanol at RT: (a–c) the adsorption of methanol at RT: (a) the 1st dose of ∼0.33 mbar; (b) the 2nd dose of ∼0.33 mbar, 5 min after the 1st dose; (c) the 3rd dose of ∼0.33 mbar, 5 min after the 2nd dose; (d) 5 min after the adsorption of last dose of methanol (total ∼ 1 mbar) at RT; (e-l) after out gassing at: (e) room temperature for 10 min; (f) room temperature for 20 min; (g) after out gassing for 30 min; (h) 323 K for 10 min; (i) 373 K for 10 min; (j) 423 K for 10 min; (k) 623 K for 1 h; (l) 623 K for 2 h.
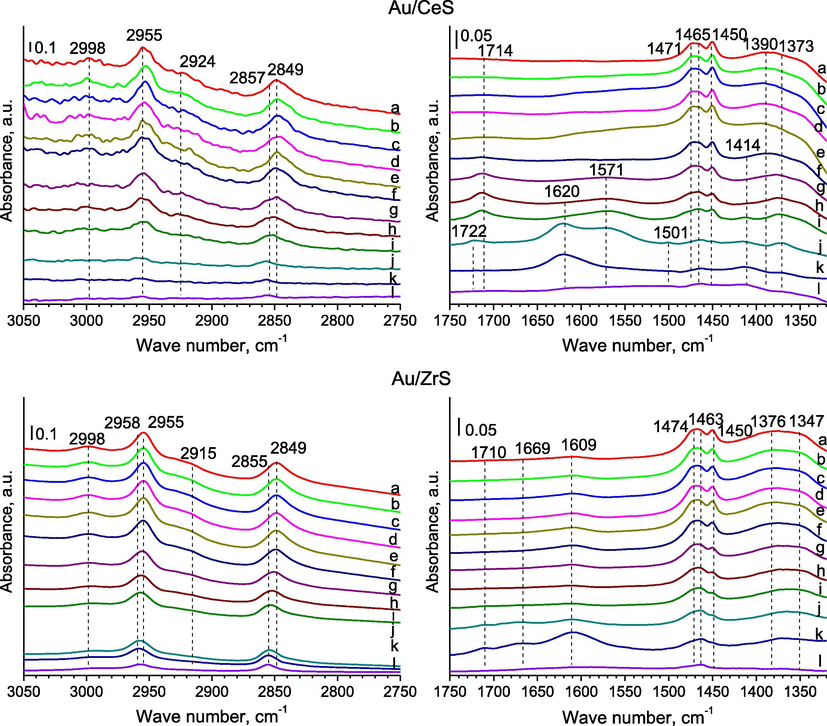
- FTIR spectra were recorded for SBA-15 with ceria or zirconia modified with gold for regions of 3050–2750 cm−1 (left side) and 1520–1320 cm−1 (right side) after: (a-c) the adsorption of methanol at RT: (a) the 1st dose of ∼0.33 mbar; (b) the 2nd dose of ∼0.33 mbar, 5 min after the 1st dose; (c) the 3rd dose of ∼0.33 mbar, 5 min after the 2nd dose; (d) 5 min after the adsorption of last dose of methanol (total ∼ 1 mbar) at RT; (e-l) after out gassing at: (e) room temperature for 10 min; (f) room temperature for 20 min; (g) after out gassing for 30 min; (h) 323 K for 10 min; (i) 373 K for 10 min; (j) 423 K for 10 min; (k) 623 K for 1 h; (l) 623 K for 2 h.
3.1.1 The region of the stretching vibrations of bonds C—H in methanol molecules (3050–2750 cm−1)
The C—H stretching region (3050–2750 cm−1) reveals two pathways for methanol adsorption: undissociated (molecular) and dissociated (methoxy) species. Pairs of bands (Figs. 2, 4–6), which can be seen after methanol adsorption at around 2955 and 2848 cm−1, they are due to the strong asymmetric and symmetric vibrations of C—H bonds in methoxide species —OCH3 (Engeldinger et al., 2010; Wang et al., 2012). In the literature data (Busca, 1996), these bands were associated to the symmetric methyl stretching mode split due to its Fermi resonance with the first overtone of the corresponding symmetric deformation. In the case of samples with gold and copper, a band at 2848 cm−1 can be the result of adsorbed methoxy species at different copper sites. The band located at around 3000 cm−1 could be assigned to the stretching vibrations in C—H bond of weakly adsorbed methanol molecules (Natal-Santiago and Dumesic, 1998). The band at around 2920–2915 cm−1 can be due to one of the methyl group (—CH3) bending mode (Bazin et al., 2012; Natal-Santiago and Dumesic, 1998). The bands of stretching vibrations in methanol molecules were disappeared after out gassing at 623 K for 2 h.
- FTIR spectra were recorded for SBA-15 with ceria or zirconia modified with gold and copper for the regions of 3050–2750 cm−1 (left side) and 1750–1320 cm−1 (right side) after: (a) the adsorption of methanol (∼1 mbar) at RT; (b) 5 min later; (c) after the adsorption of oxygen (∼10 mbar) at RT; (d) 5 min later; (e) 10 min later; heating for 10 min at (f) 323; (g) 373; (h) 423; (i) 473; (j) 523; (k) 573; (l) out gassing at 623 K for 10 min.
- FTIR spectra were recorded for SBA-15 with ceria or zirconia modified with gold for the regions of 3050–2750 cm−1 (left side) and 1750–1320 cm−1 (right side) after: (a) the adsorption of methanol (∼1 mbar) at RT; (b) 5 min later; (c) after the adsorption of oxygen (∼10 mbar) at RT; (d) 5 min later; (e) 10 min later; heating for 10 min at (f) 323; (g) 373; (h) 423; (i) 473; (j) 523; (k) 573; (l) out gassing at 623 K for 10 min.
3.1.2 The region of the vibrations of bonds in methanol molecules (1520–1320 cm−1)
After methanol adsorption at RT, the characteristic bands of formate species were appeared at about 1376–1373 cm−1 in FTIR spectra recorded for samples with gold and copper (Fig. 2a–c spectra of samples) and then their shift was observed to about 1382–1381 cm−1 in during out gassing at 623 K (Bazin et al., 2012). These bands can be assigned to the symmetric stretching vibrations νs(OCO) of methyl formate and products of it decomposition on surface of catalysts (Engeldinger et al., 2010). Bands around 1451–1450 cm−1 are due to of C—H deformation vibration (Engeldinger et al., 2010), bending vibration (Sun et al., 2007) and they can be assigned to methoxy species (Natal-Santiago and Dumesic, 1998). A band at about 1465–1463 cm−1 can due to the bending vibration in methanol molecules weakly adsorbed on silica via hydrogen bonding interactions (Wang et al., 2012). An according to the literature data (Busca, 1996), bands at 1481–1458 and around 1351–1348 cm−1 are a proof on the occurring of the methyl groups of metoxy species (—OCH3) on the surface of materials, because are due to asymmetric (νasCH3) and symmetric (νsCH3) stretching vibrations of bonds C—H.
3.1.3 The region of the vibrations of bonds in carbon monoxide (2400–2050 cm−1)
In the case of catalysts modified with copper and gold in the FTIR spectra (Fig. 3.) recorded after the out gassing at RT, the bands of vibrations in CO molecules adsorbed on weakly copper species were observed at 2142–2136 cm−1. It can suggest that copper during the out gassing was reduced from Cu2+ to Cu+ and this form of copper cations could play the role of active sites. The band at 2142–2136 cm−1 can be attributed also to gold species (as like Au+). Methanol molecules could be decomposed in the reducing atmosphere to methane, hydrogen and carbon monoxide on these active sites. This mechanism on copper species could run the according to chemical formula:2 CH3OH → CH4(g) + H2(g) + CO(g).
3.2 The FTIR in situ study – the adsorption of methanol and oxygen at RT and the reaction of methanol oxidation at 323–573 K
3.2.1 The region of the stretching vibrations of bonds in methanol molecules and intermediates of products (1750–1320 cm−1)
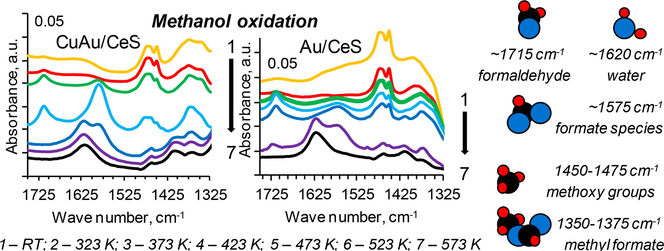
The composition of the intermediates created during the methanol oxidation on the surface of catalysts was analyzed using the FTIR in situ spectroscopy by the recoding the spectra in RT (Figs. 5–8 and 3S-4S). The intermediates were created after the adsorption of methanol (∼1 mbar) and oxygen (∼10 mbar) on SBA-15 materials and their heating at 323–573 K.
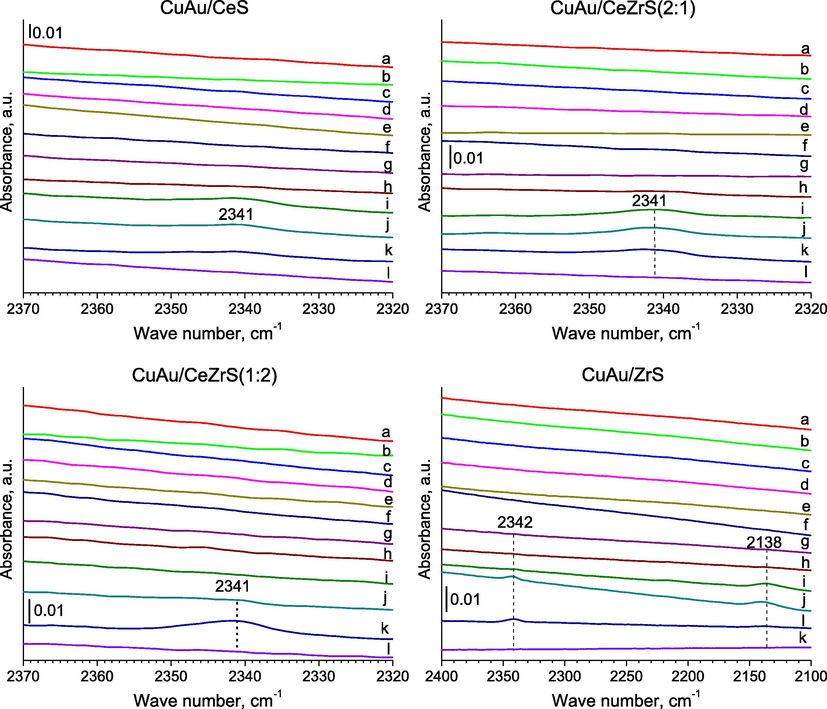
- FTIR spectra were recorded for SBA-15 with ceria and/or zirconia modified with gold and copper for the region of 2370–2320 cm−1 and 2400–2100 cm−1 after: (a) adsorption of methanol (∼1 mbar) at RT; (b) 5 min later; (c) after adsorption of oxygen (∼10 mbar) at RT; (d) 5 min later; (e) 10 min later; heating for 10 min at (f) 323; (g) 373; (h) 423; (i) 473; (j) 523; (k) 573; (l) evacuation at 623 K for 10 min.
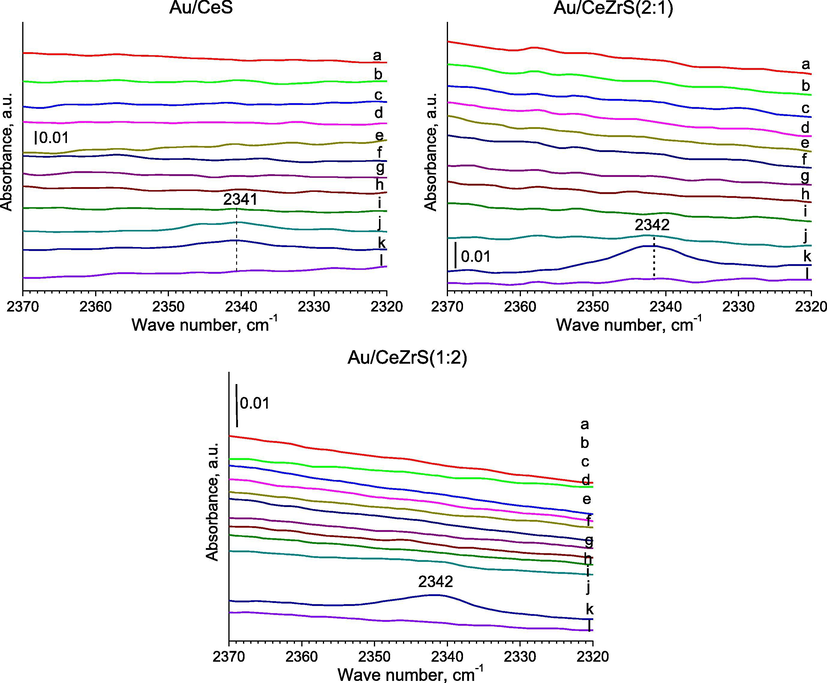
- FTIR spectra were recorded for SBA-15 with ceria and/or zirconia modified with gold for the region of 2370–2320 cm−1 after: (a) the adsorption of methanol (∼1 mbar) at RT; (b) 5 min later; (c) after the adsorption of oxygen (∼10 mbar) at RT; (d) 5 min later; (e) 10 min later; heating for 10 min at (f) 323; (g) 373; (h) 423; (i) 473; (j) 523; (k) 573; (l) out gassing at 623 K for 10 min.
The observed bands were identified. The FTIR bands of the asymmetric stretching vibrations (νasOCO) appeared at around 1584–1571 cm−1 (Engeldinger et al., 2010). The bands at about 1578 and 1640 cm−1 belonged to adsorbed formate and monomethyl carbonate species, respectively (Engeldinger et al., 2010). In the region of 1800–1700 cm−1 can be found the vibrations of bands in formaldehyde, which can be one of products in the selective oxidation of methanol. The bands in the region 1750–1700 cm−1 point to the formation of species containing carbonyl groups. A band at about 1714–1711 cm−1, which was observed after the heating of the studied samples at 323–423 K (Figs. 5 and 3S, f-h spectra of samples with cerium, copper and gold), in range of 373–473 K (Fig. 5, g-i spectra of CuAu/ZrS) or at 523–573 K (Figs. 6 and 4S, f-j spectra of samples modified with only gold) in the oxidised atmosphere and in the presence of methanol. It can be assigned to the stretching vibrations (νC⚌O) of methyl formate species adsorbed on catalyst surface (Wang et al., 2012). An according to the mechanism of methanol oxidation, the creation of reagents from methanol molecules during its oxidation is the result of redox properties of active sites and compounds on the surface of catalysts (Tatibouet, 1997). The presence of formaldehyde can lead to the reduction of cationic gold to its metallic form and this is the reason why is used as the reducing agent in the preparation of metallic gold nanoparticles (Choma et al., 2011). The formate species represented by formaldehyde (the possible product of methanol oxidation) can lead also to the reduction of copper species. It means that the presence of formate intermediates on the surface of catalyst can reduced the elements of active phase and these intermediates can play the rule of reactive species in the selected range of temperature.
The band at 1620–1615 cm−1 was due to the stretching vibrations of O—H bond mode of Lewis bound water, which was displaced by the adsorption of methanol (Chesalov et al., 2013; Ladera et al., 2012). These bands, which were attributed to the stretching vibrations of O—H in water molecules, were observed in the FTIR spectra recorded for the bimetallic catalysts after their heating for 10 min at 473, 523 and 573 K. It means that methanol is combusted to carbon dioxide and water. It is according to the observation of the FTIR spectra recorded for the regions of 2200–2090 cm−1. In the case of samples with gold, new bands were showed at around 1620–1615 cm−1 in the FTIR spectra, which were recorded after the thermal treatment for 10 min at 523 K (Au/CeS, Fig. 6, j spectrum) and 573 K (Au/CeZrS(2:1) and Au/CeZrS(1:2), Fig. 4S, k spectra). It can suggest that methanol molecules adsorbed on the surface of catalysts are combusted to carbon dioxide and water at lower temperature over bimetallic catalysts than catalysts with gold.
In the region (1500–1400 cm−1) of vibrations in C—H bonds, the bands are attributed to (C—H) modes of methoxy groups and undissociated methanol molecules mostly overlap. In the FTIR spectra performed for samples after their heating at 373–423 K were weak bands at 1437–1436 cm−1, which were assigned to C—H deformation in methoxy groups. After heating the samples with gold (Figs. 6 and 4S, a spectra recorded for samples modified with only gold), a new band at around 1500 cm−1 was created, which was attributed to the stretching vibrations in methane molecules adsorbed on the surface. The weak band at about 1465 cm−1, which disappears upon out gassing, may be attributed to undissociated methanol species. A band about 1420 cm−1 can due to the deforming vibrations in metoxy groups chemisorbed on copper (Wang et al., 2012). A band at about 1451–1450 cm−1 can be assigned to metoxy species and about 1590 cm−1 was due to formate species (Sun et al., 2007). The bands of vibrations in dimethyl ether couldn’t be identified, because they can give the band at about 1200 cm−1. It isn’t available this region in the study of the materials based on silica.
3.2.2 The region of the stretching vibrations of bonds in CO and/or CO2 molecules (2400–2050 cm−1)
In the case of catalysts with copper and gold, after the addition of oxygen and methanol to the cell and the heating of samples at 473 K, a new band was appeared at around 2340 cm−1, which is typical for the stretching vibrations in carbon dioxide molecules – the product of methanol combustion (Fig. 7, i spectra of samples). It is worth to note, that in the case of CuAu/ZrS, two bands were created at 2138 cm−1 after the heating at 473 K and at 2342 cm−1 after heating at 523 K (Fig. 7, j spectrum of sample), which were due to the stretching vibrations of bonds in molecules of carbon monoxide and dioxide, respectively. A similar band was appeared at 2341 cm−1 in the FTIR spectrum after the heating at 523 K of Au/CeS (Fig. 8, j spectrum of sample). In the case of Au/CeZrS(2:1) and Au/CeZrS(1:2) (Fig. 4S, k spectra of samples), this band were observed after the heating at 573 K. The bands around 2143 cm−1 can be due to gaseous CO, and the bands at 2342 cm−1 to CO2 formed mainly during the oxidation of CO (Pérez Vélez et al., 2012). CO molecules can be produced in the reducing conditions from methanol and according to the reaction formula:
3.3 Materials characterisation after FTIR in situ study
More details about the structure of copper–gold catalysts were shown in earlier papers (Kaminski et al., 2015; Kaminski and Ziolek, 2014). Additionally, the results of XRD, TEM and XPS measurements for the samples after their application in methanol oxidation and the monitoring using the FTIR in situ spectroscopy were performed.
The XRD patterns of catalysts before and after the FTIR in situ measurements combined with methanol oxidation were presented in Fig. 5S (in the Supporting Information). The position and the intensities of reflections in the XRD patterns suggest that the structure of materials is stable during the experiments. The XRD patterns confirm the results of TEM images (Figs. 6S and 7S in the Supporting Information) that reaction conditions don’t change the structure properties of support and only the slight changes of the average size of metallic gold particles. It means that the interaction between active phase (gold and copper species) and the elements of supports (ceria and zirconia) have got the positive effect on the stability of structure properties during the oxidation of methanol.
The data collected in Table 1 show that copper was mainly in the reduced form (Cu+) on the external surface of the bimetallic copper–gold catalysts before their using in the reaction of methanol oxidation. After the measurements using the FTIR in situ combined with the adsorption and oxidation of methanol molecules, it was observed that the main form of copper was oxidised copper (Cu2+) in the case of CuAu/CeS and CuAu/CeZr(1:2). These differences can be explained by the presence of other metals on the external surface of mesoporous silica SBA-15 and their migration from the bulk of materials to the externals surface (Table 2).
| Catalyst* | Distribution of metal species, % | Molar ratio between metal species, before and after methanol oxidation | ||||||||||
|---|---|---|---|---|---|---|---|---|---|---|---|---|
| Ce3+ | Ce4+ | Cu+ | Cu2+ | Ce4+/Ce3+ | Cu+/Cu2+ | |||||||
| Before* | After | Before* | After | Before* | After | Before* | After | Before* | After | Before* | After | |
| Au/CeS | 29 | 29 | 71 | 71 | – | – | – | – | 2.45 | 2.40 | – | – |
| CuAu/CeS | 38 | 42 | 62 | 58 | 68 | 30 | 32 | 70 | 1.63 | 1.39 | 2.14 | 0.43 |
| Au/CeZrS(2:1) | 38 | 48 | 62 | 52 | – | – | – | – | 1.63 | 1.10 | – | – |
| CuAu/CeZrS(2:1) | 48 | 27 | 52 | 73 | 73 | 81 | 27 | 19 | 1.08 | 2.73 | 2.71 | 4.35 |
| Au/CeZrS(1:2) | 30 | 27 | 70 | 73 | – | – | – | – | 2.33 | 2.77 | – | – |
| CuAu/CeZrS(1:2) | 46 | 42 | 54 | 56 | 54 | 47 | 46 | 53 | 1.17 | 1.37 | 1.19 | 0.90 |
| Au/ZrS | – | – | – | – | – | – | – | – | – | – | – | – |
| CuAu/ZrS | – | – | – | – | 64 | 63 | 36 | 37 | – | – | 1.79 | 1.71 |
| Catalyst* | Metal content (from XPS), wt.% | |||||||
|---|---|---|---|---|---|---|---|---|
| Au | Cu | Ce | Zr | |||||
| Before* | After | Before* | After | Before* | After | Before* | After | |
| Au/CeS | 2.3 | 3.1 | – | – | 3.8 | 10.4 | – | – |
| CuAu/CeS | 1.8 | 2.6 | 6.2 | 1.1 | 3.9 | 6.7 | – | – |
| Au/CeZrS(2:1) | 1.8 | 4.3 | – | – | 3.6 | 3.6 | 1.7 | 2.5 |
| CuAu/CeZrS(2:1) | 1.7 | 2.3 | 7.1 | 1.1 | 1.8 | 3.3 | 0.5 | 1.4 |
| Au/CeZrS(1:2) | 1.8 | 2.4 | – | – | 1.3 | 3.6 | 1.4 | 4.2 |
| CuAu/CeZrS(1:2) | 1.5 | 1.8 | 4.5 | 1.1 | 1.6 | 2.4 | 1.4 | 2.6 |
| Au/ZrS | 1.4 | 2.5 | – | – | – | – | 1.9 | 8.0 |
| CuAu/ZrS | 1.7 | 2.2 | 5.3 | 1.3 | – | – | 1.8 | 3.5 |
In the case of catalysts with cerium species, the main form of this metal on the external surface is oxidised form (Ce4+), but the additions of copper leads to the increase in cerium distribution its reduced form (Ce3+) (Table 1). The presence of cerium has positive effect on the reduction of copper species. It can suggest that in the bimetallic copper–gold catalysts, the modification of these materials by the reduction using NaBH4 leads to the reduction of copper and cerium species to Cu+ and Ce3+, respectively. NaBH4 was used to the reduction of cationic gold, but it could reduce also other metals.
The results of XPS analysis confirmed that the main form of gold in the bimetallic copper–gold and monometallic gold catalysts was Au0 before and after the measurements using the FTIR in situ spectroscopy combined with the adsorption and oxidation of methanol molecules (Table 3).
| Catalyst* | Distribution of gold species, % | |||
|---|---|---|---|---|
| Before* | After | |||
| Au0 | Au3+ | Au0 | Au3+ | |
| Au/CeS | 59 | 41 | 100 | – |
| CuAu/CeS | 59 | 41 | 100 | – |
| Au/CeZrS(2:1) | 60 | 40 | 100 | – |
| CuAu/CeZrS(2:1) | 58 | 42 | 100 | – |
| Au/CeZrS(1:2) | 60 | 40 | 100 | – |
| CuAu/CeZrS(1:2) | 60 | 40 | 100 | – |
| Au/ZrS | 59 | 41 | 100 | – |
| CuAu/ZrS | 59 | 41 | 100 | – |
The high distribution of reduced copper species (Cu+) leads to higher methanol conversion in the reaction of its oxidation. The results of the high activity of bimetallic copper–gold catalysts in methanol oxidation were described in earlier paper (Kaminski and Ziolek, 2014) and they can confirm that the interaction between Cu+ and Au0 species and the possibility of electron transfer between both metals could play the crucial role in the oxidation of methanol in the gas phase.
4 Conclusions
The achieved results show that the FTIR in situ combined with the adsorption of methanol and oxygen can be applied in the study of the mesoporous materials to know the mechanism of oxidation processes in the gas phase. The bands which are seen in the FTIR spectra recorded for copper–gold and gold catalysts after methanol adsorption and its oxidation in situ, can be due to the stretching vibration of bonds in the intermediates on catalyst surface. The selected bands are observed in the case of bimetalic catalysts at lower temperature than analogous monometallic gold catalysts. The chemical reaction between oxygen and the intermediates on the catalyst surface can lead to the transformation of intermediates to fine chemicals, e.g. formaldehyde, methyl formate and/or dimethyl ether – the products of the selective methanol oxidation in the gas phase.
The earlier study published in (Kaminski et al., 2015; Kaminski and Ziolek, 2014) showed that the bimetallic Cu-Au system loaded on SBA-15 modified with ceria and/or zirconia can be applied as the effective catalysts for methanol oxidation or others volatile organic compounds (VOCs). The results of these studies can evidence that the application of FTIR in situ study can be effective method for the estimation of potential application of heterogeneous catalysts in the reaction of methanol oxidation.
The position of bands which are due to the intermediates can suggest that these intermediates can be transform to fine chemicals during the selective oxidation of methanol (formaldehyde and methyl formate) over bimetallic Cu-Au catalysts at lower temperature (∼50 K) than over analogues monometallic gold catalysts. The final products of this reaction at higher temperature oxidation (at 473–573 K) over the bimetallic copper–gold and monometallic gold catalysts are simple gaseous products – carbon mono- and dioxide and vapour water.
Acknowledgments
The author would like to thank for the financial support of research the Polish National Science Centre in Cracow (Poland) (research grant No. 2015/16/T/ST5/00263) and the LLP Erasmus and the Laboratoire Catalyse et Spectrochimie ENSICAEN in Caen (France) for the sharing of FTIR in situ equipment.
References
- Effect of the preparation method and calcination temperature on the oxidation activity of CO at low temperature on CuO–CeO2/SiO2 catalysts. Appl. Catal. A: Gen.. 2013;462–463(2013):56-63.
- [Google Scholar]
- Selective oxidation of 5-hydroxymethyl-2-furfural over TiO2-supported gold-copper catalysts prepared from preformed nanoparticles: effect of Au/Cu ratio. Catal. Today. 2012;195:120-126.
- [Google Scholar]
- New insights into the methanol oxidation mechanism over Au/CeO2 catalyst through complementary kinetic and FTIR operando SSITKA approaches. Catal. Today. 2012;182:3-11.
- [Google Scholar]
- Beck, J.S., Vartuli, C.J., Roth, W.J., Leonowicz, M.E., Kresge, C.T., Schmitt, K.D., Chu, C.T.-W., Olson, D.H., Sheppard, E.W., McCullen, S.B., Higgins, J.B., Schlenker, J.L., 1992. A new family of mesoporous molecular sieves prepared with liquid crystal templates. J. Am. Chem. Soc. 114, 10834–10843.
- Influence of synthesis parameters on the physico-chemical characteristics of SBA-15 type ordered mesoporous silica. Micropor. Mesopor. Mater.. 2012;153:100-114.
- [Google Scholar]
- Quantitative determination of the number of active surface sites and the turnover frequencies for methanol oxidation over metal oxide catalysts I. Fundamentals of the methanol chemisorption technique and application to monolayer supported molybdenum oxide catalysts. Catal. Today. 2000;62:219-229.
- [Google Scholar]
- Infrared studies of the reactive adsorption of organic molecules over metal oxides and of the mechanisms of their heterogeneously-catalyzed oxidation. Catal. Today. 1996;27:457-496.
- [Google Scholar]
- Mechanism of selective methanol oxidation over vanadium oxide-titanium oxide catalysts: a FT-IR and flow reactor study. J. Phys. Chem.. 1987;91:5263-5269.
- [Google Scholar]
- Production of hydrogen by partial oxidation of methanol over bimetallic Au-Cu/TiO2-Fe2O3 catalysts. J. Mol. Catal. A: Chem.. 2009;313:55-64.
- [Google Scholar]
- FTIR study of the surface complexes of β-picoline, 3-pyridine-carbaldehyde and nicotinic acid on sulfated TiO2 (anatase) J. Mol. Catal. A: Gen.. 2013;373:96-107.
- [Google Scholar]
- Synthesis of rod-like silica-gold core-shell structures. Colloid. Surface A. 2011;373:167-171.
- [Google Scholar]
- Bimetallic heterogeneous catalysts for hydrogen production. Catal. Today. 2012;197:190-205.
- [Google Scholar]
- Calcination temperature and CuO loading dependence on CuOCeO2 catalyst activity for water-gas shift reaction. Appl. Catal. A: Gen.. 2008;347:23-33.
- [Google Scholar]
- Elucidating the role of Cu species in the oxidative carbonylation of methanol to dimethyl carbonate on CuY: an in situ spectroscopic and catalytic study. Appl. Catal. A: Gen.. 2010;382:303-311.
- [Google Scholar]
- Catalytic properties of Cu/SBA-3 in oxidative dehydrogenation of methanol – the effect of the support composition. Appl. Catal. A: Gen.. 2011;393:215-224.
- [Google Scholar]
- Sb, V, Nb containing catalysts in low temperature oxidation of methanol – the effect of preparation method on activity and selectivity. J. Catal.. 2011;284:109-123.
- [Google Scholar]
- Methanol oxidation as probe reaction for active sites in Au/ZnO and Au/TiO2 catalysts. J. Catal.. 2013;299:162-170.
- [Google Scholar]
- FTIR spectroscopic study of CO oxidation on bimetallic catalysts. Catal. Today. 2015;243:218-227.
- [Google Scholar]
- Surface and catalytic properties of Ce-, Zr-, Au-, Cu-modified SBA-15. J. Catal.. 2014;312:249-262.
- [Google Scholar]
- Supported niobium catalysts for methanol dehydration to dimethyl ether: FTIR studies of acid properties. Catal. Today. 2012;192:136-143.
- [Google Scholar]
- Structural changes of Au–Cu bimetallic catalysts in CO oxidation: in situ XRD, EPR, XANES, and FT-IR characterizations. J. Catal.. 2011;278:288-296.
- [Google Scholar]
- Propene epoxidation over TiO2-supported Au-Cu alloy catalysts prepared from thiol-capped nanoparticles. J. Catal.. 2008;258:187-198.
- [Google Scholar]
- The effect of particle size on the Au-Au bond distance in supported catalysts and reactivity towards oxygen. J. Catal.. 2006;240:222-234.
- [Google Scholar]
- Microcalorimetric, FTIR, and DFT studies of the adsorption of methanol, ethanol, and 2,2,2-trifluoroethanol on silica. J. Catal.. 1998;175:252-268.
- [Google Scholar]
- Simultaneous and/or separate SO2/NO reduction by CO over high surface area Cu/Ce containing mesoporous silica. Appl. Catal. B: Environ.. 2007;77:66-72.
- [Google Scholar]
- Active states of gold in small and big metal particles in CO and methanol selective oxidation. Fuel. 2013;110:48-53.
- [Google Scholar]
- Preparation and in situ spectroscopic characterization of Cu-clinoptilolite catalysts for the oxidative carbonylation of methanol. Micropor. Mesopor. Mater.. 2012;164:93-98.
- [Google Scholar]
- CuO/CeO2 supported on Zr doped SBA-15 as catalysts for preferential CO oxidation (CO-PROX) J. Power Sources. 2011;196:4382-4387.
- [Google Scholar]
- Dehydration of methanol to dimethyl ether over Nb2O5 and NbOPO4 catalysts: Microcalorimetric and FT-IR studies. J. Mol. Catal. A. 2007;275:183-193.
- [Google Scholar]
- Methanol oxidation as a catalytic surface probe. Appl. Catal. A: Gen.. 1997;148:213-252.
- [Google Scholar]
- The effects of H2O and SO2 on the behaviour of CuSO4-CeO2/TS for low temperature catalytic reduction of NO with NH3. Environ. Technol.. 2011;32(8):891-900.
- [Google Scholar]
- Methanol oxidation on VSiBEA zeolites: influence of V content on the catalytic properties. J. Catal.. 2010;281:169-176.
- [Google Scholar]
- Iron modified MCM-41 materials characterised by methanol oxidation and sulphurisation reactions. Catal. Lett.. 2006;108:141-146.
- [Google Scholar]
- Silica supported copper and cerium oxide catalysts for ethyl acetate oxidation. J. Colloid Interface Sci.. 2013;404:155-160.
- [Google Scholar]
- Aerosol processing of mesoporous silica supported bimetallic catalysts for low temperature acetone oxidation. Catal. Today. 2011;174:70-78.
- [Google Scholar]
- Determination of the Au active site and surface active species via operando transmission FTIR and isotopic transient experiments on 2.3 wt.% Au/TiO2 for the WGS reaction. J. Catal.. 2012;289:171-178.
- [Google Scholar]
- Triblock copolymer syntheses of mesoporous silica with periodic 50 to 300 angstrom pores. Science. 1998;279:548-552.
- [Google Scholar]
Appendix A
Supplementary material
Supplementary data associated with this article can be found, in the online version, at http://dx.doi.org/10.1016/j.arabjc.2017.08.004.
Appendix A
Supplementary material


