

Translate this page into:
The concentration and health risk assessment of potentially toxic elements (PTEs) in mustard greens
* Corresponding author: E-mail address: mustafa.kamal@kfueit.edu.pk (G. Mustafa Kamal)
-
Received: ,
Accepted: ,
Abstract
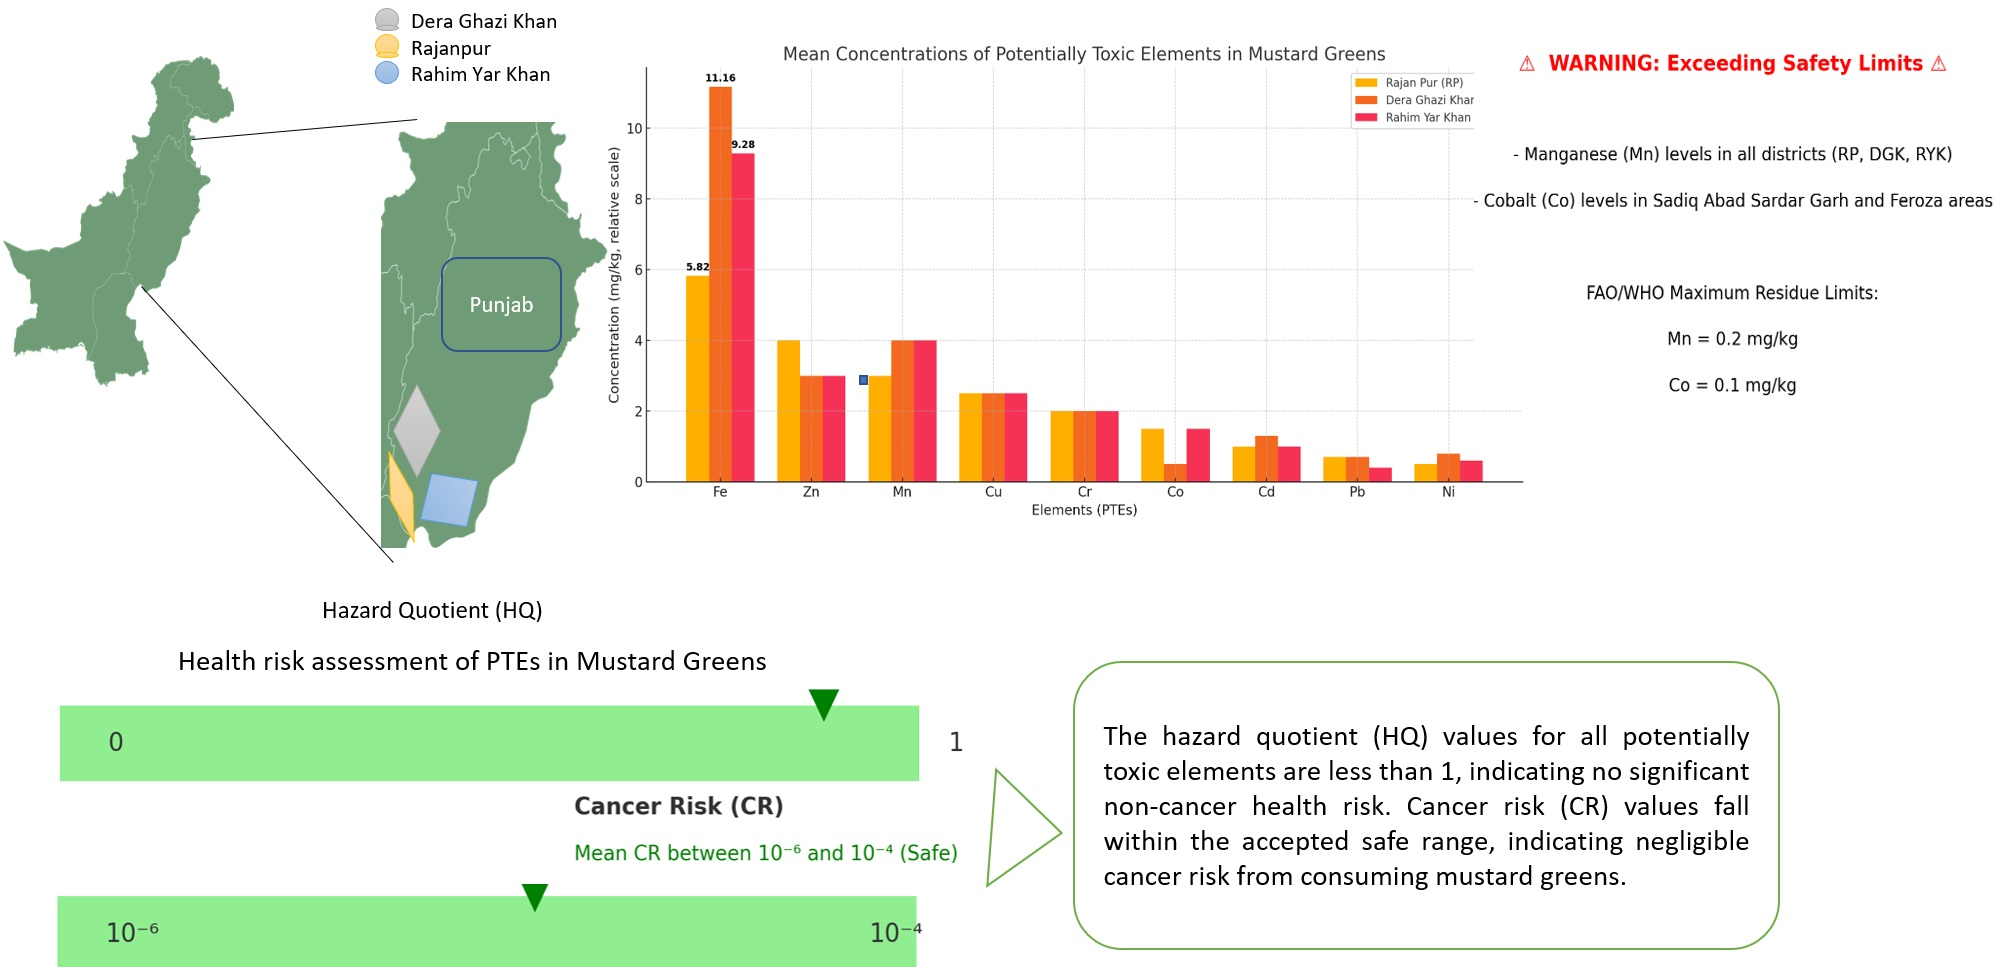
The concentration of potentially toxic elements (PTEs) in samples of mustard greens from sub-sites of the southern districts of Punjab, Rajan Pur (RP), Dera Ghazi Khan (DGK), and Rahim Yar Khan (RYK) was assessed using atomic absorption spectrometry (AAS). The mean concentrations of PTEs in mustard greens samples from sub-sites of district RP were in decreasing order of Fe>Zn>Mn>Cu>Cr>Co>Cd>Pb>Ni. The mean concentrations of PTEs assessed among the mustard green samples from sub-sites of district RYK were determined in the order of Fe>Mn>Zn>Cu>Cr>Co>Cd>Ni>Pb. The mean concentrations of PTEs among mustard greens samples from sub-sites of district DGK have shown the order of Fe>Mn>Zn>Cu>Cr>Cd>Ni>Pb>Co. Mean concentrations of Fe were found to be highest among all the districts (DGK: 11.16 mg/kg, RYK: 9.281 mg/kg, and RP: 5.821 mg/kg) than any other PTE mean concentrations. Concentrations of Mn from all sub-sites of all three districts (RP, DGK, and RYK) and concentrations of Co from Sadiq Abad Sardar Garh, and Feroza were exceeding the allowed maximum residue limits (Mn: 0.2 mg/kg and Co: 0.1 mg/kg) recommended by the Food and Agriculture Organization (FAO) and World Health Organization (WHO). Values of chronic dietary intake (CDI) for Cd, Co, Cr, Cu, Fe, Mn, Ni, Pb, and Zn were recorded under the safe limits suggested by FAO/WHO 0.001, 0.03, 0.003, 0.037, 0.7, 0.083, 0.02, 0.0015, and 0.3 (in mg/kg/day), respectively. The hazard quotient (HQ) and cancer risk (CR) levels for all said PTEs were analyzed under the limits (HQ: <1, CR: 10-6-10-4). Results indicate that the mean HQ values of all the said PTEs found under the threshold limits (<1) are within the safe limits. CR for all mentioned PTEs were under the permissible limit (10-6-10-4), revealing that there is no apparent risk to health. The findings are very useful for the end users and the food safety authorities to consider for the suitable measures to be taken. These findings will thus prompt the relevant parties to take the required precautions against hazardous metal exposure.
Keywords
Health risk assessment
Mustard greens
Pakistan
Potentially toxic elements (PTEs)
Toxicity

1. Introduction
As a member of the Cruciferae family, the vegetable species mustard green (Brassica juncea) has enormous commercial importance [1]. Mustard was one of the earliest vegetables to be produced and one of the earliest species documented in history, as per Sanskrit writings from around 3000 B.C. [2]. The word “mustard” is derived from the Latin word “mustum” and was originally used to describe a condiment [3,4]. Mustard greens constitute a great source of vitamins and minerals that the human body requires in order to function at its best [5]. Green leafy vegies like mustard greens contain vitamin C (27.6-107 mg/100 g edible parts), β-carotene (1825-4760 µg/100 g edible parts), and riboflavin (0.15-0.55 mg/100 g edible parts) [6]. Cooked mustard greens can provide up to 100% of the recommended daily intake of vitamin A [7]. Eating lots of green veggies that are leafy, such as mustard greens, lowers your chances of cardiovascular disease [8]. They also comprise nutrients that protect plaque from accumulating in arteries, which might result in heart problems [7]. Moreover, a single serving of mustard greens provides the vitamin K needed for a whole day [7]. This vitamin improves coagulation of blood and cardiac function [9]. Mustard greens contain beneficial antioxidants such as lutein and zeaxanthin [10]. Studies reveal that these two antioxidants assist in alleviating age-associated vision loss and are necessary for supporting healthy eyes [11].
Potentially toxic elements (PTEs) were observed in mustard greens in various countries across the world, and Pakistan is also facing the same situation [12,13]. However, PTEs in mustard green from Bajaur Agency were observed exceeding their limits; the study illuminates that PTEs are contaminating the vegetables in Pakistan [14]. There have been four main entrance points for PTEs into soils: atmosphere to soils, solid waste to soil, sewage to soils, and agricultural supplies to soils [15,16]. The cation exchange capacity, soil pH, organic matter content, soil texture, and interactions between the target elements were identified as factors affecting the bioavailability of metals and their presence in crops. It is determined that the primary regulators of metal contents in plants are the overall concentrations of metals in soils [17].
When present at an optimum level, different PTEs, like Co, Cu, Fe, Mn, Mo, Ni, and Zn, are beneficial to the biological system [17]; yet, if they are above the permissible levels, they are harmful to the environment [18]. Excessive accumulation in agricultural soils may result not only in soil contamination, but also consequences for food quality and safety [19]. So, it is essential to monitor food quality, given that plant uptake is one of the main pathways through which heavy metals (HMs) enter the food chain [20].
Although some trace metals act as micronutrients to maintain normal body function, exposure to elements such as Cr, Cu, As, and Zn can result in neurologic disorders, headaches, and renal and liver diseases when they exceed safe limits [21]. There is also evidence that long-term exposure to low doses of some PTEs may increase the incidence of cancer [22,23]. Van Maele-Fabry et al. found that dietary Cd intake through ingestion of contaminated rice and other vegetables was directly related to the incidence of postmenopausal breast cancer. Increased risk of lung cancer has been observed as a result of occupational exposure to mists and dusts containing hexavalent chromium [24].
Numerous reports that show the presence of HMs in plant-based foods, including vegetables and fruits, are available in the literature. Concentration and risk assessment of PTEs like Pb and Cd were conducted in vegetables and cereals consumed in Western Iran [25]. Similarly, another study from Iran reports the determination of concentration and assessment of health risks of PTEs in Iranian rice [26]. Another research reported a multi-element assessment of potentially toxic and essential elements in new and traditional food varieties in Sweden [27].
Mustard greens (Saag) is a traditional dish of Punjab, Pakistan, made with the green leaves of the mustard plant [28]. The southern cities of Punjab, Pakistan, are drought-hit and face the issue of high salinity in the soil and water. The probability of a high concentration of PTEs in crops grown in these areas is high. According to the literature, this type of research has not been done previously in these study areas. Hence, there is a need to investigate the concentrations and health risk assessment of PTEs in mustard greens from the southern districts of Punjab, Pakistan. Furthermore, the study has focused on estimating the chronic daily intake (CDI), hazard quotient (HQ), and cancer risk (CR) values of PTEs. The current research is the first comprehensive report to estimate PTEs in mustard greens samples from these sub-sites, as per our knowledge. Assessing the risk assessment of PTEs in mustard greens samples of different sub-sites will help us understand the problem’s severity.
2. Materials and Methods
2.1. Study sites
The selected study sites have been shown in the Figure 1.
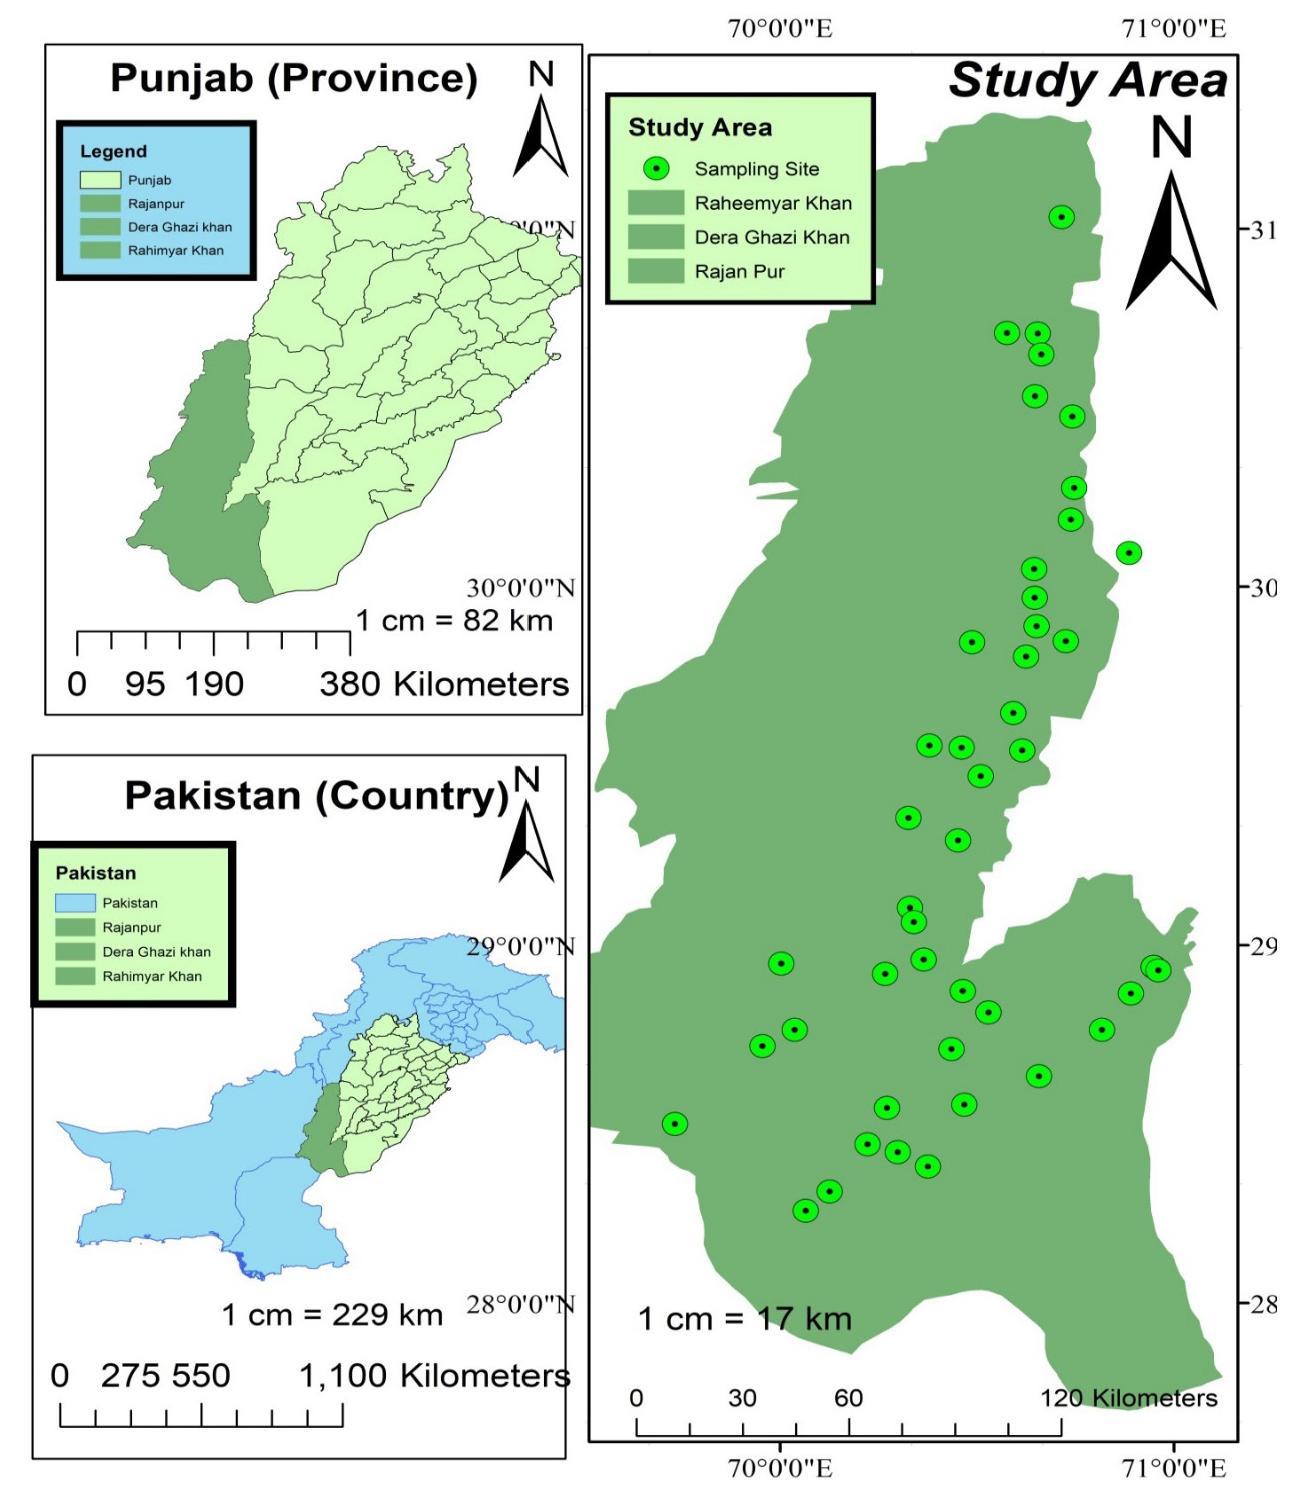
- Geographic Information System map of the sub-sites of three southern districts (RP, RYK and DGK) of Punjab, Pakistan.
2.2. Sample collection
There are 45 samples of mustard greens collected for the study from different sub-sites of three southern districts of Punjab, as shown in Figure 1. All the Samples were collected from different local farm fields of district Rajan Pur (RP), Dera Ghazi Khan (DGK), and Rahim Yar Khan (RYK), and moved to the laboratory. Until further examination, all of the samples were stored at normal temperature until further analysis.
2.3. Chemicals required
The following chemicals and reagents were used for the digestion of the mustard green samples.
-
Sulfuric acid (H2SO4), 98% Sigma Aldrich, USA
-
Nitric acid (HNO3), 65%, Sigma Aldrich, USA
-
Hydrogen peroxide (H2O2), 30%, Sitara Peroxide Ltd. Pakistan
-
Distilled water
2.4. Sample preparation and digestion
A well-known acid digestion methodology was adopted for elemental analysis [29]. All the samples were rinsed with tap water and cut into small pieces with a stainless-steel knife. The cut pieces were then washed with distilled water, homogenized, and air dried. A sample of 30 g of mustard greens was collected in a China dish and placed in a furnace for 2-3 hrs at 300°C for ashing. A glass beaker was filled with 0.2 g of the sample’s ash. Vegetable samples were fully digested using the acidic digestion process with a solution of nitric and sulfuric acids. After this, 10 mL of 70 % v/v HNO3 and 5 mL of H2SO4 were added in a ratio of 2:1 mL into each sample. To allow the organic contents in the acid-treated samples to thoroughly degrade and be maintained at room temperature for an entire day. The following day, samples were heated at 300°C on a magnetic hot plate. During the heating, 3 mL of hydrogen peroxide was added to the sample solution until it became transparent or colorless. Hydrogen peroxide made the solution and its fumes transparent. Finally, sample solutions were filtered with a filter paper and then diluted with 30 mL ultrapure deionized water. Deionized water was used for glassware washing and sample treatment from throughout the analysis in the laboratory [30].
2.5. Determination of potentially toxic elements
An atomic absorption spectrophotometer (Hitachi Polarized Zeeman AAS, Z-8200, Japan) was used for determining the concentration of HMs in the treated samples under the conditions mentioned in association of official agricultural chemists (AOAC) (1990). The elements that were chosen were Zn, Ni, Cd, Co, Cu, Cr, Fe, Pb, and Mn. Operating conditions of the instrument for the mentioned elements have been described in Table 1.
| Elements | Wavelength (nm) | Slit width (nm) | Lamp current (mA) | Burner head | Flame | Burner height (mm) | Oxidant gas pressure (Flow rate) (kpa) | Fuel gas pressure (Flow rate) (kpa) |
|---|---|---|---|---|---|---|---|---|
| Cadmium (Cd) | 228.8 | 1.3 | 7.5 | Standard type | Air-C2H2 | 5.0 | 160 | 6 |
| Cobalt (Co) | 240.7 | 0.2 | 12.5 | Standard type | Air-C2H2 | 7.5 | 160 | 7 |
| Copper (Cu) | 324.8 | 1.3 | 7.5 | Standard type | Air-C2H2 | 7.5 | 160 | 7 |
| Chromium (Cr) | 359.3 | 1.3 | 7.5 | Standard type | Air-C2H2 | 7.5 | 160 | 12 |
| Iron (Fe) | 248.3 | 0.2 | 10 | Standard type | Air-C2H2 | 7.5 | 160 | 6 |
| Lead (Pb) | 283.3 | 1.3 | 7.5 | Standard type | Air-C2H2 | 7.5 | 160 | 7 |
| Manganese (Mn) | 279.6 | 0.4 | 7.5 | Standard type | Air-C2H2 | 7.5 | 160 | 7 |
| Nickel (Ni) | 232.0 | 0.2 | 10.0 | Standard type | Air-C2H2 | 7.5 | 160 | 7 |
| Zinc (Zn) | 213.9 | 1.3 | 10.0 | Standard type | Air-C2H2 | 7.5 | 160 | 6 |
2.6. Standards preparation
An aqueous solution (1000 ppm) of the commercially available stock solution (AppliChem®) was used to prepare calibrated standards. Calibrated standards were prepared using highly pure de-ionized water. All glassware apparatus utilized for the analytical procedure was immersed in 8N HNO3 for an entire night [31].
2.7. Health risk assessment
2.7.1. Chronic daily intake (mg/kg/day)
The following formula [32] was used to calculate the CDI values of said PTEs (Eq. 1).
Where “C” stands for the concentration of PTEs in the sample of mustard greens (mg/kg or ppm). “DI” indicates daily mustard greens consumption in kg/day, and “BW” shows the average body weight [33]. Daily intake of mustard greens sample is 105.7 g/day or 0.1057 kg/day [34].
2.7.2. Hazard quotient (ppm)
The values of HQ of the mentioned PTEs were calculated. It is a ratio of CDI and oral reference dose [32]. The following formula was used to calculate the HQ values for PTEs (Eq. 2).
Where “CDI” denotes chronically daily intake of PTEs, and “RfD” signifies the oral reference dose, which is the US Environmental Protection Agency’s estimate of the maximum dose of a toxic substance that a human may consume. Values of oral reference doses quoted by various monitoring organizations have been listed in Table 2.
| PTEs | Oral reference dose (RfD) (mg/kg) | References |
|---|---|---|
| Cd | 0.001 | USEPA (2011) |
| Co | 0.020 | USDOE (2011) |
| Cu | 0.037 | USEPA (2011) |
| Cr | 0.003 | USDOE (2011) |
| Fe | 0.700 | USEPA (2011) |
| Ni | 0.020 | IRIS USEPA |
| Mn | 0.083 | - |
| Pb | 0.003 | WHO (1993) |
| Zn | 0.300 | USEPA (2011) |
2.7.3. Hazard Index
The values of hazard index (HI = ∑HQ Cd + HQ Co + HQ Cu + HQ Cr + HQ Fe + HQ Mn + HQ Ni + HQ Pb + HQ Zn ….... + HQ n) were determined by adding individual HQ values of each metal together. HI values higher than or equal to 1 show a risk to human health [35].
2.7.4. Cancer risk
It is possible to calculate the CRs associated with a certain dosage of PTEs present in vegetables. The incremental chance of a person acquiring any type of cancer in their lifetimes as a result of being exposed to a carcinogen is to known as CR. Formula was given by Gržetić I et al. [36] (Eq. 3).
Here “CDI” indicates the chronically daily intake values of PTEs (mg/kg/day) and “SF” shows the cancer slope factor (mg/kg/day). The slope factor translates estimated daily intake (EDI), averaged over a lifespan, of direct contact to the incremental risk of an individual’s cancer development. The acceptable limit for a particular carcinogenic element is regarded to be between 10- 6 to 10-4 [32].
2.8. Statistical evaluation
To analyze the minimum, maximum, mean concentrations, standard deviation, and correlation coefficient of the PTEs by using statistical software SPSS-V27.0.1.0 (2019) was practiced. Figures of results were discussed in mean ± standard deviation (±SD).
3. Results and Discussion
3.1. District Dera Ghazi Khan results
Table 3 consists on the detailed concentrations of selected PTEs that revealed the mean concentrations of PTEs ware observed in order of Fe (11.16 mg/kg)>Mn (2.019 mg/kg)>Zn (1.452 mg/kg)>Cu (0.369 mg/kg)>Cr (0.205 mg/kg)>Cd (0.0347 mg/kg)>Ni (0.0318 mg/kg)>Pb (0.03 mg/kg)>Co (0.025 mg/kg), respectively. Results have shown that the Fe (11.974 mg/kg) from Kot Chutta possessed the highest concentration. The level of Co (0.005 mg/kg) has shown the least concentration in the mustard greens sample from Shadan Lund. Only Mn exceeds the allowed maximum residue limit (0.2 mg/kg) recommended by WHO/FAO. Concentrations of Co from Mana Ahmadani, Choti Zereen, Kot Chutta, Shah Sadar Deen, and concentrations of Pb from Mana Ahmadani, Choti Zereen, DGK, and Tibi Qaisrani were not detected (ND).
| Sub-sites | Element concentration (mg/kg) | ||||||||
|---|---|---|---|---|---|---|---|---|---|
| Cd | Cu | Co | Cr | Fe | Ni | Mn | Pb | Zn | |
| Mana Ahmadani | 0.024 | 0.337 | ND | 0.220 | 10.4 | 0.036 | 2.12 | ND | 1.33 |
| DGK | 0.046 | 0.497 | 0.023 | 0.228 | 11.9 | 0.033 | 2.17 | ND | 1.72 |
| Choti Zereen | 0.026 | 0.259 | ND | 0.145 | 10.9 | 0.029 | 1.42 | ND | 1.17 |
| Ghazi Ghaat | 0.056 | 0.374 | 0.035 | 0.201 | 11.3 | 0.035 | 1.98 | 0.04 | 1.42 |
| Kot Chutta | 0.024 | 0.351 | ND | 0.230 | 12.0 | 0.036 | 2.21 | 0.02 | 1.79 |
| Paigah | 0.018 | 0.502 | 0.030 | 0.207 | 11.9 | 0.037 | 2.19 | 0.03 | 1.36 |
| Jhok Utra | 0.049 | 0.328 | 0.038 | 0.237 | 11.3 | 0.029 | 2.02 | 0.02 | 1.60 |
| Taunsa | 0.030 | 0.266 | 0.026 | 0.215 | 10.9 | 0.025 | 1.47 | 0.03 | 1.20 |
| Shadan Lund | 0.060 | 0.345 | 0.005 | 0.178 | 10.4 | 0.039 | 2.20 | 0.04 | 1.38 |
| Shah Sadar Deen | 0.027 | 0.380 | ND | 0.201 | 11.9 | 0.031 | 2.15 | 0.04 | 1.72 |
| Peer Adil | 0.029 | 0.399 | 0.018 | 0.157 | 11.2 | 0.027 | 2.10 | 0.02 | 1.48 |
| Basti Bohar | 0.038 | 0.350 | 0.027 | 0.237 | 10.5 | 0.036 | 1.92 | 0.02 | 1.67 |
| Tibi Qaisrani | 0.017 | 0.488 | 0.014 | 0.218 | 11.2 | 0.022 | 2.07 | ND | 1.42 |
| Mangrotha | 0.052 | 0.280 | 0.023 | 0.206 | 10.3 | 0.036 | 2.24 | 0.04 | 1.33 |
| Jhok Yaran Wali | 0.020 | 0.370 | 0.032 | 0.189 | 11.5 | 0.028 | 2.04 | 0.02 | 1.20 |
| Minimum | 0.017 | 0.259 | 0.005 | 0.145 | 10.3 | 0.022 | 1.42 | 0.02 | 1.17 |
| Maximum | 0.060 | 0.502 | 0.038 | 0.237 | 12.0 | 0.039 | 2.24 | 0.04 | 1.79 |
| Mean | 0.034 | 0.368 | 0.025 | 0.205 | 11.2 | 0.032 | 2.02 | 0.03 | 1.45 |
| ±SD | 0.014 | 0.077 | 0.010 | 0.027 | 0.60 | 0.005 | 0.25 | 0.01 | 0.20 |
| Allowed maximum residue limits | 0.2 | 73.3 | 0.1 | 2.3 | 425.5 | 67.9 | 0.2 | 0.3 | 99.4 |
3.2. District Rajan Pur results
Mean concentration of PTEs ware detected in decreasing order of Fe (5.821 mg/kg)>Zn (1.7909 mg/kg)>Mn (1.022 mg/kg)>Cu (0.219 mg/kg)>Cr (0.1064 mg/kg)>Co (0.035 mg/kg)>Cd (0.032 mg/kg)>Pb (0.029 mg/kg)>Ni (0.0234 mg/kgs), as described in Table 4. The highest concentration was recorded for Fe (7.401 mg/kg) from the Kotla Mughlan subsite. The level of Cd (0.012 mg/kg) has shown the least concentration in mustard greens sample from the Haji Pur sub-site. Concentrations of all PTEs in mustard greens samples from all sub-sites never exceed their allowed maximum residue limits recommended by FAO/WHO, but Mn exceeds the permissible limit (0.2 mg/kg) in mustard greens from all sub-sites of the RP district.
| Sub-site | Elemental concentration (mg/kg) | ||||||||
|---|---|---|---|---|---|---|---|---|---|
| Cd | Cu | Co | Cr | Fe | Ni | Mn | Pb | Zn | |
| Rojhan | 0.031 | 0.289 | ND | 0.144 | 6.583 | 0.028 | 1.403 | ND | 2.156 |
| Umer Kot | 0.018 | 0.154 | ND | 0.092 | 6.948 | 0.018 | 0.915 | 0.025 | 1.039 |
| RP | 0.052 | 0.215 | 0.032 | 0.123 | 4.494 | 0.022 | 1.175 | 0.019 | 0.923 |
| Fazil Pur | 0.026 | 0.256 | ND | 0.093 | 4.850 | 0.029 | 0.896 | 0.045 | 1.236 |
| Jam Pur | 0.037 | 0.177 | ND | 0.080 | 6.034 | 0.020 | 0.761 | 0.025 | 1.062 |
| Shahwali | 0.030 | 0.297 | 0.051 | 0.131 | 5.863 | 0.016 | 0.937 | 0.03 | 1.2607 |
| Jhandi | 0.021 | 0.169 | 0.019 | 0.142 | 6.839 | 0.029 | 1.115 | 0.021 | 0.936 |
| Kot Mithan | 0.055 | 0.157 | 0.033 | 0.090 | 5.834 | 0.019 | 0.901 | 0.015 | 1.048 |
| Muhammad Pur | 0.029 | 0.239 | 0.025 | 0.064 | 6.143 | 0.024 | 1.369 | 0.047 | 2.0233 |
| Qazi wala | 0.041 | 0.223 | ND | 0.078 | 4.583 | 0.027 | 0.796 | ND | 1.176 |
| Dajal | 0.026 | 0.279 | 0.035 | 0.113 | 4.337 | 0.027 | 0.881 | 0.022 | 1.356 |
| Haji Pur | 0.012 | 0.176 | 0.032 | 0.154 | 5.134 | 0.016 | 1.345 | 0.028 | 1.927 |
| Kotla Mughlan | 0.030 | 0.170 | ND | 0.102 | 7.401 | 0.025 | 1.155 | ND | 7.555 |
| Murghai | 0.048 | 0.261 | 0.046 | 0.077 | 5.710 | 0.031 | 0.893 | 0.045 | 2.049 |
| Khajee Wala | 0.021 | 0.218 | 0.039 | 0.114 | 6.569 | 0.021 | 0.789 | 0.019 | 1.117 |
| Minimum | 0.012 | 0.154 | 0.019 | 0.063 | 4.337 | 0.015 | 0.761 | 0.015 | 0.923 |
| Maximum | 0.055 | 0.297 | 0.051 | 0.154 | 7.401 | 0.031 | 1.403 | 0.047 | 7.555 |
| Mean | 0.032 | 0.219 | 0.035 | 0.107 | 5.821 | 0.024 | 1.022 | 0.029 | 1.791 |
| ±SD | 0.013 | 0.050 | 0.010 | 0.028 | 0.964 | 0.005 | 0.220 | 0.011 | 1.653 |
| Allowed maximum residue limits | 0.2 | 73.3 | 0.1 | 2.3 | 425.5 | 67.9 | 0.2 | 0.3 | 99.4 |
SD: Standard deviation
3.3. District Rahim Yar Khan results
Mean Concentrations of the said PTEs recorded in the decreasing order of Fe (9.281 mg/kg)>Mn (1.661mg/kg)>Zn (1.5767 mg/kg)>Cu (0.2759 mg/kg)>Cr (0.169 mg/kg)>Co (0.073 mg/kg)>Cd (0.0323 mg/kg)>Ni (0.027mg/kg)>Pb (0.0163 mg/kg), as discussed in Table 5. Table 5 revealed that the Fe (11.92 mg/kg) from Ameen Garh possessed the highest concentration. The level of Pb (0.003 mg/kg) has shown the least concentration in the mustard greens sample from Chowk Bahadur Pur. Concentrations of all PTEs in mustard greens samples from all sub-sites never exceed their allowed maximum residue limits recommended by FAO/ WHO, except Mn. Concentrations of Mn in samples from all sub-sites were higher than the permissible limit (0.2 mg/kg). Concentrations of Co from Sadiq Abad, Sardar Garh, and Feroza were exceeding from the allowed maximum residue limits (0.1 mg/kg). Concentrations of Co from Iqbal Abad, RYK, Chachraan Shareef, Kot Samaba, and Pb from Iqbal Abad, Sadiq Abad, Zahir Peer, and Islam Nagar were ND.
| Sub-sites | Element concentration (mg/kg) | ||||||||
|---|---|---|---|---|---|---|---|---|---|
| Cd | Cu | Co | Cr | Fe | Ni | Mn | Pb | Zn | |
| Iqbal Abad | 0.040 | 0.286 | ND | 0.142 | 11.42 | 0.030 | 1.359 | ND | 1.713 |
| Ameen Garh | 0.038 | 0.334 | 0.055 | 0.213 | 11.92 | 0.036 | 2.038 | 0.028 | 1.850 |
| Sadiq Abad | 0.031 | 0.242 | 0.154 | 0.236 | 11.67 | 0.026 | 2.221 | ND | 1.470 |
| RYK | 0.022 | 0.262 | ND | 0.106 | 6.383 | 0.029 | 0.999 | 0.005 | 1.972 |
| Khan Pur | 0.036 | 0.296 | 0.032 | 0.218 | 9.697 | 0.028 | 1.984 | 0.019 | 1.589 |
| Chowk Bahadur Pur | 0.034 | 0.279 | 0.037 | 0.202 | 11.34 | 0.018 | 1.116 | 0.003 | 1.927 |
| Sardar Garh | 0.025 | 0.243 | 0.138 | 0.161 | 6.340 | 0.034 | 1.639 | 0.034 | 1.503 |
| Zahir Peer | 0.028 | 0.212 | 0.049 | 0.225 | 9.115 | 0.025 | 1.337 | ND | 1.687 |
| Chahchraan Shareef | 0.041 | 0.313 | ND | 0.122 | 11.80 | 0.019 | 2.205 | 0.006 | 1.812 |
| KFUEIT RYK | 0.046 | 0.287 | 0.055 | 0.088 | 9.042 | 0.029 | 1.999 | 0.011 | 0.973 |
| Machi Goth | 0.036 | 0.324 | 0.049 | 0.144 | 6.010 | 0.025 | 2.190 | 0.024 | 1.203 |
| Islam Nagar | 0.032 | 0.298 | 0.035 | 0.109 | 8.527 | 0.027 | 1.001 | ND | 1.274 |
| Kot Samaba | 0.026 | 0.224 | ND | 0.213 | 11.64 | 0.019 | 1.373 | 0.004 | 1.404 |
| Feroza | 0.019 | 0.262 | 0.145 | 0.197 | 8.603 | 0.033 | 1.709 | 0.029 | 1.712 |
| Metla Chowk | 0.031 | 0.279 | 0.056 | 0.159 | 5.709 | 0.025 | 1.743 | 0.016 | 1.564 |
| Minimum | 0.019 | 0.212 | 0.032 | 0.088 | 5.709 | 0.018 | 0.999 | 0.003 | 0.973 |
| Maximum | 0.046 | 0.334 | 0.154 | 0.236 | 11.92 | 0.036 | 2.221 | 0.034 | 1.972 |
| Mean | 0.033 | 0.276 | 0.073 | 0.169 | 9.281 | 0.027 | 1.661 | 0.016 | 1.577 |
| ±SD | 0.008 | 0.036 | 0.047 | 0.049 | 2.318 | 0.005 | 0.440 | 0.012 | 0.280 |
| Allowed maximum residue limits | 0.2 | 73.3 | 0.1 | 2.3 | 425.5 | 67.9 | 0.2 | 0.3 | 99.4 |
SD: Standard deviation
3.4. Comparison of mean concentrations of PTEs among the districts (DGK, RP and RYK)
Figure 2 indicates that the mean concentrations of the under consideration PTEs were calculated. Except for Co and Zn, mean concentrations of said PTEs are higher in mustard green from DGK than in those from RYK and RP. Mean concentration of PTEs in mustard green from district RYK is greater than the concentrations of PTEs in mustard green from RP, except for Pb and Zn. Mean concentrations of PTEs in mustard greens from said districts are influenced by the factors size, population, and industrial sites present in the relevant district. The development factor decreased from the northern cities of Punjab to the southern cities of Punjab. As per the figure of results, mean concentrations of PTEs in mustard greens from DGK are greater than both other districts’ results because the DGK district has a greater number of factors affecting the vegetables, like industries and factories. And likewise, RYK is more developed and has a larger number of industries and factories than district RP. Therefore, the mean concentration of PTEs lies in order of DGK>RYK>RP. The same has been observed in the contour plot representing the variation in concentration of PTEs in the mustard green samples from the southern districts (RP, RYK, and DCK) of Punjab, Pakistan as shown in Figure 3.
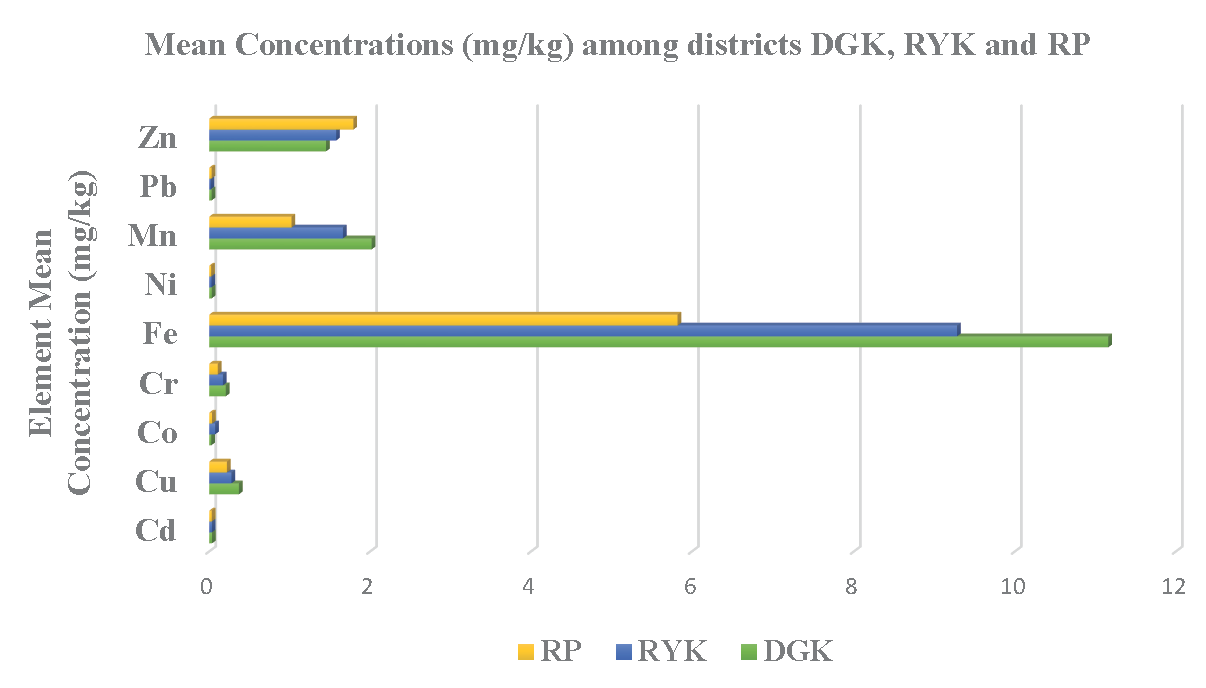
- Graph representing the comparison of mean concentration of PTEs among the districts (DGK, RP and RYK).
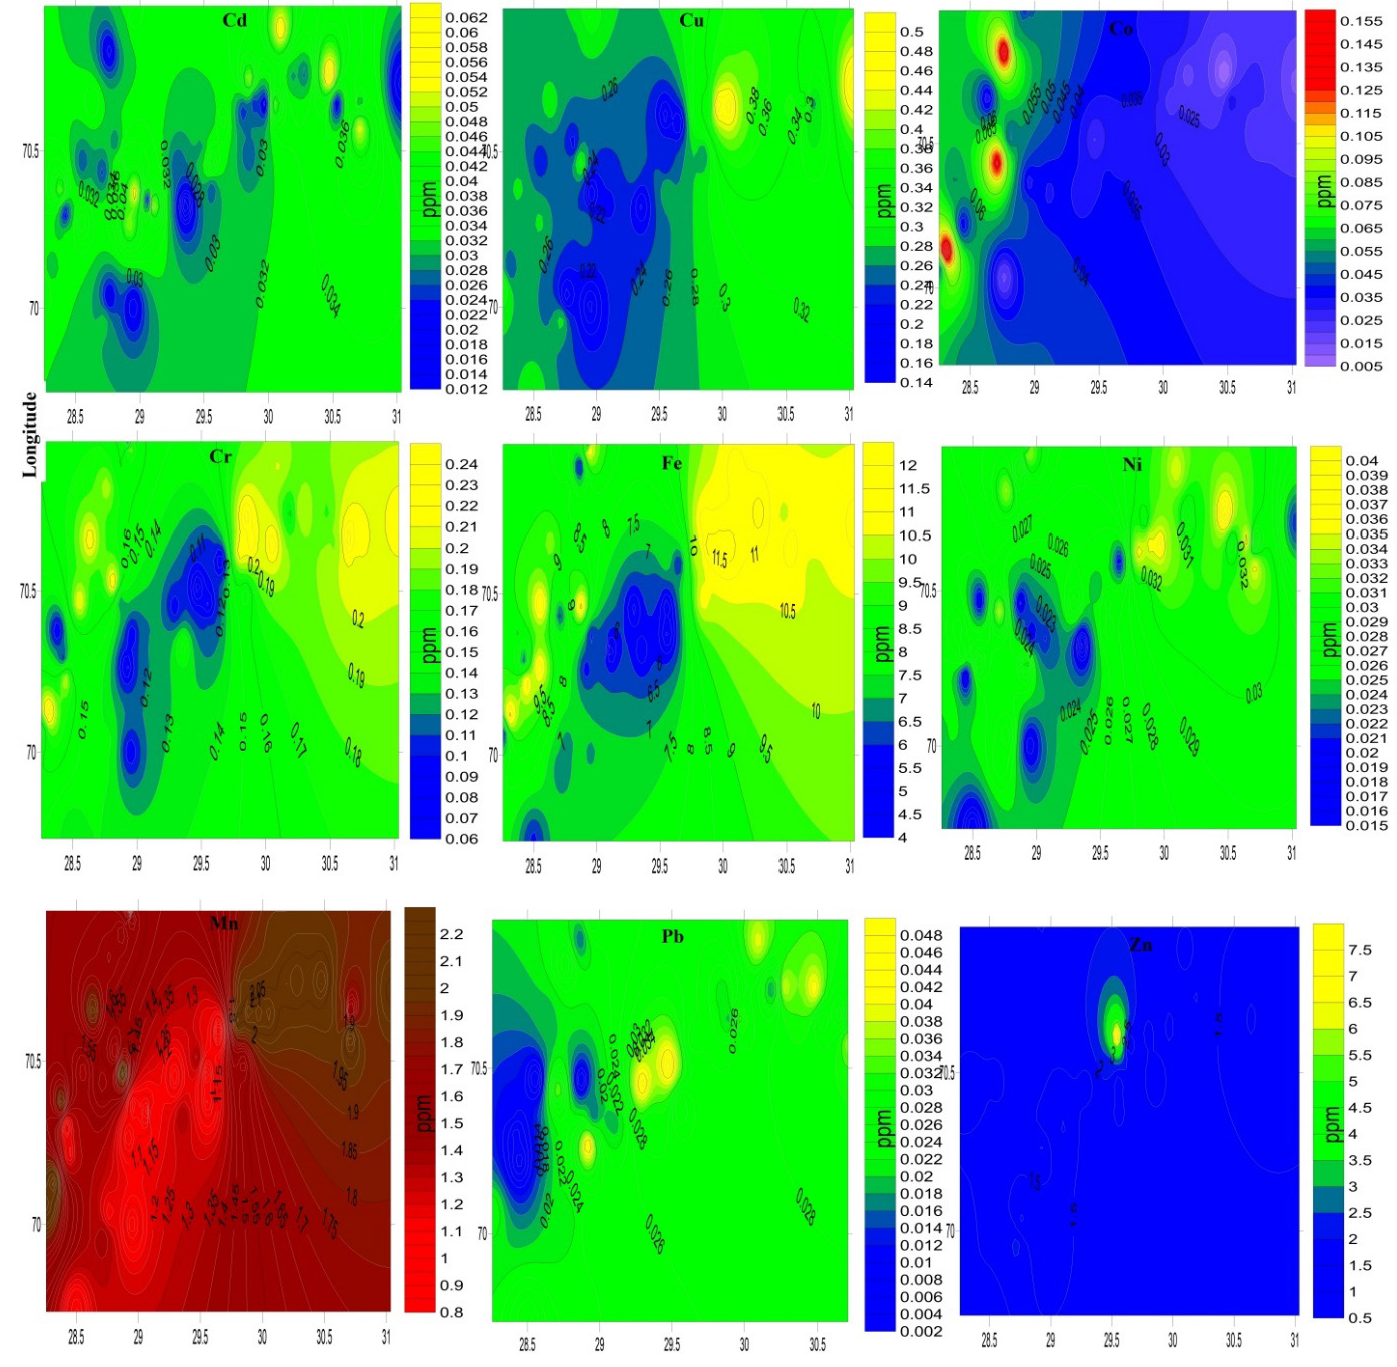
- Contour map representing the variation in concentrations of PTEs in mustard greens samples from southern districts (RP, RYK and DGK) of Punjab, Pakistan.
3.5. Correlation among PTEs concentration
Pearson correlation coefficient was established to statistically analyze the associated relationship among the PTEs in mustard greens from district DGK subsites. Positively significant correlation of Cd was found with Cr, Mn, Pb, Zn, and Cu with Cr, Fe, Mn, Zn, and Co with Cr, Fe, Zn, and Cr has positive correlation with all PTEs except Pb, and Fe with Mn and Zn, and Ni with Mn, Pb and Zn, and Mn with Pb and Zn, as mentioned in Table 6.
| DGK | Correlation coefficient | ||||||||
|---|---|---|---|---|---|---|---|---|---|
| Element | Cd | Cu | Co | Cr | Fe | Ni | Mn | Pb | Zn |
| Cd | 1 | ||||||||
| Cu | -0.241 | 1 | |||||||
| Co | -0.072 | -0.129 | 1 | ||||||
| Cr | 0.065 | 0.218 | 0.437 | 1 | |||||
| Fe | -0.370 | 0.600 | 0.395 | 0.144 | 1 | ||||
| Ni | 0.440* | -0.026 | -0.044 | 0.139 | -0.153 | 1 | |||
| Mn | 0.169 | 0.540 | -0.274 | 0.298 | 0.230 | 0.462 | 1 | ||
| Pb | 0.506 | -0.099 | -0.352* | -0.252 | -0.251 | 0.384 | 0.164 | 1 | |
| Zn | 0.147 | 0.353 | 0.050 | 0.529 | 0.473 | 0.237 | 0.491 | -0.232 | 1 |
Statistically significant correlation among the PTEs are bold values at (p<0.05)
Statistically not significant correlation among the PTEs is asterisk* values at (p>0.05)
Table 7 contains the correlation coefficient among the PTEs in mustard green from district RP subsites, which shows a positive significant correlation of Cd with Cu, Ni, and positive significant correlation of Cu with Co, Cr, Ni, Mn, Pb, and Co associated with Pb and Zn. Cr indicates a positive significant correlation with Fe and Mn. Ni and Fe have the same correlation with Mn, and Mn is associated positively with Pb.
| RP | Correlation coefficient | ||||||||
|---|---|---|---|---|---|---|---|---|---|
| Element | Cd | Cu | Co | Cr | Fe | Ni | Mn | Pb | Zn |
| Cd | 1 | ||||||||
| Cu | 0.063 | 1 | |||||||
| Co | 0.218* | 0.661 | 1 | ||||||
| Cr | -0.416 | 0.081 | -0.080 | 1 | |||||
| Fe | -0.293 | -0.370 | -0.171 | 0.043 | 1 | ||||
| Ni | 0.190 | 0.361 | -0.246* | -0.217 | -0.096 | 1 | |||
| Mn | -0.218 | 0.049 | -0.584 | 0.439 | 0.186 | 0.001 | 1 | ||
| Pb | -0.075* | 0.498 | 0.172* | -0.486 | -0.084 | 0.425* | 0.231 | 1 | |
| Zn | -0.070 | -0.144 | 0.150 | -0.033 | 0.449 | 0.158 | 0.318* | 0.714 | 1 |
Statistically significant correlation among the PTEs are bold values at (p<0.05)
Statistically not significant correlation among the PTEs is asterisk* values at (p>0.05)
Correlation coefficient among the PTEs in mustard green from district RYK was analyzed, as listed in Table 8. Analysis reveals the positive correlation of Cd with Cu, Fe, Mn, and Cu has the same correlation with Fe, Ni, Mn, Pb, and Co, shows positive correlation with all PTEs except Fe and Cd, and Cr, positively correlated with all PTEs except Cd, Cu, and Ni. Fe indicates a positive significant correlation between Mn and Zn, Ni with Mn and Pb, and Mn has a positive significant correlation with Pb.
| RYK | Correlation coefficient | ||||||||
|---|---|---|---|---|---|---|---|---|---|
| Element | Cd | Cu | Co | Cr | Fe | Ni | Mn | Pb | Zn |
| Cd | 1 | ||||||||
| Cu | 0.629 | 1 | |||||||
| Co | -0.607* | -0.499 | 1 | ||||||
| Cr | -0.304 | -0.380 | 0.260 | 1 | |||||
| Fe | 0.374 | 0.042 | -0.008 | 0.410 | 1 | ||||
| Ni | -0.128* | 0.153 | 0.424 | -0.053 | -0.265 | 1 | |||
| Mn | 0.437 | 0.387 | 0.300 | 0.150 | 0.125 | 0.121 | 1 | ||
| Pb | -0.192 | 0.170 | 0.693 | 0.252 | -0.358 | 0.797 | 0.437 | 1 | |
| Zn | -0.305 | -0.026 | 0.054 | 0.296 | 0.249 | -0.011 | -0.289* | -0.156 | 1 |
Statistically significant correlation among the PTEs are bold values at (p<0.05)
Statistically not significant correlation among the PTEs is asterisk* values at (p>0.05)
Probability value (p<0.5) exhibits a significant correlation among the PTEs. Significant correlation found among almost all PTEs with <5%, i.e., p<0.05, as described in Table 6.
In a previous report, HMs (zinc, copper, lead, and iron) were examined in vegetables (spinach, cauliflower, mustard, and cabbage) from Thoubal District, Manipur, India [37]. A total of 09 samples from each vegetable category were examined, and the results revealed that Fe and Zn were present in significant concentrations in all the vegetables, whereas Cu and Pb concentrations were lower and considerable, respectively. The concentrations of Fe in leafy vegetables like cabbage, cauliflower, mustard, and spinach varied from 79.28 mg/kg to 572.80 mg/kg. Cauliflower, mustard, and spinach all had concentrations from 2.72 mg/kg to 22.50 mg/kg of Cu on the basis of dry weight, whereas cabbage did not. On the basis of dry weight, the concentration of zinc in cabbage, cauliflower, spinach, and mustard leaf varied from 27.51 mg/kg to 71.34 mg/kg.
Another report from India [38] has determined the concentration of HMs in vegetables from the farms and commercial sites of India. At market sites, the average concentrations of copper in cauliflower, as well as zinc and cadmium in both cauliflower and spinach, have surpassed the PFA limit. The PFA requirement for cauliflower was also surpassed by Zinc in the farms. Vegetables evaluated from farms and commercial areas had cadmium concentrations that were much greater than the standards of the European Union (EU). However, Pb levels in vegetables evaluated from both production and market sites were much higher than the current EU and WHO regulations, despite being below the PFA limit. Vegetables examined for HM buildup show greater levels at market locations than at crop-producing locations. These veggies contributed 13%, 1%, 47%, and 9% of the estimated recommended levels of Cu, Zn, Cd, and Pb to dietary consumption, respectively.
HMs in vegetables have been linked to health risks for the public in Beijing, China. In order to determine the possible health risks, a study of the amounts of As, Cd, Cr, Cu, Ni, Pb, and Zn in 416 samples (representing 100 kinds) of vegetables was conducted in Beijing. The findings showed that the levels of HMs in cauliflower varied from 0.004-0.021 g/g fw for Cd, from 0.004 to 0.113 g/g fw for Cr, from 0.29 to 5.63 g/g fw for Cu, from 0.021 to 350 g/g fw for Ni, from 0.001-0.139 g/g fw for Pb, and from 3.68 to 7.70 g/g fw for Zn [39]. In another study from Bangladesh, health risk was assessed based on EDI, target HQ, HI, and CR. The EDI values for metals, except for Cr, were determined to be below the maximum tolerable daily intake. The overall THQs of metals were > 1, suggesting a non-carcinogenic health risk [40]. Another study from Khyber Pakhtunkhwa (KPK) Pakistan evaluated the health hazards linked to metal consumption by utilizing the EDI of metals (EDIM), HQs, and HI. The rates at which metals transfer to vegetables have been established. All of the elements’ EDMI values were discovered to be lower than their RfD values, with the exception of Pb and Cd [41].
To our best knowledge, the current study is the first ever report on the health risk assessment of PTEs in mustard greens grown in various areas of the southern districts of Punjab, Pakistan. Since the southern districts of Punjab, Pakistan, are drought-hit and are mostly covered by a desert. So, the current study is important in providing useful information.
3.6. Health risk assessment
The values of CDI (Table 9), HQ (Table 10), and CR (Table 11) of said PTEs in samples of mustard greens from different sub-sites of three southern districts of Punjab, Pakistan, were investigated in three age groups: 5- 25 years, 25-50 years, and 50-70 years in males and females. CDI values of PTEs were found in decreasing order of Fe>Zn>Mn>Cu>Cr>Co>Cd>Ni>Pb. And the order for age group was 5-25 years>25-50 years>50-70 years. CDI values for all the PTEs were found under the limits recommended by WHO and FAO (Allowed maximum residue limits by WHO/FAO for Cd, Co, Cr, Cu, Fe, Mn, Ni, Pb, and Zn were 0.001, 0.03,0.003, 0.037, 0.7, 0.083, 0.02, 0.0015, and 0.3 respectively). Results showed that the values of HQ of all the PTEs were found under the threshold limit of 1, suggesting that no apparent risk to health is associated with these PTEs. The total HQ did not exceed the specified threshold limit of 1, the HQs value in the mustard greens found in decreasing order of 5-25 years>25-50 years>50-70 years. This showed that the 5–25 age group was more prone than the 25–50 and 50–70 age groups to meet the limit for threat to human health. CR linked with the mentioned PTEs from the samples of mustard greens was determined by using the targeted carcinogenic risk in three different age groups. CR for all mentioned PTEs were under the permissible limit (10-6-10-4).
| PTEs | Gender | CDI (mg/kg/day) | ||
|---|---|---|---|---|
| 5-25 Years | 25-50 Years | 50-70 Years | ||
| Cd | Male | 8.08×10-05 | 4.87×10-05 | 4.66×10-05 |
| Female | 8.69×10-05 | 5.25×10-05 | 4.84×10-05 | |
| Co | Male | 1.10×10-04 | 6.63×10-05 | 6.34×10-05 |
| Female | 1.18×10-04 | 7.15×10-05 | 6.58×10-05 | |
| Cr | Male | 3.93×10-04 | 2.37×10-04 | 2.27×10-04 |
| Female | 4.23×10-04 | 2.55×10-04 | 2.35×10-04 | |
| Cu | Male | 7.06×10-04 | 4.26×10-04 | 4.08×10-04 |
| Female | 7.60×10-04 | 4.59×10-04 | 4.23×10-04 | |
| Fe | Male | 2.15×10-02 | 1.30×10-02 | 1.24×10-02 |
| Female | 2.31×10-02 | 1.40× -02 | 1.29×10-02 | |
| Mn | Male | 3.85×10-03 | 2.32×10-03 | 2.22×10-03 |
| Female | 4.14×10-03 | 2.50×10-03 | 2.31×10-03 | |
| Ni | Male | 6.72×10-05 | 4.05×10-05 | 3.88×10-05 |
| Female | 7.24×10-05 | 4.37×10-05 | 4.03×10-05 | |
| Pb | Male | 6.07×10-05 | 3.66×10-05 | 3.50×10-05 |
| Female | 6.54×10-05 | 3.95×10-05 | 3.64×10-05 | |
| Zn | Male | 3.94×10-03 | 2.38×10-03 | 2.28×10-03 |
| Female | 4.25×10-03 | 2.57×10-03 | 2.36×10-03 | |
| PTEs | Gender | HQ (ppm) | ||
|---|---|---|---|---|
| 5-25 Years | 25-50 Years | 50-70 Years | ||
| Cd | Male | 8.08×10-02 | 4.87×10-02 | 4.66×10-02 |
| Female | 8.69×10-02 | 5.25×10-02 | 4.84×10-02 | |
| Co | Male | 3.66×10-03 | 5.21×10-02 | 2.11×10-03 |
| Female | 3.94×10-03 | 2.38×10-03 | 2.19×10-03 | |
| Cr | Male | 1.31×10-01 | 7.89×10-02 | 7.56×10-02 |
| Female | 1.41×10-01 | 8.51×10-02 | 7.84×10-02 | |
| Cu | Male | 1.91×10-02 | 1.15×10-02 | 1.10×10-02 |
| Female | 2.05×10-02 | 1.24×10-02 | 1.14×10-02 | |
| Fe | Male | 3.07×10-02 | 1.85×10-02 | 1.77×10-02 |
| Female | 3.30×10-02 | 2.00×10-02 | 1.84×10-02 | |
| Mn | Male | 4.64×10-02 | 2.80×10-02 | 2.68×10-02 |
| Female | 4.99×10-02 | 3.02×10-02 | 2.78×10-02 | |
| Ni | Male | 3.36×10-03 | 2.03×10-03 | 1.94×10-03 |
| Female | 3.62×10-03 | 2.19×10-03 | 2.01×10-03 | |
| Pb | Male | 4.05×10-02 | 2.44×10-02 | 2.34×10-02 |
| Female | 4.36×10-02 | 2.63×10-02 | 2.43×10-02 | |
| Zn | Male | 1.31×10-02 | 7.93×10-03 | 7.59×10-03 |
| Female | 4.42×10-02 | 8.55×10-03 | 7.88×10-03 | |
| PTEs | Gender | CR | ||
|---|---|---|---|---|
| 5-25 years | 25-50 years | 50-70 years | ||
| Cd | Male | 1.73×10-06 | 2.61×10-06 | 4.00×10-06 |
| Female | 1.86×10-06 | 2.81×10-06 | 4.15×10-06 | |
| Co | Male | 2.35×10-06 | 3.55×10-06 | 5.44×10-06 |
| Female | 2.53×10-06 | 3.83×10-06 | 5.64×10-06 | |
| Cr | Male | 8.42×10-06 | 1.27×10-05 | 1.94×10-05 |
| Female | 9.06×10-06 | 1.37×10-05 | 2.02×10-05 | |
| Cu | Male | 1.51×10-05 | 2.28×10-05 | 3.49×10-05 |
| Female | 1.63×10-05 | 2.46×10-05 | 3.63×10-05 | |
| Fe | Male | 4.61×10-04 | 6.94×10-04 | 1.06×10-03 |
| Female | 4.96×10-04 | 7.49×10-04 | 1.10×10-03 | |
| Mn | Male | 8.25×10-05 | 1.24×10-04 | 1.90×10-04 |
| Female | 8.87×10-05 | 1.34×10-04 | 1.98×10-04 | |
| Ni | Male | 1.44×10-06 | 2.17×10-06 | 3.33×10-06 |
| Female | 1.55×10-06 | 2.34×10-06 | 3.45×10-06 | |
| Pb | Male | 1.30×10-06 | 1.96×10-06 | 3.00×10-06 |
| Female | 1.40×10-06 | 2.12×10-06 | 3.12×10-06 | |
| Zn | Male | 8.45×10-05 | 1.27×10-04 | 1.95×10-04 |
| Female | 9.10×10-05 | 1.37×10-04 | 2.03×10-04 | |
To our best of our knowledge, there are no previous reports available regarding the health risk assessment of PTEs in mustard greens grown in the southern cities of Punjab, Pakistan. However, there are few reports available on other food matrices from various other parts of Pakistan. One of those was published relating to the analysis of PTEs concentrations and food-related risks to human health in the Bajaur Agency, Pakistan [14]. Health risk indices including dim values for Cd, Ni, Cr, Cu, Co, and Zn in mustard greens samples were 7E -04, 4.9E -04 (adult and children), 1.3E -03, 1.4E -03 (adult and children), 3.9E -04, 4.1E -04 (adult and children), 2.1E -04, 2.2E -04 (adult and children), 2.9E -04, 3.1E -04 (adult and children), 7.2E -03 and 7.6E -03 (adult and children) and HQ values were 4.7E -01, 4.9E -01 (adult and children), 6.5E -02, 6.9E -02 (adult and children), 1.3E -01, 1.4E -01 (adult and children), 5.1E -03, 5.4E -03 (adult and children), 2.9E -04, 3.1E -04 (adult and children), and 2.4E -02, 2.5E -02 (adult and children) respectively.
Another study [42] reported the research on ecological risk assessment of HMs in vegetables irrigated with groundwater and wastewater: Groundwater-grown mustard leaf exhibited a preference for DIM in the following order: Fe (4.34E-02), Mn (1.11E-02), Ni (1.62E-04), Zn (5.80E-05), Pb (3.80E-05), Cu (1.10E-05), and Cd (4.00E-06). For the elements Pb, Cd, Cu, Zn, Mn, Ni, and Fe, the health risk index (HRI) for HMs in vegetables cultivated with groundwater and wastewater showed 0.010, 0.000, 0.000, 0.000, 0.335, 0.008, and 0.062, respectively.
4. Conclusions
This research revealed that the mean concentrations of PTEs lie in the decreasing order among district as DGK>RYK>RP. Mean concentrations of Fe were found the highest among all the districts (DGK; 11.16 mg/kg, RYK: 9.281 mg/kg and RP: 5.821 mg/kg) than any other PTEs mean concentrations. Concentrations of Mn from all sub-sites of all three district (RP, DGK, RYK) and concentrations of Co from Sadiq Abad Sardar Garh and Feroza were exceeding the allowed maximum residue limits (Mn: 0.2 mg/kg and Co: 0.1 mg/kg) recommended by FAO and WHO. Values of CDI for Cd, Co, Cr, Cu, Fe, Mn, Ni, Pb, and Zn were recorded under the safe limits suggested by FAO/WHO 0.001, 0.03, 0.003, 0.037, 0.7, 0.083, 0.02, 0.0015, and 0.3 (in mg/kg/day), respectively. The HQ and CR levels for all said PTEs were analyzed under the limits (HQ: <1, CR: 10-6-10-4). Pollution in the environment and extensive industrial development are the main causes of the high concentrations of PTEs. Monitoring of PTEs on continuous basis and awareness about the health risks caused by these PTEs in vegetables might prove prolific for their prevention in the food chain. The analysis of irrigation water on regular intervals is highly recommended. This research could be helpful for the governing bodies and food safety authorities to implement qualitative measures and spread awareness to the consumers from health risks regarding exceeded amounts of Mn and Co, which may cause negative consequences on the nervous system, the reproductive system, or the pulmonary system.
Acknowledgment
The authors extends their appreciation to the Deanship of Research and Graduate Studies at King Khalid University for funding this work through Large Research Project under grant number RGP2/98/45. Authors are thankful to “National Research Program for Universities (NRPU)” of the Higher Education Commission of Pakistan NRPU Project No. 20-14837/NRPU/R&D/HEC/2021 2021.
CRediT authorship contribution statement
All authors contributed to the study conception and design. Material preparation, data collection and analyses were performed by MS Gul, M. Sarfaraz. Data analysis was performed by M. Saqib, J Uddin and Asma Sabir. The first draft of the manuscript was written by MS Gul and M. Sarfaraz. Proof read was accomplished by GM Kamal, M Saqib and Asma Sabir. All authors commented on previous versions of the manuscript. All authors read and approved the final manuscript.
Declaration of competing interest
The authors declare that they have no known competing financial interests or personal relationships that could have appeared to influence the work reported in this paper.
Declaration of Generative AI and AI-assisted technologies in the writing process
The authors confirm that there was no use of artificial intelligence (AI)-assisted technology for assisting in the writing or editing of the manuscript and no images were manipulated using AI.
References
- Application of local seaweed extracts on growth and yield of mustard greens (Brassica juncea L.) IOP Conference Series: Earth and Environmental Science. 2020;484:012066. https://doi.org/10.1088/1755-1315/484/1/012066
- [Google Scholar]
- Mustard. In: Handbook of herbs and spices. Elsevier; p. :388-398. https://doi.org/10.1533/9780857095671.388
- [Google Scholar]
- Impact of moisture and storage on seed quality enhancement with special reference to Rapeseed mustard. International Journal of Pharmaceutical Sciences and Research. 2020;11:4070-4077. http://dx.doi.org/10.13040/IJPSR.0975-8232.11(8).4070-77
- [Google Scholar]
- Sauces, spices, and condiments: Definitions, potential benefits, consumption patterns, and global markets. Annals of the New York Academy of Sciences. 2016;1379:3-16. https://doi.org/10.1111/nyas.13045
- [Google Scholar]
- Chemical composition, carotenoids, vitamins and minerals in wild mustard collected in native areas. Horticultura Brasileira. 2018;36:59-65. https://doi.org/10.1590/s0102-053620180110
- [Google Scholar]
- Determination of vitamin C, β-carotene and riboflavin contents in five green vegetables organically and conventionally grown. Malaysian Journal of Nutrition. 2003;9:31-39. PMID:22692530
- [Google Scholar]
- Rassicaceae, nutrient analysis and investigation of tolerability in people with Crohn’s disease in a New Zealand study. Journal of Functional Foods in Health and Disease. ;11:460-486. https://doi.org/10.31989/ffhd.v2i11.70
- [Google Scholar]
- How do fruit and vegetables prevent heart disease and type 2 diabetes? Current Opinion in Lipidology. 2014;25:155-156. https://doi.org/10.1097/MOL.0000000000000062
- [Google Scholar]
- Vitamin K: the effect on health beyond coagulation – an overview. Food & Function. 2012;56:1. https://doi.org/10.3402/fnr.v56i0.5329
- [Google Scholar]
- Comparative study on the levels of carotenoids lutein, zeaxanthin and β-carotene in Indian spices of nutritional and medicinal importance. Food Chemistry. 2010;123:404-409. https://doi.org/10.1016/j.foodchem.2010.04.056
- [Google Scholar]
- Profiling of Redox-Active Lipophilic Constituents in Leaf Mustard (Brassica juncea (L.) Czern.) Cultivars Using LC-MS and GC-MS. Antioxidants (Basel, Switzerland). 2022;11:2464. https://doi.org/10.3390/antiox11122464
- [Google Scholar]
- Accumulation of heavy metals in leaf vegetables from agricultural soils and associated potential health risks in the Pearl River Delta, South China. Environmental Monitoring and Assessment. 2014;186:1547-1560. https://doi.org/10.1007/s10661-013-3472-0
- [Google Scholar]
- Potential toxic elements in market vegetables from urban areas of Southwest Nigeria: Concentration levels and probabilistic potential dietary health risk among the population. Journal of Trace Elements and Minerals. 2022;1:100004. https://doi.org/10.1016/j.jtemin.2022.100004
- [Google Scholar]
- Potentially toxic elements concentrations and human health risk assessment of food crops in Bajaur Agency, Pakistan. Environmental Earth Sciences. 2017;76 https://doi.org/10.1007/s12665-017-6824-1
- [Google Scholar]
- Chemical and biological immobilization mechanisms of potentially toxic elements in biochar-amended soils. Critical Reviews in Environmental Science and Technology. 2020;50:903-978. https://doi.org/10.1080/10643389.2019.1642832
- [Google Scholar]
- Contamination levels and the ecological and human health risks of potentially toxic elements (PTEs) in soil of Baoshan area, Southwest China. Applied Sciences. 2022;12:1693. https://doi.org/10.3390/app12031693
- [Google Scholar]
- Heavy metal concentrations in soils and factors affecting metal uptake by plants in the vicinity of a Korean Cu-W mine. Sensors (Basel, Switzerland). 2008;8:2413-2423. https://doi.org/10.3390/s8042413
- [Google Scholar]
- Concentrations of essential and non-essential toxic trace elements in wild boar (Sus Scrofa L., 1758) tissues from southern Turkey. Bulletin of Environmental Contamination and Toxicology. 2014;92:10-14. https://doi.org/10.1007/s00128-013-1134-0
- [Google Scholar]
- Trace elements in agroecosystems and impacts on the environment. Journal of Trace Elements in Medicine and Biology: Organ of the Society for Minerals and Trace Elements (GMS). 2005;19:125-140. https://doi.org/10.1016/j.jtemb.2005.02.010
- [Google Scholar]
- The concentration of potentially toxic elements (PTEs) in sausages: A systematic review and meta-analysis study. Environmental Science and Pollution Research. 2021;28:55186-55201. https://doi.org/10.1007/s11356-021-14879-2
- [Google Scholar]
- Heavy metals in vegetables and potential risk for human health. Scientia Agricola. 2012;69:54-60. https://doi.org/10.1590/s0103-90162012000100008
- [Google Scholar]
- Assessment of toxic metals in agricultural produce. Food and Public Health. 2012;2:24-29. https://doi.org/10.5923/j.fph.20120201.05
- [Google Scholar]
- Investigating local relationships between trace elements in soils and cancer data. Spatial Statistics. 2013;5:25-41. https://doi.org/10.1016/j.spasta.2013.05.001
- [Google Scholar]
- Dietary exposure to cadmium and risk of breast cancer in postmenopausal women: A systematic review and meta-analysis. Environment International. 2016;86:1-13. https://doi.org/10.1016/j.envint.2015.10.003
- [Google Scholar]
- Assessment of potentially toxic elements in vegetables cultivated in urban and peri-urban sites in the Kurdistan region of Iraq and implications for human health. Environmental Geochemistry and Health. 2020;42:1359-1385. https://doi.org/10.1007/s10653-019-00426-z
- [Google Scholar]
- Concentration and risk assessment of potentially toxic elements, lead and cadmium, in vegetables and cereals consumed in Western Iran. Journal of Food Protection. 2020;83:101-107. https://doi.org/10.4315/0362-028X.JFP-19-312
- [Google Scholar]
- The concentration of potentially toxic elements (PTEs) in Iranian rice: A dietary health risk assessment study. Environmental Science and Pollution Research. 2023;30:90757-90771. https://doi.org/10.1007/s11356-023-28442-8
- [Google Scholar]
- Multi-Element assessment of potentially toxic and essential elements in new and traditional food varieties in Sweden. Foods (Basel, Switzerland). 2023;12:1831. https://doi.org/10.3390/foods12091831
- [Google Scholar]
- The impact of thermal processing methods on the β-carotene content of some commonly consumed vegetables. International Journal of Food and Fermentation Technology. 2015;5:253. https://doi.org/10.5958/2277-9396.2016.00017.9
- [Google Scholar]
- Wet digestion methods. Vol 41. Comprehensive Analytical Chemistry, Elsevier; 2003. p. :193-233. https://doi.org/10.1016/S0166-526X(03)41006-4
- The determination of potentially toxic elements (PTEs) in milk from the Southern cities of Punjab, Pakistan: A health risk assessment study. Journal of Food Composition and Analysis. 2022;108:104446. https://doi.org/10.1016/j.jfca.2022.104446
- [Google Scholar]
- Chronic daily intake, probabilistic carcinogenic risk assessment and multivariate analysis of volatile N-nitrosamines in chicken sausages. International Journal of Environmental Health Research. 2024;35(5):1194-1203. https://doi.org/10.1080/09603123.2024.2383399
- [Google Scholar]
- Health risk assessment of heavy metals and their source apportionment in drinking water of Kohistan region, Northern Pakistan. Microchemical Journal. 2011;98:334-343. https://doi.org/10.1016/j.microc.2011.03.003
- [Google Scholar]
- Fruit and vegetable intake: Benefits and progress of nutrition education interventions- narrative review article. Iranian Journal of Public Health. 2015;44:1309-1321. https://pmc.ncbi.nlm.nih.gov/articles/PMC4644575/
- [Google Scholar]
- Hygienic aspects of TiO2-mediated photocatalytic oxidation of volatile organic compounds: Air purification analysis using a total hazard index. Applied Catalysis B: Environmental. 2018;220:386-396. https://doi.org/10.1016/j.apcatb.2017.08.020
- [Google Scholar]
- Potential health risk assessment for soil heavy metal contamination in the central zone of Belgrade (Serbia) . 2008;73:923-934. https://doi.org/10.2298/JSC0809923G
- [Google Scholar]
- Heavy metals (Fe, Cu, Zn and Pb) analysis in mustard, cauliflower, cabbage and spinach grown at Kakching-Wabagai area, Thoubal district, Manipur, India. Paripex - Indian Journal of Research. 2012;3:15-17. https://doi.org/10.15373/22501991/june2014/5
- [Google Scholar]
- Heavy metals in vegetables collected from production and market sites of a tropical urban area of India. Food and Chemical Toxicology : An International Journal Published for the British Industrial Biological Research Association. 2009;47:583-591. https://doi.org/10.1016/j.fct.2008.12.016
- [Google Scholar]
- Assessing the health risk of heavy metals in vegetables to the general population in Beijing, China. Journal of Environmental Sciences (China). 2009;21:1702-1709. https://doi.org/10.1016/s1001-0742(08)62476-6
- [Google Scholar]
- Human health risk assessment of heavy metals in vegetables of Bangladesh. Scientific Reports. 2024;14:15616. https://doi.org/10.1038/s41598-024-65734-6
- [Google Scholar]
- Health risk assessment and multivariate statistical analysis of heavy metals in vegetables of Khyber Pakhtunkhwa region, Pakistan. Biological Trace Element Research. 2022;200:3023-3038. https://doi.org/10.1007/s12011-021-02892-y
- [Google Scholar]
- Ecological risk assessment of heavy metals in vegetables irrigated with groundwater and wastewater: The particular case of Sahiwal district in Pakistan. Agricultural Water Management. 2019;226:105816. https://doi.org/10.1016/j.agwat.2019.105816
- [Google Scholar]


