

Translate this page into:
The confinement and anion type effect on the physicochemical properties of ionic liquid/halloysite nanoclay ionogels
⁎Corresponding author. kno@isc-ras.ru (N.O. Kudryakova)
-
Received: ,
Accepted: ,
This article was originally published by Elsevier and was migrated to Scientific Scholar after the change of Publisher.
Peer review under responsibility of King Saud University.
Abstract
Abstract
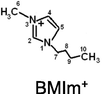
This work is the first attempt to study the physicochemical properties of ionogels - quasi-solid hybrid materials formed by ionic liquids (ILs) − 1-butyl-3-methylimidazolium (BMIm+) salts with dicyanamide- (DCA−), bis(trifluoromethylsulfonyl)imide- (TFSI−), and trifluoromethanesulfonate- (Otf−) anions - and halloysite, a powdered clay filler with nanotube particles (at the IL:Hal molar ratio of 2:1) in order to find possible new applications of ionic liquids and industrial minerals. The electron microscopy, TG, and DSC analysis, FTIR spectroscopy, X-ray diffraction analysis, conductometry and cyclic voltammetry methods are used to investigate the anion effect on the IL interaction with halloysite. It has, for the first time, been found that the distinguishing feature of halloysite interaction with an IL determining the structural changes in the clay mineral and electrochemical characteristics of the ionogels is partial dehydration of the clay and absorption of the released water by the ionic liquid. It is shown that the halloysite dehydration effect depends on the IL hydrophilicity determined by the anion type, corresponds to the series: BMImDCA > BMImOtf > BMImTFSI. The electrochemical and thermal behaviour of ILs confined within a halloysite matrix differs from that of bulk ILs and is controlled by the anion type. Temperature dependences of the structural resistance of the halloysite filler are radically different for the ILs with high and low hydrophilicity. The effects resulting from the formation of halloysite-based ionogels can be of interest to those who develop quasi-solid ionic conductors that can work within a wide temperature range.
Keywords
Ionogels
Halloysite
Ionic liquids
Structural characteristics
Thermal destruction
Ionic conductivity

1 Introduction
Low-temperature melts of organic electrolytes - ionic liquids (ILs) - are among “green chemistry” substances with a great potential for application in various engineering fields. They are new promising media for organic catalytic reactions (Ozokwelu et al., 2017), CO2 absorbents (Torralba-Calleja et al., 2013), high-temperature lubricants (Somers et al., 2013), solvents for natural polymers (Meng et al., 2012), ionic conductors for electrochemical technologies and devices (Ohno, 2017; Watanabe et al., 2017). A lot of attention has been recently paid to the new forms of ionic liquids - polymeric ionic liquids (Ye et al., 2013) and thickened forms of ionic liquids − ionogels (Bideau et al., 2011). Quite promising in terms of obtaining thickened ionic liquids are various polymers that are soluble in ionic liquids and can be used to transform them into gels. ILs thickened by polymers and polymeric ILs compete with each other in electric conductivity over a wide temperature range. And the advantages of polymeric ILs are offset by their high costs. An interesting alternative to these is hybrid materials based on ionic liquids − ionogels thickened by inorganic nanoparticles (Bideau et al., 2011). Such systems have attracted researchers' attention (Noor et al., 2013; Negre et al., 2016; Deb and Bhattacharya, 2017; Dutta et al., 2018) because the IL physicochemical and functional properties can be varied over a wide range of values, the thermal stability of the inorganic fillers is much higher than that of organic materials, and such systems are quite cheap.
One of the inorganic filler types used in ILs is clays, a class of natural minerals. Clays are widely used for preparing ceramic goods, adsorbents, catalyst supports, drug vehicles, reinforcing fillers for plastics, as well as in paper production, oil extraction, agriculture, nanotechnologies, etc. (Murray, 1991; Zhou and Keeling, 2013). Application of these natural nanomaterials makes it possible to discover new effects caused by the interaction of ionic liquids with the porous inorganic matrix and identify the effect of the confinement in the clay nanopores on the ionogel properties (Dedzo and Detellier, 2018; Zhao et al., 2016).
Our interest in halloysite as a filler for ionogels is inspired by the structural features of this mineral. Halloysite particles are multi-layered nanotubes − silicate sheet scrolls that are formed by rolling clay mineral layers in the 1:1 ratio in favourable geological conditions. The 1:1 layer minerals contain one tetrahedral silicon dioxide layer and one octahedral aluminium hydroxide sheet in their basic structural unit. This two-sheet mineral type is represented by the kaolin group, with the general formula Al2(OH)4Si2O5·nH2O. Basal spacings between the scroll layers depend on the hydration state of the clay, are quite typical of this mineral, and have the following standard values: about 10 Å in the hydrated form and about 7 Å in the dehydrated one. Halloysite dehydration makes interlayer spacing close to the basal spacing in kaolinite. The morphological characteristics of halloysite (length, inner/outer nanotube diameter) vary a lot depending on its geological origin, with the average scroll sizes being: about 50 nm in the outer diameter, about 15 nm in the inner diameter, and 0.5–2 μm in length (Yuan et al., 2015; Lvov et al., 2014; Joussein et al., 2005).
Thickening of ionic liquids with inorganic fillers makes it possible to obtain a new type of hybrid materials that are ion-conducting, very stable thermally, possess properties of a solid and are promising in terms of practical applications (Agafonov and Grishina, 2019). Using ILs thickened with halloysite, it is possible not only to create quasi-solid electrolytes with high ionic conductivity but also to determine the effect of IL interaction with halloysite nanotubes and confinement on the formation of practically relevant ionogel properties.
In our previous works, we determined the effect of the confinement resulting from the interaction of a number of clays with various ionic liquids on the thermal stability, electric conductivity over a wide temperature range, dielectric spectra, and other properties of the ILs (Grishina et al., 2019; Alekseeva et al., 2019; Agafonov et al., 2020). The aim of this work was to determine the effect of the anion chemical nature on the physicochemical characteristics of ionogels based on imidazolium ionic liquids and halloysite clay nanotubes (HNTs). The obtained quasi-solid ionogels demonstrate high ionic conductivity over a wide temperature range, a wide electrochemical window, and high thermal stability. It has been established that the changes in the structure of the clay mineral and the physicochemical properties of the ionogels depend on the IL hydrophilic-hydrophobic properties determined by the anion nature.
2 Experimental part
2.1 Materials
In this work, we used the following commercial reagents without further purification:
- Halloysite nanoclay, Hal (Sigma-Aldrich, USA, CAS Number 1332–58-7, molecular weight 294.19 g/cm3);
Ionic liquids:
-
-
1-butyl-3-methylimidazolium dicyanamide, BMImDCA (Sigma-Aldrich, Hong Kong, China. CAS Number: 448245–52-1, purity ≥ 97%, water impurity content 0.12 wt%);
-
-
1-butyl-3-methylimidazolium bis(trifluoromethylsulfonyl)imide, BMImTFSI (Sigma-Aldrich, USA, CAS Number: 174899–83-3, for synthesis, water impurity content 0.03 wt%);
-
-
1-butyl-3-methylimidazolium trifluoromethanesulfonate, BMImOtf (Sigma-Aldrich, USA, CAS Number: 74899–66-2, for synthesis, water impurity content 0.07 wt%).
The water impurity content in the samples under study was determined by K. Fischer's method.
Stable IL-halloysite nanoclay ionogels were obtained by vibration (IKA VORTEX 4 basic vibration shaker, IKA-Werke GmbH & Co. KG, Germany) and ultrasonic (CT-431D2 ultrasonic cleaner, CTbrand Wahluen Electronic TOOL Co. Ltd., China) mixing of components in hermetically sealed capsules. The obtained mixtures had 2:1 IL: clay molar ratios which corresponded to 74.1 wt% BMImTFSI, 66.2 wt% BMImOtf, and 60.4 wt% BMImDCA in the ionogels.
2.2 Methods and apparatus
The visualization of the clay mineral and ionic liquid-clay ionogels was made by the scanning electron microscopy method using an Vega 3 SBH- TESCAN microscope (TESCAN, the Czech Republic) with an energy-dispersive X-ray spectroscopy (EDX) detector. The samples were loaded onto a carbon tape for testing. Then the samples were coated with a 1 nm thick carbon layer.
A Quanta Chrome Nova 1200 surface area analyzer (Quantachrome Corporation, Boynton Beach, FL, USA) was used to measure the volume of the adsorbed gas by the Brunauer-Emmett-Teller (BET) method in standard conditions of (STP: T = 273.15 K, 101.3 kPa), represented by adsorbed gas volume per 1 g of sample. Before testing, the halloysite samples had been kept in a vacuum at 105 °C for 7 h. The isotherm was an IUPAC IV type, with pore sizes in the mesoporous and macroporous range.
The halloysite particle size distribution and Z-potential measurements were carried out in distilled water at room temperature by a particle size and Z-potential analyzer Zetasizer Nano (Malvern Instruments Ltd., UK). Before the tests were made, the clay suspension in distilled water was sonicated and kept for 24 h.
The thermal stability of the clay and ionogel samples was determined with a TG 209 F1 thermal analyzer (NETZSCH, Germany). The samples weighing ∼ 10 mg were placed into a platinum capsule and heated in an argon flow (30 mL min−1) at a rate of 10 °C min−1 to a temperature of 800 °C. The accuracy of the mass and temperature measurement was ± 10−6 g and ± 0.1 °C, respectively. Each sample was scanned three times.
The phase behavior of the pure ionic liquids and ionogels (melting, crystallization, and glass transition) was studied with a DSC 204 F1 Phoenix calorimeter (NETZSCH, Germany). A sample of ∼ 10 mg was placed into a hermetically sealed platinum pan, cooled to − 120 °C with liquid nitrogen at a rate of 10 °C min−1 and then heated to 200 °C at a rate of 10 °C min−1. The measurements were made in an argon atmosphere. The accuracy of the mass and temperature measurement was ± 10−5 g and ± 0.1 °C, respectively.
The spectrophotometric measurements were made in a VERTEX 80v infrared Fourier-Transform spectrometer (Bruker, Germany). The FT-IR reflection spectra were recorded with a diamond crystal at room temperature in the region from 400 to 4000 cm−1, with the spectral resolution equal to 2 cm−1.
The specific conductivity (κ) of the considered ionic liquids and ionogels based on them was determined with a Solartron SI 1260A Impedance/Gain-Phase analyzer (Solartron Analytical, UK). The measurement was made with flat platinum electrodes in a designed hermetic cell. The alternating current frequency ranged from 1 to 100 kHz, the cell voltage equalled 10 mV. A 0.01 mol·dm−3 KCl solution was used to determine the cell constant value. The measurements were made in the range from − 20 to 80 °C. The cell temperature was maintained with an accuracy of ± 0.2 °C with the help of a LIOP FT-316–40 liquid cryothermostat (LOIP, Russia).
The X-ray diffraction studies of the crystal structure of the Hal powder and Hal samples modified by an ionic liquid were conducted in the angle range of 2Θ = 5–50° with a DRON-UM1 (Russia) diffractometer (CuK radiation = 0.154 nm) operating at a voltage of 40 kV and a current of 40 mA.
The electrochemical window was measured with a PI 50-Pro-3 pulse potentiostat with automatic data registration and processing in the PS Pack 2 programs (Elins, Russia) on a platinum electrode in a hermetically sealed three-electrode cell at a temperature of 25 °C. A platinum wire was used as the quasi-reference electrode, and a platinum sheet - as the counter electrode.
3 Results and discussion
3.1 Structural characteristics of halloysite and its mixtures with ILs
Halloysite nanoclay (Al2Si2O5(OH)4·2H2O), a natural layered alumosilicate, was used to reinforce the ionic liquids under study and obtain ionogels. The distinguishing structural feature of halloysite particles (hydrated kaolinite form) is the tubular shape of the alumosilicate sheets, with water of hydration and kaolinite OH-groups between them (Joussein et al., 2005; Kohyama et al., 1978; Yuan et al., 2012). The length of the nanoscrolls in the clay samples under study can exceed 1 μm with the outer diameter up to 0.1 μm (Fig. 1a). The results of the Hal particle size distribution are presented in Fig. 1(b). The experiment showed that the low-temperature adsorption–desorption isotherms of N2 can be classified as type IV isotherms according to the IUPAC nomenclature (Fig. 1c) and are characteristic of mesoporous bodies. The total surface area (BET surface area) ∼ 57 m2 g−1 (∼16769 m2 mol−1). The pore size distribution is shown in Fig. 1d, which indicates that the diameter of most of the mesopores ∼ 10 nm and corresponds to the inner diameter of the nanoscrolls (Yu et al., 2016). The elemental composition of the Halloysite nanoclay is given in Table 1.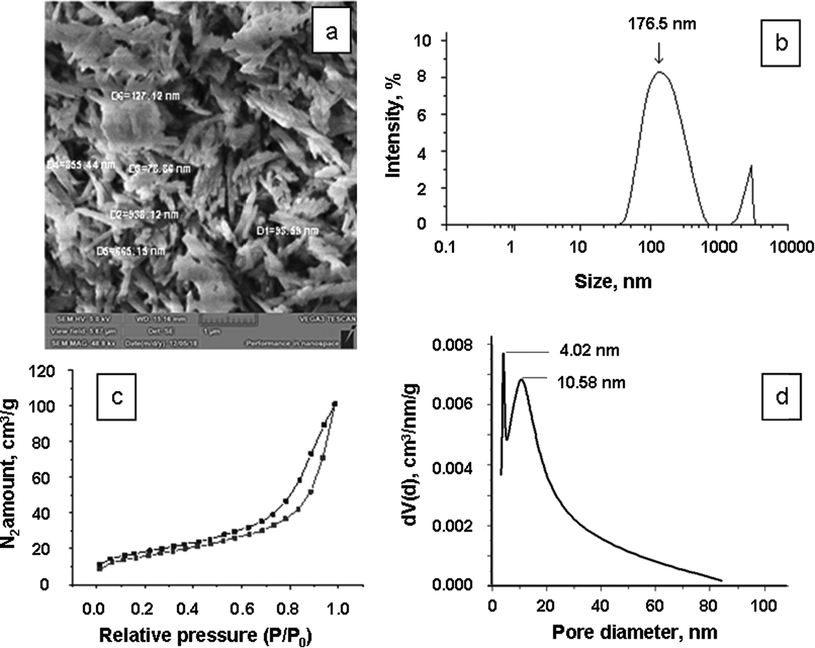
The SEM-image of Hal (a) and Hal particle size distribution (b); the isotherm of low-temperature nitrogen adsorption-desorption on Hal particles (c); the BJH pore size distribution for Hal (d).
Element
O
Al
Si
Cl
Ca
Fe
Total
Wt. %
63.74
18.12
17.71
0.15
0.11
0.17
100.00
The inner surface of the kaolinite sheets in the nanoscrolls is positively charged, while the outer one is charged negatively (Yelleswarapu et al., 2010; White et al., 2012). The Z-potential of the investigated halloysite particles in distilled water is −13 mV.
Halloysite is a hydrophilic substance, and the hydrophilicity of an IL can affect the properties of the obtained ionogels and the clay structure. The role of the pore space, and halloysite hydrate moisture on the interaction with ionic liquids remains practically unknown. The existing concepts of the mechanisms of adsorption of organic molecules and ions on clays obtained at low loads on adsorbents (Droge and Goss, 2013a, 2013b) can reflect some stages of ionogel formation, where the adsorbat amount is very high, only with a certain degree of approximation
The hydrophilic character of ILs is known to depend mainly on the anion nature (Tomšík and Gospodinova, 2016; Huddleston et al., 2001). Based on our experiment results, the enumerated ionic liquids hygroscopicity corresponds to the series: DCA– > Otf – > TFSI–. The equilibrium moisture content in the ILs at 22 ± 0.5 °C and 60% relative air humidity in this case is 6.59, 1.59, and 0.18 wt%, respectively.
The ionic liquids used to prepare the ionogels have identical cations but different anions. Table 2 shows that the ions in the ILs under study have considerable differences in their sizes. When an IL is mixed with halloysite, the ions can easily penetrate and move inside the internal cylindrical cavity of the halloysite nanoscrolls and fill the macropore space.
Ionic liquid ion


Ion volume, nm3
0.150 (Tokuda et al., 2006)
0.232 (Slattery et al., 2007)
0.130 (Slattery et al., 2007)
0.056 (Slattery et al., 2007)
0.198 (Marcus, 2015)
0.246 (Bica et al., 2013)
0.128 (Bica et al., 2013)
0.069 (Bica et al., 2013)
0.199 (Slattery et al., 2007)
0.230 (Beichel et al., 2014)
0.126 (Beichel et al., 2014)
0.089 (Beichel et al., 2014)
0.211 (Bica et al., 2013)
M*, g/mol
419.37
288.29
206.26
ρ*, g/cм3 (20 °C)
1.4409
1.3012
1.0621
Vm*, cм3/mol, (20 °C)
291.05
221.56
194.20
At the same time, large anions and cations of the ionic liquid cannot penetrate into the interlayer space of the considered HNTs. Fig. 2 (curve 1) shows the diffractogram of the powdered halloysite sample that was used in this work. The inter-turn spacing in the Hal scrolls under study equals 7.55 Å. The completely hydrated halloysite form is known to have a basal spacing of ∼ 10.1 Å (4 H2O), while the partially dehydrated one contains 0.5–1.5 H2O molecules, consists of chaotically arranged hydrated and unhydrated layers and has a basal spacing of 7.36–7.9 Å (Fig. 3a) (Grim, 1968). The results of the X-ray diffraction powder analysis of the halloysite under study describing the structural state of the partially dehydrated form of tubular halloysite - the so-called HNTs-7 Å) (Drits et al., 2018). The inter-turn spacing becomes smaller in the presence of BMImTFSI, BMImOtf, and BMImDCA and equals 7.47 Å, 7.42 Å and 7.41 Å, respectively. The hydrophilic anions, especially DCA–, facilitate the removal of the residual water molecules from the inter-layer space (to the IL bulk), which makes them smaller (Fig. 3b).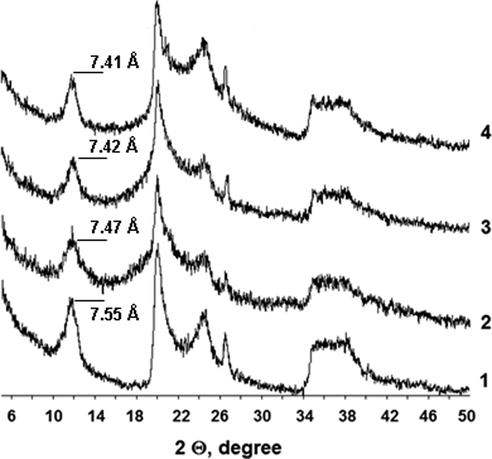
X-ray diffraction (XRD) patterns of the Halloysite nanoclay (1) and the ionic liquids based on BMImTFSI (2), BMImOtf (3), and BMImDCA (4).
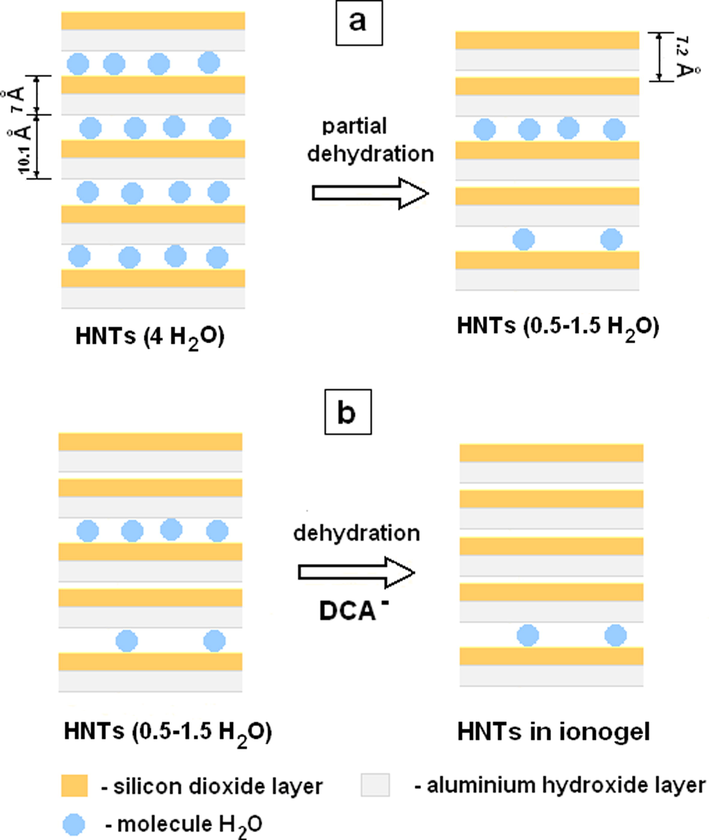
Changes in the structure of (a) halloysite (4 H2O) due to partial dehydration upon drying and (b) halloysite (0.5–1.5 H2O) due to dehydration upon contact with hydrophilic IL.
The SEM-images of the ionogels, Fig. 4, show that the ionic liquids are not adsorbed by the clay completely. Besides, it indicates a noticeable destruction of the HNTs in the hydrophilic ILs, especially in BMImDCA (Fig. 4c), which may be caused by their more complete dehydration than in the initial halloysite.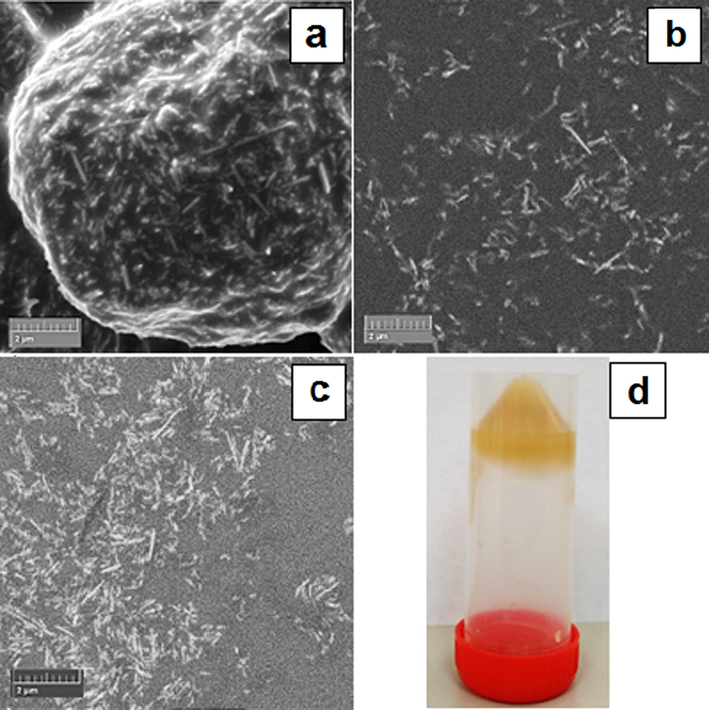
Scanning electron microscope (SEM) images of the ionogels containing BMImTFSI (a), BMImOtf (b), BMImDCA (c), and ionogel in container (d).
3.2 FT-IR spectra
To obtain more information on the behavior and interaction of ionic liquids entrapped by halloysite, we examined the infrared spectra (4000–400 cm−1) of the obtained ionogels (Hal–BMIm[X], X - DCA−, Otf − and TFSI−) in comparision with the spectra on the initial compounds.
Fig. 5a-c shows FT-IR spectra in the range 3800–2800 cm−1, where the main bands of halloysite and ionic liquids are highlighted and assigned according to (Kloprogge, 2016; Yuan, 2016; Cheng et al., 2010; Moschovi et al., 2012; Vitucci et al., 2014; Dhumal et al., 2014). The peak positions are also indicated. The frequencies marked with an asterisk were determined by the fitting method (Ramenskaya et al., 2020).![FT-IR spectra of the pure Hal (blue line), pure ionic liquid BMIm[X] (red line) and Hal/BMIm[X] (black line) ionogels in the ranges of OH and CH stretching modes (a-c) and CN stretching modes (d), X: DCA− (a), Otf − (b) and TFSI− (c); (e) histogram of shifts of stretching modes, Δνi = νi (pure Hal or ILs) – νi (ionogel); * - the peak positions was determined by fitting. (For interpretation of the references to colour in this figure legend, the reader is referred to the web version of this article.)](/content/184/2020/13/12/img/10.1016_j.arabjc.2020.10.033-fig6.png)
FT-IR spectra of the pure Hal (blue line), pure ionic liquid BMIm[X] (red line) and Hal/BMIm[X] (black line) ionogels in the ranges of OH and CH stretching modes (a-c) and CN stretching modes (d), X: DCA− (a), Otf − (b) and TFSI− (c); (e) histogram of shifts of stretching modes, Δνi = νi (pure Hal or ILs) – νi (ionogel); * - the peak positions was determined by fitting. (For interpretation of the references to colour in this figure legend, the reader is referred to the web version of this article.)
The initial halloysite shows two distinct peaks at 3697 and 3622 cm−1 attributed to the stretching vibration from the inner OH-groups (νSi–OH). The wide band centered on 3480 cm−1 is due to the OH stretching modes (νOH) of the inter-layer and surface-absorbed H2O. The spectra of the pure ionic liquids show several bands between 3000 and 3200 cm−1 assigned to the aromatic C–H stretching modes νC2–H and νC4,5–H on the imidazolium ring. The band at a lower frequency corresponds to the C2–H bond due to the more positive charge on the C2 atom than on the C4 and C5 atoms of the imidazolium ring. The peaks between 2800 and 3000 cm−1 are attributed to the C–H stretching modes of the aliphatic chain (νCH2.3). The aromatic stretching modes of BMImDCA appear in lower frequency range compared to BMImOtf and BMImTFSI due to stronger electrostatic and hydrogen interactions of the cation and anion. The “acid” H atom at C2 is more favorable for the formation of hydrogen bonds, leading to the red shift of the νC2–H mode. As follows from Fig. 5a-c, the hydrogen interaction force, proportional to this shift, decreases in the following order: DCA− > Otf− > TFSI−.
The infrared spectra of ionogels include bands of both ionic liquids and halloysite which have a number of differences from those in the initial components. The observed shifts of the frequency modes are shown in Fig. 5e. As can be seen, the stretching mode of absorbed H2O exhibits multidirectional shifts of different magnitudes depending on the type of anion. In addition, the relative intensity of the OH (hOH/hSiOH) band in ionogels, compared to pure Hal, decreases by a factor of 2 for TFSI− and increases by 2 and 6 times for Otf− and DCA−, respectively. Since both the frequency and spectral intensity of the νOH mode depend on the IL – H2O interaction, the water molecules in the DCA ionogel are more bound to the ionic liquid than the Otf and TFSI ionogels (Cammarata et al., 2001; Ramenskaya et al., 2018). All ionic liquids exhibit insignificant blue shifts (1–3 cm−1) for CH stretching modes due to interaction with clay. However, in the Hal–BMImDCA ionogel, a red shift about 2 cm−1 was found for the νC2–H mode, which can be explained by the interaction of the BMIm+ cation with the DCA− anion due to the confinement effect (Ramenskaya and Grishina, 2016; Singh et al., 2010).
Fig. 6a-d shows FT-IR spectra of the initial compounds and ionogels in the range 1800–400 cm−1. Typical groups of halloysite bands are highlighted; the bands corresponding to the anion or cation are indicated by arrows. The peak positions are also indicated, the frequencies marked with an asterisk were determined by the fitting method.![FT-IR spectra (1800–400 cm−1) of the pure Hal (blue line), pure ionic liquid BMIm[X] (red line) and Hal/BMIm[X](black line) ionogels, X: DCA− (a), Otf − (b) and TFSI− (c); (e) histogram of shifts of stretching (bending) modes, Δνi(δ)i = νi(δ)i (pure Hal or ILs) – νi(δ)i (ionogel).](/content/184/2020/13/12/img/10.1016_j.arabjc.2020.10.033-fig7.png)
FT-IR spectra (1800–400 cm−1) of the pure Hal (blue line), pure ionic liquid BMIm[X] (red line) and Hal/BMIm[X](black line) ionogels, X: DCA− (a), Otf − (b) and TFSI− (c); (e) histogram of shifts of stretching (bending) modes, Δνi(δ)i = νi(δ)i (pure Hal or ILs) – νi(δ)i (ionogel).
The original halloysite shows three peaks at 1090, 1034, and 912 cm−1 related to the Si–O and Si–O–Si stretching modes and the Al–OH bending mode, respectively; several peaks below 800 cm−1 are also typical of OH translation vibrations of the pure halloysite OH units (Kloprogge, 2016; Yuan, 2016; Cheng et al., 2010). The low-frequency range of the BMImOtf and BMImTFSI ionic liquids mainly reflects the anion spectral features, such as ν(SO2) at 1347, 1329, and 1123 cm−1 from TFSI–, ν(SO3) at 1251 and 1027 cm−1 from Otf −, ν(CF3) from TFSI− at 1127 and 1276 cm−1, and from Otf − at 1223 and 1150 cm−1 (Moschovi et al., 2012; Vitucci et al., 2014; Dhumal et al., 2014). The DCA− anion absorbs between 2300 and 2000 cm−1 (Fig. 5d), therefore, in the low-frequency range, stretching and bending modes of CH bonds from various groups of the BMIm+ cation can be observed (Grishina et al., 2019). In this range, the infrared spectra of ionogels are very similar to the spectra of pure ILs and also have halloysite bands. The observed shifts of the frequency mode are shown in Fig. 6e.
The DCA− anion shows noticeable blue shifts: (i) up to 4 cm−1 for the stretching mode νN≡C (Fig. 5d), apparently caused by the interaction of the anion with both halloysite and water; (ii) up to 5 cm−1 for the bending mode δasip ring (Fig. 6b), caused by the enhanced stacking of imidazolium rings, due to the confinement effect (Dupont, 2004). No changes are observed for the bands from the Otf− and TFSI− anions, such as νas(SO3) (Fig. 6c), νas(SO2) and νas(S-N-S) (Fig. 6d), which are usually sensitive to the confinement effect (Fujii et al., 2008; Ferreyra et al., 2012; Blach et al., 2013). Since the confinement effect depends on the pore size, the Otf and TFSI ionic liquids appear to be predominantly located inside the halloysite macropores, where the confinement effect is not observed (Singh et al., 2010). At the same time, the blue shifts about 2 cm−1 in the asymmetric stretching modes νas(CF3) indicates the interaction of these anions with halloysite. All halloysite modes exhibit significant red shifts up to 13 cm−1, which are cased not only by the interaction with ionic liquid, but also with water molecules. It is clear that hydrophilic and hydrophobic anion of the ionic liquid has different effect on the processes of hydration and dehydration of the active groups of halloysite.
Thus, the type of anion affects the interaction of water molecules of halloysite with both the ionic liquid and the functional groups of halloysite. This ability decreases in accordance with an increase in hydrophobisity and anion size in the following order: DCA– > Otf – ≫ TFSI−. When ionic liquids are captured by halloysite, the hydrophilic DCA– anion can easy interacts with water molecules. In the presence of the hydrophobic Otf – and TFSI− anions, water molecules interact predominantly with groups such as Si–O, Si–O–Si and Al–OH. Both the cation and the anion interact with halloysite due to electrostatic forces, which leads to a weakening of ionic interactions (Grishina et al., 2019; Zhang et al., 2017). The confinement effect is observed for the BMImDCA ionic liquid due to the small size of the DCA– anion, which facilities the penetration of ionic liquid molecule into the small pores of halloysite. The BMImOtf and BMIMTFSI ionic liquids, due to their large size, are mainly located inside the macropores of halloysite.
3.3 TG and DSC studies
Fig. 7 shows the DTG curves for the samples of pure halloysite and ionic liquids, as well as the Hal-BMImX ionogels. The peaks observed in region (I) are associated with the loss of adsorbed water; those observed in region (II) are caused by halloysite dehydroxylation and destruction of the ionic liquids (Yuan, 2016; Ngo et al., 2000). The destruction of the bulk and confined BMImDCA ionic liquid by halloysite is a three-step weight-loss process (Grishina et al., 2019). Unlike the one-step decomposition of the bulk BMImOtf and BMImTFSI, the weight-loss in the confined ILs is a two-step process. The values of the peak decomposition temperatures (Td) and mass loss (Δm) under heating are shown in Table 3. Td - Decomposition temperature (peak). Δm - Mass loss. Tg - Glass transition temperature (midpoint). Tc - Crystallization temperature (exothermic peak in the cooling cycle). Tm - Melting point.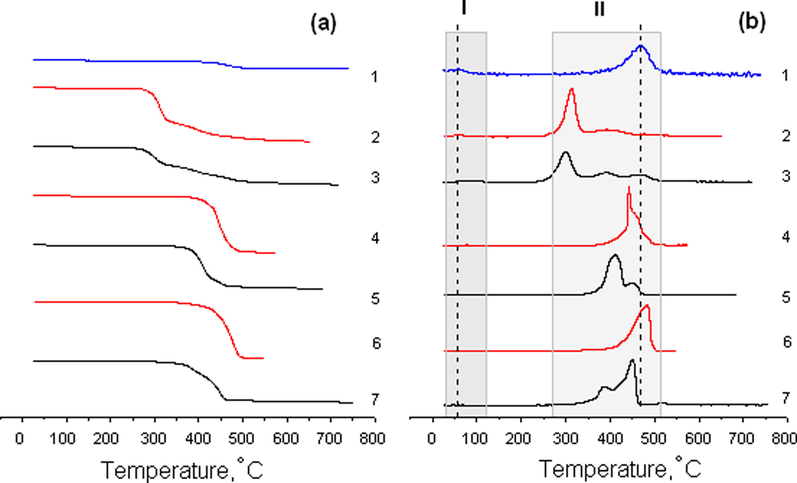
TG (a) and DTG (b) curves of the initial Hal (1), initial BMImX (2, 4, 6) and Hal-BMImX (3, 5, 7), X: DCA− (2, 3), Otf − (4, 5), and TFSI− (6, 7) nanocomposites.
System
Td, °C / Δm, %
−Tg, °C.
−Tc, °C
Tm, °C
I
II
Hal
58/2.4
471/13.1
–
–
–
BMImDCA
66/1.9
314/57.4 393/20.2 478/8.2
94a 93b
–
–
Hal-BMImDCA
88/2.8
300/30.5 390/13.3 467/15.9
98a 97b
–
–
BMImOtf
76/1.9
441/91.6
–
29a 29b
18a 18b
Hal-BMImOtf
51/2.0
410/53.8 447/15.8
106b
15a 15b
11a 22b
BMImTFSI
–
481/90.4
88a 87b
42a,c
2a
Hal-BMImTFSI
–
387/21.2 450 /40.9
86a 85b
38a,c 24b,c
0a 1b
In region (II), all the ionic liquids confined by halloysite show a decrease in the peak temperatures compared to the bulk salt and the original clay. The depression of the decomposition temperature (ΔTd = Td(bulk) − Td(pore)) depends on the anion, for example, ΔTd of the first peak changes in the following order: BMImTFSI (94 °C) > BMImOtf (31 °C) > BMImDCA (14 °C). In region I, the DTG trace of the Hal-BMImDCA and Hal-BMImOtf ionogels show multidirectional shifts in the dehydration temperature in comparison with the original components, and an increase in the dehydration temperature of the Hal-BMImDCA ionogel is associated with the interaction of the DCA− anion with water. The mass loss observed during the dehydration of the initial components and the resulting composites suggests that the ionic liquids entrapped by halloysite replace some of the free water in the host-clay, and this ability decreases in the following order: BMImDCA < BMImOtf ≪ BMImTFSI. Consequently, the thermal stability of the BMIm+-based ionic liquid entrapped by halloysite decreases due to the confinement and the effect of the interaction with both the clay wall and the water molecules absorbed by the halloysite.
Fig. 8 shows DSC curves of the first heating/cooling cycles of the samples of bulk and confined BMImX ionic liquids in halloysite. The temperatures of the observed phase transitions, such as melting (Tm), glass transition (Tg), and crystallization (Tc) or cold crystallization (Tcc) for the first and second cycles, are presented in Table 3.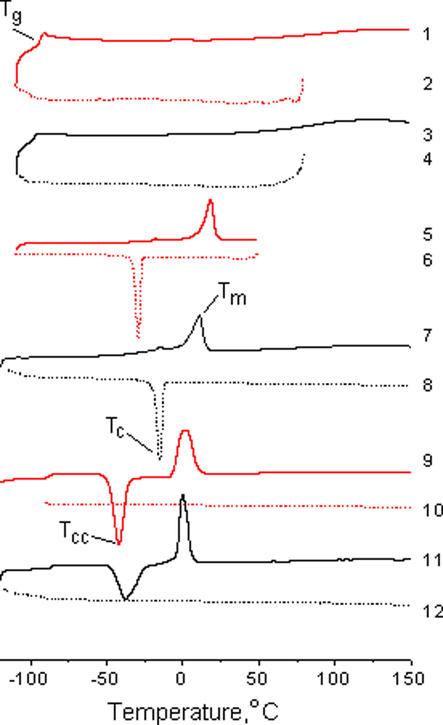
DSC curves of bulk BMImX (1, 2, 5, 6, 9, 10) and BMImX confined in halloysite (3, 4, 7, 8, 11, 12), X−: DCA− (1–4), Otf − (5–8), and TFSI− (9–12); the solid line shows the first heating cycle, the dashed line - the cooling cycle.
The DSC curves of the confined and bulk ionic liquids seem rather similar, but have some differences. Unlike BMImTFSI, confined BMImDCA shows a slight decrease in Tg caused by further amorphisation in the presence of free halloysite water. The evident difference between the confined and bulk ionic liquids is the change in the freezing and melting points. For example, a noticeable increase in Tc by 14 °C and in Tcc by 4 and 18 °C was observed in the BMImOtf and BMImTFSI ionic liquids, respectively, in both scanning cycles. At the same time, Tm shows a minor decrease (∼2 °C) for BMImTFSI and a multidirectional change (ΔTm = Tm(bulk) − Tm(pore) = 7 and − 4 °C in the first and second heating cycles, respectively) for the more hydrophilic BMImOtf. It should be noted that the melting point became lower in most of the silica-confined ILs, which was explained by the simultaneous effects of the strong interaction of the ILs with the silica wall and confinement (Néouze et al., 2006; Kanakubo et al., 2006; Liu et al., 2010). A melting point increase was observed in the ILs included in carbon materials, such as CNT (Im et al., 2012; Chen et al., 2007). This was largely due to the structural transformation of the chaotically distributed ions in the bulk phase into an ordered arrangement inside the CNT channel, which led to the anomalous phase transition from the liquid to crystallites with a high melting point (Zhang et al., 2017).
Thus, the imidazolium ILs confined in a halloysite matrix undergo thermal decomposition more easily than the bulk ILs and the process is controlled by the type of paired anions. The anomalous phase and thermal behavior is due to the change in the local ionic arrangement and interaction with clay and free water.
3.4 Ionic conductivity
Ionic liquids modified by inorganic fillers have the properties of solid electrolytes retaining high electric conductivity and a wide electrochemical stability window (Deb and Bhattacharya, 2017; Shimano et al., 2007; Horowitz et al., 2016; Li et al., 2016). ILs fill the nanopores, penetrate the interlayer spaces, and get adsorbed on the surface of porous materials but the emerging confinement effects can change the IL properties preserving the liquid-like dynamics and mobility of the ions (Lee et al., 2009).
The structure and size of the anion are among the factors significantly affecting the electric conductivity (κ) of ionic liquids. For example, work (Leys et al., 2010) shows that the electric conductivity of 1-butyl-3-methylimidazolium salts with Cl−, Br−, I−, [NCS]−, [N(CN)2]−, and [BF4]− −anions increases with the anion size increasing. This regularity, however, does not work in the anion group considered by us, and ILs with the smallest anion volume have the highest ionic conductivity. Fig. 9 shows the temperature dependences of specific electric conductivity of the studied ionic liquids and ionogels based on them in the Arrhenius plots. A temperature decrease leads to a noticeable deviation of this dependence from linearity, which is typical of glass-forming substances (Wasserscheid and Welton, 2002). It is evident that the temperature behaviour of the conductivity of the ILs and ionogels is similar, and it can be characterized by the Vogel-Fulcher-Tammann (VFT) equation related to the ordinary en masse diffusion (vehicle mechanism) (Wasserscheid and Welton, 2002; Garaga et al., 2017):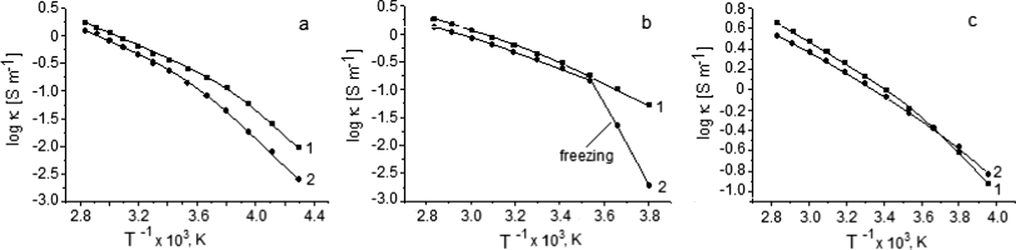
Dependence of log κ (1/T) (Arrhenius plot) of the ILs (1) and Hal-IL mixtures (2): a - with BMImTFSI; b - with BMImOtf; c - with BMImDCA.
κ = κ0 exp [-kκ/(T-T0)],
where κ0 is the limiting conductivity, kκ is a constant related to the Arrhenius activation energy, T0 is the ideal glass transition temperature, which is usually several tens of degrees lower than Tg measured by DSC (Table 3). The results of the calculation of the VFT equation parameters for the considered systems are given in Table 4. Interestingly, the patterns of changes in the VFT equation parameters of the hydrophobic BMImTFSI and hydrophilic ILs into gel are opposite to each other.
Ionic liquids, ionogels
R2
ln κ0 (S m−1)
kκ (K)
T0 (K)
BMImTFSI
0.9975
3.658
626.77
157.3
Hal-BMImTFSI
0.9999
4.243
788.27
156.1
BMImOtf
0.9999
4.731
801.05
158.5
Hal-BMImOtf
0.9999
4.115
733.48
161.7
BMImDCA
0.9998
4.947
675.63
157.3
Hal-BMImDCA
0.9999
4.355
608.51
158.7
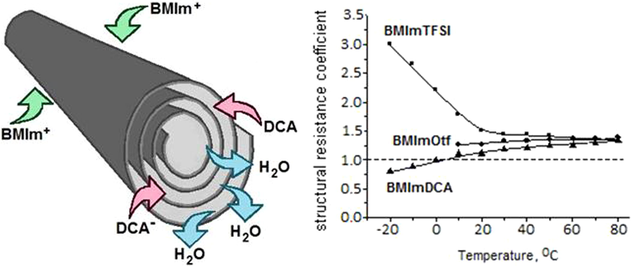
Since the clay particles are uniformly distributed in the ionic liquid, the relation of the electric conductivity of the obtained mixture with that of the pure electrolyte looks as follows (Dukhin, 1975): F = κIL/κIG, where F is the structural resistance of the mineral filler, κIL and κIG are the specific electric conductivities of the bulk IL and the ionogel, respectively. Fig. 10 shows temperature dependences of the F value that are radically different for the ILs with high and low hydrophilicity. In the first case, the structural resistance produced by the halloysite filler is several times higher than unity in the region of negative temperatures and gradually decreases when the temperature becomes higher. In salts with higher hydrophilicity (BMImOtf and BMImDCA), the F(T) dependences have the opposite character. Moreover, the ionic conductivity of the hybrid material with BMImDCA is higher in the region of negative temperatures than that of the bulk BMImDCA. Despite this difference, as the temperature rises, the F values become closer to each other and at 80 °C F ≈ 1.4 in all the systems studied.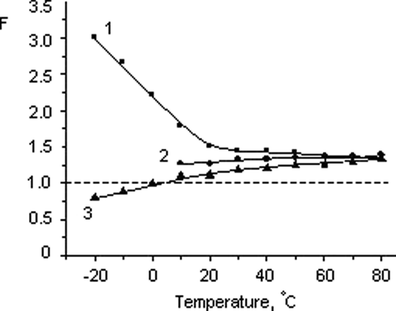
Temperature dependence of the structural resistance coefficient (F = κIL/κIG) of the of the halloysite filler in the ionogels based on BMImTFSI (1), BMImOtf (2), and BMImDCA (3).
3.5 Electrochemical window
Application of ionic liquids in electrochemical processes is based on their high electrochemical stability comparable with that of many known organic solvents (Zhang and Bond, 2005) but ILs are more environmentally friendly because of their low vapour pressure. The electrochemical stability window (electrochemical window) - a potential region without significant background current - can reach 4–6 V in case of a suitable cation–anion combination, with the cathode stability limits usually determined by the cation, and the anode stability limit - by the anion. But the counter-ion can affect these characteristics too (Zhang et al., 2006; Zhang et al., 2009; Kroon et al., 2006). TFSI− and Otf− anions are oxidized at relatively high anodic potentials, which assumes that the ionic liquids based on these anions have high stability (Galiński et al., 2006; Ignat’ev et al., 2012). The electrochemical window for BMImDCA is 3–3.7 V, according to works (Yuan et al., 2018; Zec et al., 2016). The researchers also note that the size of the electrochemical window depends on the electrode material used. Fig. 11 shows the voltammograms of the studied ILs and ionogels based on them measured on a platinum electrode. The range of potentials in all the systems exceeds 4 V at the current density ± 1 mA cm−2. However, there are certain differences between the obtained electrochemical window characteristics in the pure ILs and ILs in the ionogels. The differences consist in the narrowing of the electrochemical window (in BMImOtf, Fig. 11b) and appearance of a well-pronounced redox process (in BMImDCA, Fig. 11c) inside the IL electrochemical window. Water impurities in ionic liquids are known to considerably reduce the electrochemical window (O’Mahony et al., 2008), with the water electrochemical activity expressed in the form of two interrelated irreversible anodic and cathodic current peaks (Grishina et al., 2008). It was suggested that hygroscopic ILs could dehydrate halloysite and absorb the released water molecules. An additional experiment consisting in introducing water into BMImDCA showed that the increase in the content of this impurity in the IL from 0.11 wt% (the initial level) to 11.5 wt% made the anodic current peak more than 100 times higher and it also increased the cathode current peak associated with him. At the same time, the electrochemical characteristic of the hydrophobic BMImTFSI in the free state and as an ionogel component did not change a lot (Fig. 11a).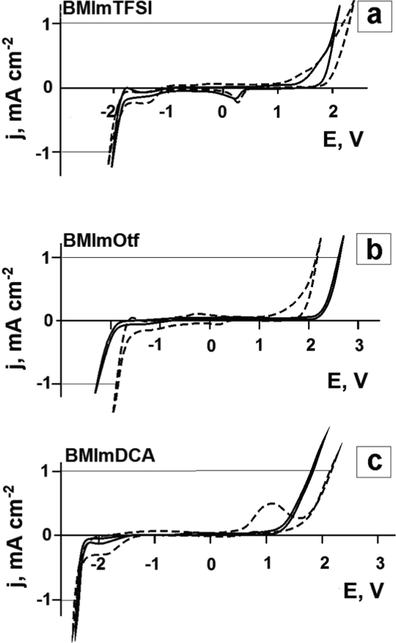
Cyclic voltammograms of the Pt electrode in ionic liquids (solid line) and ionogels based on them (dashed line). The potential scan rate is 5 mV s−1, the temperature is 25 °C.
4 Conclusion
Quasi-solid ionogels have been obtained by direct mixing of ionic liquids − 1-butyl-3-methylimidazolium salts - containing various anions with nano-sized tubular halloysite. The effect of the anion nature (TFSI−, Otf −, and DCA−) of the ionic liquids on the physicochemical properties of the ionogels has been studied. An X-ray diffraction analysis has shown that in halloysite in the ionogel decreases the basal spacing in comparison with the initial value, which is caused, as we believe, by the halloysite dehydration by the ionic liquids. The thermal analysis data indicate that the thermal stability of the considered ionic liquids in the porous halloysite matrix decreases due to the confinement effect and interaction both with the clay wall and the water molecules. The DSC method has shown that the crystallization, melting, and glass transition points of the ionic liquids in the ionogels become noticeably higher than in the bulk ILs. Using the FT-IR spectroscopy method, we have found that the anion type affects the intermolecular interaction of an ionic liquid with halloysite. In contrast to the hydrophobic TFSI– anion, the hydrophilic DCA– one easily interacts with the inter-layer water and silanol groups due to the formation of H–O–H∙∙∙N and Si–OH∙∙∙N hydrogen bonds. This ability, as well as the anion hydrophilicity, decreases in the following order: DCA− > Otf − > TFSI−. The BMIm+ cation interacts with halloysite mainly due to the electrostatic interaction with the negatively charged clay surface. The combination of the two factors − the difference in the force of interaction with the clay surface and the enrichment of ionic liquids containing hydrophilic and hydrophobic anions with water impurities - leads to differences in the electrochemical behaviour of these ILs in the ionogels. The conductometry method allowed us to identify the opposite trends in the temperature dependences of the structural resistance coefficients of a mineral filler distributed in ionogels based on hydrophilic and hydrophobic ILs. However, regardless of the anion type, the values of these coefficients are very close to each other (∼1.4) at high temperatures (80 °C) at the mixture component ratio used in this work. The higher impurity content of the free water extracted from halloysite by hydrophilic ILs also leads to changes in the electrochemical window and appearance of an additional redox process involving water.
Acknowledgements
This work was funded by the Russian Foundation for Basic Research, grant No. 18-29-12012 mk and by State Assignment of the Ministry of Science and Higher Education of the Russian Federation No. 01201260481.
The authors would like to express gratitude to the Center for Joint Use of Scientific Equipment “The Upper Volga Region Centre of Physico-Chemical Research”.
Declaration of Competing Interest
The authors declare no conflicts of interest.
References
- Ozokwelu, D., Zhang, S., Okafor, O.C., Cheng, W., Litombe N., 2017. Chapter 4, Catalytic Reaction in Ionic Liquids. In: Novel Catalytic and Separation Processes Based on Ionic Liquids. Elsevier, pp. 111-191. https://doi.org/10.1016/b978-0-12-802027-2.00004-2.
- CO2 Capture in Ionic Liquids: A Review of Solubilities and Experimental Methods. J. Chem.. 2013;2013:1-16.
- [CrossRef] [Google Scholar]
- Dissolution of natural polymers in ionic liquids: A review. e-Polymers. 2012;12:1-29.
- [CrossRef] [Google Scholar]
- Ohno, H., 2017. Physical Properties of Ionic Liquids for Electrochemical Applications. In: Endres, F. (Eds.), Electrodeposition from Ionic Liquids. Wiley-VCH. https://doi.org/10.1002/9783527682706.ch3.
- Application of Ionic Liquids to Energy Storage and Conversion Materials and Devices. Chem. Rev.. 2017;117(10):7190-7239.
- [CrossRef] [Google Scholar]
- Ionic liquid polymer electrolytes. J. Mater. Chem. A. 2013;1(8):2719-2743.
- [CrossRef] [Google Scholar]
- Ionogels based on ionic liquids as potential highly conductive solid state electrolytes. Electrochim. Acta. 2013;91:219-226.
- [CrossRef] [Google Scholar]
- Ionogel-based solid-state supercapacitor operating over a wide range of temperature. Electrochim. Acta. 2016;206:490-495.
- [CrossRef] [Google Scholar]
- Role of different nanoparticulate cores on the thermal, mechanical and electrochemical cycling behaviour of nanoscale hybrid ionic fluids. Electrochim. Acta. 2017;245:438-447.
- [CrossRef] [Google Scholar]
- Ionic liquid–SnO2 nanoparticle hybrid electrolytes for secondary charge storage charge storage devices: physicochemical and electrochemical studies. Int. J. Hydrogen Energy.. 2018;43:4081-4089.
- [CrossRef] [Google Scholar]
- Overview — clay mineral applications. Appl. Clay Sci.. 1991;5(5-6):379-395.
- [CrossRef] [Google Scholar]
- Fundamental and applied research on clay minerals: From climate and environment to nanotechnology. Appl. Clay Sci.. 2013;74:3-9.
- [CrossRef] [Google Scholar]
- Clay Minerals-Ionic Liquids, Nanoarchitectures, and Applications. Adv. Funct. Mater.. 2018;28(27):1703845.
- [CrossRef] [Google Scholar]
- Liquid crystal self-assembly of halloysite nanotubes in ionic liquids: a novel soft nanocomposite ionogel electrolyte with high anisotropic ionic conductivity and thermal stability. Nanoscale. 2016;8(3):1545-1554.
- [CrossRef] [Google Scholar]
- Properties and applications of halloysite nanotubes: recent research advances and future prospects. Appl. Clay Sci.. 2015;112-113:75-93.
- [CrossRef] [Google Scholar]
- Clay nanotube encapsulation for functional biocomposites. Adv. Colloid Interface Sci.. 2014;207:189-198.
- [CrossRef] [Google Scholar]
- Nanocomposites of Inorganic Oxides with Ionic Liquids. Synthesis, Properties, Application (Review) Russ. J. Inorg. Chem.. 2019;64(13):1641-1648.
- [CrossRef] [Google Scholar]
- Composite nanomaterials based on 1-butyl-3-methylimidazolium dicianamide and clays. J. Mater. Res. Technol.. 2019;8(5):4387-4398.
- [CrossRef] [Google Scholar]
- Structural and Thermal Properties of Montmorillonite/Ionic Liquid Composites. Materials. 2016;12(16):2578.
- [CrossRef] [Google Scholar]
- Effect of synthesis conditions on the properties of an ionic liquid in the 1-butyl-3-methylimidazolium acetate - Na-bentonite ionogel. Steric stabilization and confinement. J. Mol. Liq.. 2020;315:113703.
- [CrossRef] [Google Scholar]
- Observation of the hydrated form of tubular halloysite by an electronmicroscope equipped with an environmental cell. Clays Clay Miner.. 1978;26:25-40.
- [Google Scholar]
- Organosilane functionalization of halloysite nanotubes for enhanced loading and controlled release. Nanotechnology. 2012;23(37):375705.
- [CrossRef] [Google Scholar]
- Recent advances in halloysite nanotube derived composites for water treatment. Environ. Sci.: Nano. 2016;3(1):28-44.
- [CrossRef] [Google Scholar]
- Nonlinear optics of nontoxic nanomaterials. Opt. Commun.. 2010;283(3):438-441.
- [CrossRef] [Google Scholar]
- The stability of halloysite nanotubes in acidic and alkaline aqueous suspensions. Nanotechnology. 2012;23(6):065705.
- [CrossRef] [Google Scholar]
- Clay mineralogy. New York: McGraw-Hill; 1968.
- Phase and structural features of tubular halloysite (7 Å) Clay Miner.. 2018;53(4):691-720.
- [CrossRef] [Google Scholar]
- Physicochemical Properties and Structures of Room-Temperature Ionic Liquids. 3. Variation of Cationic Structures. J. Phys. Chem. B. 2006;110(6):2833-2839.
- [CrossRef] [Google Scholar]
- Ionic and molar volumes of room temperature ionic liquids. J. Mol. Liq.. 2015;209:289-293.
- [CrossRef] [Google Scholar]
- How to Predict the Physical Properties of Ionic Liquids: A Volume-Based Approach. Angew. Chem. Int. Ed.. 2007;46(28):5384-5388.
- [CrossRef] [Google Scholar]
- Polarisabilities of alkylimidazolium ionic liquids. PhysChemChemPhys.. 2013;15:2703-2711.
- [CrossRef] [Google Scholar]
- Empirical description and prediction of ionic liquids' properties with augmented volume-based thermodynamics. J. Mol. Liq.. 2014;192:3-8.
- [CrossRef] [Google Scholar]
- Sorption of Organic Cations to Phyllosilicate Clay Minerals: CEC-Normalization, Salt Dependency, and the Role of Electrostatic and Hydrophobic Effects. Environ. Sci. Technol.. 2013;47(24):14224-14232.
- [CrossRef] [Google Scholar]
- Development and Evaluation of a New Sorption Model for Organic Cations in Soil: Contributions from Organic Matter and Clay Minerals. Environ. Sci. Technol.. 2013;47(24):14233-14241.
- [CrossRef] [Google Scholar]
- Water in Ionic Liquids: Correlation between Anion Hydrophilicity and Near-Infrared Fingerprints. ChemPhysChem. 2016;17(11):1586-1590.
- [CrossRef] [Google Scholar]
- Characterization and comparison of hydrophilic and hydrophobic room temperature ionic liquids incorporating the imidazolium cation. Green Chem.. 2001;3(4):156-164.
- [CrossRef] [Google Scholar]
- Characterisation of Halloysite by Spectroscopy. Develop. Clay Sci.. 2016;7:115-136.
- [CrossRef] [Google Scholar]
- Thermal-Treatment-Induced Deformations and Modifications of Halloysite. Develop Clay Sci.. 2016;7:137-166.
- [CrossRef] [Google Scholar]
- Infrared and infrared emission spectroscopic study of typical Chinese kaolinite and halloysite. Spectrochim. Acta Part A Mol. Biomol. Spectrosc.. 2010;77(5):1014-1020.
- [CrossRef] [Google Scholar]
- Vibrational spectroscopic study of the protic ionic liquid 1-H-3-methylimidazolium bis(trifluoromethanesulfonyl)imide. Vib. Spectrosc.. 2012;63:350-359.
- [CrossRef] [Google Scholar]
- Infrared spectra of bis(trifluoromethanesulfonyl)imide based ionic liquids: Experiments and DFT simulations. Vib. Spectrosc.. 2014;74:81-87.
- [CrossRef] [Google Scholar]
- Molecular Structure and Interactions in the Ionic Liquid 1-Ethyl-3-methylimidazolium Bis(Trifluoromethylsulfonyl)imide. J. Phys. Chem. A. 2014;118(13):2547-2557.
- [CrossRef] [Google Scholar]
- Comparative study of atmospheric ionic liquids based on bis(trifluoromethylsulfonyl)imide anion and alkyl substituted cations of ammonium, pyrrolidinium and imidazolium. J. Mol. Liq.. 2020;312:113368.
- [CrossRef] [Google Scholar]
- Molecular states of water in room temperature ionic liquids. Phys. Chem. Chem. Phys.. 2001;3:5192-5200.
- [CrossRef] [Google Scholar]
- Physicochemical features of short-chain 1-alkyl-3-methylimidazolium bis(trifluoromethylsulfonyl)-imide ionic liquids containing equilibrium water absorbed from air. J. Mol. Liq.. 2018;272:759-765.
- [CrossRef] [Google Scholar]
- Properties of Ionic Liquid Confined in Porous Silica Matrix. ChemPhysChem. 2010;11:2036-2043.
- [CrossRef] [Google Scholar]
- Intensification phenomenon of weak ionic interactions of 1-butyl-3-methylimidazolium hexafluorophosphate ionic liquid macro-dispersed in poly(methyl methacrylate): FTIR spectroscopic evidence. J. Mol. Liq.. 2016;218:133-137.
- [CrossRef] [Google Scholar]
- On the solid, liquid and solution structural organization of imidazolium ionic liquids. J. Braz. Chem. Soc.. 2004;15(3):341-350.
- [CrossRef] [Google Scholar]
- Fujii, K., Nonaka, T., Akimoto, Y., Umebayashi, Y., Ishiguro S., 2008. Solvation Structures of Some Transition Metal(II) Ions in a Room-Temperature Ionic Liquid, 1-Ethyl-3-methylimidazolium Bis(trifluoromethanesulfonyl)amide. Analyt. Sci. 24, 1377-1380. https://doi.org/ 10.2116/analsci.24.1377.
- The effect of different interfaces and confinement on the structure of the ionic liquid 1-butyl-3-methylimidazolium bis(trifluoromethylsulfonyl)imide entrapped in cationic and anionic reverse micelles. Phys. Chem. Chem. Phys.. 2012;14(10):3460.
- [CrossRef] [Google Scholar]
- Ionogels, ionic liquid based hybrid materials. Chem. Soc. Rev.. 2011;40:907-925.
- [CrossRef] [Google Scholar]
- Electron donor ionic liquids entrapped in anionic and cationic reverse micelles. Effects of the interface on the ionic liquid–surfactant interactions. Phys. Chem. Chem. Phys.. 2013;15(39):16746.
- [CrossRef] [Google Scholar]
- Thermal properties of imidazolium ionic liquids. Thermochim Acta. 2000;357-358:97-102.
- [CrossRef] [Google Scholar]
- Ionogels, New Materials Arising from the Confinement of Ionic Liquids within Silica-Derived Networks. Chem. Mater.. 2006;18(17):3931-3936.
- [CrossRef] [Google Scholar]
- Melting Point Depression of Ionic Liquids Confined in Nanospaces. Chem. Commun.. 2006;17:1828-1830.
- [CrossRef] [Google Scholar]
- Immobilization and melting point depression of imidazolium ionic liquids on the surface of nano-SiOx particles. Dalton Trans.. 2010;39(13):3190.
- [CrossRef] [Google Scholar]
- Anomalous thermal transition and crystallization of ionic liquids confined in graphene multilayers. Chem. Commun.. 2012;48(14):2015.
- [CrossRef] [Google Scholar]
- Transition of Ionic Liquid [bmim][PF 6 ] from Liquid to High-Melting-Point Crystal When Confined in Multiwalled Carbon Nanotubes. J. Am. Chem. Soc.. 2007;129(9):2416-2417.
- [CrossRef] [Google Scholar]
- Preparation of Nanohybrid Solid-State Electrolytes with Liquidlike Mobilities by Solidifying Ionic Liquids with Silica Particles. Chem. Mater.. 2007;19(22):5216-5221.
- [CrossRef] [Google Scholar]
- Formulation influence on the sol–gel formation of silica-supported ionogels. J Sol-Gel Sci Technol. 2016;78(1):34-39.
- [CrossRef] [Google Scholar]
- Ionic liquid decorated mesoporous silica nanoparticles: a new high-performance hybrid electrolyte for lithium batteries. Chem. Commun.. 2016;52(23):4369-4372.
- [CrossRef] [Google Scholar]
- Binary room-temperature ionic liquids based electrolytes solidified with SiO2 nanoparticles for dye-sensitized solar cells. J. Power Sources. 2009;190(2):573-577.
- [CrossRef] [Google Scholar]
- Influence of the anion on the electrical conductivity and glass formation of 1-butyl-3-methylimidazolium ionic liquids. J. Chem. Phys.. 2010;133(3):034503.
- [CrossRef] [Google Scholar]
- Wasserscheid P., Welton T., eds. Ionic Liquids in Synthesis. Weinheim, FRG: Wiley-VCH Verlag GmbH & Co. KGaA; 2002.
- Achieving enhanced ionic mobility in nanoporous silica by controlled surface interactions. Phys. Chem. Chem. Phys.. 2017;19(8):5727-5736.
- [CrossRef] [Google Scholar]
- Elektroprovodnost’ i elektrokineticheskie svoistva dispersnykh sistem (Electric Conductivity and Electrokinetic Properties of Diperse Systems). Kiev: Naukova Dumka; 1975.
- Practical considerations associated with voltammetric studies in room temperature ionic liquids. Analyst. 2005;130(8):1132.
- [CrossRef] [Google Scholar]
- Physical Properties of Ionic Liquids: Database and Evaluation. J. Phys. Chem. Ref. Data. 2006;35(4):1475-1517.
- [CrossRef] [Google Scholar]
- Ionic Liquids: Physicochemical Properties. UK: Elsevier; 2009.
- Decomposition of ionic liquids in electrochemical processing. Green Chem.. 2006;8(3):241-245.
- [CrossRef] [Google Scholar]
- Ionic liquids as electrolytes. Electrochim. Acta. 2006;51(26):5567-5580.
- [CrossRef] [Google Scholar]
- A Convenient Synthesis of Triflate Anion Ionic Liquids and Their Properties. Molecules. 2012;17(5):5319-5338.
- [CrossRef] [Google Scholar]
- Viscosity, conductivity, and electrochemical property of dicyanamide ionic liquids. Front. Chem.. 2018;6:59.
- [CrossRef] [Google Scholar]
- Electrical and electrochemical behavior of [bmim][DCA] + γ-butyrolactone electrolyte. J. Chem. Thermodyn.. 2016;101:293-299.
- [CrossRef] [Google Scholar]
- Effect of Water on the Electrochemical Window and Potential Limits of Room-Temperature Ionic Liquids. J. Chem. Eng. Data. 2008;53(12):2884-2891.
- [CrossRef] [Google Scholar]
- Electrochemical properties of 1-butyl-3-methylimidazolium bromide melt containing water impurities. Russ. J. Electrochem.. 2008;44(11):1257-1262.
- [CrossRef] [Google Scholar]


