

Translate this page into:
The drug interaction potential of berberine hydrochloride when co-administered with simvastatin, fenofibrate, gemfibrozil, metformin, glimepiride, nateglinide, pioglitazone and sitagliptin in beagles
⁎Corresponding author. ligfpharm@sina.com (Limei Zhao)
-
Received: ,
Accepted: ,
This article was originally published by Elsevier and was migrated to Scientific Scholar after the change of Publisher.
Peer review under responsibility of King Saud University.
Abstract
Berberine (BBR) hydrochloride is a traditional Chinese medicine with unique hypoglycemic and lipid-lowering effects discovered in recent years. The combination of BBR with other hypoglycemic drugs and lipid-lowering drugs could become a promising treatment strategy. With the aim of evaluating the potential drug-drug interaction (DDI) based on the pharmacokinetics between BBR and simvastatin, fenofibrate, gemfibrozil, metformin, glimepiride, nateglinide, pioglitazone and sitagliptin in beagles, an UPLC-MS/MS method has been developed and validated. The analytes and internal standards were extracted from plasma samples using a magnetic solid phase extraction technique, and then separated by a Luna® Omega C18 column (20.0 × 2.0 mm, 1.6 μm) with water containing 3 mM ammonium and 0.1% formic acid and acetonitrile containing 3 mM ammonium and 0.1% formic acid as the mobile phase. Validation of the UPLC-MS/MS method was carried out following the criteria of the Chinese Pharmacopeia, mainly including specificity, carryover, calibration curve, crosstalk, precision, accuracy, dilution integrity, matrix effect, recovery and stability. The results showed that all the criteria of the method validation met the Chinese Pharmacopoeia guidelines, and the proposed UPLC-MS/MS method was proven to be sensitive, simple and specific to determine all the analytes in the beagles’ plasma samples simultaneously. Meanwhile, the potential DDI between BBR and simvastatin, fenofibrate, gemfibrozil, metformin, glimepiride, nateglinide, pioglitazone and sitagliptin was confirmed in this paper, especially for simvastatin, fenofibrate, gemfibrozil and glimepiride.
Keywords
Validation
DDI
Berberine hydrochloride
Hypoglycemic drugs
Lipid-lowering drugs

1 Introduction
Berberine (BBR) hydrochloride, one of the main alkaloids in Coptis, shows a clear hypoglycemic and hypolipidemic effect, which has attracted the attention of many scholars.
It has been mainly used to treat gastroenteritis, diarrhea, and hepatic disorders, without apparent side-effects. Extensive research within the past decades indicates that BBR possesses a wide range of pharmacological activities, including anti-inflammatory, hepatoprotective effect, antiarrhythmic, improvement of cerebral ischemia, hypolipidemic, antioxidative, antineoplastic activities, antiproliferative and hypoglycemic. The reason why BBR can arouse the interest of researchers is mainly related to its low toxicity and side effects in addition to its extensive pharmacological activity. Feng et al. found that BBR is almost safe at conventional doses, with a relatively low incidence of adverse reactions, such as gastrointestinal discomfort, and transient increases in plasma bilirubin levels. However, the safety of BBR is relatively high, it should be taken carefully to avoid adverse side effects. For example, BBR in combination with statins increases cardiotoxicity by inhibiting CYP3A4 and human ether-a-go-go related genes (hERG) potassium channels (Feng et al., 2018). BBR replaces bilirubin in binding to albumin (in nearly 10 times greater effect compared to phenylbutazone), so any BBR containing herbs should be avoided in jaundice in pregnant women and infants (Chan, 1993). BBR interacts with macrolides and it may lead to potentially dangerous arrhythmias (Zhi et al., 2018). Therefore, we should pay more attention to its potential side effects while paying attention to the pharmacological activity of BBR. Among these bioactivities, the blood-lipid-reducing effect and glucose-lowering effect of BBR has received much attention because BBR has a unique blood-lipid-reducing and glucose-lowering mechanism, which is completely different from traditional hypoglycemic and lipid-lowering drugs (Andreas et al., 2012; Beth & Paul, 2015; Bogusław et al., 2018). The current lipid-lowering and hypoglycemic drugs have difficulty in achieving the desired therapeutic effects, and some patients cannot tolerate adverse reactions (liver damage, myopathy, acute renal failure) because of the limitations of the drugs and the patient’s own morbidities (causes, age, gender, nutrition, liver and kidney function) (Chen et al., 2019; Christoph & Linda, 2020; Feng et al., 2019). Therefore, BBR has great research and clinical value in terms of treating hyperglycemia and hyperlipidemia.
Hyperglycemia and hyperlipidemia are chronic lifelong diseases, and drug treatment is a main measure to control the disease. Synthetic drugs, such as statins, fibrates, biguanides, sulfonylureas, thiazolidinediones and DPP-4 inhibitors, are the most commonly used drugs for the treatment of hyperglycemia and hyperlipidemia. However, although these drugs show therapeutic effects, problems, such as large side effects and drug dependence still need our attention. Therefore, a combination of different drugs is a more commonly used treatment strategy to treat hyperglycemia and hyperlipidemia. However, combination therapy may be a double-edged sword. On the one hand, synergistic combination therapy can improve effectiveness, reduce side effects and delay the development of drug resistance. On the other hand, the drug-drug interaction (DDI) caused by the combination will greatly affect the final efficacy and side effects (George, 2017; Hideki et al., 2003; Kim et al., 2020). Pharmacokinetic interactions based on metabolic enzymes and transporters are the most common and serious DDI because they can cause huge fluctuations in plasma concentrations by affecting the activities of metabolic enzymes and transporters. BBR has the prerequisites for DDI with other drugs from the perspective of pharmacokinetics (Li et al., 2020; D.D. Li et al., 2016; G.G. Li et al., 2016). For example, BBR is mainly metabolized by cytochrome P450 1A2 (CYP1A2), cytochrome P450 2D6 (CYP2D6) and cytochrome P450 3A4 (CYP3A4) into a variety of metabolites in the liver. At the same time, BBR is a substrate of P-glycoprotein 1 (P-gp) and organic cation transporter. In addition, BBR has a significant inhibitory effect on P-gp, CYP2D6, and cytochrome P450 2C9 (CYP2C9), but has an inductive and inhibitory effect on CYP3A4 (D.D. Li et al., 2016; G.G. Li et al., 2016; Liu et al., 2015; Maciej, Kathleen & Zhang, 2018). Thus, it is necessary to study the DDI between BBR and other clinically commonly used hypoglycemic and lipid-lowering drugs (such as simvastatin (SVT), fenofibrate (FBT), gemfibrozil (GEM), metformin (MET), glimepiride (GMP), nateglinide (NAT), pioglitazone (PIO) and sitagliptin (SIT)) from the perspective of rational drug use.
Ultra performance liquid chromatography-mass spectrometry (UPLC-MS/MS) is currently the most commonly used method to determine in vivo concentration of drugs and metabolites because it has higher sensitivity than UV spectrophotometry, immunoassay and high-performance liquid chromatography methods and can determine low-concentration drugs and metabolites (Moon, Yu & Kim, 2020; National Pharmacopoeia Commission, 2020; Qi & Liu, 2021). Meanwhile, the UPLC-MS/MS method has high specificity and can simultaneously determine multiple drugs without interference from endogenous substances. Therefore, the UPLC-MS/MS method has become the routine method for in vivo drug analysis in recent years.
In summary, the purpose was to develop and validate an UPLC-MS/MS method for studying the DDI between BBR and SVT, FBT, GEM, MET, GMP, NAT, PIO and SIT in beagles. Magnetic solid phase extraction technique (mSPE) was used to extract the analytes from plasma. The results showed that the newly established UPLC-MS/MS method could simultaneously determine BBR, SVT, FBA (fenofibric acid, metabolite of FBT), GEM, MET, GMP, NAT, PIO and SIT in plasma. In addition, the DDI between BBR and SVT, FBT, GEM, MET, GMP, NAT, PIO and SIT was confirmed, especially for SVT, FBT, GEM and GMP.
2 Materials and methods
2.1 Experimental reagents
All test drugs are commonly used in similar preparations. Among them, SVT tablets (40 mg), FBT capsules (200 mg), BBR tablets (100 mg), MET tablets (500 mg), GMP tablets (2 mg), SIT tablets (100 mg), NAT tablets (120 mg), PIO tablets (15 mg) and GEM tablets (150 mg) are produced by Merck, Recipharm, Fontaine, France, Northeast Pharmaceutical Group, Shenyang No. 1 Pharmaceutical Co., Ltd., Sino-American Shanghai Squibb Pharmaceutical Ltd., Sanofi, Merck Sharp and Dohme Ltd., Novartis, Zhong Mei Hua Dong Pharmaceutical Ltd. and Harbin Pharmaceutical Group Co., Ltd., respectively. Tetrahydropalmatine and lovastatin were purchased from National Institute for the Control of Pharmaceutical and Biological Products (Beijing, China). HPLC-grade acetonitrile (ACN) and methanol (MeOH) were purchased from Fisher Scientific (Fair Lawn, NJ, USA). HPLC-grade ammonium acetate and formic acid were obtained from Sigma-Aldrich. Ultrapure water (UPW) for UPLC analysis was obtained using a Milli-Q water purification system (Millipore Corp., USA). mSPE equipment and consumables were purchased from Pureton (Shanghai, China).
2.2 Animals
Sixteen male beagles weighing 9.15 ± 0.54 kg were obtained from Kangping Laboratory Animal Research Institute. All animal-use procedures were in accordance with the regulation for animal experimentation issued by the State Committee of Science and Technology of the People’s Republic of China. The beagles were housed in an air-conditioned room (25.0 ± 2.0 °C), at a relative humidity of 45.0–60.0%, for 14 days. The beagles were fasting for 12.0 h but had free access to water prior to administration of the drugs.
2.3 Equipment and operating conditions
The Agilent 1290 UPLC, equipped with a column oven, a dual 54-well plate autosampler, a binary pump and an on-line degasser, was used for the chromatographic analysis. BBR, SVT, FBA, GEM, MET, GMP, NAT, PIO and SIT were separated using a Luna® Omega C18 column (20.0 mm × 2.0 mm, 1.6 μm) under 30 °C. The mobile phase was composed of UPW containing 3 mM ammonium formate and 0.1% formic acid and ACN containing 3 mM ammonium formate and 0.1% formic acid. The gradient elution conditions are shown in Table 1. The sample injection volume was 2.0 μL.
Time (min)
A (%)a
B (%)b
Flow rate (mL/min)
Initial
70
30
0.4
0.3
70
30
0.4
0.5
25
75
0.4
2.5
25
75
0.4
2.8
15
85
0.4
3.5
15
85
0.4
3.7
70
30
0.4
4.0
70
30
0.4
The MS spectrometric detection of the analytes and internal standards (IS) was performed on a Sciex QTRAP 4500 MS system with electrospray ionization detector. Nitrogen for the MS was obtained from the SCIWAY ZABN nitrogen generator. The main MS-optimized parameters are displayed in Table 2. Other MS parameters are listed as follows: ion source temperature, 400 °C; collision gas, medium; entrance potential, 20; curtain gas, 40; collision cell exit potential, 15; ion source gas 1, 45; and ion source gas 2, 50. The dwell time for all the analytes and IS was 50 ms. Analyst software v1.6.2 supplied with the MS system was used to process the data.
Ionization Mode
Transition (m/z)
Collision Energy (eV)
Declustering Potential (s)
Spray Voltage (V)
BBR
Positive
336.0 → 319.8
40
65
4500
SVT
Positive
419.2 → 199.1
20
60
4500
FBA
Positive
319.0 → 232.9
38
83
4500
GEM
Positive
483.0 → 270.0
35
80
4000
MET
Positive
130.0 → 71.0
37
85
4500
GMP
Positive
491.4 → 352.4
30
58
4500
NAT
Positive
488.2 → 394.1
24
48
4500
PIO
Positive
357.4 → 133.9
36
62
4500
SIT
Positive
408.3 → 234.8
30
65
4500
TYP
Positive
355.9 → 192.0
35
55
4500
LVT
Positive
405.2 → 199.1
25
64
4500
2.4 Stock solutions, quality control samples and calibration standards
Stock solutions of analytes and IS were dissolved in methanol to obtain a final concentration of 500.0 μg/mL. A series of concentration standard solutions was prepared by diluting the above stock solution in 20% aqueous MeOH.
Calibration curves were prepared by adding 10 μL of the corresponding working solutions to 100.0 μL of drug-free beagle plasma to produce the following calibration concentrations: 0.1, 0.25, 1.0, 4.0, 10.0, 40.0, 100.0 and 250.0 ng/mL for BBR; 0.2, 0.5, 2.0, 8.0, 20.0, 80.0, 200.0 and 500.0 ng/mL for SVT, GEM and SIT; 10.0, 25.0, 100.0, 400.0, 1000.0, 4000.0, 10 000.0 and 25 000.0 ng/mL for FBA; 1.0, 2.5, 10.0, 40.0, 100.0, 400.0, 1000.0 and 2500.0 ng/mL for GMP, PIO and NAT; and 2.0, 5.0, 20.0, 80.0, 200.0, 800.0, 2000.0 and 5000.0 ng/mL for MET.
Quality control (QC) samples were prepared at the lower limit of quantification (LLOQ), low concentration quality control (LQC), medium concentration quality control (MQC) and high concentration quality control (HQC) separately according to the preparation method of the calibration curve, and the specific concentrations were as follows: 0.1, 0.2, 5.0 and 200.0 ng/mL for BBR; 0.2, 0.4, 10.0 and 400.0 ng/mL for SVT, GEM and SIT; 1.0, 2.0, 50.0 and 2000.0 ng/mL for GMP, PIO and NAT; 2.0, 4.0, 100.0 and 4000.0 ng/mL for MET and 10.0, 20.0, 500.0 and 20 000.0 ng/mL for FBA. The LLOQ was 0.1 ng/mL for BBR; 0.2 ng/mL for SVT, GEM and SIT; 1.0 ng/mL for GMP, PIO and NAT; 2.0 ng/mL for MET; and 10.0 ng/mL for FBA.
Twenty nanograms per mL tetrahydropalmatine (TYP) solution, 50 ng/mL lovastatin (LVT) solution and 100 ng/mL diazepam solution were obtained by diluting the stock solution with 20% aqueous MeOH.
2.5 Plasma samples
Plasma samples were prepared by using the mSPE technique, and the detailed steps were as follows: (1) Activation of the mSPE magnetic particles: 150.0 μL MeOH and 20.0 μL HLB magnetic particles were added to the first column of a 96-well plates (8 rows and 12 columns) and stirred with a magnetic bar for 30 s; (2) Elution of the mSPE magnetic particles: the activated magnetic particles were absorbed by the magnetic bar and transferred to the second column of the 96-well plate, and then rinsed with 600 μL water to remove the MeOH; (3) Adsorption of analyses and IS: 100.0 μL plasma sample and 20.0 μL IS solution were added to the third column of a 96-well plates and stirred with a magnetic bar for 30 s; (4) Elution of mSPE magnetic particles: drug-adsorbed mSPE magnetic particles were absorbed by the magnetic bar and transferred to the fourth column of the 96-well plate, and then rinsed with 600 μL water for 30 s to remove the endogenous substances with larger particle sizes that could not enter the pores of the mSPE particles; (5) Elution of analyses: drug-adsorbed mSPE magnetic particles after elution with water are absorbed by the magnetic bar and transferred to the fifth column of the 96-well plate and then rinsed with 600 μL ACN for 30 s to elute the analytes. Finally, the analyte solutions were injected into the UPLC-MS/MS system for analysis.
2.6 Method validation
All validation procedures of the developed UPLC-MS/MS method were performed according to the Chinese Pharmacopeia guidelines for bioanalytical method validation (Qiu et al., 2009; Shi et al., 2019). The validation parameters included specificity, linearity, accuracy, crosstalk, precision, recovery rate, matrix effect, carryover, dilution integrity and stability.
2.6.1 Specificity and crosstalk
The specificity was assessed by comparing blank plasma samples from six different beagles’ plasma samples with the corresponding spiked plasma samples at LLOQ. The MRM signal should be < 20% of the LLOQ for the corresponding analyte and < 5% for the IS. The crosstalk between the analytes and the IS was also evaluated to eliminate interference from the different ion channels. The influence of the IS on the response of analgesics was performed by determining the extracted blank plasma spiked with IS in four replicates, while the effect of the analgesics on the IS was investigated by analyzing the ULOQ without IS in four replicates. The MRM signal of the analgesics should be <20% of the LLOQ while the MRM signals of the IS should be <5% of the IS.
2.6.2 Linearity, LLOQ and carryover
A standard curve was plotted from the peak area ratios of the analyte and IS against the corresponding analyte concentrations, and the linearity of the study was evaluated by assessing three standard curves on three consecutive days. The standard concentration range of the calibration curve was 0.1–250.0 ng/mL for BBR; 0.2–500.0 ng/mL for SVT, GEM and SIT; 1.0–2500.0 ng/mL for GMP, PIO and NAT; 2.0–5000.0 ng/mL for MET; and 10.0–25 000.0 ng/mL for FBA. The LLOQ was obtained from the signal-to-noise (S/N) ratios, and the S/N ratios of all the analytes and IS were >10:1. The impact of carryover on the results was assessed by determining blank samples after the ULOQ, and the carryover should be <±20% of LLOQ.
2.6.3 Accuracy and precision
Precision and accuracy were expressed as relative standard deviation (RSD) and relative error (RE%, the difference between the average value and the true value of the QC sample), respectively. Precision and accuracy were evaluated by assessing six repeated measurements of the plasma samples at LLOQ, LQC, MQC and HQC on three consecutive days. The RSD and RE value should be <±15%, while the acceptance criteria were ≤±20% for the LLOQ.
2.6.4 Recovery and matrix effect
The extraction recovery and matrix effect of BBR, SVT, FBA, GEM, MET, GMP, NAT, PIO and SIT were assessed in four different samples at the concentration of the LLOQ, LQC, MQC and HQC, respectively. The extraction recovery was calculated by comparing the peak area of the extracted sample to that of the blanks spiked with analytes post-extraction. The matrix effect of the endogenous substance was investigated by comparing the peak areas of the analyte present in the extracted blank plasma with the peak areas of the analyte diluted in UPW.
2.6.5 Stability
The stability of BBR, SVT, FBA, GEM, MET, GMP, NAT, PIO and SIT in beagles’ plasma was carried out by analyzing the beagles QC samples under four different storage conditions, including autosampler stability (at 4 °C, 24 h), short-term stability (room temperature, 12 h), freeze–thaw stability (from −20.0 °C to room temperature, three freeze–thaw cycles) and long-term storage stability (at − 70 °C, 30 days). Meanwhile, the stability of the analytes and IS solutions was also investigated under different conditions.
2.6.6 Dilution integrity
We assessed the dilution integrity by diluting plasma samples greater than the ULOQ with blank plasma to the respective QC levels. The dilution factor was 20:1. The criteria were deemed qualified when the precision and the accuracy were <±1%.
2.7 Procedure
The beagles were randomly divided into four groups with each group comprising four beagles. All the beagles were acclimatized for 14 days with free access to food and water until 12 h before administration of the drugs. The first group was administered mono-BBR tablets (25 mg/kg), mono-SVT tablets (2 mg/kg), mono-GMP tablets (0.2 mg/kg), co-administration of BBR tablets (25 mg/kg) and SVT tablets (2 mg/kg), co-administration of BBR tablets (25 mg/kg) and GMP tablets (0.2 mg/kg), respectively, and the washout period was 7 days, 3 days, 3 days, 7 days and 7 days, respectively. The second group was administered mono-BBR tablets (25 mg/kg), mono-FBT capsules (10 mg/kg), mono-NAT tablets (12 mg/kg), co-administration of BBR tablets (25 mg/kg) and FBT capsules (10 mg/kg) and co-administration of BBR tablets (25 mg/kg) and NAT tablets (12 mg/kg), respectively, and the washout period was 7 days, 7 days, 3 days, 7 days and 7 days, respectively. The third group was administered mono-BBR tablets (25 mg/kg), mono-GEM tablets (15 mg/kg), mono-PIO tablets (1.5 mg/kg), co-administration of BBRe tablets (25 mg/kg) and GEM tablets (15 mg/kg) and co-administration of BBR tablets (15 mg/kg) and PIO tablets (1.5 mg/kg), respectively, and the washout period was 7 days, 3 days, 3 days, 7 days and 7 days, respectively. The fourth group was administered mono-BBR tablets (25 mg/kg), mono-MET tablets (50 mg/kg), mono-SIT tablets (5 mg/kg), co-administration of BBR tablets (25 mg/kg) and MET tablets (50 mg/kg) and co-administration of BBR tablets (15 mg/kg) and SIT tablets (5 mg/kg), respectively, and the washout period was 7 days, 3 days, 7 days, 7 days and 7 days, respectively. Blood samples were collected in heparinized tubes prior to the drug-administration zero time and at 0.25, 0.5, 0.75, 1, 1.5, 2, 3, 4, 6, 8, 12, 24, 48, 72 and 96 h. After centrifugation at 3000 g for 10 min, the supernatant liquid was stored at –70.0 °C until analysis. The pharmacokinetic parameters of all the analytes were calculated by DAS2.1 software supplied by the Pharmacological Society of China. All data were expressed as mean ± standard deviation (mean ± SD), and the differences were considered to be significant when P < 0.05.
3 Results and discussion
3.1 Method optimization
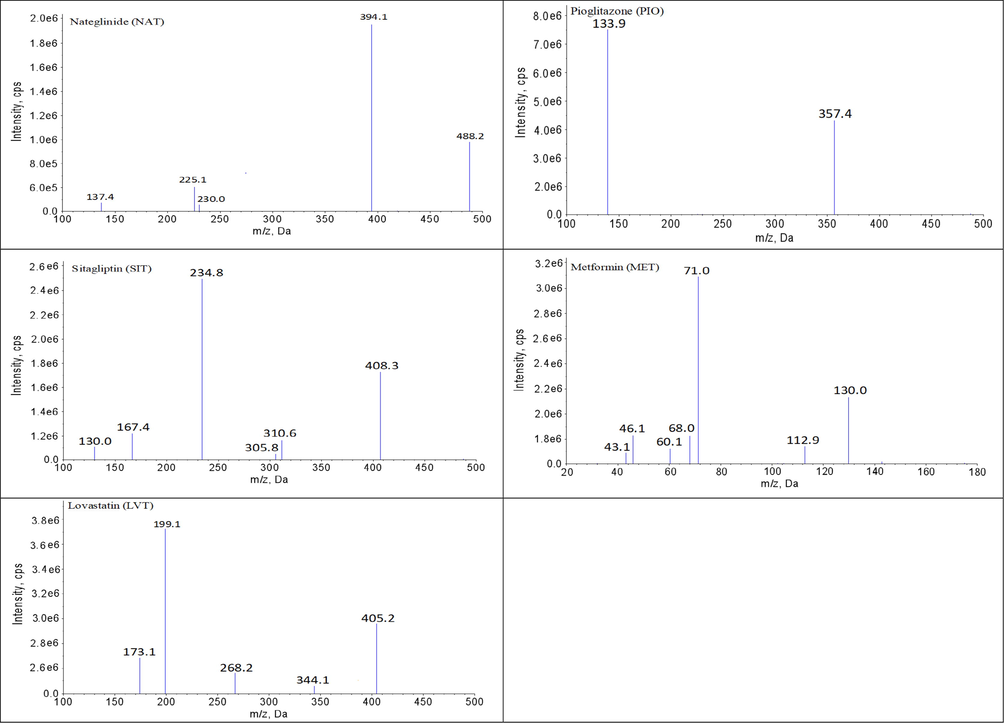
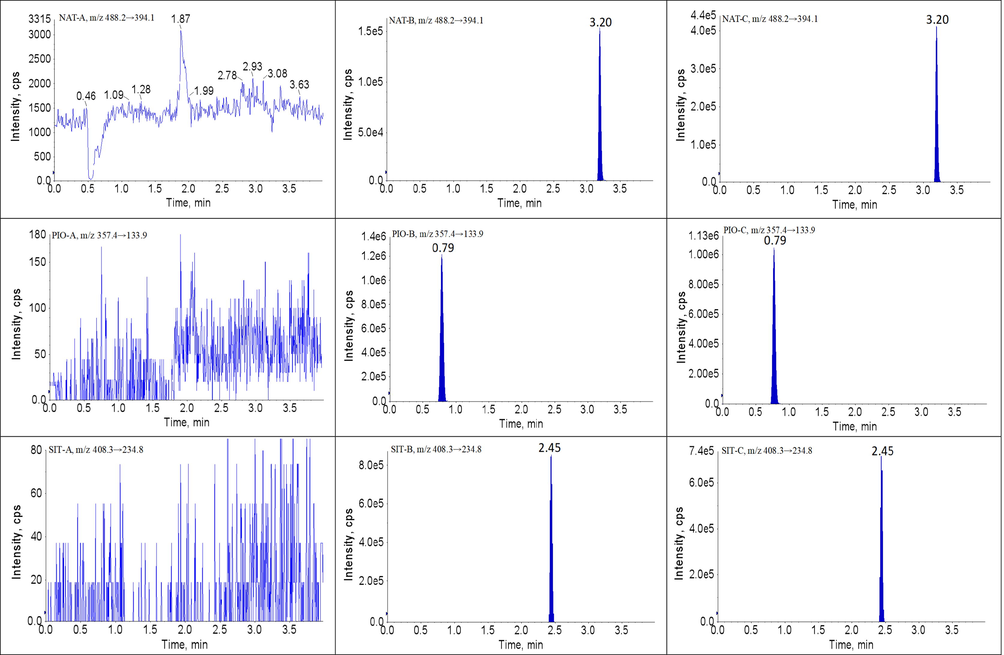
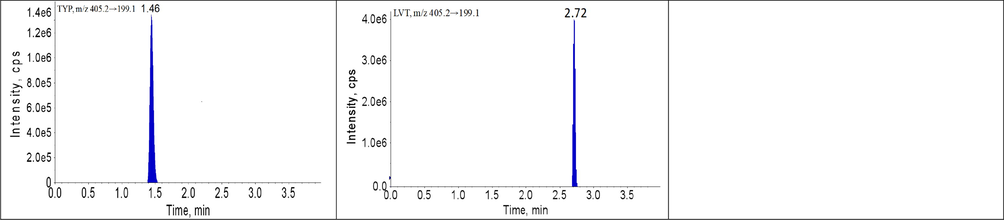
Symmetrical peak shape, suitable retention times and low matrix effects can readily be achieved by optimizing the chromatographic conditions. In this study, chromatographic conditions for the composition of the mobile phase, the selection of additives, the type of the chromatographic column, the flow rate, the column temperature and the elution method, etc. were systematically optimized. Finally, all analytes and IS achieved suitable retention times (within 4 min) and good retention behavior on the Luna® Omega C18 column (20.0 × 2.0 mm, 1.6 μm) maintained at 30 ℃. ACN and gradient elution mode improved the peak shape and shortened the retention time of the chromatographic peaks. Three millimolar of ammonium and 0.1% formic acid contributed to the ionization and response of all the analytes. Under these chromatographic conditions, the retention times of each analyte was as follows: 1.54 min for BBR, 3.11 min for SVT, 1.21 min for GMP, 2.04 min for FBA, 2.24 min for GEM, 0.86 min for MET, 3.76 min for NAT, 0.79 min for PIO and 2.45 min for SIT. Meanwhile, the MS conditions for collision energy, declustering voltage, source temperature, ionization mode, curtain gas, etc. were systematically optimized. The MS parameters, final ion pairs and ion spectra are shown in Table 2 and Fig. 1.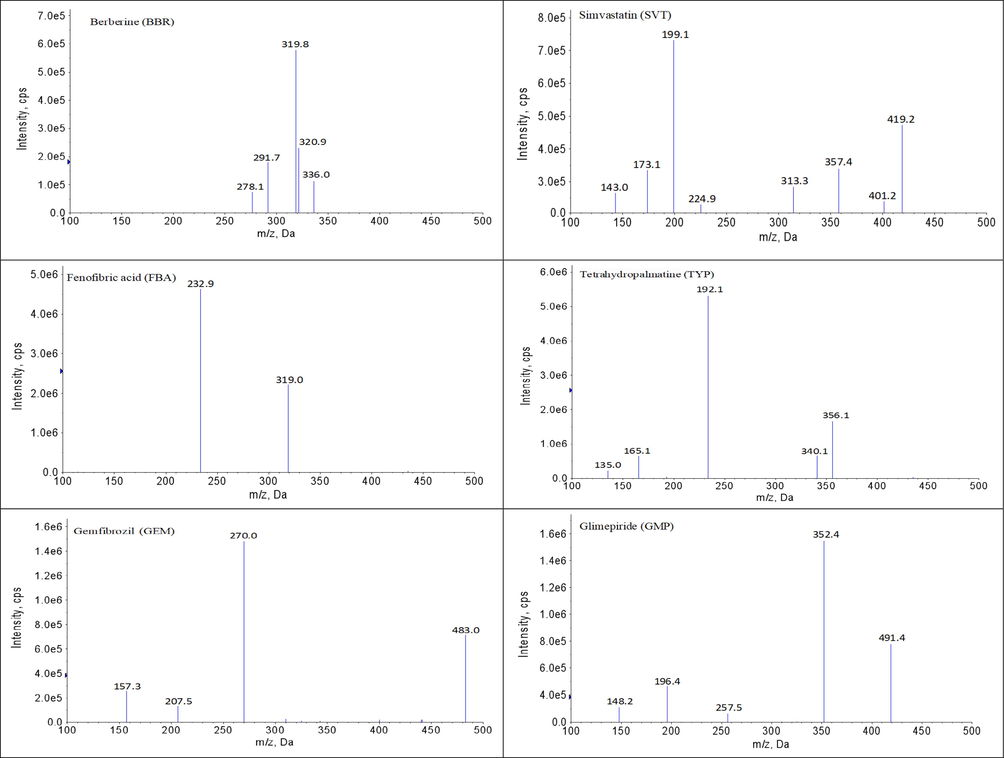
The diagrams of daughter scan of BBR, SVT, FBA, GEM, MET, GMP, NAT, PIO, SIT, TYP and LVT.
The diagrams of daughter scan of BBR, SVT, FBA, GEM, MET, GMP, NAT, PIO, SIT, TYP and LVT.
In terms of the in vivo drug analysis, it was extremely critical to apply appropriate methods to extract drugs and remove interferences from proteins, phospholipids and other endogenous substances prior to the UPLC-MS/MS analysis. In this study, plasma samples were processed using liquid–liquid extraction (LLE), precipitated protein (PP), solid phase extraction (SPE) and mSPE techniques. It was found to be difficult to achieve the desired extraction recovery rate when using LLE due to the variety of drugs and the differences in polarity. In addition, the matrix effect of SVT was not well controlled under the LLE conditions. The main problem faced when the PP method was used was the obvious matrix effect when the number of injections was large, which might have been related to the presence of unprecipitated endogenous substances in the plasma sample. When using the traditional SPE method satisfactory extraction recovery and low matrix effect could be achieved, but the repeatability was poor, resulting in a significant difference in inter-day precision. In contrast, when using the mSPE method, clean, high recovery, low matrix effect and samples with good reproducibility could be achieved. The potential reasons may have been as follows: firstly, magnetic microspheres consisted of a magnetic core and polystyrene-divinylbenzene-pyrrolidone polymer coated on the surface of the core, and the diameter was about 30 μm. The polymer on the surface of the magnetic microspheres had amphiphilic properties and could effectively adsorb drugs of different polarities. Meanwhile, the magnetic microspheres had a large specific surface area because the particle size was only 30 μm, exhibiting a strong adsorption ability to drugs. Secondly, the polymer on the surface of the magnetic microspheres had a large number of pores, and the diameter of the pores was only 8 nm (80 Å), so it would have been difficult for macromolecular substances (proteins, phospholipids, fatty acids, etc.) in the matrix to enter the pores and be adsorbed. Meanwhile, water could remove the water-soluble macromolecules adsorbed on the surface of the mSPE microspheres after the drug in the plasma was absorbed, further reducing the interference of the matrix. Thirdly, the entire mSPE process was carried out in a closed system in addition to adding the activation solvent (MeOH), eluent solution (water), plasma sample and eluent solvent (ACN) to the 96-well plate at once before mSPE. Such an mSPE operation not only saved much time, but also avoided the pollution from organic solvents. Therefore, the mSPE technique was used for the treatment of the plasma samples.
3.2 Method validation
The developed UPLC-MS/MS method were validated using blank plasma from beagles according to the requirements and standards of the Chinese Pharmacopeia guidelines. The results of method validation showed that all items met the standards.
3.2.1 Specificity and crosstalk
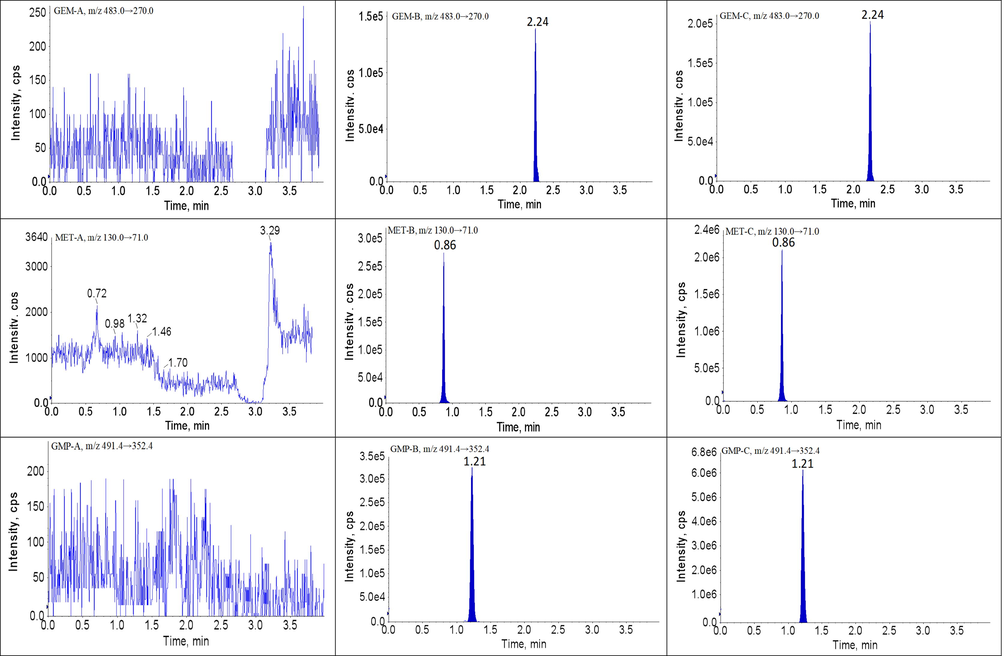
The developed UPLC-MS/MS method showed high selectivity because the blank plasma samples had no obvious interference in the ion channel and the retention times of each analyte and IS. The retention times of BBR, SVT, FBA, GEM, MET, GMP, NAT, PIO and SIT were 1.54, 3.11, 1.21, 2.04, 2.24, 0.86, 3.76, 0.79 and 2.45 min, respectively. The chromatograms of analytes and IS are shown in Fig. 2. Therefore, no obvious exogenous or endogenous interference was observed in this method, and the crosstalk between the analytes and IS was negligible.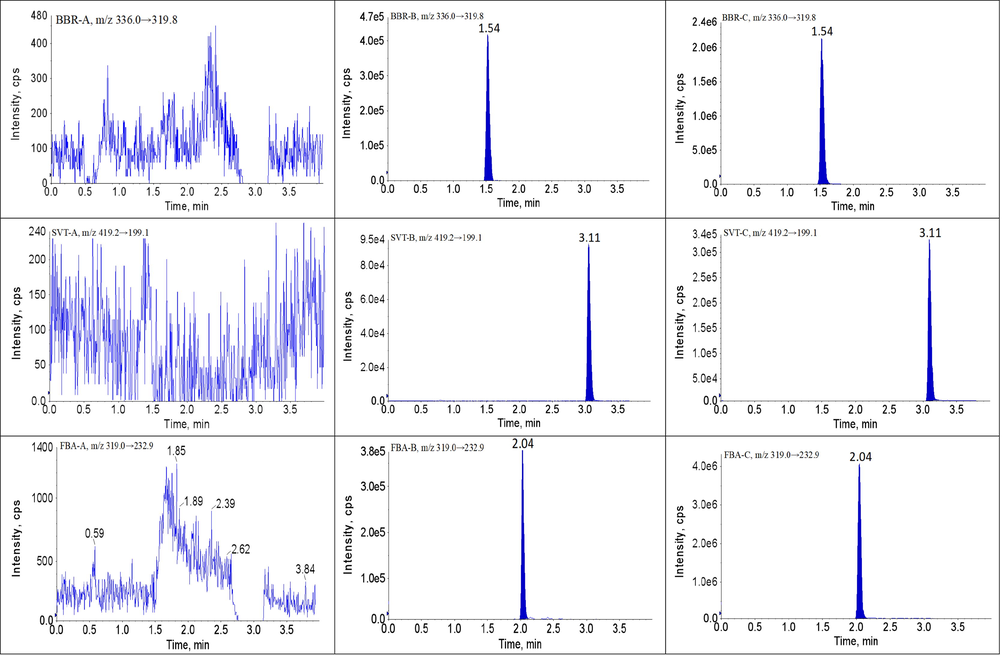
Representative UPLC-MS/MS chromatograms for BBR, SVT, FBA, GEM, MET, GMP, NAT, PIO and SIT in beagles plasma samples: (A) a blank plasma sample; (B) a blank plasma sample spiked with analytes and IS, and (P) a beagles plasma sample.
Representative UPLC-MS/MS chromatograms for BBR, SVT, FBA, GEM, MET, GMP, NAT, PIO and SIT in beagles plasma samples: (A) a blank plasma sample; (B) a blank plasma sample spiked with analytes and IS, and (P) a beagles plasma sample.
Representative UPLC-MS/MS chromatograms for BBR, SVT, FBA, GEM, MET, GMP, NAT, PIO and SIT in beagles plasma samples: (A) a blank plasma sample; (B) a blank plasma sample spiked with analytes and IS, and (P) a beagles plasma sample.
Representative UPLC-MS/MS chromatograms for BBR, SVT, FBA, GEM, MET, GMP, NAT, PIO and SIT in beagles plasma samples: (A) a blank plasma sample; (B) a blank plasma sample spiked with analytes and IS, and (P) a beagles plasma sample.
3.2.2 Linearity and LLOQ
In the plasma from different beagles, good linearity was obtained at concentration ranges of 0.1–250.0 ng/mL for BBR; 0.2–500.0 ng/mL for SVT, GEM and SIT; 1.0–2500.0 ng/mL for GMP, PIO and NAT; 2.0–5000.0 ng/mL for MET; and 10.0–25 000.0 ng/mL for FBA. Typical equations for the calibration curves were as follows: (r = 0.9994, BBR), (r = 0.9992, FBA), (r = 0.9996, SVT), (r = 0.9992, GEM), (r = 0.9987, GMP), (r = 0.9992, MET), (r = 0.9996, NAT), (r = 0.9974, PIO) and (r = 0.9977, SIT). The LLOQ of BBR, SVT, FBA, GEM, MET, GMP, NAT, PIO and SIT was 0.1, 0.2, 10.0, 0.2, 2.0, 1.0, 1.0, 1.0 and 0.2 ng/mL, respectively. No obvious chromatographic peaks were observed in the blank samples in the ion channel and retention time of each analyte and IS after injection of the ULOQ. Thus, no significant carryover effect was observed for this method.
3.2.3 Precision and accuracy
Table 3 shows the intra- and inter-day accuracy and precision for BBR, SVT, FBA, GEM, MET, GMP, NAT, PIO and SIT in three independent runs at three QC concentrations and LLOQ levels. The intra- and inter-day precisions (RSD) were <15% with accuracies in the range of −1.93% to 3.72% for all analytes. Therefore, the current method possessed good precision and accuracy.
Drug
QC concentration (ng/mL)
Inter-day precision (RSD %)
Intra-day precision (RSD %)
Accuracy (RE %)
Recovery (mean ± SD %)
Matrix effect (mean ± SD %)
0.1
7.07
6.44, 6.26, 8.75
3.72
93.29 ± 4.51
97.33 ± 3.76
BBR
0.2
3.60
3.32, 3.18, 4.41
1.86
92.52 ± 3.75
95.04 ± 4.63
5.0
2.44
3.09, 2.13, 1.54
−0.87
96.74 ± 4.82
99.47 ± 4.12
200.0
3.18
4.59, 2.17, 2.88
1.76
93.11 ± 3.44
96.53 ± 4.17
0.2
4.93
5.24, 5.05, 5.35
−0.75
93.37 ± 5.93
95.75 ± 6.82
SVT
0.4
2.70
2.98, 3.24, 1.86
0.24
97.93 ± 3.88
95.63 ± 4.56
10.0
1.22
1.55, 1.06, 0.76
−0.43
93.55 ± 4.42
94.19 ± 5.02
400.0
4.28
3.47, 4.95, 4.89
0.57
93.72 ± 4.24
96.40 ± 3.51
10.0
1.35
0.92, 1.12, 1.59
0.64
95.38 ± 4.22
96.39 ± 4.33
FBA
20.0
2.28
1.75, 2.24, 2.99
0.33
97.87 ± 4.28
96.39 ± 3.72
500.0
3.27
1.79, 4.35, 3.18
−1.93
98.39 ± 3.22
97.44 ± 5.27
20000.0
1.11
0.79, 1.44, 1.28
1.39
95.55 ± 2.77
97.52 ± 5.78
0.2
4.47
5.16, 5.05, 3.75
−1.75
97.31 ± 4.22
95.49 ± 3.54
GEM
0.4
3.87
3.13, 5.98, 2.27
−1.01
95.11 ± 4.03
97.89 ± 4.82
10.0
2.07
1.44, 2.43, 2.53
2.13
96.34 ± 4.44
98.82 ± 3.57
400.0
2.50
0.93, 2.75, 3.18
2.57
94.39 ± 5.22
97.46 ± 4.75
2.0
2.71
3.81, 1.43, 2.54
1.47
99.03 ± 5.11
102.3 ± 4.20
MET
4.0
1.74
1.92, 0.72, 1.96
1.04
98.91 ± 2.34
101.4 ± 4.11
100.0
2.67
2.34, 2.59, 2.98
1.99
94.00 ± 3.57
97.35 ± 4.17
4000.0
1.03
1.15, 0.83, 1.18
0.46
94.26 ± 3.28
97.52 ± 4.79
1.0
8.49
9.41, 8.67, 8.82
5.33
96.39 ± 6.21
92.72 ± 3.41
GMP
2.0
1.66
1.56, 1.43, 1.62
1.56
94.33 ± 4.28
97.31 ± 3.67
50.0
2.20
2.18, 1.19, 3.03
1.44
97.32 ± 4.10
100.7 ± 4.59
2000.0
5.2300
5.44, 4.97, 5.52
1.20
93.29 ± 3.79
96.44 ± 5.18
1.0
3.96
4.92, 3.31, 3.56
2.89
94.44 ± 5.93
98.95 ± 4.88
NAT
2.0
3.19
2.63, 2.96, 3.20
1.28
91.11 ± 4.38
95.22 ± 3.50
50.0
2.65
3.38, 3.06, 1.30
−0.41
91.77 ± 3.76
96.88 ± 3.82
2000.0
3.44
2.45, 2.65, 3.36
2.03
96.38 ± 4.39
99.13 ± 5.20
1.0
3.12
3.49, 2.84, 3.19
1.44
101.5 ± 2.40
95.37 ± 4.52
PIO
2.0
4.47
3.81, 4.92, 5.15
−0.06
99.43 ± 3.47
96.22 ± 3.29
50.0
2.25
2.14, 3.19, 0.69
−1.44
97.52 ± 4.05
99.18 ± 3.24
2000.0
2.51
2.28, 1.65, 2.35
1.19
98.33 ± 2.18
94.37 ± 4.04
0.2
4.43
5.95, 3.75, 3.75
−0.08
95.20 ± 2.53
97.47 ± 4.05
SIT
0.4
3.44
3.51, 3.56, 3.82
2.07
98.24 ± 5.31
96.71 ± 3.59
10.0
2.80
3.51, 2.51, 2.82
2.65
93.60 ± 3.59
98.32 ± 4.17
400.0
2.51
2.45, 2.20, 3.18
1.89
99.36 ± 4.10
102.4 ± 3.88
TYP
20.0
2.31
2.26, 2.39, 2.59
−0.49
97.26 ± 5.28
95.39 ± 2.14
LVT
50.0
3.02
3.10, 3.33, 3.21
0.50
94.44 ± 3.38
97.37 ± 4.15
3.2.4 Recovery and matrix effect
The percentage recoveries of BBR, SVT, FBA, GEM, MET, GMP, NAT, PIO and SIT ranged from 92.52−96.74%, 93.37−97.93%, 95.38−98.39%, 94.39−97.31%, 94.00−99.03%, 93.29−97.32%, 91.11−96.38%, 97.52−101.5% and 93.60−99.36%, respectively. The percentage recoveries of all the IS ranged from 94.44−97.26%. The matrix effect were 95.04−99.47% for BBR, 94.19−96.40% for SVT, 92.72−100.7% for GMP, 96.39−97.52% for FBA, 95.49−98.82% for GEM, 97.35−102.32% for MET, 95.22−99.13% for NAT, 94.37−99.18% for PIO and 96.71−102.4% for SIT, respectively. The matrix effects for all the IS ranged from 95.39−97.37%. The results are shown in Table 3. These data suggested that there was no obvious matrix effect interfering with the detection of analytes and IS in the plasma from the beagles.
3.2.5 Stability
Table 4 summarizes the stability data of BBR, SVT, GMP, FBA, GEM, MET, NAT, PIO and SIT in beagles’ plasma at the LQC, MQC and HQC levels after storage. BBR, SVT, FBA, GEM, MET, GMP, NAT, PIO and SIT were found to be stable in the beagles’ plasma under four different storage conditions. Meanwhile, we found that the differences of stability of BBR, SVT, FBA, GEM, MET, GMP, NAT, PIO and SIT between groups under various storage conditions were not statistically significant.
Drug
QC concentration (ng/mL)
Room temperature
−70 °C for 30 days
Freeze-thaw cycles
Autosampler stability
Dilution integrity
10-fold
20-fold
0.200
0.21 ± 0.0047
0.21 ± 0.0063
0.20 ± 0.0038
0.21 ± 0.0074
–
–
BBR
5.00
5.07 ± 0.28
5.11 ± 0.34
5.18 ± 0.29
4.87 ± 0.38
–
–
200.00
191.35 ± 5.43
201.74 ± 3.93
205.66 ± 9.57
211.78 ± 7.77
193.42 ± 6.86
197.56 ± 3.85
0.400
0.41 ± 0.018
0.41 ± 0.022
0.39 ± 0.024
0.39 ± 0.017
–
–
SVT
10.00
10.11 ± 0.12
10.18 ± 0.12
10.21 ± 0.034
10.19 ± 0.023
–
–
400.00
389.23 ± 11.78
394.34 ± 6.35
404.18 ± 7.26
406.89 ± 10.34
408.63 ± 5.72
396.22 ± 6.71
20.00
19.86 ± 0.47
20.31 ± 0.75
19.94 ± 0.40
20.32 ± 0.69
–
–
FBA
500.00
484.03 ± 15.86
491.33 ± 5.86
494.28 ± 4.73
502.03 ± 12.53
–
–
20000.00
20556.31 ± 957.34
20727.11 ± 678.45
19661.67 ± 622.70
19547.89 ± 522.48
19492.92 ± 478.63
20649.62 ± 509.22
0.400
0.42 ± 0.021
0.41 ± 0.019
0.40 ± 0.009
0.41 ± 0.016
–
–
GEM
10.00
10.25 ± 0.058
10.05 ± 0.033
10.30 ± 0.10
10.41 ± 0.11
–
–
400.00
406.37 ± 14.79
409.32 ± 9.94
405.28 ± 7.51
403.04 ± 4.36
391.02 ± 5.20
396.18 ± 4.97
4.00
4.09 ± 0.36
2.21 ± 0.60
4.46 ± 0.53
4.15 ± 0.22
–
–
MET
100.00
102.82 ± 6.44
104.73 ± 4.89
100.67 ± 1.20
99.32 ± 0.58
–
–
4000.00
4022.64 ± 112.2
4052.27 ± 62.37
4036.19 ± 43.01
4022.38 ± 48.36
4013.89 ± 58.88
3988.11 ± 60.53
2.00
2.04 ± 0.14
2.08 ± 0.11
2.11 ± 0.10
2.00 ± 0.07
–
–
GMP
50.00
48.50 ± 1.53
49.23 ± 0.49
50.23 ± 1.59
50.93 ± 1.10
–
–
2000.00
2092.42 ± 24.95
2034.78 ± 48.31
2021.51 ± 68.99
1956.45 ± 93.87
1989.89 ± 87.88
2011.67 ± 79.15
2.00
2.07 ± 0.09
2.11 ± 0.12
2.06 ± 0.10
1.89 ± 0.11
–
–
NAT
50.00
49.93 ± 1.99
49.30 ± 1.47
50.05 ± 1.18
50.87 ± 1.98
–
–
2000.00
1941.63 ± 43.84
2040.89 ± 155.24
2111.40 ± 100.33
2063.56 ± 43.10
2033.89 ± 76.92
1959.33 ± 57.24
2.00
1.99 ± 0.082
1.95 ± 0.093
2.07 ± 0.062
2.12 ± 0.11
–
–
PIO
50.00
49.84 ± 1.53
50.47 ± 1.89
50.06 ± 1.90
50.16 ± 1.77
–
–
2000.00
2089.28 ± 27.09
2049.57 ± 60.84
2003.88 ± 93.84
1983.83 ± 62.01
1968.34 ± 41.59
2039.48 ± 47.80
0.40
0.42 ± 0.025
0.41 ± 0.026
0.41 ± 0.022
0.41 ± 0.016
–
–
SIT
10.00
10.36 ± 0.13
9.63 ± 0.67
9.89 ± 0.26
10.19 ± 0.32
–
–
400.00
392.93 ± 5.73
405.67 ± 12.39
409.72 ± 5.36
407.09 ± 9.88
396.78 ± 12.52
388.42 ± 5.72
TYP
20.00
19.56 ± 0.46
20.87 ± 0.73
20.34 ± 0.53
19.48 ± 0.56
–
–
LVT
50.00
49.62 ± 0.96
50.76 ± 1.97
49.54 ± 2.62
49.68 ± 1.69
–
–
3.2.6 Dilution integrity
Dilution integrity was assessed by diluting plasma samples higher than the ULOQ with blank plasma to the respective QC levels, and the results are shown in Table 4. The precision ranged from 3.17−4.62%, which was less than the criteria of ±15%. Therefore, plasma samples with a concentration higher than ULOQ could be diluted with blank plasma from the beagles before analysis.
3.3 Pharmacokinetic analysis
Pharmacokinetic DDI between BBR and SVT, GMP, FBT, GEM, MET, NAT, PIO and SIT in beagles was investigated in this study by applying the developed UPLC-MS/MS method, and the corresponding plasma concentration–time curves and the pharmacokinetic parameters are shown in Fig. 3, Fig. 4,Table 5 and Table 6. AUC, area under the plasma concentration–time curve; CL, apparent plasma clearance; Cmax, maximum plasma concentration; t1/2, elimination half-life; Tmax, time to Cmax. AUC, area under the plasma concentration–time curve; CL, apparent plasma clearance; Cmax, maximum plasma concentration; t1/2, elimination half-life; Tmax, time to Cmax.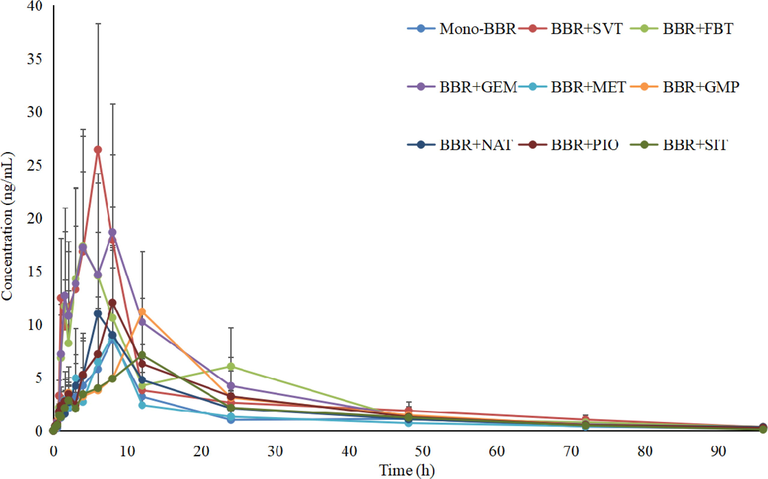
Mean plasma concentration profiles of BBR in beagles plasma after oral administration of BBR with and without co-administration of SVT, FBT, GEM, MET, GMP, NAT, PIO and SIT (n = 4).
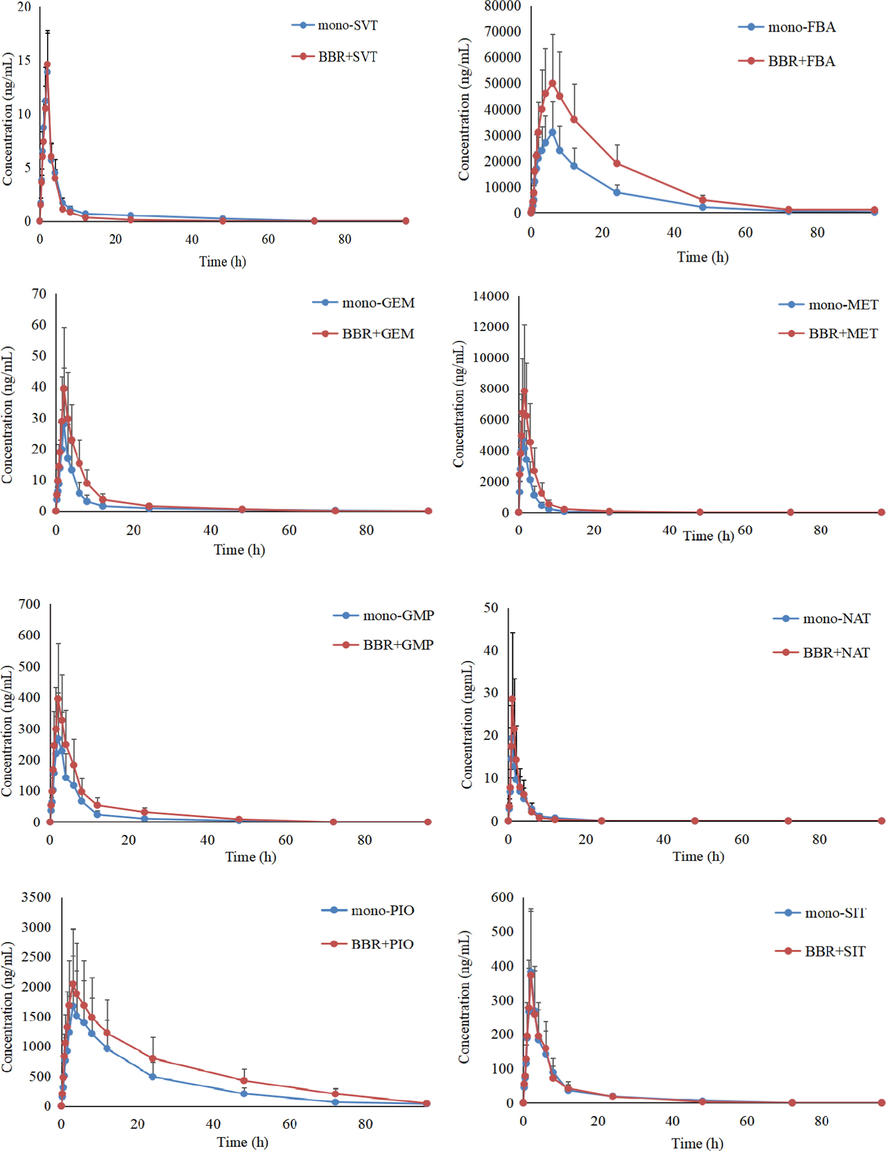
Mean plasma concentration profiles of SVT, FBT, GEM, MET, GMP, NAT, PIO and SIT in beagles plasma after oral administration of BBR with co-administration of SVT, FBT, GEM, MET, GMP, NAT, PIO and SIT (n = 4).
PK parameters
AUC(0-t) (μg/Lh)
AUC(0-∞)(μg/Lh)
CL (L/h)
Cmax (μg/L)
t1/2 (h)
Tmax (h)
Mono-BBR
42.93 ± 32.31
47.58 ± 34.29
5977.53 ± 4657.26
8.77 ± 6.91
20.02 ± 7.95
8.83 ± 8.54
BBR + SVT
147.81 ± 78.23*
152.13 ± 81.48*
2364.15 ± 2037.67*
27.14 ± 17.42*
21.39 ± 8.33
6.73 ± 4.28
BBR + FBA
114.85 ± 54.32*
118.47 ± 46.91*
2978.94 ± 1888.27*
19.52 ± 13.44*
29.46 ± 10.38*
4.39 ± 5.20*
BBR + GEM
117.26 ± 62.97*
122.65 ± 69.44*
3248.10 ± 2264.72*
19.37 ± 12.46*
18.60 ± 9.99
8.52 ± 4.37
BBR + MET
58.25 ± 38.42
60.98 ± 39.44
4957.08 ± 4793.41
8.41 ± 8.62
17.83 ± 8.05
9.89 ± 9.17
BBR + GMP
45.77 ± 29.86
49.26 ± 31.55
6271.49 ± 4253.16
7.79 ± 6.61
17.94 ± 8.23
10.39 ± 7.67
BBR + NAT
57.00 ± 38.92
59.51 ± 37.65
5410.53 ± 3998.14
9.88 ± 9.14
16.59 ± 8.70
7.94 ± 8.61
BBR + PIO
78.69 ± 39.90*
80.22 ± 38.49*
4524.99 ± 3246.75
12.04 ± 8.17
18.81 ± 9.42
8.55 ± 6.01
BBR + SIT
47.97 ± 36.48
53.11 ± 35.70
5781.29 ± 063.63
6.05 ± 5.22
21.58 ± 4.84
10.66 ± 7.47
PK parameters
AUC(0-t) (μg/Lh)
AUC(0-∞)(μg/Lh)
CL (L/h)
Cmax (μg/L)
t1/2 (h)
Tmax (h)
Mono-SVT
34.73 ± 14.27
36.11 ± 12.75
1936.32 ± 1082.65
10.26 ± 6.44
3.47 ± 1.52
1.58 ± 0.92
SVT + BBR
31.64 ± 16.77
33.19 ± 15.75
1793.53 ± 1146.82
9.55 ± 5.74
3.89 ± 1.76
1.52 ± 0.85
FBA
204738.47 ± 102385.32
221738.29 ± 89473.55
1.45 ± 0.36
18372.43 ± 3627.91
20.68 ± 8.66
5.22 ± 3.16
FBA + BBR
387826.44 ± 182167.37*
406682.19 ± 190472.55*
1.05 ± 0.22
33673.79 ± 7054.81*
17.84 ± 5.03
4.97 ± 2.70
GEM
127.87 ± 37.43
130.25 ± 41.66
6.29 ± 2.53
27.75 ± 10.24
1.88 ± 0.76
2.14 ± 0.62
GEM + BBR
217.86 ± 78.61*
224.97 ± 75.18*
4.75 ± 1.74
39.33 ± 14.62*
2.03 ± 0.54
2.28 ± 0.75
MET
24731.99 ± 2963.61
25674.28 ± 3116.03
1.53 ± 0.42
7627.45 ± 871.08
7.97 ± 1.22
1.25 ± 0.91
MET + BBR
13829.66 ± 1573.42*
14271.89 ± 1468.94*
1.78 ± 0.57
4070.49 ± 422.31*
8.25 ± 0.97
1.07 ± 0.66
GMP
2178.34 ± 696.71
2289.53 ± 767.67
1.74 ± 0.43
267.53 ± 46.69
4.67 ± 0.96
2.14 ± 0.75
GMP + BBR
3916.74 ± 1028.55*
4029.38 ± 1120.29*
1.23 ± 0.37
397.58 ± 65.11*
4.94 ± 1.13
2.28 ± 0.87
NAT
47.28 ± 6.49
49.57 ± 6.35
0.98 ± 0.37
18.85 ± 4.19
1.76 ± 0.37
1.09 ± 0.42
NAT + BBR
74.65 ± 16.73*
76.57 ± 17.32*
0.76 ± 0.47
26.57 ± 6.89
2.04 ± 0.49
1.20 ± 0.48
PIO
11462.77 ± 3975.36
12538.94 ± 4257.22
2.42 ± 1.53
1667.89 ± 414.77
5.82 ± 2.11
2.88 ± 1.20
PIO + BBR
16937.42 ± 4542.36*
17692.50 ± 4673.36*
1.97 ± 1.22
1988.33 ± 641.23
5.98 ± 1.82
2.76 ± 1.33
SIT
2847.12 ± 747.44
3148.59 ± 1065.33
163.26 ± 47.85
382.11 ± 136.93
7.14 ± 2.65
1.88 ± 0.93
SIT + BBR
2937.22 ± 804.28
3162.49 ± 971.31
155.84 ± 57.99
371.27 ± 157.85
7.01 ± 3.04
1.97 ± 1.09
Firstly, the AUC0-t and Cmax of BBR in the presence of SVT, FBA, PIO and GEM were significantly higher (3.2-fold and 3.1-fold, 2.5-fold and 2.2-fold, 1.7-fold and 1.4-fold, and 2.6-fold and 2.2-fold) than the mono-BBR group, and the CLz of BBR was lower (2.5-fold, 2.0-fold, 1.3-fold and 1.8-fold, respectively) than the mono-BBR group, suggesting that SVT, FBT, PIO and GEM may have an effect on the in vivo pharmacokinetics of BBR. It is known that BBR is mainly metabolized by CYP12A, CYP2D6 and CYP3A4 into a variety of metabolites in the liver. Meanwhile, BBR was a high-affinity substrate for P-gp. So concomitant use of any potent inducer, inhibitor or competitive substrate of CYP12A, CYP2D6, CYP3A4 and P-gp with BBR may change its in vivo exposure. In terms of SVT, although it was a substrate of CYP3A4, studies had shown that it can inhibit the activity of CYP3A4 (Subrata et al., 2017). For FBT, its metabolism was related to CYP3A4 and glucuronic acid conjugation. Coincidentally, the metabolism of BBR also involved glucuronic acid conjugation and CYP3A4. The competition in the metabolism significantly reduced the metabolic rate of BBR and FBT, resulting in an increase in the bioavailability of BBR and FBT (Stephen et al., 2018). GEM had a significant inhibitory effect on organic anion transporting polypeptide 2. At the same time, GEM and its metabolites can reduce the phase II metabolism of other drugs by inhibiting the activity of UDP -glucuronosyltransferase (Takeshi, Yuito & Ichiro, 2020). While the liver uptake of BBR was mainly mediated by organic anion transporters and organic cation transporters(OCT). Therefore, the AUC0-t and Cmax of BBR was increased in comparison with the mono-BBR group when BBR and GEM were co-administered. For PIO, studies had shown that low concentrations of pioglitazone could slightly inhibit the activities of CYP3A4 and CYP2D6, while high concentrations of pioglitazone could induce the activity of CYP3A4 (U.S. Food and Drug Administration, 2018). It has been demonstrated that the effect of PIO on metabolic enzymes was related to its plasma concentration. In this study, the effect of PIO on the pharmacokinetics of BBR might be a comprehensive result of induction and inhibition, so the change of the pharmacokinetics of BBR was lowest when compared with SVT, FBT and GEM.
Secondly, co-administration of MET, NAT, GMP and SIT did not significantly affect the pharmacokinetics of BBR because these drugs had no obvious inhibitory effect and inductive effect on the metabolic enzymes and transporters of BBR.
Thirdly, BBR could increase the AUC0-t and the Cmax and reduce the CLz of FBT, GMP, GEM, NAT and PIO when FBT, GMP, GEM, NAT and PIO were co-administered. Studies had shown that BBR had a significant inhibitory effect on p-gp, CYP2D6 and CYP2C9, and could significantly increase the bioavailability of combined cyclosporin, digoxin, losartan and nebivolol, which was consistent with our results (Liu et al., 2015; Wang et al., 2017). For example, GMP was mainly metabolized by CYP2C9 in the liver. GEM was mainly metabolized by CYP2C9, CYP1A2 and CYP2C19. PIO was a substrate of CYP3A4, CYP2C8 and CYP2C9, of which CYP2C8 accounts for about 70% of the total (Xin et al., 2016). Although the metabolic enzymes of NAT including CYP2C9, CYP3A4 and CYP2D6, the effect of OCT-mediated liver uptake on its pharmacokinetics was more obvious. Therefore, BBR had the greatest influence on the pharmacokinetics of GMP and GEM, followed by NAT, and PIO was the smallest. In contrast, the AUC0-t and Cmax of MET in the presence of BBR were significantly lower (1.8-fold and 1.9-fold) than the mono-METn group. The in vivo process of metformin was mainly mediated by the OCT, such as OCT1, OCT2, OCT3. Shi et al. reported that BBR had a significant inhibitory effect on OCT and multidrug and toxin extrusion 1 (Xu et al., 2021). Thus, BBR could inhibit the OCT-mediated transport of MET, including gastrointestinal absorption and liver uptake, especially for gastrointestinal absorption because the concentration of BBR in the gastrointestinal tract was much higher than that in the blood. Then, BBR decreased the AUC0-t and Cmax of MET.
Finally, SIT was mainly excreted in the urine as a precurser, and metabolism was a secondary route (CYP2C8 and CYP3A4) (Zhou et al., 2021). SVT was mainly metabolized by CYP3A4. While BBR had no obvious inhibitory effect and inductive effect on CYP2C8 and CYP3A4, BBR did not significantly affect the pharmacokinetics of SIT and SVT.
The research carried out in this article had the following characteristics: (1) The established UPLC-MS/MS method could detect BBR, SVT, GMP, FBA, GEM, MET, NAT, PIO and SIT simultaneously, which laid a solid foundation for the research on the pharmacokinetics, bioequivalence, and tolerance of BBR, SVT, GMP, FBA, GEM, MET, NAT, PIO and SIT; (2) This study more comprehensively investigated the DDI between BBR and a variety of clinically commonly used hypoglycemic drugs and lipid-lowering drugs, including statins, fibrates, biguanides, sulfonylureas, DPP-4 inhibitors, and thiazolidinedione and so on. The fluctuation of plasma drug concentration is closely related to DDI, especially DDI based on the pharmacokinetics of metabolic enzymes and transporters. Therefore, a systematic study of the DDI between BBR and other clinically commonly used hypoglycemic drugs and lipid-lowering drugs helped to improve the rationality of clinical medication, thereby improving the efficacy and reducing toxic side effects. (3) The advanced plasma sample processing method greatly improved the applicability of the established UPLC-MS/MS method. mSPE technology had more advantages than traditional precipitated proteins in processing plasma samples, including the improvement of cleanliness and the reduction of matrix effect. Meanwhile, the entire plasma sample extraction process was carried out in an automatic mSPE equipment, avoiding vortexing and centrifugation, which greatly simplifies the operation process. For example, the matrix effect of SVT significantly interfered with the determination of SVT and its metabolite lovastatin. The mSPE technology could effectively reduce or remove the matrix effect of SVT, thereby improving the accuracy of the results. All in all, it had important clinical significance to investigate the DDI between BBR and SVT, GMP, FBA, GEM, MET, NAT, PIO, and SIT.
4 Conclusions
In this paper, an UPLC-MS/MS method was developed and validated to study the DDI between BBR and SVT, FBT, GEM, MET, GMP, NAT, PIO and SIT in beagles. This UPLC-MS/MS method had the characteristics of high sensitivity, strong specificity, good stability and short retention times. The results showed that SVT, FBA, PIO and GEM could increase the AUC0-t and Cmax of BBR, especially for SVT and FBA. We also found that BBR could increase the AUC0-t and Cmax and reduce the CLz of FBT, GMP, NAT and PIO. In addition, the AUC0-t and Cmax of MET, in the presence of BBR, were significantly lower than the mono-MET group. The study demonstrated that the potential DDI between BBR and SVT, FBT, GEM, MET, GMP, NAT, PIO, and SIT could occur, especially for SVT, FBT, GEM and GMP. The information obtained from this paper was useful to evaluate co-administration of BBR and SVT, FBT, GEM, MET, GMP, NAT, PIO and SIT as therapeutic agents for hyperlipidemia and hyperglycemia.
Acknowledgments
This study was supported by the Natural Fund of Liaoning Province (20180550266) and the 345 Talent Project of Shengjing Hospital of China Medical University. We thank International Science Editing for editing this manuscript (http://www.internationalscienceediting.com).
Declaration of Competing Interest
The authors declare that they have no known competing financial interests or personal relationships that could have appeared to influence the work reported in this paper.
References
- CYP2C metabolism of oral antidiabetic drugs–impact on pharmacokinetics, drug interactions and pharmacogenetic aspects. Expert. Opin. Drug. Metab. Toxicol.. 2012;8(12):1549-1563.
- [Google Scholar]
- Muscle-related side-effects of statins: from mechanisms to evidence-based solutions. Curr. Opin. Lipidol.. 2015;26(3):221-227.
- [Google Scholar]
- Benefits and risks of the treatment with fibrates–a comprehensive summary. Expert. Rev. Clin. Pharmacol.. 2018;11(11):1099-1112.
- [Google Scholar]
- Displacement of bilirubin from albumin by berberine. Biol. Neonate.. 1993;63:201-208.
- [Google Scholar]
- A rapid LC-MS/MS method for simultaneous determination of quetiapine and duloxetine in rat plasma and its application to pharmacokinetic interaction study. J. Food. Drug. Anal.. 2019;27(1):323-331.
- [Google Scholar]
- After another decade: LC-MS/MS became routine in clinical diagnostics. Clin. Biochem. 2020;82:2-11.
- [Google Scholar]
- The enhancement of cardiotoxicity that results from inhibiton of CYP 3A4 activity and hERG channel by berberine in combination with statins. Chem. Biol. Interact.. 2018;293:115-123.
- [Google Scholar]
- Berberine in cardiovascular and metabolic diseases: from mechanisms to therapeutics. Theranostics.. 2019;9(7):1923-1951.
- [Google Scholar]
- Should side effects influence the selection of antidiabetic therapies in type 2 diabetes? Curr, Diab, Rep.. 2017;17(4):21.
- [Google Scholar]
- Interaction between fibrates and statins–metabolic interactions with gemfibrozil. Drug. Metabol. Drug. Interact.. 2003;19(3):161-176.
- [Google Scholar]
- Quasi-irreversible inhibition of CYP2D6 by berberine. Pharmaceutics. 2020;12(10):916.
- [Google Scholar]
- Berberine: a promising natural isoquinoline alkaloid for the development of hypolipidemic drugs. Curr. Top. Med. Chem.. 2020;20(28):2634-2647.
- [Google Scholar]
- Development and application of a UPLC-MS/MS method for simultaneous determination of fenofibric acid and berberine in rat plasma: application to the drug-drug pharmacokinetic interaction study of fenofibrate combined with berberine after oral administration in rats. Biomed. Chromatogr.. 2016;30(7):1075-1082.
- [Google Scholar]
- Effects of berberine on the pharmacokinetics of losartan and its metabolite EXP3174 in rats and its mechanism. Pharm. Biol.. 2016;54(12):2886-2894.
- [Google Scholar]
- Validated UPLC-MS/MS method for simultaneous determination of simvastatin, simvastatin hydroxy acid and berberine in rat plasma: application to the drug-drug pharmacokinetic interaction study of simvastatin combined with berberine after oral administration in rats. J. Chromatogr. B. Analyt. Technol. Biomed. Life. Sci.. 2015;1006:8-15.
- [Google Scholar]
- Emerging clinical importance of hepatic organic cation transporter 1 (OCT1) in drug pharmacokinetics, dynamics, pharmacogenetic variability, and drug interactions. Clin. Pharmacol. Ther.. 2018;103(5):758-760.
- [Google Scholar]
- An assessment of pharmacokinetic interaction between lobeglitazone and sitagliptin after multiple oral administrations in healthy men. Clin. Ther.. 2020;42(6):1047-1057.
- [Google Scholar]
- National Pharmacopoeia Commission, 2020. The Pharmacopoeia of the People’s Republic of China [S]. Four. Beijing: China Medical Science and Technology Press, pp. 466.
- Ultra-performance liquid chromatography-tandem mass spectrometry for simultaneous determination of antipsychotic drugs in human plasma and its application in therapeutic drug monitoring. Drug. Des. Devel. Ther.. 2021;15:463-479.
- [Google Scholar]
- Effect of berberine on the pharmacokinetics of substrates of CYP3A and P-gp. Phytother. Res.. 2009;23(11):1553-1558.
- [Google Scholar]
- Organic cation transporter and multidrug and toxin extrusion 1 co-mediated interaction between metformin and berberine. Eur. J. Pharm. Sci.. 2019;127:282-290.
- [Google Scholar]
- Evaluation of herb-drug interaction of a polyherbal Ayurvedic formulation through high throughput cytochrome P450 enzyme inhibition assay. J. Ethnopharmacol.. 2017;197:165-172.
- [Google Scholar]
- The drug interaction potential of daprodustat when coadministered with pioglitazone, rosuvastatin, or trimethoprim in healthy subjects. Pharmacol Res Perspect. 2018;6(2)
- [Google Scholar]
- An updated review of pharmacokinetic drug interactions and pharmacogenetics of statins. Expert. Opin. Drug. Metab. Toxicol.. 2020;16(9):809-822.
- [Google Scholar]
- U.S. Food and Drug Administration, 2018. Bioanalytical Method Validation. Guidance for Industry.
- The metabolism of berberine and its contribution to the pharmacological effects. Drug. Metab. Rev.. 2017;49(2):139-157.
- [Google Scholar]
- Effects of berberine on pharmacokinetics of midazolam and rhodamine 123 in rats in vivo. Springerplus. 2016;5:380.
- [Google Scholar]
- Therapeutic effect of berberine on metabolic diseases: both pharmacological data and clinical evidence. Biomed. Pharmacother. 2021:110984.
- [Google Scholar]
- The enhancement of cardiac toxicity by concomitant administration of Berberine and macrolides. Eu.r J. Pharm. Sci.. 2018;76:149-155.
- [Google Scholar]
- The pharmacological activity of berberine, a review for liver protection. Eur. J. Pharmacol.. 2021;890:173655.
- [Google Scholar]


