

Translate this page into:
The effect of novel 3R,6R-bis (4-hydroxy benzyl) piperazine-2,5-dione (BHBPPD) derivatives on the expression of caspases in gastric cancer: A molecular docking and dynamics simulation
⁎Corresponding author. ehsanheidari2012@yahoo.com (Ehsan Heidari Soureshjani),
-
Received: ,
Accepted: ,
This article was originally published by Elsevier and was migrated to Scientific Scholar after the change of Publisher.
Peer review under responsibility of King Saud University.
Abstract
2,5-Diketopiperazines show remarkable pharmaceutical potential. Growing cancer cases drive novel drug research, focusing on synthesizing an anticancer agent for gastric cells.
The investigation centered on the effects of 3R,6R-bis (4-hydroxy benzyl) piperazine-2,5-dione (BHBPPD) on gastric cancer cells, with a specific emphasis on its role in inducing apoptosis. The study involved measuring of critical caspase expression levels, pivotal components of the apoptotic pathway. Utilizing geo-analysis, the research delved into the examination of the GSE4651 and GSE10262 datasets of to gastric cancer cells, intending to identify shared factors linked to the caspase activation pathway.
Employing molecular docking techniques, the binding energy of the BHBPPD compound with the identified factors was calculated, facilitating the determination of its primary target. Subsequent simulations were carried out for CYCS and TNFRSF10B, which displayed the highest number of connections. The integration of bioinformatics analysis revealed that BHBPPD exhibited the most favorable binding energy towards TNFRSF10B and CYCS, thereby enhancing the structural stability of these proteins. Notably, this augmented strength of TNFRSF10B resulted in heightened interactions with other pertinent factors, consequently leading to an increased propensity for apoptosis.
These findings collectively highlight the potential of the synthesized product, BHBPPD, as a good candidate for targeted anticancer therapy. These findings collectively underline the potential of the synthesized derivative, BHBPPD, as a promising candidate for targeted anticancer therapy.
Keywords
2,5-diketopiperazine
3,6-bis (4-hydroxy benzyl)-piperazine-2,5-dione
α-chymotrypsin
Gastric cancer
Cytotoxicity
TNFRSF10B
CYCS

1 Introduction
Cancer ranks as the second leading global cause of death. In 2018, it accounted for an estimated 9.6 million deaths worldwide(Ali, Saleem, Aboul-Enein, & Rather, 2011; Bray et al., 2018; Lu, Lu, Xu, & Ding, 2015; Siegel, Miller, & Jemal, 2015). Approximately one in four global deaths can be attributed to cancer. Developing effective and practical strategies for cancer therapy remains a formidable challenge, despite substantial research efforts. Surgical procedures, radiotherapy, immunotherapy, and chemotherapy employing anticancer agents have emerged as promising options for cancer treatment (Azizmohammadi et al., 2013).
The economic impact of cancer is significant, with the estimated cost of managing 13.3 million new cancer cases in 2010 approaching nearly US$ 290 billion. Projections indicate that by 2030, this total cost will escalate to US$ 458 billion, as documented by the 2011 World Economic Forum report. Non-industrialized nations bear the brunt of around 70% of cancer-related fatalities (Aghajanpour et al., 2017).
The quest for new anticancer agents has long been a dynamic medical field, with notable attention on natural products for their potential to minimize side effects(Salvador et al., 2013). However, the rise of drug resistance mechanisms against existing anticancer treatments is becoming more pronounced. This underscores the urgent necessity to innovate and uncover novel, selective, efficient, and less toxic anticancer medications (Farhadian et al., 2019; Walayat, MOHSIN, Aslam, & Ahmad, 2019; Zhu, Chen, Dong, Li, & Liu, 2014).
In diverse cancer treatment approaches, the focus is on targeting and eliminating cancer cells. Nevertheless, this process often leads to collateral damage to healthy cells, resulting in a spectrum of side effects. These adverse effects encompass fatigue, flu-like symptoms, anemia, clotting irregularities, neutropenia, inflammation, secondary cancers, and complications in kidney, bladder, and gastrointestinal functions, as well as weight loss (Boivin, 1990; Nurgali, Jagoe, & Abalo, 2018).
The piperazine ring system, a vital nitrogen-containing heterocyclic structure, plays a pivotal role in synthesizing diverse drug compounds (Walayat et al., 2019). 2,5-Diketopiperazine (DKP), a fundamental cyclodipeptide, is present in numerous natural products and often biosynthesized by various amino acid species (Cornacchia et al., 2012). While primarily sourced from natural resources, their structural simplicity enables artificial synthesis (Fischer, 2003). DKPs possess desirable chemical traits, rendering them apt for drug design (Cornacchia et al., 2012; Yang et al., 2017; Zhang, Du, Wang, Chen, & Wang, 2017). They exhibit anticancer, antidepressant, antiviral, antimalarial, antifungal, antibacterial, alpha-adrenoceptor antagonist, cytotoxic, and antihyperglycemic properties (Martins & Carvalho, 2007; McCleland et al., 2004; Zhang et al., 2017). Given these biological and chemical attributes, DKPs have garnered substantial interest among pharmacologists, synthetic chemists, and medicinal chemists due to their potential as a promising scaffold for novel anticancer drug development (Yang et al., 2017).
Exploring DKPs as potential anticancer agents opens a novel and promising avenue of research, especially considering specific DKP derivatives displaying potential for anticancer effects. In this study, an inventive product of these compounds was conceived and synthesized. The derivative's biological activity was assessed against both gastric cancer cells and normal cells. Furthermore, the compound's influence on the expression of caspases 3, 8, and 9 was scrutinized. Employing docking and molecular dynamics simulations, the primary target of this compound in activating caspases was determined.
2 Material and methods
In this study, we employed the synthesized BHBPPD compound, as established through our prior research and investigations (Farhadian et al., 2019).
To assess the impact of the BHBPPD compound on gastric cancer cells and its role in apoptosis, cancer cells were initially exposed to the compound, and the expression levels of pivotal caspases were quantified. Subsequently, to identify the primary target of this compound and elucidate its role in apoptosis and caspase activation, the following methodologies were employed. Geo-analysis was conducted on a database of gastric cancer cell lines to identify shared factors linked to caspase activation. Using the molecular docking approach, we calculated the binding energy between BHBPPD and specific characteristics, aiming to pinpoint the main compound target. Furthermore, the molecular dynamics simulation technique was implemented to elucidate the thermodynamic attributes of the compound interacting with the two factors exhibiting the highest connection energy. To pinpoint the primary target of this compound and explain its role in caspase activation and apoptosis, the following sequence of steps was undertaken. Geo-analysis was performed on existing datasets from gastric cancer cell lines to unveil common factors associated with the caspase activation pathway. The molecular docking method was employed to compute the binding energy between the BHBPPD compound and designated elements, thereby identifying its primary target. Additionally, molecular dynamics simulations were utilized to ascertain the thermodynamic characteristics of the compound's interaction with the two elements displaying the highest binding energy, as delineated in the schematic presented in Fig. 1.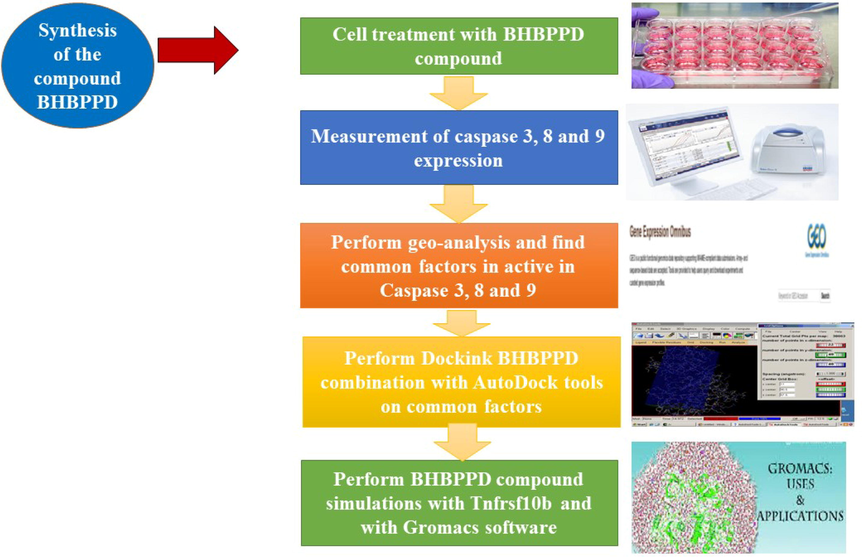
Workflow of this scientific study.
2.1 Cell culture and gene expression study
2.1.1 Cell culture and cell viability assays
Human gastric adenocarcinoma cell line (AGS) and human normal cell line (HDF) were procured from Iran's National Cell Bank, located at Iran's Pasteur Institute (Tehran, Iran). Cell cultures were maintained in RPMI 1640 complete medium supplemented with 10% fetal bovine serum, two mM glutamine, 100 IU/ml penicillin, and 100 mg/ml streptomycin. Subsequently, cells were incubated at 37 °C with 5% CO2 in a controlled environment. Cells were seeded at a density of 1.5 × 10⁵ cells/well onto a 12-well culture plate and allowed to adhere overnight. For each experimental procedure, the BHBPPD compound was freshly prepared and dissolved. Cytotoxicity assessment was conducted using an ELISA reader at 570 nm, and the instrument's specification should be provided. Following a 3-time point incubation (24 h, 48 h, and 72 h) with the treated cells, the MTT assay was performed. The concentration–response curve was generated from the scatter plot of percentage viability against drug concentrations, from which IC50 values were determined. IC50 values represent drug concentrations causing a 50% reduction in cell viability compared to the control. All experiments were performed in triplicate and independently repeated three times.
2.1.2 Extraction of RNA and quantitative PCR in real-time
Cells were seeded at an average density of 5 × 10⁵ cells per well and exposed to BHBPPD concentrations corresponding to IC50 and IC90 levels for 72 h before RNA isolation. Total RNA isolation and cDNA synthesis were executed using a manufacturer-specific kit (Takara, Japan) following TRIZOL-based protocols. The expression levels of apoptosis-related genes and glutathione reductase (GR) were quantified using quantitative real-time PCR with the SYBR Green PCR kit (Takara, Japan). mRNA expression was analyzed using the Qiagen RotorGene Q system. For reverse transcription, 1 μg of total RNA from each group's cells was utilized. SYBR Green Real-time PCR Master Mix (QuantiTect SYBR Green PCR Kit) and 0.3 μmol of each primer pair wase employed to amplify cDNAs for qPCR analysis. Amplification consisted of an initial denaturation step at 94 °C for 10 min, followed by 40 amplification cycles (94 °C for 15 s, 20 s annealing temperature, and 72 °C for 25 min). All amplification reactions were performed in triplicate, with results normalized to beta-actin mRNA as an internal control. Relative mRNA values were calculated and reported for analysis.
2.2 Geo-analysis and finding common factors that are related to the hsa04210 kegg pathway
2.2.1 Gene experession data
Gastric cancer cell lines affected by Helicobacter pylori-induced carcinogenesis were employed for expression analysis. Gene expression profiles, namely GSE4651 and GSE10262, were acquired from the publicly accessible GEO database. The GSE4651 dataset comprises 340 samples, encompassing 122 gastric cancer samples and 218 normal gastric samples. This dataset is based on the Agilent GPL81 platform [MG_U74Av2], utilizing the Affymetrix Murine Genome U74A Version 2 Array. The GSE10262 dataset consists of 18 samples, comprising 12 gastric cancer samples and six normal gastric samples. This dataset utilizes the Agilent GPL1261 platform [Mouse430_2], employing the Affymetrix Mouse Genome 430 2.0 Array.
2.2.2 Data preprocessing
All probe values within each sample were unified to a singular value by determining the mean expression value using an aggregate function methodology (Lin-Vien, Colthup, Fateley, & Grasselli, 1991). Any instances of missing data were rectified using the k-nearest neighbor imputation technique (Altman, 1992). Subsequently, quantile normalization was executed employing the preprocess Core package in Bioconductor (Bolstad, Irizarry, Åstrand, & Speed, 2003). In situations where multiple probes were associated with a single gene, the median expression level was designated for that particular gene. Conversely, when a single probe corresponded to various genes, it was considered non-specific and therefore excluded from the subsequent analysis.
2.2.3 Identification of DEGs
We employed the R package “limma” (Ritchie et al., 2015) to identify the Differentially Expressed Genes (DEGs) between colorectal cancer (CRC) samples and normal ovarian samples. A significance threshold of adjusted P < 0.05 and |log fold change (FC)| > 1 was utilized as the criterion for selection. The adjusted P-value (adj. P) was employed to control for false positives.
For visualization purposes, the volcano plot and heat map were generated using the “gplots” package in R version 3.5.3 (Galili, O’Callaghan, Sidi, & Sievert, 2018).
2.2.4 Extraction of apoptotic pathway genes from KEGG (hsa04210) and investigation of association with obtained genes and PPI network
All genes associated with the apoptosis pathway (ID hsa04210) were extracted using Cytoscape 3.7.1 software. Subsequently, their interactions with genes exhibiting substantial expression disparities in datasets GSE4651 and GSE10262 were explored through the String server (https://string-db.org/), focusing on their relationship with apoptotic factors. Shared factors between the two datasets (GSE4651 and GSE10262) that potentially affect apoptosis were identified and selected for further analysis.
2.3 Molecular docking
Protein Data Bank (PDB) files corresponding to TNFRSF10B (ID: 1du3), GZMB (ID: 1iau), Jun (ID: 1jun), SPTA1 (ID: 1owa), APAF1 (ID: 1z6t), BID (ID: 2m5i), LMNA (ID: 2xv5), ACTB (ID: 3byh), FADD (ID: 3ezq), CFLAR (ID: 3 h13), CASP6 (ID: 3v6m), CYCS (ID: 3zcf), CASP3 (ID: 5i9b), CASP8 (ID: 5 l08), and CASP9 (ID: 1jxq) were retrieved from the Protein Data Bank server (https://www.rcsb.org). Subsequently, water and HETATOM components were removed from the structures. The three-dimensional structure (PDB) of the BHBPPD compound (Fig. 2) was visualized using Marvin Sketch software and optimized using Gaussian software with the B3LYP/6-311G (d,p) method. Autodock software version 4.2 was employed to conduct molecular docking studies. The BHBPPD compound ligand was docked with the protein mentioned above structures to determine optimal binding sites and the most stable free energy state of the ligand-receptor complex. A grid box was created for each receptor-ligand interaction according to the specifications outlined in Table 1. Docking simulations were performed with the Genetic Algorithm and Lamarckian GA parameters, running 200 molecular docking iterations. The autodock4 version of Linux was used to generate results files (dlg), which were subsequently analyzed (Morris et al., 2009). Discovery Studio Visualizer 2021 was utilized to quantify hydrophobic interactions and hydrogen bonds between receptors and ligands. Additionally, the type and number of amino acids in near to the binding sites were determined (Wallace, Laskowski, & Thornton, 1995).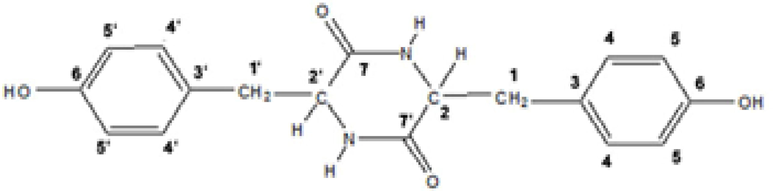
Structure of BHBPPD.
Receptor (PDB ID)
BE kcal/mol
FIE kcal/mol
EIC µM
Interaction bonds
Hydrogen Bonding
Hydrophobic Binding
Other Binding
Box Size (Spacing)
TNFRSF10B (1du3)
−9.6
−11.40
−0.01
Ans(L)199, Asp(G)95, Gln(L)205, Arg(G)101
Glu(G)124, Arg(G)104, Ile(G)123, Arg(G)104, Thr(L)200, Asn(L)262, Lys(L)204, Ser(G)96, Asp(L)203, Lys(L)201, Phe(G)91, Asp(G)12, Cys(G)125
Glu(G)93
126 × 126 × 126 (1.0)
GZMB (1iau)
−7.46
−9.25
−0.14
Phe(A)191, Gly(A)216
Tyr(A)174, Phe(A)99, Tyr(A)215, Gly(A)193, Asp(A)194, Ser(A)190, Val(A)213, Arg(A)226, Lys(A)192, Ser(A)214, Asn(A)218, Arg(A)217
Leu(A)172
126 × 126 × 126 (0.430)
JUN (1jun)
−4.65
−6.44
−0.13
Arg(A)302
Lys(A)288, Asn(A)291, Gln(B)290, Glu(B)293, Ser(A)292
Leu(B)294, Ala(A)295
126 × 126 × 126 (0.675)
CASP9 (1jxq)
−7.44
−9.23
−0.09
Met(B)386, Pro(A)322, The(A)323
Phe(A)393, Gln(B)385, Glu(A)295, Asn(A)263, Phe(A)240, Asn(A)266, Ile(A)327, Ile(A)240, Gln(A)240, Thr(B)333, Tyr(B)331, Ser(B)332
Pro(A)324, Val(A)262
126 × 126 × 126 (0.802)
SPTA1 (1owa)
−6.18
−7.97
−0.14
Glu(A)116, Thr(A)120, Arg(A)118, Gly(A)122
Arg(A)115, Phe(A)119, His(A)126
His(A)123, Met(A)121
126 × 126 × 126 (0.697)
APAF1 (1z6t)
−6.16
−7.95
−0.14
Asp(B)27, Arg(B)332, Leu(B)297, Asn(B)300, Val(B)124
Glu(B)40, Asn(B)420, Val(B)125
–
126 × 126 × 126 (0.697)
BID (2m5i)
−5.42
−7.21
−0.39
Ile(A)82, Ieu(A)69, Ser(A)67
Asn(A)85, Gly(A)70, Asp(A)75
Ile(A)86, His(A)89, Arg(A)68
126 × 126 × 126 (0.647)
LMNA (2xv5)
−6.45
−8.24
−0.76
Arg(A)349, Glu(A)344, Gln(A)355
Ile(A)356, Gln(A)353, Glu(A)347, Leu(B)356, Arg(A)351, Gln(B)355
Tyr(B)359
100 × 92 × 126 (0.702)
ACTB (3byh)
−7.76
−9.95
−0.44
Tyr(A)91, Arg(A)95, Gln(B)500, Asp(B)516, Glu(A)100
Phe(A)90, Gln(B)492, Phe(B)468, Leu(B)466, Phe(B)496, Met(B)514, Leu(B)502, Thr(B)475, Ala(B)517, Ala(A)97, Val(A)96, Lys(B)467, Ser(B)469, Asn(A)92
Arg(B)495, Arg(B)506, Leu(B)499, Lys(B)503
126 × 126 × 126 (1.0)
FADD (3ezq)
−4.32
−6.11
−0.27
Trp(H)148, Asn(H)155, Glu(H)154
Ala(H)164, Leu(H)119, Lys(H)153, Thr(H)151
His(H)160, Lys(H)120, Glu(H)152
126 × 126 × 126 (1.0)
CFLAR (3 h13)
−7.12
−8.90
−0.07
Asn(A)467
Thr(A)407, Tyr(A)464, Tyr(A)451, Val(A)465, Met(A)450, Asn(A)454, Tyr(A)463, Trp(A)466, Leu(A)405, Gln(A)319
–
126 × 126 × 126 (0.486)
CASP6 (3v6m)
−4.65
−6.24
−0.19
Val(I)212
Val(I)275, Pro(I)276, Ser(I)121, Ser(I)226, Gln(I)161, Ile(I)229, Trp(I)227, Val(I)256
–
126 × 126 × 126 (1.0)
CYCS (3zcf)
−8.22
−10.01
−0.28
Lys(A)27, Tyr(A)97, Glu(A)104, Ala(A)101, Lys(A)7
Thr(A)102, His(A)33, Lys(A)22, Ile(A)11, Ser(A)15, His(A)18, Thr19
Glu(A)21, Val(A)20
126 × 126 × 126 (0.530)
CASP3 (5i9b)
−8.16
−9.95
−0.48
Gln(A)225, Arg(A)241, Glu(A)246, Thr(A)245
Tyr(A)226, Arg(A)238, Thr(A)174
Lys(A)242, Met(A)222
126 × 126 × 126 (0.530)
CASP8 (5 l08)
−5.71
−7.50
−0.24
Asn(G)176. Glu(G)154
Gly(G)155, Asp(G)158, Tyr(G)178, Ile(G)175, Glu(G)179, Leu(G)157, Phe(G)181
–
126 × 126 × 126 (0.911)
2.4 Molecular dynamics simulations
Molecular dynamics is a computational technique that simulates the physical movements of atoms and molecules as they interact over time. This method allows the study of atomic motion within a specified time frame, often focusing on the system's behavior far from equilibrium. To achieve meaningful results, the initial simulation step must guide the system toward stability, where thermodynamic and structural properties stabilize. This process is based on Newton's second law of motion for atoms. In this study, the molecular dynamics simulation of the target complex was conducted using Gromacs 2021.1 software. The simulation was conducted under constant pressure and temperature conditions (NPT) using the g54a7 force field and the SPC216 water solvent model. The simulation extended for 50 ns (ns). Two simulation models were chosen, each involving specific proteins with the highest binding energy from the docking results:
-
TNFRSF10B and CYCS are in their free state (without ligand).
-
TNFRSF10B and CYCS in the presence of BHBPPD ligand.
The latter mode included adding ligand information to the n.top and gro files, with itp and gro ligand files obtained from the Prodrg database, consistent with the Gromacs force field. The simulation process encompassed energy minimization, system neutralization, and balance steps. The steepest descent mining algorithm integrated 50,000 steps for energy minimization. Subsequently, the leap-frog algorithm was utilized for 150,000 steps to achieve balance using NVT (canonical ensemble) and NPT (isobaric-isothermal ensemble) ensembles. A Nose-Hoover thermostat and isotropic Monte Carlo (MC) barostat maintained a pressure of 1 atm. Coordinates were saved every ten ps during production runs, using a time step of 1 fs. The simulation was performed with three replications and reported.
For trajectory analysis and visualization, Visual Molecular Dynamics 1.9.3 (Humphrey, Dalke, & Schulten, 1996) was employed. 2D plots were generated to illustrate the intrinsic dynamical stabilities of the complex, including root-mean-square fluctuations (RMSF), root-mean-square deviation (RMSD), hydrogen bond interactions, and radius of gyration (Rg).
3 Results and discussion
3.1 Cell proliferation and cell cytotoxicity assays
Following treatment with varying concentrations of BHBPPD, a dose-dependent reduction in the viability of the cancer cell line was observed (Fig. 3), while no such effect was observed in the normal cell line (Fig. 4). Our analysis indicates that the AGS cell line exhibited lower toxicity to BHBPPD at IC50 concentrations (below 45 μM) during drug treatments, whereas no significant toxicity was observed in the normal cell line at these concentrations. Primary cytotoxicity experiments demonstrated that the drugs hindered the growth of cancer cells compared to normal cells after 24, 48, and 72 h of treatment. Additionally, the cytotoxicity notably increased following the introduction of BHBPPD at various concentrations.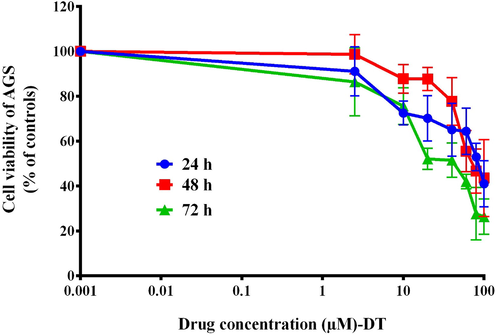
Cytotoxic effects of BHBPPD. AGS Cells were cultured for 3 times with different doses of drug. Cell viability was evaluated by MTT. The values represent the means of three independent experiments (mean ± SE).
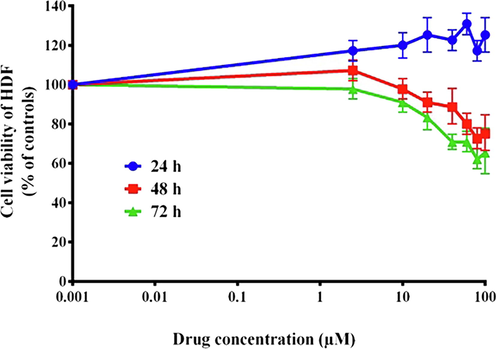
Cytotoxic effects of BHBPPD. HDF Cells were cultured for 3 times with different doses of drug. Cell viability was evaluated by MTT. The values represent the means of three independent experiments (mean ± SE).
3.2 Apoptosis-related genes transcripts level
Following established standard protocols, relative transcripts of caspase 3, 9, 8, and GR were quantified using real-time PCR. Notably, the expression of CASP3 in AGS cells treated with BHBPPD exhibited a significant increase compared to the control at IC90 concentrations (P = 0.03 and 0.001, respectively) (Fig. 5A). Additionally, the expression of CASP9 showed a notable increase compared to the control (p = 0.005) in AGS cells treated with BHBPPD at IC90 concentrations (Fig. 5B). Treatment of AGS cells with BHBPPD resulted in a concentration-dependent increase in CASP8 expression at both 72 h and IC90 concentrations (Fig. 5C). Conversely, the expression of GR in BHBPPD-treated cells experienced a decrease (Fig. 5D). The study introduced a novel piperazine derivative that demonstrated a robust anticancer effect through the evaluation of cancer cell proliferation and the induction of caspase-dependent apoptosis. Caspases were positioned at the forefront of apoptotic signaling and recognized as the primary agents responsible for cleaving cellular proteins, a critical process for the degradation of dying cells. Caspases act as proteolytic enzymes that cleave cytoskeletal proteins upon activation (Sharifi, Hosseinali, Saboury, Szegezdi, & Falahati, 2019). Furthermore, the pivotal role of GR was highlighted in the cellular shift from GSH-to-GSSG, which can determine the fate of a cell. A decrease in GR gene expression was be linked with mitochondrial GSH/GSSG imbalance, consequently inducing apoptotic signaling.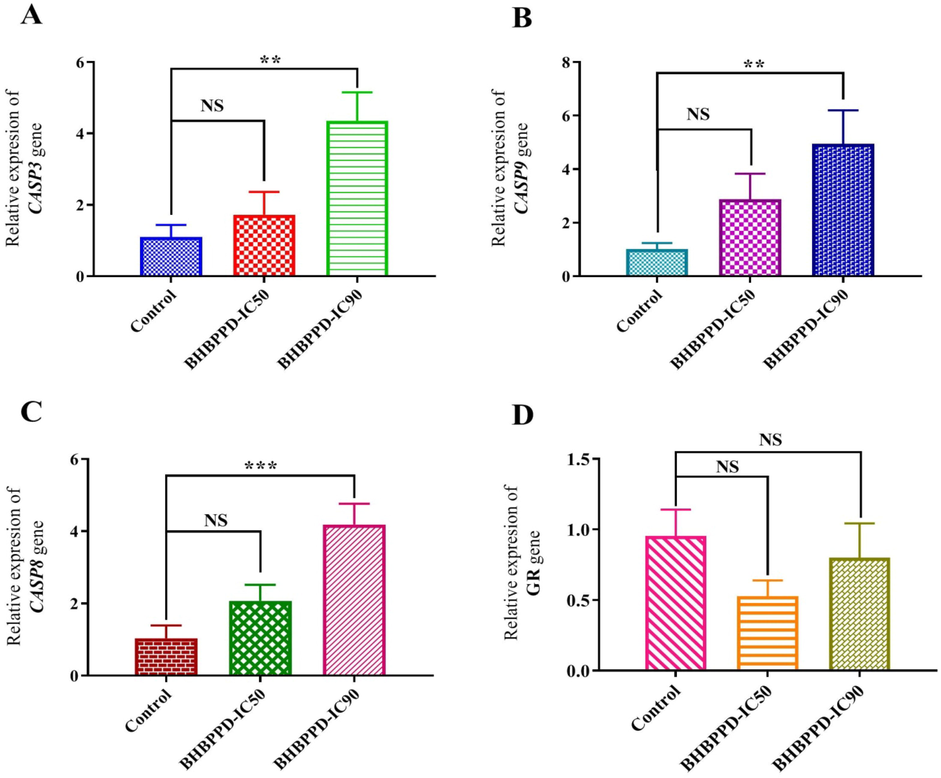
Relative quantifications of CASP3, CASP9, CASP8, and GR transcripts in the AGS cell line. Cells were incubated with IC50 and IC90 concentrations of BHBPPD for 72 h. β-actin was used as a favored internal control. The results are presented as mean ± SE of three independent experiments each in triplicate compared with untreated samples. Symbols (***), (**), and (*) represent the mean differences between treated and untreated cell transcriptions as P < 0.001, P < 0.01, and P < 0.05 using one-way ANOVA, respectively.
3.3 Identification of DEGs
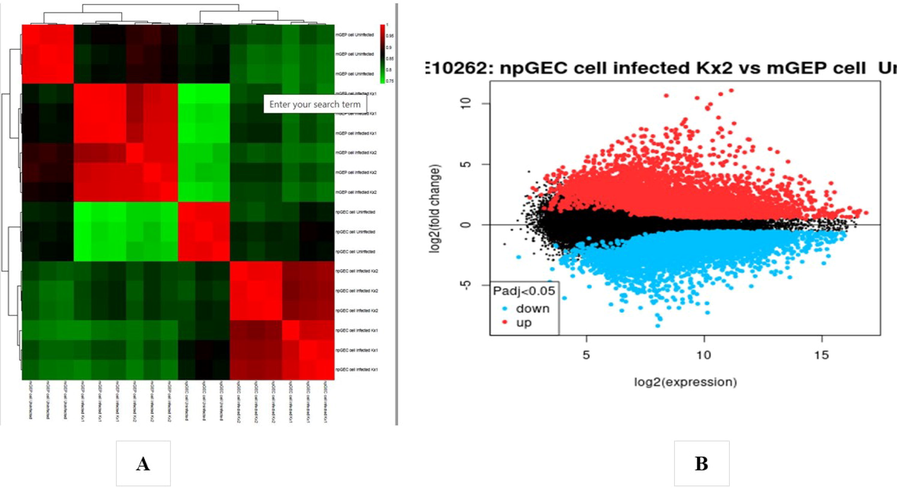
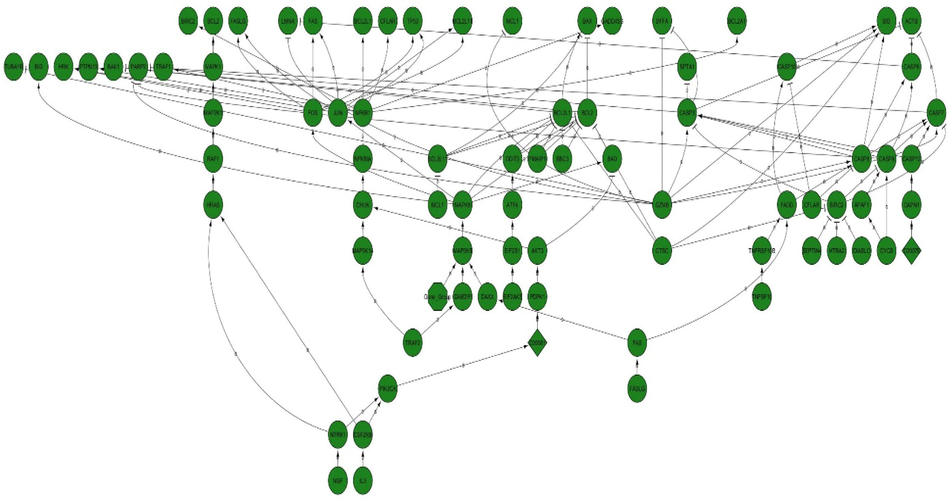
In the analysis of the GSE4651 dataset, 340 gastric cancer samples and 218 normal samples were examined, while the GSE10262 dataset consisted of 18 samples, comprising 12 gastric cancer samples and six normal samples. Each chip's series were individually investigated using R software, and subsequently, differentially expressed genes (DEGs) were identified using adjusted P-value < 0.01 and logFC ≥ 2 or logFC ≤ − 2 as the cutoff criteria. In the context of GSE4651 analysis, a total of 3582 DEGs were identified, of which 2844 were upregulated genes and, 738 were downregulated (Fig. 6B). The presentation of the DEGs' fold change is depicted in Fig. 6A. Similarly, the analysis of GSE10262 revealed a total of 5859 DEGs, among which 3016 were downregulated and, 2843 were upregulated genes (Fig. 7B). The fold change performance of the DEGs is illustrated in Fig. 7A. Fig. 8 visually represents all the protein factors related to apoptosis, sourced from the hs02410 pathway of the KEGG database. The association between the 9441 genes obtained from the apoptotic protein factors shown in Fig. 4 was assessed using the STRING database. Ultimately, the protein factors that exhibited associations and were shared between the GSE4651 and GSE10262 datasets were selected and highlighted in Fig. 9.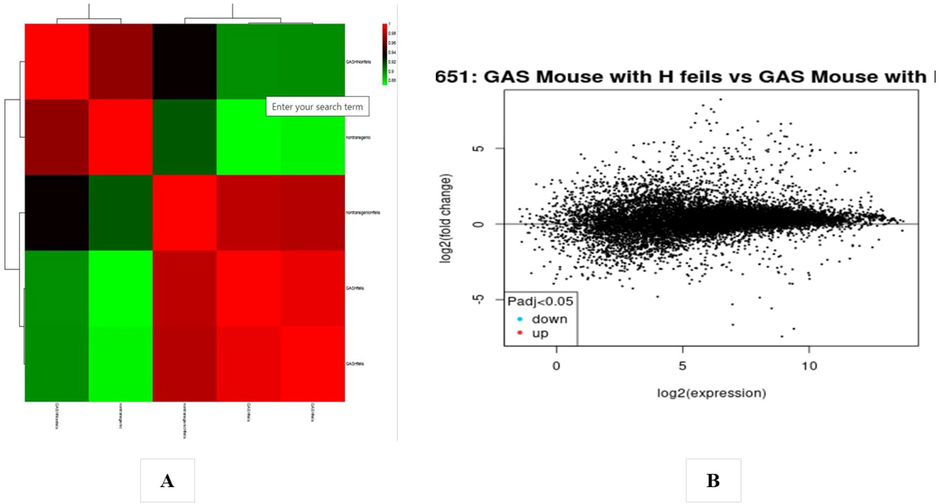
(A) Heat map of DEGs. (B) Volcano plot of genes detected in Gastric cancer. Red means upregulated and downregulated DEGs; black means no difference (GSE4651 dataset).
(A) Heat map of DEGs. (B) Volcano plot of genes detected in Gastric cancer. Red means upregulated and downregulated DEGs; black means no difference (GSE4651 dataset).
Protein factors participating in apoptosis obtained from Kegg server with hsa0410 pathway.
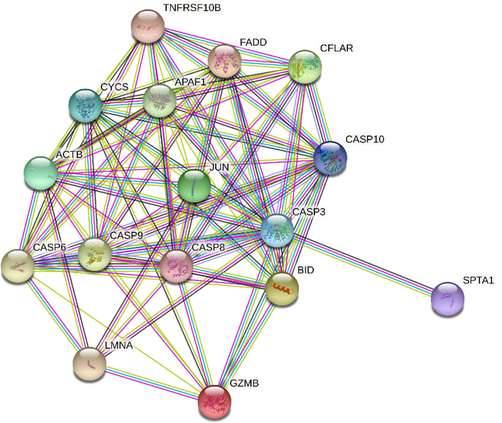
The final protein–protein interaction (PPI) network of the Caspas3, 8, and 9 with common genes that in apoptosis between GSE4651 and GSE10262 datasets.
3.4 Molecular docking
Virtual initial screening was conducted to evaluate the potential interaction of the BHBPPD compound with a selection of key apoptotic factors, including TNFRSF10B, GZMB, JUN, SPTA1, APAF1, BID, LMNA, ACTB, FADD, CFLAR, CASP6, CYCS, CASP3, CASP8, and CASP9, using Autodock. The docking results provided the docking score represented as Gibbs free energy ΔG (kcal/mol), which accounts for the sum of all interactions between the receptor and ligand energies. Detailed docking results are outlined in Tables 1 and Supplementary S1. Notably, the BHBPPD ligand exhibited a ΔG of −9.6 kcal/mol when binding to TNFRSF10B, in comparison to −8.22 kcal/mol for CYCS. In the case of TNFRSF10B, hydrogen bonding occurred with Ans(L)199, Asp(G)95, Gln(L)205, and Arg(G)101 amino acids, while hydrophobic interactions were established with Glu(G)124, Arg(G)104, Ile(G)123, Arg(G)104, Thr(L)200, Asn(L)262, Lys(L)204, Ser(G)96, Asp(L)203, Lys(L)201, Phe(G)91, Asp(G)12, and Cys(G)125. Similarly, BHBPPD formed hydrogen bonds with CYCS, involving amino acids Lys(A)27, Tyr(A)97, Glu(A)104, Ala(A)101, and Lys(A)7. Additionally, hydrophobic and anionic bonds were established with Thr(A)102, His(A)33, Lys(A)22, Ile(A)11, Ser(A)15, His(A)18, and Thr19, along with an anionic bond with Glu(A)21 (Table 1). Furthermore, the study delved into the role of TNFRSF10A and TNFRSF10B as cell surface receptors that interact with tumor necrosis factor-related apoptosis-inducing ligand (TRAIL), mediating the extrinsic apoptosis pathway. However, the mechanisms underlying the transcriptional regulation of these receptors remain relatively uncharacterized (Li et al., 2015).
The TNFRSF10B protein, encoded by the gene mentioned above, belongs to the TNF-receptor superfamily, encompassing an intracellular death domain. Activation of this receptor may occur via tumor necrosis factor-related apoptosis-inducing ligand (TNFSF10/TRAIL/APO-2L), transmitting an apoptosis signal. FADD, a death domain with an adaptor protein, has been identified as necessary for apoptosis mediated by this protein. Various transcript variants encoding different isoforms, as well as one non-coding transcript, have been identified for this gene. Furthermore, DDIT3′s interaction with phospho-JUN results in the formation of the DDIT3-phospho-JUN complex, which binds to the AP-1 binding site within the TNFRSF10A promoter region. It was demonstrated that KAT2A interacts effectively with the N-terminal area of DDIT3, thereby regulating TNFRSF10a and TNFRSF10b expression in endoplasmic reticulum stress-mediated apoptosis in human lung cancer cells (Li et al., 2015). Apoptosis, a highly regulated form of programmed cell death, is pivotal in maintaining multicellular organism homeostasis and development. Cytochrome c serves as a crucial element in the activation of the apoptotic intrinsic pathway, initiating the caspase cascade through interaction with Apaf-1. Recent studies by Elena-Real et al. identified 14–3-3ε as a cytosolic cytochrome c target and demonstrated its role in caspase cascade activation by inhibiting Apaf-1 (Elena-Real et al., 2018). Additionally, Parray et al. investigated the interaction of polyethylene glycol with cytochrome c and suggested that specific concentrations of crowders might hold potential as therapeutic agents for various diseases (Parray et al., 2021). The docking outcomes of compounds targeting significant apoptotic factors, as highlighted by geo-analysis, indicated strong potential interactions with CYCS and TNFRSF10B-mediated apoptotic factors, making them promising candidates for therapeutic targeting.
3.5 Molecular dynamic (MD) simulations
Molecular dynamics simulations were conducted on the TNFRSF10B and CYCS proteins complexed with BHBPPD. The systems were solvated in a water box and simulated for 50 ns. Table 2 presents the average and standard deviations of kinetic (EKCMT) and potential (EPTOT) energies, total (ETOT) energy, volume (nm3), density (kg/m3), and enthalpy, which were analyzed to assess the system's behavior. The molecular dynamics analysis was carried out using GROMACS software. Various parameters such as solvent accessible surface area (SASA), hydrogen bonding, root mean square deviation (RMSD), and radius of gyration (Rg), as well as root mean square fluctuations (RMSF) at 300 K, were obtained for analysis (Table 3). The RMSD of the TNFRSF10B and CYCS systems in the presence of BHBPPD over a 50 ns interval indicated a stable state, with a more pronounced reduction in RMSD observed for CYCS when bound to the ligand. The results confirmed equilibrium in the MD simulations for the studied systems (Fig. 10A) (Gharaghani, Khayamian, & Ebrahimi, 2013; Suo et al., 2018). Table 2 provides insight into the energy levels of the four molecular dynamics simulation systems. The data reveals that BHBPPD can decrease potential energy levels and contribute to the overall stability of the simulation system, particularly for TNFRSF10B. Root mean square fluctuations (RMSF) of residues were compared among free TNFRSF10B and CYCS and their complexes with BHBPPD to assess residue mobility. Results shows that in the presence of a BHBPPD, the amount of RMSF decreases, and as a result, the two proteins TNFRSF10B and CYCS decrease their flexibility and become more stable, which is a significant difference in the amount of RMSF in the absence of ligand (Fig. 10 C&D). The radius of gyration (Rg) was used to gauge enzyme compactness, with data confirming a decrease in Rg for both TNFRSF10B and CYCS in the presence of BHBPPD.Rg of TNFRSF10B (3.17±0.19) and CYCS (3.05±0.21) in 50 ns time interval and it verifies the gyration radius of TNFRSF10B (2.20±0.05) and CYCS (2.33±0.09) decrease when BHBPPD is present (Table 3 and Fig. 10B). Hydrogen bonding interactions between BHBPPD and the proteins led to alterations in accessible surface area (ASA) and contributed to their structural stability (Fig. 10F) (Gan et al., 2019; G. Wang, Wang, Li, & Lu, 2011). BHBPPD can interact with TNFRSF10B (0.85±0.78 hydrogen bonds) and CYCS (2.90±0.92 hydrogen bonds) and alter the hydrogen bonds between TNFRSF10B (266.80±16.83 to 269.40±21.37) and CYCS (284.36±9.47 to 274.40±9.60) and the surrounding solution. The solvent-accessible surface area (ASA) analysis revealed a reduction in surface area for both TNFRSF10B and CYCS in the presence of BHBPPD, aligning with the decrease in Rg. Structural changes of TNFRSF10B in the presence of the ligand were more substantial compared to CYCS. Notably, the YIPF2-TNFRSF10B axis was associated with the malignant progression of lung cancer, and YIPF2 enhanced chemotherapeutic agent-mediated apoptosis by augmenting TNFRSF10B recycling to the plasma membrane in NSCLC cells (Falschlehner, Emmerich, Gerlach, & Walczak, 2007; Y. Wang et al., 2020). ave ± SD.
Name
EPTOT (KJ/mol)
EKCMT (kJ/mol)
ETOT (kJ/mol)
Temperature (K)
Volume (nm^3)
Density (kg/m^3)
Enthalpy
TNFRSF10B
−4249318 ± 2578.06
768572.50 ± 2293.60
−3480746 ± 4101.53
300.00 ± 0.89
3147.18 ± 2.78
982.98 ± 0.86
−3480556 ± 4101.56
TNFRSF10B-BHBPPD
−2269192 ± 6514.72
412522 ± 1685.35
−1856670 ± 6921.29
300.00 ± 1.22
1684.41 ± 2.38
991.77 ± 1.42
−1856569 ± 6921.37
CYCS
−1355633 ± 1426.35
245497.1 ± 1279.10
−1110136.3 ± 2254.91
300.01 ± 1.56
1004.36 ± 1.58
997.25 ± 1.57
−111--76 ± 2254.92
CYCS- BHBPPD
−1332409 ± 38811.44
241777.9 ± 826.24
−1090582 ± 1437.89
300.01 ± 1.03
985.32 ± 1.69
1001.79 ± 1.69
−1090560 ± 3898.99
Name
RMSD (nm)
Rg (nm)
RMSF (nm)
Area per residue (ASA)(nm)
H-bond between protein–protein (number)
H-bond between protein-solvation (number)
TNFRSF10B
1.66 ± 0.30
3.17 ± 0.19
0.55 ± 0.280
274.23 ± 15.12
266.80 ± 16.83
970.42.65
TNFRSF10B-BHBPPD
0.84 ± 0.07
2.20 ± 0.05
0.246 ± 0.123
248.87 ± 4.26
269.40 ± 21.37
870.72 ± 51.51
CYCS
1.71 ± 0.52
3.05 ± 0.21
0.99 ± 0.34
247.75 ± 2.11
284.36 ± 9.47
871.15 ± 20.57
CYCS- BHBPPD
0.54 ± 0.35
2.33 ± 0.09
0.30 ± 0.08
233.89 ± 2.48
274.40 ± 9.60
807.40 ± 22.69
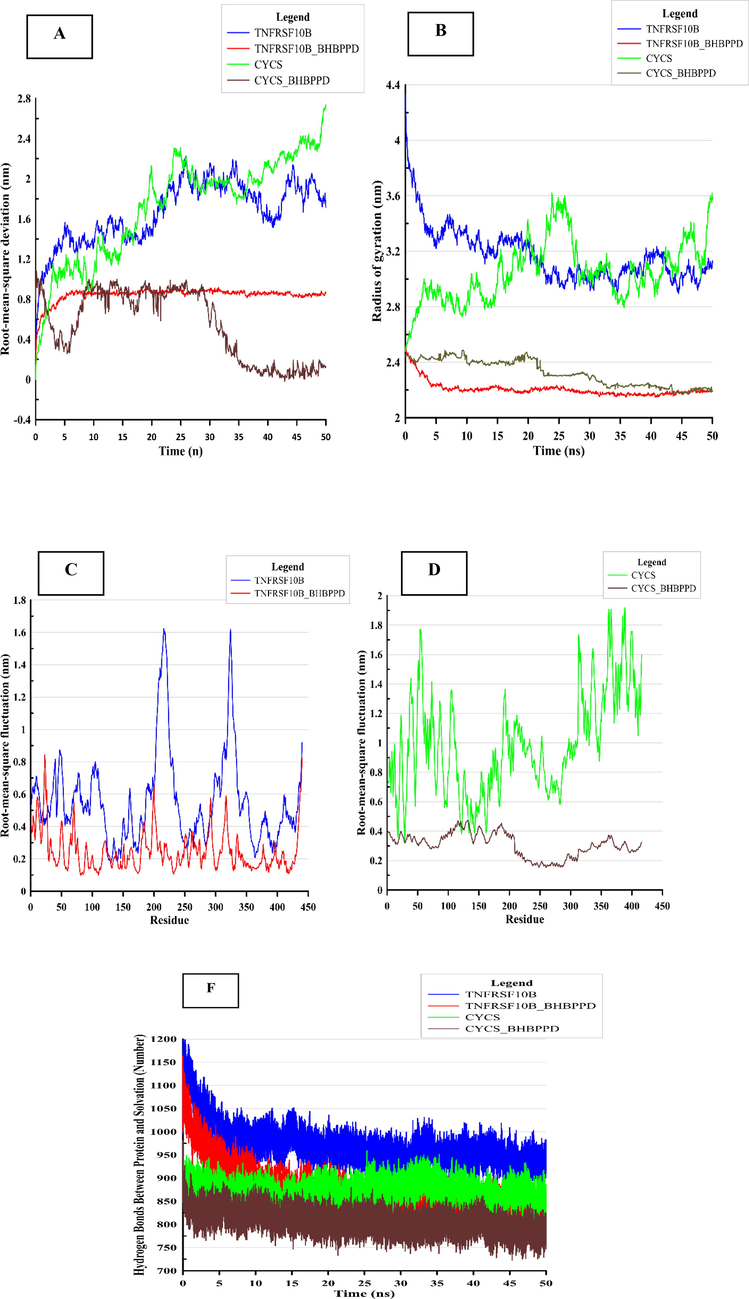
Stability of TNFRSF10B and CYSC and complex they in the presence of BHBPPD. Average root means square deviation (RMSD) for protein fit to Alpha carbon (A) for 50 ns, and average root mean square fluctuation of whole protein following stabilization. (B) Radiues of gyration of TNFRSF10B and CYSC and TNFRSF10B and CYSC complex in the presence of BHBPPD (C and D) shows the RMSF values the TNFRSF10B (C) and CYSC (D) form and ligand (BHBPPD) bound forms of the proteins. (F) Indicates the number of hydrogen bonds between TNFRSF10B and CYSC proteins and water solvent (spc216) in the presence of ligand and absence.
Proteins TNFRSF10B and CYCS assume pivotal roles within the intricate framework of the apoptosis pathway. TNFRSF10B is a cell membrane receptor that interacts with the apoptosis-inducing ligand TRAIL (Tumor Necrosis Factor-Related Apoptosis-Inducing Ligand). Upon TRAIL binding to TNFRSF10B, an orchestrated series of molecular events is set in motion, triggering a cascade that culminates in activating the apoptotic pathway within the cellular milieu. Additionally, CYCS, an essential constituent of the cytochrome C complex, plays a decisive role in endogenous apoptosis. It is actively engaged in fundamental processes, encompassing the liberation of mitochondrially stored factors and orchestrating a multi-component structure, the apoptosome, formed through the assembly of apoptotic protease activating factor-1 (Apaf-1). These functions collectively contribute to the meticulous regulation of programmed cell death (Farooqi, Gadaleta, Ranieri, Fayyaz, & Marech, 2017; Kretz et al., 2018). Table 4 structural changes of proteins TNFRSF10B and CYCS in the presence and absence of ligand BHBPPD during 50 nanoseconds of the simulation time. The results showed that the structural changes of TNFRSF10B in the presence of ligand are greater than CYCS, so the value of the structure is equal to 147.58 for TNFRSF10B and 162.99 value when ligand is present. The largest change in TNFRSF10B structure was related to changes in the alpha-helix and coil levels (Fig. 11)
Name
Structure
Coil
B-sheet
B-Bridge
Bend
Turn
Helix
TNFRSF10B
147.58 ± 11.48
199.58 ± 10.61
48.69 ± 8.74
15.43 ± 3.89
89.48 ± 6.48
35.32 ± 7.30
17.15 ± 2.37
TNFRSF10B-BHBPPD
162.99 ± 11.01
173.80 ± 12.55
46.40 ± 8.93
20.63 ± 4.64
101.19 ± 8.02
31.85 ± 6.13
22.03 ± 2.69
CYCS
237.71 ± 6.26
116.68 ± 6.43
1.71 ± 2.60
11.66 ± 2.72
54.93 ± 5.44
49.80 ± 5.92
60.40 ± 3.04
CYCS- BHBPPD
229.95 ± 7.88
121.03 ± 5.68
4.67 ± 4.58
12.62 ± 3.44
61.53 ± 6.22
43.19 ± 6.72
57.64 ± 3.45
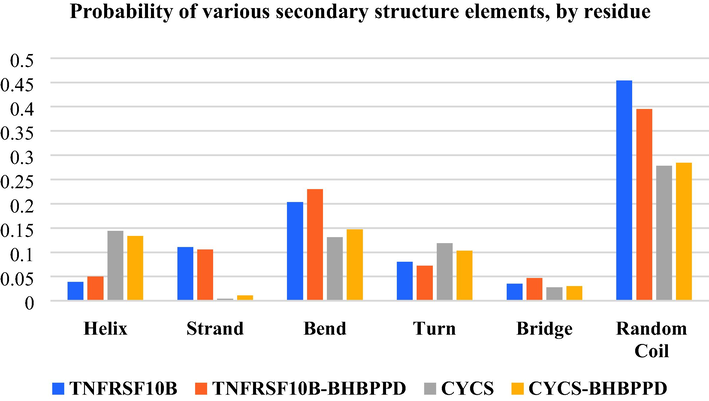
Shows probability of various secondary structure elements by residue of TNFRSF10B and CYSC proteins in the presence of ligand (BHBPPD) and absence.
The combined analysis of molecular dynamics simulations, energy levels, RMSD, RMSF, Rg, ASA, and their influence on structural stability sheds light on the interactions between BHBPPD and TNFRSF10B and CYCS proteins, providing valuable insights for potential therapeutic targeting.
4 Conclusion
This study conducts a thorough investigation into the impact of BHBPPD on cancer cell viability, gene expression associated with apoptosis, and interactions involving crucial apoptotic components. BHBPPD demonstrates a dose-dependent reduction in the viability of cancer cells, particularly notable in AGS cells, indicating its potential therapeutic efficacy at IC50 concentrations. Significantly, BHBPPD induces significant alterations in the expression of genes linked to apoptosis, notably elevating the levels of CASP3 and CASP9, suggestive of the activation of caspase-dependent apoptotic pathways. The expression of CASP8 shows an increasing trend with rising concentrations of BHBPPD, while the expression of GR experiences a decline, potentially contributing to the initiation of apoptotic signaling. Transcriptomic analysis reveals noteworthy differences in gene expression patterns between gastric cancer and normal samples, as evident in the GSE4651 and GSE10262 datasets. This analysis provides a comprehensive understanding of the alterations in gene expression that underlie gastric cancer. Furthermore, through molecular docking simulations, promising interactions between BHBPPD and critical apoptotic factors, specifically TNFRSF10B and CYCS, are elucidated. These findings shed light on the potential for targeted therapeutic interventions. Employing molecular dynamics simulations, the stable binding of BHBPPD with TNFRSF10B and CYCS is demonstrated, accompanied by structural changes and enhanced stability upon ligand binding. Remarkably, hydrogen bonding interactions significantly contribute to the strength of these complexes. In totality, this comprehensive analysis underscores the potential of BHBPPD as an effective agent against cancer. Its effects on cancer cell viability, the induction of caspase-dependent apoptosis, and its interactions with pivotal apoptotic factors enrich our comprehension of the underlying molecular mechanisms. These insights advance our understanding of apoptotic pathways and open avenues for potential therapeutic strategies in cancer treatment.
Acknowledgments
The authors express their wholehearted gratitude to the University of Shahrekord, Iran, for sustaining this research and Raya Zist Pardaz company (rayazistco.ir) for performing the simulation study and Docking.
Declaration of Competing Interest
The authors declare that they have no known competing financial interests or personal relationships that could have appeared to influence the work reported in this paper.
References
- Functional foods and their role in cancer prevention and health promotion: a comprehensive review. Am. J. Cancer Res.. 2017;7(4):740.
- [Google Scholar]
- An introduction to kernel and nearest-neighbor nonparametric regression. Am. Statist.. 1992;46(3):175-185.
- [Google Scholar]
- 2H-chromene derivatives bearing thiazolidine-2, 4-dione, rhodanine or hydantoin moieties as potential anticancer agents. Eur. J. Med. Chem.. 2013;59:15-22.
- [Google Scholar]
- Second cancers and other late side effects of cancer treatment. A review. Cancer. 1990;65(S3):770-775.
- [Google Scholar]
- A comparison of normalization methods for high density oligonucleotide array data based on variance and bias. Bioinformatics. 2003;19(2):185-193.
- [Google Scholar]
- Global cancer statistics 2018: GLOBOCAN estimates of incidence and mortality worldwide for 36 cancers in 185 countries. CA Cancer J. Clin.. 2018;68(6):394-424.
- [Google Scholar]
- 2, 5-Diketopiperazines as neuroprotective agents. Mini Rev. Med. Chem.. 2012;12(1):2-12.
- [Google Scholar]
- Cytochrome c speeds up caspase cascade activation by blocking 14-3-3ε-dependent Apaf-1 inhibition. Cell Death Dis.. 2018;9(3):1-12.
- [Google Scholar]
- TRAIL signalling: decisions between life and death. Int. J. Biochem. Cell Biol.. 2007;39(7–8):1462-1475.
- [Google Scholar]
- Design, synthesis, and anti-gastric cancer activity of novel 2, 5-diketopiperazine. J. Mol. Liq.. 2019;294:111585
- [Google Scholar]
- Restoring trail induced apoptosis using naturopathy. Hercules joins hand with nature to triumph over lernaean hydra. Curr. Genomics. 2017;18(1):27.
- [Google Scholar]
- Diketopiperazines in peptide and combinatorial chemistry. J. Peptide Sci.: Official Publication Eur. Peptide Soc.. 2003;9(1):9-35.
- [Google Scholar]
- heatmaply: an R package for creating interactive cluster heatmaps for online publishing. Bioinformatics. 2018;34(9):1600-1602.
- [Google Scholar]
- Insights into the interaction of ulipristal acetate and human serum albumin using multi-spectroscopic methods, molecular docking, and dynamic simulation. J. Biomol. Struct. Dyn.. 2019;37(11):2989-2998.
- [Google Scholar]
- Molecular dynamics simulation study and molecular docking descriptors in structure-based QSAR on acetylcholinesterase (AChE) inhibitors. SAR QSAR Environ. Res.. 2013;24(9):773-794.
- [Google Scholar]
- Should we keep walking along the trail for pancreatic cancer treatment? Revisiting TNF-related apoptosis-inducing ligand for anticancer therapy. Cancers. 2018;10(3):77.
- [Google Scholar]
- DDIT3 and KAT2A proteins regulate TNFRSF10A and TNFRSF10B expression in endoplasmic reticulum stress-mediated apoptosis in human lung cancer cells. J. Biol. Chem.. 2015;290(17):11108-11118.
- [Google Scholar]
- Lin-Vien, D., Colthup, N. B., Fateley, W. G., & Grasselli, J. G. (1991). The handbook of infrared and Raman characteristic frequencies of organic molecules: Elsevier.
- Pharmacogenetics of cancer therapy: breakthroughs from beyond? Future Sci. OA. 2015;1(4)
- [Google Scholar]
- Diketopiperazines: biological activity and synthesis. Tetrahedron. 2007;63(40):9923-9932.
- [Google Scholar]
- An investigation into the biological activity of the selected histidine-containing diketopiperazines cyclo (His-Phe) and cyclo (His-Tyr) J. Pharm. Pharmacol.. 2004;56(9):1143-1153.
- [Google Scholar]
- AutoDock4 and AutoDockTools4: Automated docking with selective receptor flexibility. J. Comput. Chem.. 2009;30(16):2785-2791.
- [Google Scholar]
- Nurgali, K., Jagoe, R. T., & Abalo, R. (2018). Adverse effects of cancer chemotherapy: Anything new to improve tolerance and reduce sequelae? In (Vol. 9, pp. 245): Frontiers Media SA.
- Interaction of polyethylene glycol with cytochrome c investigated via in vitro and in silico approaches. Sci. Rep.. 2021;11(1):1-16.
- [Google Scholar]
- limma powers differential expression analyses for RNA-sequencing and microarray studies. Nucleic Acids Res.. 2015;43(7):e47-e.
- [Google Scholar]
- Salvador, J. A., Carvalho, J. F., Neves, M. A., Silvestre, S. M., Leitao, A. J., Silva, M. M. C., & e Melo, M. L. S. (2013). Anticancer steroids: linking natural and semi-synthetic compounds. Natural product reports, 30(2), 324-374.
- Involvement of planned cell death of necroptosis in cancer treatment by nanomaterials: Recent advances and future perspectives. J. Control. Release. 2019;299:121-137.
- [Google Scholar]
- Siegel, R. L., Miller, K. D., & Jemal, A. (2015). Cancer statistics, 2015. CA: a cancer journal for clinicians, 65(1), 5-29.
- Combined spectroscopy methods and molecular simulations for the binding properties of trametinib to human serum albumin. RSC Adv.. 2018;8(9):4742-4749.
- [Google Scholar]
- Walayat, K., MOHSIN, N. U. A., Aslam, S., & Ahmad, M. (2019). An insight into the therapeutic potential of piperazine-based anticancer agents. Turkish Journal of Chemistry, 43(1), 1-23.
- LIGPLOT: a program to generate schematic diagrams of protein-ligand interactions. Protein Eng. Des. Sel.. 1995;8(2):127-134.
- [Google Scholar]
- YIPF2 promotes chemotherapeutic agent-mediated apoptosis via enhancing TNFRSF10B recycling to plasma membrane in non-small cell lung cancer cells. Cell Death Dis.. 2020;11(4):1-12.
- [Google Scholar]
- Exploring the binding mechanism of dihydropyrimidinones to human serum albumin: Spectroscopic and molecular modeling techniques. Colloids Surf. B Biointerfaces. 2011;84(1):272-279.
- [Google Scholar]
- Two new 2, 5-diketopiperazines produced by Streptomyces sp. SC0581. Phytochem. Lett.. 2017;20:89-92.
- [Google Scholar]
- Escherichia coli GutM4 produces 2, 5-diketopiperazines and inhibits human pathogens in vitro. Electron. J. Biotechnol.. 2017;28:35-40.
- [Google Scholar]
- Spectroscopic and molecular modeling methods to investigate the interaction between 5-Hydroxymethyl-2-furfural and calf thymus DNA using ethidium bromide as a probe. Spectrochim. Acta A Mol. Biomol. Spectrosc.. 2014;124:78-83.
- [Google Scholar]


