

Translate this page into:
The effect of repetitive frying on physicochemical properties of refined, bleached and deodorized Malaysian tenera palm olein during deep-fat frying
⁎Corresponding author. saiful-z@ukm.edu.my (Saiful Irwan Zubairi)
-
Received: ,
Accepted: ,
This article was originally published by Elsevier and was migrated to Scientific Scholar after the change of Publisher.
Peer review under responsibility of King Saud University.
Abstract
Refined, bleached and deodorized tenera palm olein is widely used for domestic and commercial food frying. However, repeated heating and frying might lead to oil spoilage. This study focuses on the effect of deep-frying on physicochemical properties of repeatedly heated palm olein. Recycled palm olein was prepared by frying potato strips up to 5 cycles with potato-to-oil (g/ml) ratio of 3:20 prior to colour, density, viscosity, moisture content, contact angle, peroxide value and iodine value analyses. The fluctuation in the temperature of the oil was insignificant for every cycle (p > 0.05). The increase in red colour of the oil was significant (p < 0.05) after two cycles of frying from 3.6 to 5.0 Lovibond unit. After 5 frying cycles, there was no change in the density of RBDPO-2 and RBDPO-3. The viscosity of the oil after 5 frying cycles was higher as compared to after 5 heating cycles (67.7 ± 0.6 and 58.2 ± 0.9 cP respectively). Besides, the viscosity of RBDPO-3 was lower than RBDPO-2 only. The moisture content of the oil increased from 3.7 ± 0.1% to 30.4% (w/w) for RBDPO-2, whereas for RBDPO-3, the viscosity increased from 3.7 ± 0.1% to 30.4 ± 0.1% (w/w) due to the presence of the moisture from the potato. The change in the contact angle of the RBDPO-1 (control) was significant (p < 0.05) between the 1st cycle and the 5th cycle from 19.16 ± 0.45° to 12.03 ± 0.45° respectively. Besides, there was a significant change (p < 0.05) of contact angle for RBDPO-2 between the 1st cycle and the 5th cycle from 32.53 ± 0.5° to 18.06 ± 0.15° respectively. The peroxide value of the fresh oil was 2.8 ± 0.2 meq/kg and the value after the 1st cycle for all RBDPO(s) treatment increased, indicating that primary oxidation had occurred after the 1st cycle of heating and frying. A decreasing trend was observed from the 2nd until the 5th frying cycle because the instability of peroxide at a high temperature, causes rapid degradation and produced a dimer and volatile compound. Frying also decreased the unsaturated value of the oil as indicated by a decrease in the iodine value. Based on Pearson’s correlation test, there was a positive correlation between the colour, density and viscosity of the oil. The higher the peroxide value, the higher the density of the oil. There was also a positive correlation between the contact angle, moisture content and peroxide value of the oil. Whereas, a negative correlation was found between the iodine values, colour, density and viscosity of the oil. In conclusion, the potato repetitive deep-frying darkened the colour of the oil, increased its density, viscosity, contact angle, and peroxide value and decreased the degree of unsaturation of the oil as it shows a prominent sign of oxidative rancidity.
Keywords
RBDPO
Repetitive frying
Deep-fat
Physicochemical properties
Oil spoilage

1 Introduction
Deep-frying is the most common and one of the oldest methods of food preparation worldwide. It involves heat and mass transfer. French fries, fish sticks (keropok lekor), fried chicken and banana fritters are popular snacks among Malaysians due to their crunchy texture and flavour. The refined, bleached and deodorized Malaysian Tenera variety of palm olein (RBDPO) is the most commonly used vegetable oil in the household and industry in Malaysia for deep-frying purposes. However, repeated heating and frying might lead to oil spoilage and its potential health hazards of oxidized products and lipid polymers formed in repeatedly used deep frying oil.
Based on the survey conducted in Kuala Lumpur, food handlers were reported to have the tendency to use oil repeatedly for frying to reduce cost and expenses (Azman et al., 2012). After being heated repeatedly, changes in the physical appearance of the oil will occur such as increased viscosity and darkening in colour as a result of alteration in the fatty acid composition of the oil. Heating causes the oil to undergo a series of chemical reactions like oxidation, hydrolysis and polymerization (Kalogianni et al., 2011). During this process, many oxidative products such as hydroperoxide and aldehydes are produced, which can be absorbed into the fried food. Heating and cooking may lead to degradation of the cooking oil.
All the chemical reactions lead to a lengthy list of primary until tertiary products and most of them are volatile and automatically eliminated into the air during frying. Whereas the non-volatile compounds, such as instant dimers of triacylglycerides, accumulate in the frying oil. This accumulation has an effect on the total oil/fat chemical changes (Dehghannejad et al., 2013). Determination of oil quality can be conducted using physical and chemical analyses. To date, the data regarding physical characteristic of repeatedly heated palm olein is scarce (Kalogianni et al., 2011). To suit the Western context, most of the studies conducted focused more on the usage of vegetable oil such as soybean oil (Dehghannejad et al., 2013; Goburdhun et al., 2000; Ng et al., 2007; Santos et al., 2005; Shimada et al., 2005; Zahir et al., 2017) and corn oil (Santos et al., 2005). Moreover, the previous data focused more on the effects of repeatedly heated oil and its health effects to the community (Kamsiah, 2013). Determination of total polar compound (TPC) is used as a standard method to determine degradation of oil in a few countries. However, the determination of TPC takes quite a long time upon completion and it is not suitable for daily routine. The use of chemical and solvent may contribute to the pollution of the surroundings (Innawong et al., 2004). Therefore, physical properties of oil can be used as indicators for chemical changes in oil (Stier, 2004).
This study focused on the effects of repeated frying on the physical properties of oil including colour, density, viscosity and moisture content. Next, the correlation between contact angle and physical properties of oil is determined as overall index of oil degradation. For verification, peroxide value (PV) and iodine value (IV) were measured. Oil samples were collected from every heating and frying batch which was done in the lab. Each method provides different information on the changes. Among them, peroxide value is the most frequently used as a quality parameter as it shows the degree of oxidation in the substances and measures the amount of the total peroxides as a primary oxidation product (Ng et al., 2007). Besides that, iodine value is also an indicator of oil quality. It measures the degree of unsaturation of fatty acids such as the mono-unsaturated fatty acid (MUFA) and poly-unsaturated fatty acids (PUFA). The degree of saturation and concentration of PUFA affects various chemical reactions in the oil/fat differently (Santos et al., 2005).
Despite the vast literature review on frying and the analytical methods used to analyse frying oil quality, a serious gap appears in the literature. To the best of our knowledge, no comparative study that involves correlating physical and chemical properties of recycled palm oil exists. This gap is not due to the lack of interest in the subject, but rather mainly due to experimental difficulties. For that reason, the objectives of this study are to evaluate the effect of repeated frying on physicochemical properties of all RBDPO(s) treatment and to determine the correlation between those physicochemical properties of oil against potential sign of oxidative rancidity.
2 Materials and methods
2.1 Materials
Refined, bleached, deodorized Malaysia tenera palm olein (RBDPO) (Buruh, Lam Soon Edible Oils (M) Sdn. Bhd.) was used in this study. Besides, Afdhal oil (produced by Agro-Science Resources (M) Sdn. Bhd.) was added to RBDPO-3 as an herbal additive (made from 100% natural ingredients that included locally grown Rutaceaea (citrus family) plants) that represented a positive control in the whole study. Russet potatoes were bought from the same source to represent every frying batch. A deep fat fryer (FABER, FDS-1035SS; Power: 2000 W, 220–240 V ∼ 50/60 Hz, Malaysia) with oil capacity of 3.5 L was used in the heating and frying experiment. This deep fat fryer was equipped with a thermostat to control the fryer’s temperature during the heating and frying experiment.
2.2 Repetitive deep-fat frying procedure
The size of the potato strips was standardized for every frying batch (1 cm × 1 cm × 8 cm) (Kalogianni et al., 2011). Two litres of RDBPO was heated to 180 ± 5 °C for 30 min in the deep fat fryer (Fan et al., 2012). Then, 300 g of potato was added into the oil and fried for 8 min. Based on the prior work, the amount of break time between two successive frying cycles was 7 min (Fan et al., 2012). Approximately, 100 ml of oil was collected for every cycle. The potato was fried up to 5 frying cycles (a complete cycle equivalent to 8 min of frying plus 7 min of break time). The amount of potato fried was reduced proportionally to the amount of oil remained after every cycle with the ratio of 3:20 potato (g)-to-oil (ml). No fresh oil was added between the frying cycles (Kamisah et al., 2012). The addition of fresh oil would reduce the formation of polar compound and free fatty acid (Choe and Min, 2007). Oil samples were collected from minute zero (fresh oil) and at the end of every successive cycle.
2.3 Design of experiment
The design of the experiment used was completely randomized block design (CRBD) as shown in Table 1. All batches of the potato bought was blocked throughout the experiment (n = 3). All samples were labelled as follows: (a) RBDPO-1 (control without potatoes), (b) RBDPO-2 (RBDPO with potatoes) and (c) RBDPO-3 (RBDPO with Afdhal oil (AO) and potatoes) *Independent Variables: Different batch of potatoes used (n = 3); (RBDPO-1) Control: Prolonged heating up to 105 min (without potato); (RBDPO-2) RBDPO + potatoes: Preheat of 30 min at 180 ± 5 °C; (RBDPO-3) RBDPO + AO + potatoes: Preheat with Afdhal oil (AO) for 30 min at 180 ± 5 °C. A total of 5 frying cycles were conducted for every batch and each cycle lasted for 15 min. Potato was added proportionally to the volume of the oil remained in the fryer.
Treatment (method)
Frying Cycle
*Batch of potatoes (Block)
Dependent variables
A
B
C
Colour profiles; viscosity; iodine value; peroxide value; moisture content; contact angle
RBDPO-1
5
A1
B1
C1
RBDPO-2
5
A2
B2
C2
RBDPO-3
5
A3
B3
C3
2.4 Physical properties analysis
2.4.1 Raw material moisture content
Oven method was used to determine the moisture content of the potato. The dried, cleaned potato was weighed in a crucible and the reading was recorded. Approximately, 5 g of potato was weighed in the crucible. The oven temperature was set to be 105 °C. Then, the crucible was placed in the oven for up to 2 days until constant weight was achieved. The crucible was removed from the oven and cooled in a desiccator for 30 min. The crucible was weighed and the weight loss (%) was calculated using the formula below:
m0 = wet weight (g) = (wet weight + weight of crucible) - (weight of crucible)
m1 = dry weight (g) = (dry weight + weight of crucible) - (weight of crucible)
2.4.2 Colour
A 60-ml recycled oil was heated in the microwave oven up to 60 °C. The oil sample was transferred to a 5.25-inch glass cell. The colour of the oil was measured using Lovibond® Tintometer Colourimeter Model F (USA) (Razali and Badri, 2003).
2.4.3 Density
The density of the recycled oil was measured using gravimetric analysis (analytical scale: METTLER TOLEDO©; Malaysia) of mass per volume and was expressed in gram per millilitre (g/ml). This analysis was conducted in triplicates (n = 3). All data are expressed as the mean ± standard deviation.
2.4.4 Viscosity
The oil sample was preheated up to 40 °C before the reading was taken. The heating of the oil sample was necessary to melt any crystal or solid formed during the storage. The viscosity of the oil was measured using Brookfield Viscometer DV-II+ (USA) with RV spindle No. 5 under shear rate of 100 s−1 (Rossi et al., 2009). This analysis was conducted in triplicates (n = 3). All data are expressed as the mean ± standard deviation.
2.4.5 Moisture content of oil
The moisture content of oil (%) was measured using Pocket Refractometer (ATA0090, ATAGO, Tokyo). The oil sample was dropped on the surface of the prism and the reading of its moisture content was automatically calculated. This analysis was conducted in triplicates (n = 3). All data are expressed as the mean ± standard deviation.
2.4.6 Contact angle
Static contact angle was used to measure the contact angle of the oil on the borosilicate microscope slide using Automated Contact Angle Goniometer Model 100 (Ramé-Hart Instruments; USA). The glass slide (soda lime, 76 mm × 26 mm × 1 mm) was obtained from Quasi-S Technology (M) Sdn. Bhd. The soda lime glass slide was made of Na2O, Al2O2, MgO and CaO and this resulted in its hydrophilic properties. The oil sample was preheated up to 80 °C for 45 min in a bath tub to melt any solid or crystal formed (Rossi et al., 2009). The oil sample was then left to cool until it reached 40 °C before it was analysed. The soda lime glass slide was cleaned with ethanol and 20 µl of oil was dropped on its surface using a syringe. This analysis was conducted in triplicates (n = 3). All data are expressed as the mean ± standard deviation.
2.5 Chemical properties analysis
2.5.1 Peroxide value (PV)
Approximately, 5 g oil sample was weighed in a 250-ml conical flask. Next, approximately 30 ml solution of glacial acetic acid: chloroform with the ratio of 3:2 was added into the conical flask and shaken vigorously. Then, approximately 0.5 ml saturated potassium iodide was added and the conical flask was shaken for 1 min. After that, 30 ml of distilled water was added into the conical flask. The solution was titrated in 0.1 M sodium thiosulphate. The flask was shaken vigorously until the yellow colour of the solution was almost gone. A few drops of 1% starch solution were added and then the colour of the solution turned blue. The solution was titrated until the blue colour disappears. Titration of blank (without sample) was done twice using the same method. The PV was calculated using the formula below:
Vsample = Titration volume of sample (ml)
Vblank = Titration volume of blank (ml)
N = Normality of potassium thiosulphate
W = Weight of the sample (g)
The oil was dissolved in a chloroform–acetic acid mixture and subjected to an excess of iodide via a saturated solution of potassium iodide. The peroxides that were present oxidized the iodide and changed into iodine. The iodine was then titrated to a colorimetric endpoint using sodium thiosulfate with starch as an indicator. The amount of iodine produced was directly proportional to the peroxide value.
2.5.2 Iodine value (IV)
The determination of the iodine value was carried out according to the official method Cd 1–25, American Oil Chemistry Society (AOCS). Briefly, 0.2 g oil sample was weighed into a flask of 250 ml in size and then added with 15 ml of carbon tetrachloride (CCl4). Then, 25 ml of Wijs' solution was added into the conical flask and shaken vigorously. The conical flask then was kept in the dark for one hour. After one hour, 20 ml of potassium iodide (KI) and 150 ml of distilled water were added to the solution and shaken vigorously. Next, the solution was titrated with 0.1 M sodium thiosulphate (Na2S2O3) and shaken vigorously until the yellow colour of the iodine almost disappears. Then, 1 to 2 ml starch indicator was added into the flask and titrated again until the blue colour of the starch indicator disappeared. The iodine value was calculated using the following equation:
Vsample = Titration volume of sample (ml)
Vblank = Titration volume of blank (ml)
N = Normality sodium thiosulphate
W = Sample weight (g)
Titration of blank (without sample) was done twice using the same method (n = 2).
2.6 Statistical analysis
The data was analysed using IBM SPSS Statistics version 23. One-way ANOVA and Tukey’s Test were used to differentiate the mean difference between the variables. Confidence interval (CI) was set at 95% with p < 0.05. Linear correlation between two variables was carried out using Pearson’s correction analysis.
3 Result & discussion
3.1 Frying cycle temperature profiles
Fig. 1 shows the kinematic frying temperature profile along the 5 consecutive frying cycles. Fresh palm olein was heated up to a 180 ± 5 °C for 30 min. The frying cycle started after 30 min of heating up the oil. Each cycle took 15 min to complete (8 min cooking, 7 min break). The total number of frying cycles was 5. The total time the oil was exposed to heat was 105 min.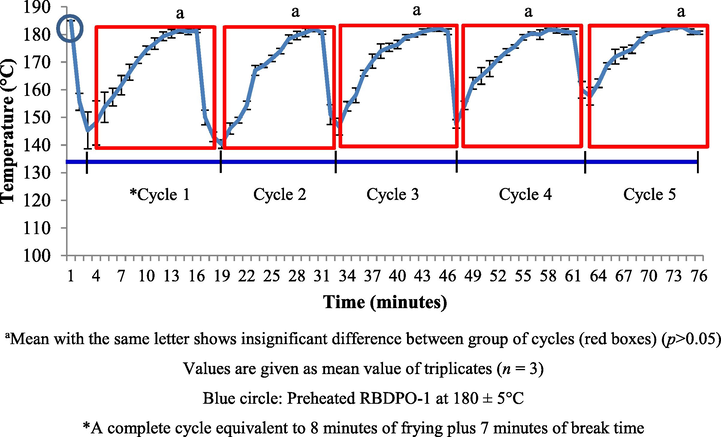
RBDPO-1 (control) kinematic frying temperature of different cycles.
At a high temperature, complex chemical changes took place in the oil during the heating and frying processes. For each frying cycle, food-to-oil ratio should be kept constant and generally, the proposed food to oil ratio was 1: 6 (Berger, 2005). The oil temperature decreased rapidly when raw food was introduced into the fryer. A decrease in oil temperature does not only depend on the amount of food placed in oil but it also depends on the amount of water or the food’s moisture content. The temperature of the oil were not supposed to drop too low because the time taken for the oil to recover to the original frying temperature will be longer. Thus, the fryer must be equipped with a thermostat to control the temperature of the oil during the frying cycle. Therefore, a preliminary study was carried out to determine the accuracy of the thermostat by measuring the temperature of the oil and plotting the temperature profile during the frying process.
When the raw potatoes were put in the fryer, the temperature of the oil decreased rapidly. The decreasing trend in the temperature of the oil occurred from the first minute until the third minute of every frying cycle. The temperature began to recover until the eighth minute. The potatoes were removed from the fryer after being fried for eight minutes. The oil was heated continuously until minute 15 so that it reached the original frying temperature (temperature recovery period). The same trend was shown in the 2nd cycle until the 5th cycle. Based on ANOVA, the temperature of the oil was not affected by the number of frying cycles. The moisture content (%) for every batch of the potato samples was measured and the results are shown in Table 2. There was insignificant difference discovered between the moisture contents of all potato samples (p > 0.05). Hence, the fluctuations in the oil temperature, moisture potatoes contents and the potatoes-to-oil ratio were constant throughout the study.
3.2 Colour profiles
Fig. 2 shows the red colour (Lovibond unit) profiles of the RBDPO-1, RBDPO-2 and RBDPO-3. The red colour scale increased with the increase in the number of frying cycles. The red colour of the RBDPO-1 increased significantly (p < 0.05) from 3.6 Lovibond unit (fresh oil) to 5.6 Lovibond unit after 5 heating cycles. The changes in the colour of the oil were in line with the prior work where they found that the red colour of the rice bran oil and soybean oil increased from 2.0 to 3.0 Lovibond unit after 6 cycles of heating (Goburdhun et al., 2000; Debnath et al., 2012).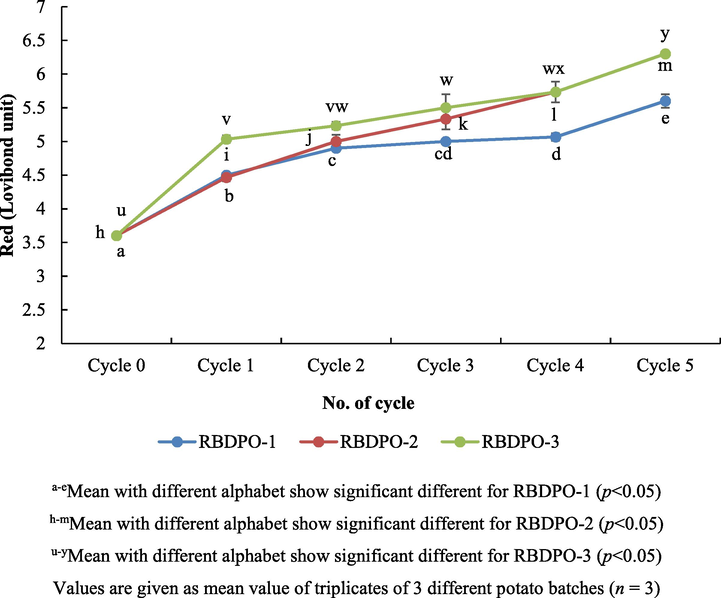
Colour profiles (Red, Lovibond unit) of oil during different frying cycles.
Moreover, the higher the number of frying cycles, the darker the oil would be (p < 0.05). The discolouration of the oil could be caused by unsaturated compounds formed in the oil, which was believed to be able to absorb the energy of the visible electromagnetic spectrum and also could be due to the increase in the oil polymer content (Tseng et al., 1996). In fact, the oil became darker due to the leaching of the pigments from the food to the oil and also the Maillard reaction which led to the formation of brown pigment called melanoidin (Vijayan et al., 1996).
The colour of RBDPO-3 on zero cycle was higher than the one of RBDPO-1 (p < 0.05). The mean difference between the colours of the RBDPO-1 and RBDPO-3 was significant as the cycles increases as compared to the control (p < 0.05). This might be caused by the presence of a natural antioxidant found in Rutaceae extracts, a type of herb used in Afdhal oil. Likewise, the effects of the addition of curry leaf extract to palm olein were darker than the control (without curry leaf extract) due to the fact that curry leaves contain a natural pigment of chlorophyll and carotenoids (Mohd Nor et al., 2009). However, the physicochemical properties of vegetable oil used to fry potatoes might darken the colour of the oil gradually along the frying process (Sulieman et al., 2006). It was caused by the movement of the golden brown pigment from the potatoes to the olive oil. A combination of oxidation and polymerization of the unsaturated fatty acids in the oil was also a major source of the oil colour changes. Discoloration in palm olein oil during frying is relatively faster than other vegetable oils. However, study has shown too that even a darker palm olein does not affect the colour of fried products significantly (Razali et al., 1999). Hence, the changes in the colours of oil are considered useful as this could prevent any continuous use of the oil that has been degraded.
3.3 Frying oil density
Fig. 3 shows an increasing trend for the density of the RBDPO-1, RBDPO-2 and RBDPO-3. For the controls, the density between the zero and 1st cycle was considered significant (p < 0.05) and became constant up to the 5th cycle. Likewise, for RBDPO-1 and RBDPO-3, there were insignificant differences between the zero cycle and the 1st one as it was shown that the palm olein with the added Afdhal oil did not give any changes to its density as compared to the one without additive. Moreover, it was found that there was insignificant difference between each types of oil right from the 1st cycle up the 5th (p > 0.05). Prior work on the palm versus olive oil revealed that the density of the palm olein was more than those in the olive oil and there was a significant change after 20 frying cycles. These changes (e.g. density) were some of the indications that the formation of the polymer was higher in the palm oil compared to the one of the olive oil (Kalogianni et al., 2011). For that reason, the findings were consistently predictable as the changes will occur depending on the temperature, frying cycles and type of samples used.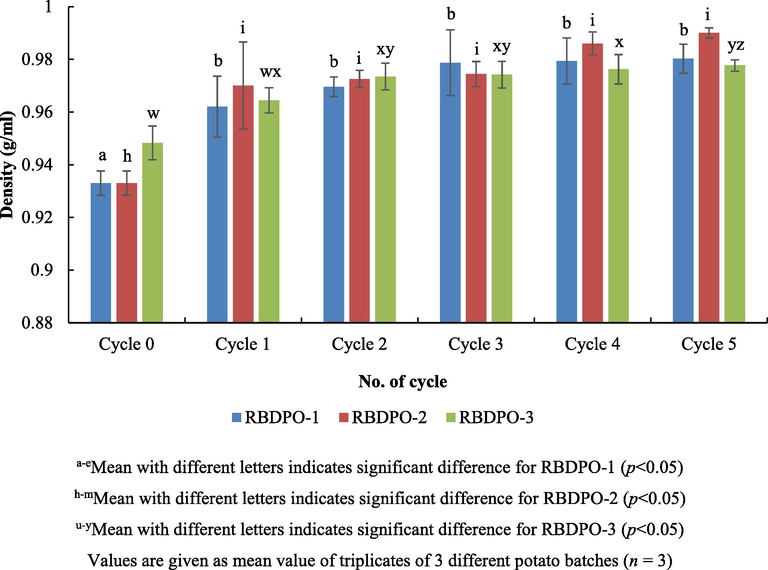
Frying oil density during different frying cycles.
3.4 Viscosity
Oil viscosity increases with increasing degree of polymerization and length fatty acids (Lioumbas et al., 2012). The viscosity of the oil also reduces the rate of the heat transferred and results in longer time to fry food and improve the absorption of the oil into products. In fact, the viscosity of the oil measured at 40 °C increased with the increasing number of the frying cycles due to the formation of polymer and this was one of the indicators of oil degradation (Kalogianni et al., 2011).
Fig. 4 shows the shear thickening viscosity trend of the RBDPO-1, RBDPO-2 and RBDPO-3 measured at 40 °C. There was a significant increase in the viscosity of the RBDPO-1 and RBDPO-2 (p < 0.05). The RBDPO-2 had higher viscosity as compared to the RBDPO-1 (p < 0.05). Whereas, there was an insignificant difference for RBDPO-3. For the control, there was a significant difference in the mean of its viscosity (p < 0.05). From the zero cycle to the 3rd cycle, there was an insignificant increase in their viscosity but the difference was significant (p < 0.05) after the 4th cycle of heating. Whereas, for RBDPO-2, there was insignificant difference between the zero cycle and the 1st cycle, but there were significant differences (p < 0.05) between the zero cycle and the 2nd cycle.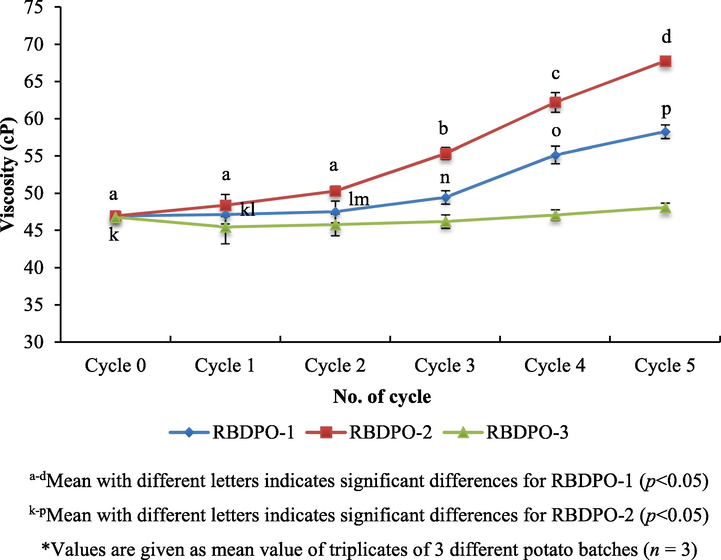
Viscosity of oil (dilatant/shear thickening) profiles during different frying cycles.
Moreover, oil becomes more viscous after being heated for several times (Lawson, 2013). Among the factors that can lead to an increase in viscosity are exposure to prolonged heating at a high temperature (number of cycles increases) and exposure to the air while heating the oil (Saguy and Dana, 2003). Therefore, there was a significant increase in the viscosity of the oil between different oil treatments (between RBDPO-2 and RBDPO-1, and between RBDPO-2 and RBDPO-3). This analysis showed that after 5 frying cycles, the viscosity of the oil was higher than after 5 heating cycles (without potatoes) with 67.7 ± 0.6 cP and 58.2 ± 0.9 cP respectively. The oil’s viscosity after 5 frying cycles with the additive, Afdhal oil was lower than the oil without any additive as the oil without additive degraded easily.
3.5 Moisture content of oil
Frying process involves mass transfer including water loss, oil absorption and heat transfer (Vitrac et al., 2002). The water content in food and oil accelerates the hydrolysis of the oil and also provides a protection against oxidation of the oil during frying (Dana et al., 2003). Based on Fig. 5, the moisture content of the RBDPO-1 was significant different (p < 0.05) between the zero cycle and the 3rd, 4th and 5th cycle. Thus, the longer the frying cycle, the longer the oil is exposed to humidity of the surrounding. A significant increased (p < 0.05) was also reported between the zero cycle and the 1st cycle for both types of the oil, RBDPO-2 and RBDPO-3. The increase in the moisture content of the oil might be caused by the exposure of the oil to food moisture and air humidity from the surrounding which could facilitates the rancidity and oxidative stress to the oil (Choe and Min, 2007).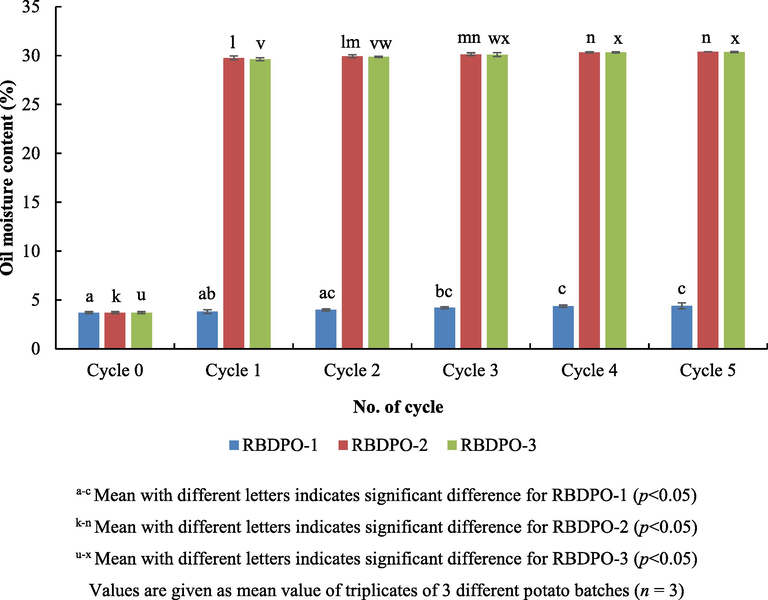
Moisture content of oil during different frying cycles.
3.6 Contact angle
Theoretically, the more the frying cycles, the more viscous the fluid is and thus, the lower the wettability of the liquid on a solid surface. In other words, the lower the wettability, the higher the contact angle of the oil on a solid surface. Based on Fig. 6, the contact angle of the oil decreased significantly (p < 0.05) between the 1st cycle and the 5th cycle for all types of the oil treatment. For RBDPO-1, a significant reduction in the contact angle (p < 0.05) was reported between the 1st cycle and the 5th cycle from 19.16 ± 0.45° to 12.03 ± 0.45°. The contact angle decreased significantly (p < 0.05) and it was also reported between the 1st cycle and the 5th cycle of RBDPO-2, from 32.53 ± 0.5° to 18.06 ± 0.15°. For RBDPO-3, the contact angle of the 1st and the 2nd cycle had insignificant difference as compared to RBDPO-2 that indicated the oil with Afdhal oil as an additive was more resistant than the oil without any additive.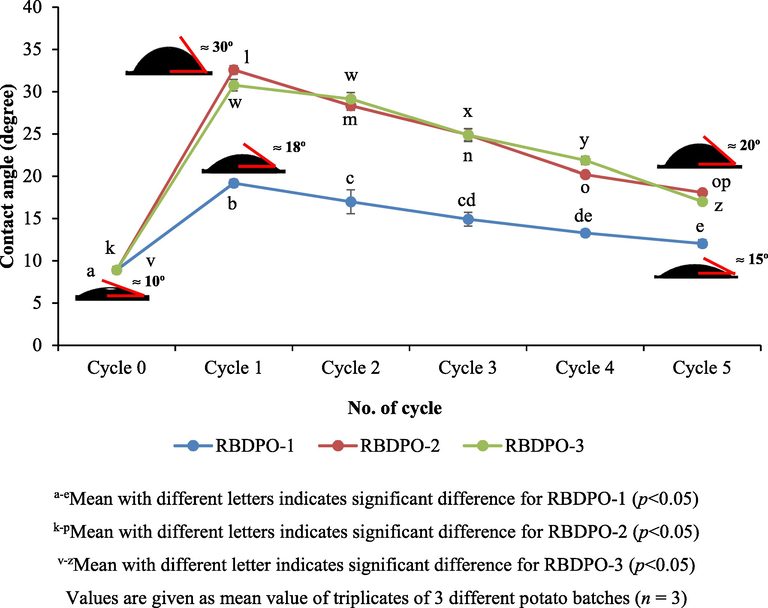
Kinetic dependence of oil contact angle (oleophilicity) on borosilicate glass surface during different frying cycles.
However, the results from this recent study were contradictory with the theory as the higher the number of frying cycles, the lower the contact angle of the oil. The main reason was probably the contact angle decreased as the moisture contained in the oil in the 5th cycle was higher (p < 0.05) compared to the one in the 1st cycle. The contact angle was relatively stable as shown by the RBDPO-1, RBDPO-2 and RBDPO-3 because there was insignificant reduction in the contact angle between the 1st cycle and the 2nd cycle, between the 1st cycle and the 3rd cycle, and between the 1st cycle and the 4th cycle respectively. Hence, for longer frying time, some products of oxidation and hydrolysis are formed, causing a decrease in surface tension between oil and food, and at the same time reducing the contact angle (Rossi et al., 2009). Therefore, after the 5th frying cycle, there was a significant reduction in the contact angle for all RBDPO(s) treatment.
3.7 Peroxide value (PV)
Peroxide value indicates the primary oxidation. Theoretically, peroxide value is influenced by the storage period, frying temperature, and the reaction between air and oil samples (Mobin Siddique et al., 2010). Whereas, frying time does not affect peroxide value (Atinafu and Bedemo, 2011). One important parameter that affects the oxidation of oil is the degree of unsaturation of fatty acid. When double bonds of unsaturated fat oxidized, the primary oxidation products formed are peroxide. High peroxide values are indicators of the degree of oxidation. The higher the peroxide values, the more oxidized the oil is. Based on the amendments made to the Malaysian Food Act 1983 of Food (Amendment) (No. 3) Regulations 2014, the maximum peroxide value of cooking oil is 10 meq O2/kg of oil (Food Act, 1983). The prior work discovered that the peroxide value of fresh rice bran oil was 1.63 meq O2/kg and after six cycles of heating and frying, the peroxide value increased from 2.2 to 3.6 meq O2/kg oil (Debnath et al., 2012).
Based on Fig. 7, after 5 cycles of frying, the peroxide value decreased significantly (p < 0.05) for all RBDPO(s) treatment. The fresh oil (cycle 0) peroxide value was 2.8 ± 0.2 meq/kg and the peroxide value increased sharply which to indicate the occurrence of the primary oxidation after one cycle of heating and frying. Next, the peroxide value of all RBDPO(s) treatment decreased gradually after two cycles of heating and frying till the 5th cycle. Some of the previous studies reported that there was a decrease in the peroxide value during frying (Vieira and Regitano-d'Arce, 1999; White, 1991; Zhang et al., 2007). The peroxide value was also influenced by the constituent fatty acids and the storage period of the oil (Lawson, 2013). The peroxide value increased after the sample was taken from the deep fat fryer. The peroxide value did not represent the changes that occurred in the oil, but only storage condition led to an increase in the peroxide value in the study on the effects of heating at 180 °C for the peroxide value of the oil (Marinova et al., 2012). The use of oil for frying does not lead to a significant increase in peroxide because peroxide easily degrades at the temperature over 150 °C (Marmesat et al., 2008). There was a correlation between the peroxide values of the palm oil and the frying temperature (Chen et al., 2014). The highest peroxide value was at 150 °C, and this was followed by a significant decline in the peroxide value at 200 °C and it next slightly increased at 250 °C. The primary oxidation product is hydroperoxide or is commonly referred to as peroxide (Allendorf, 2010). Peroxide is unstable at a high frying temperature, it rapidly degrades and produces a dimer and volatile compound (Marmesat et al., 2008). Peroxide decomposition rate is higher than the rate of peroxide formation. In addition, water content or humidity plays an important role in oil degradation process. Spraying water into the oil during frying increases the acid value of the oil significantly (Fujisaki et al., 2001). In addition, water also serves as a physical barrier for oxidation to occur as water that vaporizes (steam blanketing) on the surface of the oil, will prevent the coalition between oxygen and the oil (Dana et al., 2003). Water also plays a role in helping volatilization (steaming out) of volatile oxidation products (Dana et al., 2003).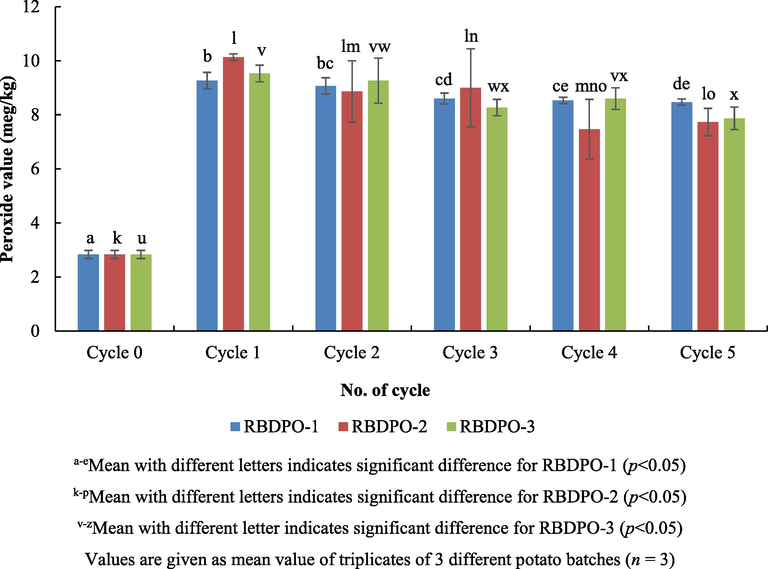
Peroxide values of oil during different frying cycles.
3.8 Iodine value (IV)
Iodine value (IV) was a direct determination of unsaturation level of the oil. Iodine was used to halogenate the double bonds in the unsaturated fatty acids. The iodine value of the fresh RBDPO used in this study was 62 and it was indeed beyond the standard recommendation from the Malaysian Food Act 1983, Regulations 2014 (Food Act, 1983) which must be over a value of 56. Fig. 8 shows the iodine values of oil during different heating and frying cycles. There was a significant consistent decreased in the iodine value (p < 0.05) for all RBDPO(s) treatment as the cycles increases. Commonly, frying leads to a reduction in unsaturation thus indicating the decrease in double bonds. A decrease in the IV throughout the cycles is consistent with the decrease in double bonds as oil becoming oxidized. However, the addition of additive (Afdhal oil) did not appear to reduce the oxidation as cycle’s progress. Hence, the reduction in the iodine value of the oil for up to 5th frying cycles was a result of complex physicochemical changes in the oil that leads to instable characteristic against susceptible oxidative rancidity (Lawson, 2013).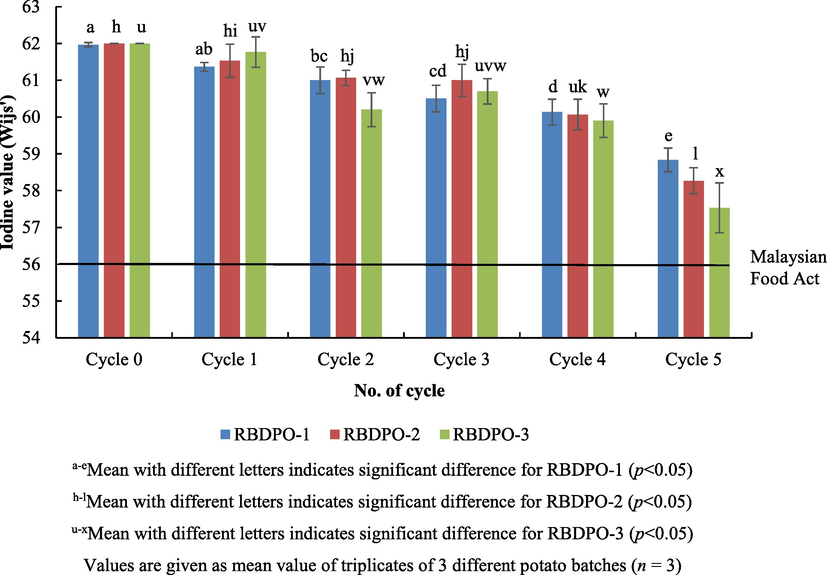
Iodine values of oil during different frying cycles.
3.9 Correlation between variables (physicochemical properties)
To provide a general statistical overview of the dataset, the Pearson’s correlation coefficient (r) was calculated between variables of RBDPO(s) treatment is shown in Fig. 9. The intensity of the color is proportional to the correlation coefficient so the stronger the correlation (i.e., the closer to −1 or +1), the darker the boxes. The probability values (p-values) were also calculated and the data points with p-values larger than 0.05 are marked with a strikethrough, indicating a lack of statistical confidence. From the r values, one can see how the variables are linearly correlated; they can be between +1 and −1 where a positive (negative) number indicates that variable A increases as variable B increases (decreases). Thus, there was a positive correlation between the colour and density and also viscosity. The higher the value of the red colour (Lovibond units), the more viscous the oil attained. The higher the peroxide value, the higher the density of the oil. A positive correlation could also be seen between the moisture and the contact angle. Besides, the contact angle also had a positive correlation with the peroxide value. However, there was a negative correlation between the iodine value and the colour, density and viscosity of the oil and this showed that the frying had darkened the colour of the oil, making it denser and more viscous, as well as increased its peroxide value and increased the contact angle. On the contrary, the repetitive frying reduced the degree of the unsaturation of the oil and this made the oil more prone to oxidative rancidity.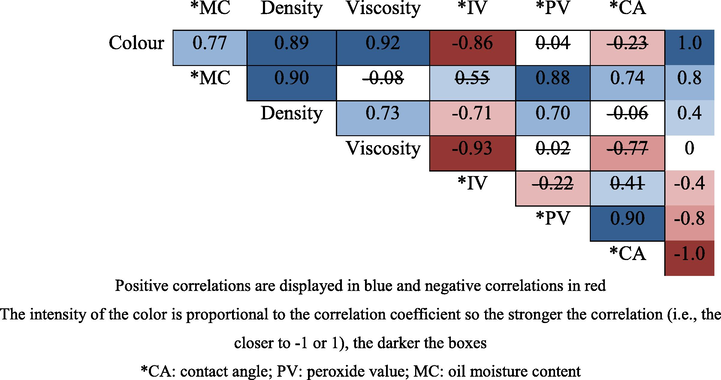
Pearson’s correlation coefficient (r) between all variables. Values marked with a strikethrough indicates that this p-value is not valid (>0.05).
Moreover, the high value of the correlation obtained between the peroxide value and the contact angle was similar to the results from a previous study. It has reported that the contact angle modification of the liquid oils proved to be a sound index of the overall oil degradation in the actual frying experiments, and this was significantly correlated with the common indices of hydrolytic, oxidative, and thermal phenomena. For the semi-fluid oils and hard fats, the effectiveness of the contact angle was, however, limited by the need to carry out the measurement at a temperature above the oil melting point, without perturbing the system (Rossi et al., 2009).
4 Conclusion
This work provides experimental evidence that the physicochemical analysis is able to detect any chemical changes or spoilage of recycled palm oil. However, the peroxide value (PV) profile was considered inadequate as the RBDPO spoilage indicators. The decreasing trend of the peroxide value obtained was contradictory to its theory. This might have occurred due to the rapid secondary oxidation of the cooking oil after frying and being kept in the storage. However, the contact angles seem equitably stable and consistent as the cycle’s progresses, notwithstanding the degradation of the oils highlighted by the chemical and physical indices. Although the RBDPO was kept as fluid at 40 °C, until the moment the deposition and droplet image were immediately captured, early triacylglycerol crystallization occurred, possibly altering the droplet’s outline and this could not be excluded. Besides, the oil has a slip point of 38 °C which in fact a realistic explanation could be a non-equilibrium condition due to the cooling of the oil droplet during measurement. However, other parameters such as moisture content, colour measurement, density, viscosity and iodine value are considered the most suitable indicators for recycled palm oil spoilage assessment. On the contrary, the contact angle showed a positive correlation with the moisture content and the peroxide value. It can then be concluded that contact angle, moisture content and iodine value might somehow illustrate the best choice on determining physicochemical changes with respect to oxidative rancidity in cooking oil on the repetitive deep-fat frying within the first 5 cycles of a norm Malaysian RBDPO usage.
Acknowledgment
The authors would like to thank the Universiti Kebangsaan Malaysia (UKM) for providing financial support to this project (GUP-2018-057).
Data availability declaration
No data were used elsewhere to support this study and it was entirely a new set of data.
Declaration of Competing Interest
The authors declare that they have no known competing financial interests or personal relationships that could have appeared to influence the work reported in this paper.
References
- Food Act 1983. Food (Amendment) (No. 3) Regulations 2014. Malaysia Federal Government Gazette. http://www.federalgazette.agc.gov.my/index.php.
- Allendorf, M.E., 2010. Application of a Handheld Portable Infrared Sensor to Monitor Oil Quality. Tesis The Ohio State University.
- Estimation of total free fatty acid and cholesterol content in some commercial edible oils in Ethiopia, Bahir DAR. J. Cereals Oil seeds. 2011;2(5):71-76.
- [Google Scholar]
- Level of knowledge, attitude and practice of night market food outlet operators in Kuala Lumpur regarding the usage of repeatedly heated cooking oil. Med. J. Malaysia. 2012;67(1):91-101.
- [Google Scholar]
- The Use of Palm Oil in Frying. Malaysian Palm Oil Promotion Council; 2005.
- The analysis of trans fatty acid profiles in deep frying palm oil and chicken fillets with an improved gas chromatography method. Food Control. 2014;44:191-197.
- [Google Scholar]
- The protective role of water injection on oil quality in deep fat frying conditions. Eur. Food Res. Technol.. 2003;217(2):104-109.
- [Google Scholar]
- Effect of frying cycles on physical, chemical and heat transfer quality of rice bran oil during deep-fat frying of poori: An Indian traditional fried food. Food Bioprod. Process.. 2012;90(2):249-256.
- [Google Scholar]
- The Effect of Deep Heating on Rheological Behavior of Edible Vegetable Oils. Curr. Trends Technol. Sci.. 2013;2(5):323-326.
- [Google Scholar]
- Frying stability of rice bran oil and palm olein. Int. Food Res. J.. 2012;20(1):403-407.
- [Google Scholar]
- Deterioration of high-oleic safflower oil heated in low oxygen atmospheres with water-spray. J. Oleo Sci.. 2001;50(2):97-101.
- [Google Scholar]
- Effect of deep-fat frying of potato chips and chicken on the quality of soybean oil. J. Consum. Stud Home Econ.. 2000;24(4):223-233.
- [Google Scholar]
- The determination of frying oil quality using a chemosensory system. LWT-Food Science and Technology. 2004;37(1):35-41.
- [Google Scholar]
- Effect of repeated frying on the viscosity, density and dynamic interfacial tension of palm and olive oil. J. Food Eng.. 2011;105(1):169-179.
- [Google Scholar]
- Deep-fried keropok lekors increase oxidative instability in cooking oils. Malaysian J. Med. Sci. MJMS. 2012;19(4):57-62.
- [Google Scholar]
- Minyak Masak Terpakai Ancaman Kepada kesihatan. Bangi: Penerbit Universiti Kebangsaan Malaysia; 2013.
- Food Oils and Fats: Technology, Utilization and Nutrition. Springer Science & Business Media; 2013.
- Effect of potato deep-fat frying conditions on temperature dependence of olive oil and palm oil viscosity. J. Food Eng.. 2012;113(2):217-225.
- [Google Scholar]
- Oxidative changes in some vegetable oils during heating at frying temperature. Bul. Chem. Commun.. 2012;44(1):57-63.
- [Google Scholar]
- Quantitative determination of epoxy acids, keto acids and hydroxy acids formed in fats and oils at frying temperatures. J. Chromatogr. A. 2008;1211(1):129-134.
- [Google Scholar]
- Physicochemical properties of blends of palm olein with other vegetable oils. Grasas Aceites. 2010;61(4):423-429.
- [Google Scholar]
- Antioxidative properties of Murraya koenigii leaf extracts in accelerated oxidation and deep-frying studies. Int. J. Food Sci. Nutr.. 2009;60(sup2):1-11.
- [Google Scholar]
- Method for determining frying oil degradation by near-infrared spectroscopy. J. Agric. Food. Chem.. 2007;55(3):593-597.
- [Google Scholar]
- Oil absorption, polymer and polar components formation during deep-fat frying of French fries in vegetable oils. Palm Oil Devel.. 2003;38:11-15.
- [Google Scholar]
- Quality of potato chips fried in palm olein and high oleic sunflower oil during batch frying. In: Proceedings of the PORIM International Palm Oil Congress, Kuala Lumpur. 1999. p. :99-103.
- [Google Scholar]
- Suitability of contact angle measurement as an index of overall oil degradation and oil uptake during frying. Food Chem.. 2009;112(2):448-453.
- [Google Scholar]
- Suitability of contact angle measurement as an index of overall oil degradation and oil uptake during frying. J. Food Chem.. 2009;112:448-453.
- [Google Scholar]
- Integrated approach to deep fat frying: engineering, nutrition, health and consumer aspects. J. Food Eng.. 2003;56(2):143-152.
- [Google Scholar]
- Effect of heating and cooling on rheological parameters of edible vegetable oils. J. Food Eng.. 2005;67(4):401-405.
- [Google Scholar]
- Effects of contact-dehydrating sheets on preference for fried food and deterioration of frying oil. J. Sci. Food Agric.. 2005;85(2):305-309.
- [Google Scholar]
- Tests to monitor quality of deep-frying fats and oils. Eur. J. Lipid Sci. Technol.. 2004;106(11):766-771.
- [Google Scholar]
- Antiradical performance and physicochemical characteristics of vegetable oils upon frying of French fries: a preliminary comparative study. J. Food Lipids. 2006;13(3):259-276.
- [Google Scholar]
- Total frying-use time effects on soybean-oil deterioration and on tortilla chip quality. Int. J. Food Sci. Technol.. 1996;31(3):287-294.
- [Google Scholar]
- Ultraviolet spectrophotometric evaluation of corn oil oxidative stability during microwave heating and oven test. J. Agric. Food. Chem.. 1999;47(6):2203-2206.
- [Google Scholar]
- Optical properties of corn oil during frying. Int. J. Food Sci. Technol.. 1996;31(4):353-358.
- [Google Scholar]
- Characterization of heat and mass transfer during deep-fat frying and its effect on cassava chip quality. J. Food Eng.. 2002;53(2):161-176.
- [Google Scholar]
- Methods for measuring changes in deep-fat frying oils. Food Technol. (Chicago). 1991;45(2):75-80.
- [Google Scholar]
- Study of physicochemical properties of edible oil and evaluation of frying oil quality by Fourier Transform-Infrared (FT-IR) Spectroscopy. Arabian J. Chem.. 2017;10(Supplement 2):S3870-S3876.
- [Google Scholar]
- Addition of antioxidant from bamboo leaves as an effective way to reduce the formation of acrylamide in fried chicken wings. Food Addit. Contam.. 2007;24(3):242-251.
- [Google Scholar]


